U.S. DECENNIAL LIFE TABLES FOR 1959-61; VOL. 1, NO. 5 ...
U.S. DECENNIAL LIFE TABLES FOR 1959-61; VOL. 1, NO. 5 ...
U.S. DECENNIAL LIFE TABLES FOR 1959-61; VOL. 1, NO. 5 ...
You also want an ePaper? Increase the reach of your titles
YUMPU automatically turns print PDFs into web optimized ePapers that Google loves.
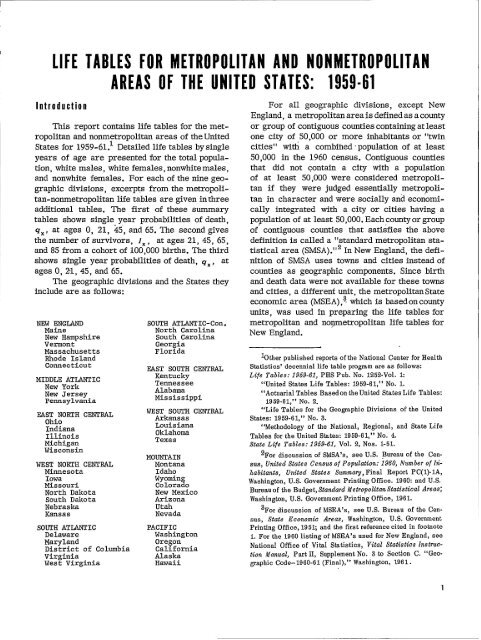
<strong>LIFE</strong> <strong>TABLES</strong><strong>FOR</strong>METROPOLITAN AND<strong>NO</strong>NMETROPOIITAN<br />
AREASOFTHE UNITEDSTATES: <strong>1959</strong>-81<br />
Introduction<br />
This reportcontainslifetablesforthemetropolitanandnonmetropolitan<br />
areasoftheUnited<br />
Statesfor<strong>1959</strong>-<strong>61</strong>.1Detailedlifetablesbysingle<br />
years of age are presentedforthetotalpopulation,whitemales,whitefemales,nonwhitemales,<br />
and nonwhitefemales.For eachoftheninegeographicdivisions,excerptsfromthemetropolitan-nonmetropolitan<br />
lifetablesaregiveninthree<br />
additionaltables.The firstof thesesummary<br />
tablesshows singleyear probabilities ofdeath,<br />
qx, at ages O, 21, 45,and 65.The secondgives<br />
thenumber ofsurvivors,IX, atages21,45, 65,<br />
and 85 from a cohortof100,000births.The third<br />
shows singleyearprobabilities ofdeath,q~, at<br />
agesO,2s1,45,and 65.<br />
The geographicdivisionsandtheStatesthey<br />
includeareas follows:<br />
N~ ENG-<br />
Maine<br />
New Hampshire<br />
Vermont<br />
Massachusetts<br />
RhodeIsland<br />
Connecticut<br />
MI~~Y~ATANTIC<br />
New Jersey<br />
Pennsylvania<br />
EAST<strong>NO</strong>RTHCENTRAL<br />
Ohio<br />
Indiana<br />
Illinois<br />
Michigan<br />
Wisconsin<br />
WEST <strong>NO</strong>RTHCENTRAL<br />
Minnesota<br />
Iowa<br />
Missouri<br />
NorthDakota<br />
SouthDakota<br />
Nebraska<br />
Kansas<br />
SOUTHATLANTIC<br />
Delaware<br />
Maryland<br />
Districtof Columbia<br />
Virginia<br />
West Virginia<br />
SOUTH ATLANTIC-Con.<br />
NorthCarolina<br />
SouthCarolina<br />
Georgia<br />
Florida<br />
F.ASTSOUTHCENTRAL<br />
Kentucky<br />
Tennessee<br />
Alabama<br />
Mississippi<br />
WEST SOT.iTH CENTRAL<br />
Arkansas<br />
Louisiana<br />
Oklahoma<br />
Texas<br />
MOUNTAIN<br />
Montana<br />
Idaho<br />
Wyoming<br />
Colorado<br />
New Mexico<br />
Arizona<br />
Utah<br />
Nevada<br />
PACIFIC<br />
Washington<br />
Oregon<br />
California<br />
Alaska<br />
Hawaii<br />
For allgeographicdivisions,exceptNew<br />
England,a metropolitan areaisdefinedasacounty<br />
or groupofcontiguouscountiescontainingatleast<br />
one cityof 50,000or more inhabitants or “twin<br />
cities”wi~ a combined-population of at least<br />
50,000in the 1960 census.Contiguouscounties<br />
that did not containa citywith a population<br />
of at least50,000were consideredmetropolitan<br />
if they were judgedessentially metropolitan<br />
in characterandwere sociallyandeconomicallyintegratedwith<br />
a cityor citieshavinga<br />
population ofatleast50,000.Eachcountyorgroup<br />
of contiguouscountiesthatsatisfiesthe above<br />
definition iscalleda“standardm etropolitanstatistical<br />
area(SMSA).”2InNew England,thedefinitionof<br />
SMSA uses towns and citiesinsteadof<br />
countiesas geographiccomponents.Sincebirth<br />
anddeathdatawere notavailableforthesetowns<br />
andcities,a different unit,themetropolitan State<br />
economicarea(MSEA),3whichisbasedoncounty<br />
units,was used in preparingthelifetablesfor<br />
metropolitanand no~metropolitanlifetablesfor<br />
New England.<br />
btherpublished reports oftheNational CenterforHealth<br />
Statistics’ decennial life table progmm are as follows:<br />
Life Tables: <strong>1959</strong>-<strong>61</strong>, PHS Pub. No. 1252-VO1. k<br />
“United States Life Tables: <strong>1959</strong> -<strong>61</strong>,” No. 1.<br />
“Actuarial Tables Based on the United States Life Tables:<br />
<strong>1959</strong> -<strong>61</strong>,” No. 2.<br />
“Life Tables for the Geographic Divisions of the United<br />
States: <strong>1959</strong> -<strong>61</strong>,” No. 3.<br />
“Methodology of the National, Regional, and Stak Life<br />
Tables for the United States: <strong>1959</strong> -<strong>61</strong>,” No. 4.<br />
State Life Tables: <strong>1959</strong>-<strong>61</strong>, Vol. 2, Nos. 1-51.<br />
2For discussion of SMSA’S, see U.S. Bureau of the Census,<br />
United States Census of Population: 1960, Number of lnfiabitazts,<br />
United States Svmma~, Final Report PC(l)- 1A,<br />
Washington, U.S. Government Printing Office. 1960: and U.S.<br />
Bureau of the Budget, Standard Metropolitan Statistical Areas;<br />
Washingbn, U.S. Government Printing Office, 19<strong>61</strong>.<br />
3For discussion of MSEA’S, see U.S. Bureau of the Census,<br />
State Economic A?eas, Washingbn, U.S. Government<br />
Printing Office, 195~ and the first reference cited in footnote<br />
1. For the 1960 listing of MSEA’S used for New England, see<br />
National Office of Vital Statistics, Vital Statistics Instruction<br />
Manual, Part II, Supplement No. 3 to Section C. “Geographic<br />
Code- 1960-<strong>61</strong> (Final), ” Washington, 19<strong>61</strong>.<br />
1


