Fact Sheet for the month of July-08 - HDFC Mutual Fund
Fact Sheet for the month of July-08 - HDFC Mutual Fund
Fact Sheet for the month of July-08 - HDFC Mutual Fund

You also want an ePaper? Increase the reach of your titles
YUMPU automatically turns print PDFs into web optimized ePapers that Google loves.
hdfc-cov.qxd 8/8/20<strong>08</strong> 4:57 PM Page 1<br />
Vol. No. 6 Issue No. 1<br />
<strong>July</strong> 20<strong>08</strong><br />
Average assets under management <strong>for</strong> <strong>July</strong> 20<strong>08</strong>: Rs. 50,752.03 Crore<br />
Don’t worry, be happy
hdfc-mkt1.qxd 8/8/20<strong>08</strong> 3:35 PM Page 1<br />
Market Review<br />
Equity market update<br />
The equity market recovered in <strong>July</strong> with <strong>the</strong> Sensex and<br />
Nifty rising 7% each to close at 14,355 and 4,332 respectively<br />
after recording a yearly low during <strong>the</strong> <strong>month</strong>. The<br />
news flow was hectic on both <strong>the</strong> domestic and international<br />
front. Internationally, commodity prices, particularly that <strong>of</strong> oil,<br />
and <strong>the</strong> unwinding <strong>of</strong> <strong>the</strong> housing crisis took center stage.<br />
Domestically, <strong>the</strong> political drama surrounding <strong>the</strong> trust vote, economic<br />
data related to growth and inflation, <strong>the</strong> RBI Monetary<br />
Policy and <strong>the</strong> ongoing results season provided a constant stream<br />
<strong>of</strong> news flow. FIIs remained bearish and were net sellers <strong>of</strong><br />
$455m while domestic mutual funds were net buyers with inflows<br />
<strong>of</strong> $285m in <strong>July</strong>.<br />
After two days <strong>of</strong> debate and much speculation, <strong>the</strong> UPA led<br />
government survived <strong>the</strong> trust vote by a narrow margin. The equity<br />
markets reacted very positively as <strong>the</strong> veil <strong>of</strong> political uncertainty<br />
was removed and hope surfaced that a more stable central<br />
government would be able to carry on <strong>the</strong> re<strong>for</strong>m process with<br />
greater effectiveness. However, it should be kept in mind that<br />
while <strong>the</strong> government does have increased flexibility after winning<br />
<strong>the</strong> vote, it has limited time left in <strong>of</strong>fice, which curbs its<br />
ability to enact major re<strong>for</strong>ms.<br />
Some <strong>of</strong> <strong>the</strong> positive mood post <strong>the</strong> trust vote was negated by<br />
<strong>the</strong> RBI policy that raised <strong>the</strong> repo rate by 50 basis points<br />
and CRR by 25 basis points in response to rising inflation, which<br />
is now hovering a shade below 12%. Going <strong>for</strong>ward, <strong>the</strong> direction<br />
<strong>of</strong> commodity prices particularly that <strong>of</strong> oil and <strong>the</strong> per<strong>for</strong>mance<br />
<strong>of</strong> <strong>the</strong> monsoon will play an important role in determining<br />
inflation. Fortunately, oil prices have moderated somewhat,<br />
having corrected 15% from <strong>the</strong>ir high and 11% this <strong>month</strong>.<br />
However <strong>the</strong> future course <strong>of</strong> prices is difficult to anticipate as it<br />
is driven by <strong>the</strong> complex interaction <strong>of</strong> demand-supply factors,<br />
financial flows and government action. O<strong>the</strong>r commodities also<br />
corrected this <strong>month</strong> with copper, zinc and aluminum down<br />
between 1-5% each.<br />
Overseas, <strong>the</strong> US markets were flat with <strong>the</strong> Dow up 0.2% and<br />
<strong>the</strong> Nasdaq up 1.4%. Emerging market per<strong>for</strong>mance was mixed<br />
with <strong>the</strong> Hang Seng and Shanghai Composite up 2.8% and 2.4%<br />
while <strong>the</strong> Kospi, Jakarta Composite and Nikkei were down 4.8%,<br />
1.7% and 0.8% respectively. Here too <strong>the</strong> attention was on <strong>the</strong><br />
unfolding credit crisis and <strong>the</strong> likely fallout on global growth. So<br />
far, despite being plagued by numerous concerns, <strong>the</strong> US economy<br />
has been fairly resilient and a clearer, and hopefully brighter<br />
picture will emerge in <strong>the</strong> next few <strong>month</strong>s.<br />
Back home, first quarter results have been more or less in line<br />
with expectations. As expected, sales growth has moderated,<br />
while rising input costs and interest rates have pressured pr<strong>of</strong>itability.<br />
Not surprisingly, investor attention has shifted to companies<br />
that are able to wea<strong>the</strong>r <strong>the</strong>se challenging times better. Going<br />
<strong>for</strong>ward, investor attention is likely to continue to gravitate<br />
towards well-managed companies with strong fundamentals that<br />
have reasonable growth prospects and that are better positioned to<br />
cope in <strong>the</strong> current environment. With valuations moderating, a<br />
lot <strong>of</strong> <strong>the</strong>se businesses are now priced reasonably and are poised<br />
to give superior long-term returns.<br />
Debt market update<br />
Reserve Bank <strong>of</strong> India (RBI) unveiled <strong>the</strong> first quarter<br />
review <strong>of</strong> annual monetary policy statement 20<strong>08</strong>-09 on<br />
<strong>July</strong> 29, 20<strong>08</strong>. In an unusually aggressive move RBI<br />
took markets by surprise, hiking Repo rate by 50 bps and CRR<br />
by 25 bps (effective August 30, 20<strong>08</strong>). Since April <strong>08</strong>, <strong>the</strong> cumulative<br />
hike in Repo rates is now 125 bps and <strong>the</strong> hike in CRR is<br />
150bps. In a hawkish statement, RBI has accorded highest priority<br />
to bringing down inflation and inflation expectations mainly<br />
by managing aggregate demand. RBI has lowered it GDP<br />
growth estimate <strong>for</strong> fiscal 20<strong>08</strong>-09 from 8-8.5% to 8%. RBI has<br />
revised its outlook on wholesale price inflation to 7% by March<br />
2009 from 5-5.5%. The central bank also expressed concern<br />
about <strong>the</strong> growth <strong>of</strong> non-food credit, citing incremental Credit-<br />
Deposit ratio <strong>of</strong> 82.4% as high.<br />
The bond markets reacted negatively to quarterly credit policy<br />
announcement. The yield on 10-year Government Security<br />
jumped by 0.85% to a high <strong>of</strong> 9.54% be<strong>for</strong>e ending <strong>the</strong> <strong>month</strong> at<br />
9.32% – an increase <strong>of</strong> 63 bps over June 20<strong>08</strong>.<br />
Due to CRR hikes coming into effect during <strong>the</strong> <strong>month</strong> <strong>of</strong><br />
<strong>July</strong> 20<strong>08</strong>, interbank liquidity turned from positive to negative.<br />
The average LAF during <strong>the</strong> <strong>month</strong> was negative Rs 27,962<br />
crores. The average NSE overnight MIBOR was significantly<br />
higher at 8.84% during <strong>the</strong> <strong>month</strong> <strong>of</strong> <strong>July</strong> as against 7.81% during<br />
<strong>the</strong> <strong>month</strong> <strong>of</strong> June 20<strong>08</strong>.<br />
During <strong>the</strong> <strong>month</strong> <strong>of</strong> <strong>July</strong> 20<strong>08</strong>, inflation as measured by<br />
WPI continued to rise and touched 11.98% <strong>for</strong> <strong>the</strong> week ending<br />
<strong>July</strong> 19. Post policy rate hike, INR gained versus <strong>the</strong> US Dollar,<br />
ending <strong>the</strong> <strong>month</strong> at 42.57 as against 43.05 in <strong>the</strong> previous<br />
<strong>month</strong>. Net FII investment in equities and debt continued to see<br />
outflow <strong>of</strong> USD 1352 million in <strong>July</strong> compared to an outflow <strong>of</strong><br />
USD 2750 million in <strong>the</strong> previous <strong>month</strong>.<br />
Given <strong>the</strong> aggressive rate hikes in a short span <strong>of</strong> time, repo<br />
rate may be close to peaking as far as any hike in <strong>the</strong> short term<br />
is concerned. However, liquidity conditions would be kept tight<br />
in order to rein in monetary aggregates and control inflation.<br />
The fund continues to position itself in maturity segments and<br />
instruments that provide higher relative value in an endeavor to<br />
deliver superior risk adjusted returns. <br />
2 <strong>July</strong> 20<strong>08</strong> Intouchmutually
hdfc-edit-r.qxd 8/9/20<strong>08</strong> 11:25 AM Page 1<br />
t<br />
POST-RETIREMENT<br />
Don’t worry, be happy<br />
It’s important to evaluate <strong>the</strong> different sources <strong>of</strong> income and take action accordingly<br />
Retirement is a stage in life where you<br />
need a steady income to support yourself<br />
and your spouse while maintaining<br />
<strong>the</strong> desired standard <strong>of</strong> living. When planning<br />
<strong>for</strong> retirement, a moot question stares at us:<br />
how much is enough<br />
Though we can draw up a plan that includes<br />
future cash flows, accumulation and spending<br />
assumptions, it is not always possible to accurately<br />
assess this amount. Especially because<br />
<strong>the</strong>re are o<strong>the</strong>r variables like expected rate <strong>of</strong><br />
returns, inflation and taxes that also need to be<br />
considered in <strong>the</strong> retirement planning.<br />
There may be constraints in saving desired<br />
amount <strong>of</strong> money on a regular basis. There<strong>for</strong>e, it<br />
is quite possible that you may not entirely be able<br />
to depend on <strong>the</strong> returns from your investments to<br />
fund your retirement expenses. Creating alternative<br />
income source hence is a must.<br />
There are usually three income sources during<br />
retirement<br />
■ Self-created or employer sponsored retirement<br />
plans,<br />
■ Returns from investments<br />
■ Working during retirement<br />
Unless one creates a sufficiently large corpus,<br />
it is difficult to survive on a single source.<br />
Most <strong>of</strong> <strong>the</strong> retired persons depend on at least<br />
two <strong>of</strong> <strong>the</strong> three sources. Let us look at each<br />
such source in more detail.<br />
Retirement Plans:<br />
Employer sponsored There are many ways<br />
an employer can set up and sponsor retirement<br />
plans and accounts <strong>for</strong> its employees. These<br />
plans can be broadly divided into defined benefit<br />
and defined contribution plans.<br />
Defined benefits plans are those, which<br />
<strong>of</strong>fer <strong>the</strong> employee a fixed pre-determined<br />
amount, linked to <strong>the</strong> salary. This is generally<br />
paid as a <strong>month</strong>ly income <strong>for</strong> life, with a certain<br />
portion allowed to be commuted or received as<br />
a lump sum. For instance, <strong>the</strong> employer takes<br />
away a defined portion <strong>of</strong> annual salary to provide<br />
assured pension <strong>for</strong> life.<br />
Defined contribution plans are, wherein<br />
employees do not get a guaranteed income<br />
payout on retirement. The regular contribution<br />
is invested in various permissible instruments.<br />
The returns from <strong>the</strong>se investments determine<br />
<strong>the</strong> retirement benefits. Such plans are funded<br />
through employer-employee contributions.<br />
Increasingly, pension schemes are moving<br />
towards this system, creating fur<strong>the</strong>r uncertainty<br />
<strong>for</strong> a person planning his retirement.<br />
There are o<strong>the</strong>r employer sponsored retirement<br />
benefits too, such as gratuity and voluntary<br />
retirement schemes. Self-Created The<br />
most common and popular scheme in this category<br />
is <strong>the</strong> public provident fund (PPF).<br />
Besides this, o<strong>the</strong>r popular avenues include<br />
insurance companies retirement plans, which<br />
provide pension plans and annuities.<br />
Returns from Investments<br />
Apart from <strong>the</strong> retirement plans and accounts<br />
mentioned above, an individual would need<br />
to make separate personal investments to plan<br />
<strong>for</strong> retirement.<br />
A few popular investment avenues are:<br />
● Direct equities This is an asset class one<br />
should opt <strong>for</strong> superior returns over a longer<br />
period <strong>of</strong> time. Equities become more attractive<br />
because <strong>of</strong> <strong>the</strong> tax exemptions on dividends<br />
as well as long-term capital gains.<br />
● Bonds and debt schemes Ideal <strong>for</strong> conservative<br />
investors looking <strong>for</strong> a steady income<br />
without much volatility <strong>of</strong> invested capital.<br />
Long-term capital gains are taxed at lower than<br />
marginal tax rates.<br />
● Bank deposits Ano<strong>the</strong>r safe bet<br />
<strong>for</strong> <strong>the</strong> cautious investor.<br />
However, income is fully taxable<br />
at marginal tax rate.<br />
● Rental income This is an<br />
ideal investment <strong>for</strong> retirement.<br />
While property purchased tends to<br />
appreciate in value over <strong>the</strong> long-term, it also<br />
yields a good rental income. Moreover, real<br />
estate also gets lower than marginal rate <strong>of</strong> taxes<br />
on long-term capital gains.<br />
● Reverse mortgage loans For those people<br />
who do not have adequate income to support<br />
<strong>the</strong>mselves in retirement, this<br />
proves to be a decent<br />
source <strong>of</strong> regular income.<br />
The following factors<br />
should be considered<br />
while selecting<br />
investments <strong>for</strong><br />
retirement:<br />
● The potential<br />
Intouchmutually<br />
<strong>July</strong> 20<strong>08</strong> 3
hdfc-edit-r.qxd 8/9/20<strong>08</strong> 11:25 AM Page 2<br />
income and capital appreciation, pre-and<br />
post-retirement<br />
● Your time horizon and whe<strong>the</strong>r <strong>the</strong> investment<br />
avenue matches it<br />
● The costs that you have to incur to service<br />
<strong>the</strong> investment, <strong>for</strong> instance, annual fund management<br />
chargers, among o<strong>the</strong>rs<br />
● Liquidity <strong>of</strong> <strong>the</strong> investment<br />
● Whe<strong>the</strong>r <strong>the</strong> investment matches your riskreturn<br />
pr<strong>of</strong>ile<br />
● The tax implications or benefits on <strong>the</strong><br />
investment at maturity/sale.<br />
Working during Retirement<br />
While <strong>the</strong> idea <strong>of</strong> working during retirement<br />
sounds paradoxical and may not seem palatable<br />
to some, it may be necessary to do so to<br />
manage your expenses. One could take up a<br />
part-time job as a consultant or freelancer, or<br />
start a small business.<br />
It has generally been observed that most<br />
people miss <strong>the</strong>ir working years after retirement.<br />
There<strong>for</strong>e, even if one does not need <strong>the</strong><br />
money to make ends meet, most people would<br />
still prefer to take up some assignment just to<br />
stay busy, productive and to boost <strong>the</strong>ir selfesteem.<br />
O<strong>the</strong>rs would just see it as a hobby,<br />
which also helps generate some extra cash!<br />
The best way to create a good corpus <strong>for</strong><br />
retirement is to start investing at an early age.<br />
However, once you actually retire, it becomes<br />
even more important to choose <strong>the</strong> right instruments<br />
to park <strong>the</strong> accumulated funds. This is<br />
very important because <strong>the</strong> returns from <strong>the</strong><br />
corpus would finally decide <strong>the</strong> kind <strong>of</strong><br />
lifestyle you can af<strong>for</strong>d.<br />
The most crucial aspects <strong>of</strong> post-retirement<br />
investing are <strong>the</strong> following:<br />
● Size <strong>of</strong> <strong>the</strong> accumulated nest egg<br />
● Desired standard <strong>of</strong> living and expenses<br />
● Life expectancy<br />
● Desire to leave some inheritance <strong>for</strong> your<br />
loved ones<br />
● Real rate <strong>of</strong> inflation<br />
● Returns from your investments and <strong>the</strong>ir tax<br />
implications<br />
● Risk-return pr<strong>of</strong>ile<br />
Retirement is generally associated with<br />
safety. However, given <strong>the</strong> present levels <strong>of</strong><br />
high inflation, investing in most fixed income<br />
instruments would give you a negative real<br />
rate <strong>of</strong> return. Fur<strong>the</strong>r, rising inflation might<br />
upset <strong>the</strong> retirement calculations quite badly.<br />
For instance, a post <strong>of</strong>fice scheme that <strong>of</strong>fers 8<br />
per cent a year would give a negative pre-tax<br />
return, since current inflation is higher than<br />
12.01 per cent. And after taxation, <strong>the</strong> real rate<br />
<strong>of</strong> returns would be even lower. Now, if you<br />
wish to use this interest income to fund your<br />
retirement expenses, <strong>the</strong> chances are very high<br />
that you will end up dipping into <strong>the</strong> corpus<br />
invested in <strong>the</strong> post <strong>of</strong>fice saving scheme. And<br />
that is real bad news because it means that<br />
your money is actually depreciating and, at a<br />
ra<strong>the</strong>r alarming rate.<br />
In such a scenario, creating a judicious<br />
asset allocation mix that includes fixed income<br />
instruments <strong>for</strong> safety and regular cash flows<br />
and high return investments like equities and<br />
real estate will help matters to a great extent.<br />
Of course, <strong>the</strong> last two might see some volatility<br />
in <strong>the</strong> short run, but <strong>the</strong>y are expected to<br />
deliver superior returns over fixed income<br />
investments over <strong>the</strong> long run.<br />
Ano<strong>the</strong>r factor to consider is that <strong>the</strong>y<br />
should as tax-efficient as possible. Equities,<br />
equity funds and debt funds are a good idea<br />
because <strong>the</strong>y are ei<strong>the</strong>r tax-free or concessional<br />
tax rates apply to <strong>the</strong>m, as opposed to traditional<br />
investments like bank deposits, senior<br />
citizen s deposits and post <strong>of</strong>fice schemes.<br />
If you have made a part <strong>of</strong> your pre-retirement<br />
investments in equities or equity funds<br />
through <strong>the</strong> systematic investing route, given<br />
<strong>the</strong> current tax structure, you would not have to<br />
pay any taxes on <strong>the</strong>ir redemption. However,<br />
instead <strong>of</strong> redeeming all your money from<br />
equities and moving immediately to fixed<br />
income instruments on retirement, you could<br />
start a systematic withdrawal plan (SWP) that<br />
would help meet <strong>month</strong>ly expenses while <strong>the</strong><br />
equity portion keeps earning good returns.<br />
In case you have a very high exposure to<br />
equities, which is not advisable post-retirement,<br />
consider equity or index-linked capital<br />
protection structured products. They generally<br />
provide you with <strong>the</strong> safety <strong>of</strong> capital through<br />
deep discounted bonds maturing at a value<br />
equal to or greater than capital invested. Invest<br />
<strong>the</strong> balance in options that provide high equity-linked<br />
returns.<br />
Real estate is ano<strong>the</strong>r avenue one could<br />
look at. Ideally, one could purchase property<br />
that would generate rental incomes. Also, <strong>the</strong><br />
property value would appreciate in <strong>the</strong> long<br />
term and be a natural hedge against inflation.<br />
Ano<strong>the</strong>r important issue to consider is getting<br />
adequate insurance. While life insurance<br />
is not required <strong>for</strong> a retired person, since <strong>the</strong><br />
basic premise <strong>of</strong> life insurance is protection <strong>of</strong><br />
loss <strong>of</strong> income, buy medical insurance <strong>for</strong> both<br />
you and your spouse. Look <strong>for</strong> a cover that<br />
<strong>of</strong>fers guaranteed renewability. ●<br />
RISHY NATHANY<br />
4 <strong>July</strong> 20<strong>08</strong> Intouchmutually
hdfc-fos.qxd 8/8/20<strong>08</strong> 3:36 PM Page 1<br />
Features <strong>of</strong> our following schemes<br />
<strong>HDFC</strong> Growth<br />
<strong>Fund</strong><br />
Open-ended Growth<br />
Scheme<br />
<strong>HDFC</strong> Equity<br />
<strong>Fund</strong><br />
Open-ended<br />
Growth Scheme<br />
<strong>HDFC</strong> Top 200<br />
<strong>Fund</strong><br />
Open-ended Growth<br />
Scheme<br />
<strong>HDFC</strong> Capital<br />
Builder <strong>Fund</strong><br />
Open-ended<br />
Growth Scheme<br />
<strong>HDFC</strong> Core & Satellite<br />
<strong>Fund</strong><br />
Open-ended Growth<br />
Scheme<br />
<strong>HDFC</strong> Premier<br />
Multi-Cap <strong>Fund</strong><br />
Open-ended Growth<br />
Scheme<br />
Nature <strong>of</strong> Scheme<br />
Investment Objective<br />
To generate long term<br />
capital appreciation<br />
from a portfolio that is<br />
invested predominantly<br />
in equity and<br />
equity related<br />
instruments.<br />
To achieve capital<br />
appreciation.<br />
To generate long term<br />
capital appreciation from a<br />
portfolio <strong>of</strong> equity and<br />
equity-linked instruments<br />
primarily drawn from <strong>the</strong><br />
companies in BSE 200<br />
index.<br />
To achieve capital<br />
appreciation in <strong>the</strong><br />
long term.<br />
To generate capital<br />
appreciation through<br />
equity investment in<br />
companies whose shares<br />
are quoting at prices below<br />
<strong>the</strong>ir true value.<br />
To generate capital<br />
appreciation in <strong>the</strong> long<br />
term through equity<br />
investments by investing<br />
in a diversified portfolio<br />
<strong>of</strong> Mid Cap & Large Cap<br />
‘blue chip’ companies.<br />
<strong>Fund</strong> Manager<br />
Srinivas Rao Ravuri<br />
(since Apr 3, 06)<br />
Prashant Jain<br />
(since Jun 19, 03)*<br />
Prashant Jain<br />
(since Jun19, 03)*<br />
Chirag Setalvad<br />
(since Apr 2, 07)<br />
Vinay Kulkarni<br />
(since Nov 21, 06)<br />
Vinay Kulkarni<br />
(since Nov 21, 06)<br />
Inception Date<br />
(Date <strong>of</strong> Allotment)<br />
September 11, 2000<br />
January 1, 1995<br />
October 11, 1996<br />
February 1, 1994<br />
September 17, 2004<br />
April 6, 2005<br />
Entry / Sales Load<br />
(Non-SIP / STP)<br />
Exit Load<br />
(Non-SIP / STP)<br />
Applications routed through any Distributor/Agent/Broker:<br />
● In respect <strong>of</strong> each purchase / switch-in <strong>of</strong> Units less than Rs. 5 crore in value, an Entry Load <strong>of</strong> 2.25% is payable.<br />
● In respect <strong>of</strong> each purchase / switch-in <strong>of</strong> Units equal to or greater than Rs. 5 Crore in value, no Entry Load is payable.<br />
Applications not routed through any Distributor/Agent/Broker (Direct Applications): Nil<br />
● In respect <strong>of</strong> each<br />
purchase / switch-in <strong>of</strong><br />
Units less than Rs. 5<br />
Crore in value, an Exit<br />
Load <strong>of</strong> 1% is payable<br />
if units are redeemed /<br />
switched-out within<br />
1 year from <strong>the</strong> date<br />
<strong>of</strong> allotment.<br />
● In respect <strong>of</strong> each<br />
purchase / switch-in <strong>of</strong><br />
Units equal to or<br />
greater than Rs. 5<br />
Crore in value, no Exit<br />
Load is payable.<br />
● In respect <strong>of</strong><br />
each purchase /<br />
switch-in <strong>of</strong> Units<br />
less than Rs. 5<br />
Crore in value, an<br />
Exit Load <strong>of</strong> 1% is<br />
payable if units are<br />
redeemed /<br />
switched-out within<br />
1 year from <strong>the</strong><br />
date <strong>of</strong> allotment.<br />
● In respect <strong>of</strong><br />
each purchase /<br />
switch-in <strong>of</strong> Units<br />
equal to or greater<br />
than Rs. 5 Crore in<br />
value, no Exit Load<br />
is payable.<br />
● In respect <strong>of</strong> each<br />
purchase / switch-in <strong>of</strong> Units<br />
less than Rs. 5 Crore in<br />
value, an Exit Load <strong>of</strong> 1% is<br />
payable if units are<br />
redeemed /<br />
switched-out within<br />
1 year from <strong>the</strong> date<br />
<strong>of</strong> allotment.<br />
● In respect <strong>of</strong> each<br />
purchase / switch-in <strong>of</strong> Units<br />
equal to or greater than<br />
Rs. 5 Crore in value, no Exit<br />
Load is payable.<br />
● In respect <strong>of</strong><br />
each purchase /<br />
switch-in <strong>of</strong> Units<br />
less than Rs. 5<br />
Crore in value, an<br />
Exit Load <strong>of</strong> 1% is<br />
payable if units are<br />
redeemed /<br />
switched-out within<br />
1 year from <strong>the</strong><br />
date <strong>of</strong> allotment.<br />
● In respect <strong>of</strong><br />
each purchase /<br />
switch-in <strong>of</strong> Units<br />
equal to or greater<br />
than Rs. 5 Crore in<br />
value, no Exit Load<br />
is payable.<br />
● In respect <strong>of</strong> each<br />
purchase / switch-in <strong>of</strong><br />
Units less than Rs. 5 Crore<br />
in value, an Exit Load <strong>of</strong><br />
1% is payable if units are<br />
redeemed /<br />
switched-out within<br />
1 year from <strong>the</strong> date<br />
<strong>of</strong> allotment.<br />
● In respect <strong>of</strong> each<br />
purchase / switch-in <strong>of</strong><br />
Units equal to or greater<br />
than Rs. 5 Crore in value,<br />
no Exit Load is payable.<br />
No Entry/Exit Load shall be levied on bonus units and units allotted on dividend reinvestment.<br />
● In respect <strong>of</strong><br />
each purchase / switchin<br />
<strong>of</strong> Units less than<br />
Rs. 5 Crore in value, an<br />
Exit Load <strong>of</strong> 1% is<br />
payable if units are<br />
redeemed /<br />
switched-out within 1<br />
year from <strong>the</strong> date <strong>of</strong><br />
allotment.<br />
● In respect <strong>of</strong><br />
each purchase / switchin<br />
<strong>of</strong> Units equal to or<br />
greater than Rs. 5 Crore<br />
in value, no Exit Load is<br />
payable.<br />
Investment<br />
Plan / Options<br />
Growth & Dividend<br />
Growth & Dividend Growth & Dividend Growth & Dividend Growth & Dividend<br />
The Dividend Plan / Option <strong>of</strong>fers Dividend Payout and Reinvestment facility.<br />
Growth & Dividend<br />
Minimum<br />
Application Amount<br />
(Under each Plan)<br />
Purchase : Rs. 5,000 and any amount <strong>the</strong>reafter.<br />
Additional Purchase : Rs. 1,000 and any amount <strong>the</strong>reafter.<br />
Lock-in Period<br />
Nil<br />
Nil<br />
Nil<br />
Nil<br />
Nil<br />
Nil<br />
Net Asset Value<br />
(NAV)<br />
Every Business Day<br />
Every Business Day<br />
Every Business Day<br />
Every Business Day<br />
Every Business Day<br />
Every Business Day<br />
Redemption<br />
Proceeds<br />
Normally despatched<br />
within 3 Business<br />
Days.<br />
Normally<br />
despatched within<br />
3 Business Days.<br />
Normally despatched within<br />
3 Business Days.<br />
Normally<br />
despatched within<br />
3 Business Days.<br />
Normally despatched<br />
within 3 Business Days.<br />
Normally despatched<br />
within 3 Business Days.<br />
Investors are advised to consult <strong>the</strong>ir tax advisors with respect to <strong>the</strong> tax consequences <strong>of</strong> <strong>the</strong> purchase, ownership and disposal <strong>of</strong> mutual fund units.<br />
For Tax Benefits / Consequences, Please refer to page 10<br />
* Date <strong>of</strong> migration from Zurich India <strong>Mutual</strong> <strong>Fund</strong><br />
Intouchmutually <strong>July</strong> 20<strong>08</strong> 5
hdfc-fos.qxd 8/8/20<strong>08</strong> 3:36 PM Page 2<br />
Features <strong>of</strong> our following schemes<br />
<strong>HDFC</strong> Index <strong>Fund</strong><br />
<strong>HDFC</strong> Arbitrage <strong>Fund</strong><br />
<strong>HDFC</strong> Children’s Gift <strong>Fund</strong>^#<br />
Nature <strong>of</strong> Scheme<br />
Open-ended Index Linked Scheme<br />
Open ended Equity <strong>Fund</strong><br />
Open-ended Balanced Scheme<br />
Investment Objective<br />
Nifty Plan : To generate returns that are<br />
commensurate with <strong>the</strong> per<strong>for</strong>mance <strong>of</strong><br />
<strong>the</strong> Nifty, subject to tracking errors.<br />
SENSEX Plan : To generate returns that are<br />
commensurate with <strong>the</strong> per<strong>for</strong>mance <strong>of</strong> <strong>the</strong><br />
SENSEX, subject to tracking errors.<br />
SENSEX Plus Plan : To invest 80 to 90% <strong>of</strong><br />
<strong>the</strong> net assets <strong>of</strong> <strong>the</strong> Plan in companies<br />
whose securities are included in SENSEX<br />
and between 10% & 20% <strong>of</strong> <strong>the</strong> net assets in<br />
companies whose securities are not<br />
included in <strong>the</strong> SENSEX.<br />
To generate income through arbitrage opportunities<br />
between cash and derivative market and arbitrage<br />
opportunities within <strong>the</strong> derivative segment and by<br />
deployment <strong>of</strong> surplus cash in debt securities and<br />
money market instruments.<br />
The primary objective <strong>of</strong> both <strong>the</strong> Plans viz.<br />
Investment Plan & Savings Plan under <strong>the</strong><br />
Scheme is to generate long term capital<br />
appreciation.<br />
<strong>Fund</strong> Manager<br />
Vinay Kulkarni (since Dec 29, 06)<br />
Anil Bamboli (since Oct 23, 07)<br />
Chirag Setalvad (since April 2, 07)<br />
Inception Date<br />
(Date <strong>of</strong> Allotment)<br />
<strong>July</strong> 17, 2002<br />
October 23, 2007<br />
March 2, 2001<br />
Entry / Sales Load<br />
(Non-SIP / STP)<br />
Exit Load<br />
(Non-SIP / STP)<br />
Direct Applications and Applications routed through any Agent/Distributor/Broker : Nil<br />
● In respect <strong>of</strong> each purchase / switch-in <strong>of</strong><br />
Units upto and including Rs. 5 lakh in<br />
value, an Exit Load <strong>of</strong> 1.00% is payable if<br />
Units are redeemed within one year from<br />
<strong>the</strong> date <strong>of</strong> allotment.<br />
● In respect <strong>of</strong> each purchase / switch-in <strong>of</strong><br />
Units greater than Rs. 5 lakh in value, no<br />
Exit Load is payable.<br />
No Entry/Exit Load shall be levied on<br />
bonus units<br />
● In respect <strong>of</strong> each purchase/switch-in <strong>of</strong> units, an<br />
Exit load <strong>of</strong> 0.50% is payable if units are redeemed /<br />
switched-out within 3 <strong>month</strong>s from <strong>the</strong> date <strong>of</strong><br />
allotment.<br />
● No Exit Load is payable if units are redeemed /<br />
switched-out after 3 <strong>month</strong>s from <strong>the</strong> date <strong>of</strong> allotment.<br />
No Entry/Exit Load shall be levied on bonus units and<br />
units allotted on dividend reinvestment.<br />
Applications routed through any Distributor/<br />
Agent/Broker:<br />
Investment Plan: 2.25%; Savings Plan: 1.25%<br />
Applications not routed through any Distributor/<br />
Agent/Broker (Direct Applications): Nil<br />
● For Units subject to Lock-in Period: NIL<br />
● For Units not subject to Lock-in Period: 3%<br />
if <strong>the</strong> Units are redeemed / switched-out<br />
within one year from <strong>the</strong> date <strong>of</strong> allotment;<br />
2% if <strong>the</strong> Units are redeemed / switched-out<br />
between <strong>the</strong> first and second year <strong>of</strong> <strong>the</strong><br />
date <strong>of</strong> allotment; 1% if Units are redeemed<br />
/ switched-out between <strong>the</strong> second and<br />
third year <strong>of</strong> <strong>the</strong> date <strong>of</strong> allotment; Nil if <strong>the</strong><br />
Units are redeemed / switched -out after<br />
third year from <strong>the</strong> date <strong>of</strong> allotment.<br />
No Entry/Exit Load shall be levied on<br />
bonus units<br />
Investment<br />
Plan / Options<br />
Nifty Plan, SENSEX Plan, SENSEX Plus Plan<br />
At present, each Plan <strong>of</strong>fers Growth Option<br />
only.<br />
Wholesale Plan and Retail Plan - Both Plan <strong>of</strong>fers<br />
Dividend and Growth Option. Dividend Option <strong>of</strong>fers<br />
Monthly and Quarterly Dividend Option with Payout<br />
and Reinvestment Facility.<br />
Investment Plan : (Equity Oriented)<br />
Savings Plan : (Debt Oriented)<br />
Minimum<br />
Application Amount<br />
(Under each Plan)<br />
Purchase : Rs. 5,000 and any amount<br />
<strong>the</strong>reafter.<br />
Additional Purchase : Rs. 1,000 and any<br />
amount <strong>the</strong>reafter.<br />
Wholesale Plan: Purchase / Additional Purchase :<br />
Rs. 1 Crore and any amount <strong>the</strong>reafter.<br />
Retail Plan: Purchase / Additional Purchase :<br />
Growth / Quaterly Dividend Option: Rs. 5,000 and any<br />
amount <strong>the</strong>reafter.<br />
Retail Plan: Monthly Dividend Option: Rs. 25,000 and<br />
any amount <strong>the</strong>reafter.<br />
Purchase : Rs. 5,000 and any amount<br />
<strong>the</strong>reafter.<br />
Additional Purchase : Rs. 1,000 and any<br />
amount <strong>the</strong>reafter.<br />
Lock-in Period<br />
Nil<br />
Nil<br />
If opted : Until <strong>the</strong> Unit holder (being <strong>the</strong><br />
beneficiary child) attains <strong>the</strong> age <strong>of</strong> 18 years<br />
or until completion <strong>of</strong> 3 years from date <strong>of</strong><br />
allotment, whichever is later.<br />
Net Asset Value<br />
(NAV)<br />
Every Business Day<br />
Every Business Day<br />
Every Business Day<br />
Redemption<br />
Proceeds<br />
Normally despatched within<br />
3 Business Days.<br />
Normally despatched within 3 Business days.<br />
Normally despatched within 3 Business Days<br />
(subject to completion <strong>of</strong> Lock-in Period,<br />
if opted).<br />
^ Eligibility (<strong>of</strong> Unit holder) : Children less than 18 years <strong>of</strong> age as on <strong>the</strong> date <strong>of</strong> investment by <strong>the</strong> Investor / Applicant are eligible as Unit holders in <strong>the</strong> Scheme. # Personal Accident Insurance Cover (<strong>for</strong> resident Unit holders only), equivalent<br />
to 10 times <strong>the</strong> face value <strong>of</strong> Units held by <strong>the</strong> Unit holder under all <strong>the</strong> applications / account statements / folios, subject to a maximum amount <strong>of</strong> Rs. 3 lakhs per Unit holder. The insurance premium in respect <strong>of</strong> <strong>the</strong> personal accident insurance<br />
cover will be borne by <strong>the</strong> AMC. This accident insurance cover is subject to conditions <strong>of</strong> <strong>the</strong> group personal accident insurance policy.<br />
Investors are advised to consult <strong>the</strong>ir tax advisors with respect to <strong>the</strong> tax consequences <strong>of</strong> <strong>the</strong> purchase, ownership and disposal <strong>of</strong> mutual fund units.<br />
For Tax Benefits / Consequences, Please refer to page 10<br />
6 <strong>July</strong> 20<strong>08</strong><br />
Intouchmutually
hdfc-fos.qxd 8/8/20<strong>08</strong> 3:36 PM Page 3<br />
Features <strong>of</strong> our following schemes<br />
Nature <strong>of</strong> Scheme<br />
<strong>HDFC</strong> Balanced <strong>Fund</strong><br />
Open-ended Balanced Scheme<br />
<strong>HDFC</strong> Prudence <strong>Fund</strong><br />
Open-ended Balanced Scheme<br />
<strong>HDFC</strong> Long Term Advantage<br />
<strong>Fund</strong> #<br />
Open-ended Equity Linked Savings<br />
Scheme with a lock-in period <strong>of</strong><br />
3 years<br />
<strong>HDFC</strong> TaxSaver<br />
Open-ended Equity Linked Savings<br />
Scheme with a lock-in period <strong>of</strong> 3 years<br />
Investment Objective<br />
To generate capital appreciation<br />
along with current income from a<br />
combined portfolio <strong>of</strong> equity &<br />
equity-related and debt & money<br />
market instruments.<br />
To provide periodic returns and<br />
capital appreciation over a long<br />
period <strong>of</strong> time from a judicious mix<br />
<strong>of</strong> equity and debt investments with<br />
an aim to prevent / minimise any<br />
capital erosion.<br />
To generate long term capital<br />
appreciation from a portfolio<br />
that is invested predominantly<br />
in equity and equity-related<br />
instruments.<br />
To achieve long term growth <strong>of</strong> capital.<br />
<strong>Fund</strong> Managers<br />
Chirag Setalvad (since April 2, 07)<br />
Prashant Jain (since Jun 19, 03)*<br />
Chirag Setalvad (since April 2, 2007)<br />
Vinay Kulkarni (since Nov 21, 2006)<br />
Inception Date<br />
(Date <strong>of</strong> Allotment)<br />
September 11, 2000<br />
February 1, 1994<br />
January 2, 2001<br />
December 18, 1995<br />
Entry / Sales Load<br />
(Non-SIP / STP)<br />
Exit Load<br />
(Non-SIP / STP)<br />
Investment<br />
Plan / Options<br />
Minimum<br />
Application Amount<br />
● In respect <strong>of</strong> each purchase /<br />
switch-in <strong>of</strong> Units less than<br />
Rs. 5 Crore in value, an Exit<br />
Load <strong>of</strong> 1% is payable if units<br />
are redeemed / switched-out<br />
within 1 year from <strong>the</strong> date <strong>of</strong><br />
allotment.<br />
● In respect <strong>of</strong> each purchase /<br />
switch-in <strong>of</strong> Units equal to or<br />
greater than Rs. 5 Crore in<br />
value, no Exit Load is payable.<br />
Growth & Dividend<br />
Applications routed through any Distributor/Agent/Broker:<br />
● In respect <strong>of</strong> each purchase / switch-in <strong>of</strong> Units less than Rs. 5 crore in value, an Entry Load <strong>of</strong> 2.25% is payable.<br />
● In respect <strong>of</strong> each purchase / switch-in <strong>of</strong> Units equal to or greater than Rs. 5 crore in value, no Entry Load is payable.<br />
Applications not routed through any Distributor/Agent/Broker (Direct Applications): Nil<br />
● In respect <strong>of</strong> each purchase /<br />
switch-in <strong>of</strong> Units less than<br />
Rs. 5 Crore in value, an Exit<br />
Load <strong>of</strong> 1% is payable if units<br />
are redeemed / switched-out<br />
within 1 year from <strong>the</strong> date <strong>of</strong><br />
allotment.<br />
● In respect <strong>of</strong> each purchase /<br />
switch-in <strong>of</strong> Units equal to or<br />
greater than Rs. 5 Crore in<br />
value, no Exit Load is payable.<br />
No Entry/Exit Load shall be levied on bonus units and units allotted on dividend reinvestment.<br />
Purchase : Rs. 5,000 and any amount <strong>the</strong>reafter.<br />
Additional Purchase : Rs. 1,000 and any amount <strong>the</strong>reafter.<br />
Growth & Dividend<br />
Growth & Dividend<br />
The Dividend Plan <strong>of</strong>fers Dividend payout and Reinvestment facility.<br />
Nil<br />
Nil<br />
Growth & Dividend<br />
For Purchase & Additional Purchase : Rs. 500 and in multiples <strong>of</strong> Rs<br />
500 <strong>the</strong>reafter.<br />
Lock-in Period<br />
Nil<br />
Nil<br />
3 years from <strong>the</strong> date <strong>of</strong> allotment <strong>of</strong> <strong>the</strong> respective Units<br />
Net Asset Value<br />
(NAV)<br />
Every Business Day<br />
Every Business Day<br />
Every Business Day<br />
Every Business Day<br />
Redemption<br />
Proceeds<br />
Normally despatched<br />
within 3 Business Days.<br />
Normally despatched<br />
within 3 Business Days.<br />
Normally despatched within 3 Business Days (subject to completion<br />
<strong>of</strong> Lock-in Period).<br />
Investors are advised to consult <strong>the</strong>ir tax advisors with respect to <strong>the</strong> tax consequences <strong>of</strong> <strong>the</strong> purchase, ownership and disposal <strong>of</strong> mutual fund units.<br />
# Previously <strong>HDFC</strong> Tax Plan 2000<br />
For Tax Benefits / Consequences, Please refer to page 10<br />
* Date <strong>of</strong> migration from Zurich India <strong>Mutual</strong> <strong>Fund</strong><br />
Intouchmutually <strong>July</strong> 20<strong>08</strong> 7
hdfc-fos.qxd 8/8/20<strong>08</strong> 3:36 PM Page 4<br />
Features <strong>of</strong> our following schemes<br />
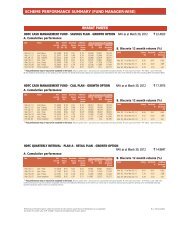
<strong>HDFC</strong> MF Monthly Income Plan<br />
<strong>HDFC</strong> Multiple Yield <strong>Fund</strong><br />
<strong>HDFC</strong> Multiple Yield <strong>Fund</strong><br />
– Plan 2005<br />
<strong>HDFC</strong> Income <strong>Fund</strong><br />
Nature <strong>of</strong> Scheme<br />
An open-ended income scheme. Monthly income is<br />
not assured and is subject to availability <strong>of</strong><br />
distributable surplus<br />
Open-ended Income Scheme<br />
Open-ended Income Scheme<br />
Open-ended Income Scheme<br />
Investment Objective<br />
The primary objective <strong>of</strong> Scheme is to generate regular<br />
returns through investment primarily in Debt and<br />
Money Market Instruments. The secondary objective<br />
<strong>of</strong> <strong>the</strong> Scheme is to generate long-term capital<br />
appreciation by investing a portion <strong>of</strong> <strong>the</strong> Scheme’s<br />
assets in equity and equity related instruments.<br />
To generate positive returns<br />
over medium time frame with<br />
low risk <strong>of</strong> capital loss over<br />
medium time frame.<br />
To generate positive returns<br />
over medium time frame with<br />
low risk <strong>of</strong> capital loss over<br />
medium time frame.<br />
To optimise returns while<br />
maintaining a balance <strong>of</strong><br />
safety, yield and liquidity.<br />
<strong>Fund</strong> Managers<br />
LTP - Prashant Jain (Equities) (since Dec 26, 03),<br />
Shobhit Mehrotra (Debt) (since Sep 1, 07),<br />
STP - Vinay Kulkarni (Equities) (since Nov 21, 06),<br />
Shobhit Mehrotra (Debt) (since Feb 16, 04)<br />
Vinay Kulkarni (Equities),<br />
(since Nov 21, 06)<br />
Anil Bamboli (Debt)<br />
(since Sep 17, 04)<br />
Chirag Setalvad (Equities),<br />
(since April 2, 07)<br />
Anil Bamboli (Debt)<br />
(since Aug 17, 05)<br />
Shobhit Mehrotra<br />
(since Sep 1, 07)<br />
Inception Date<br />
(Date <strong>of</strong> Allotment)<br />
December 26, 2003<br />
September 17, 2004<br />
August 17, 2005<br />
September 11, 2000<br />
Entry / Sales Load<br />
(Non-SIP / STP)<br />
Exit Load<br />
(Non-SIP / STP)<br />
Direct Applications & Applications routed through any<br />
Agent/Distributor/Broker: Nil<br />
For Short-Term Plan<br />
● In respect <strong>of</strong> each purchase / switch-in <strong>of</strong> Units upto<br />
and including Rs.10 lakhs in value, an Exit Load <strong>of</strong><br />
0.50% is payable if Units are redeemed / switchedout<br />
within 6 <strong>month</strong>s from <strong>the</strong> date <strong>of</strong> allotment.<br />
● In respect <strong>of</strong> each purchase / switch-in <strong>of</strong> Units<br />
greater than Rs.10 lakhs in value, an Exit Load <strong>of</strong><br />
0.25% is payable if Units are redeemed / switchedout<br />
within 3 <strong>month</strong>s from <strong>the</strong> date <strong>of</strong> allotment.<br />
For Long-Term Plan<br />
● In respect <strong>of</strong> each purchase / switch-in <strong>of</strong> Units less<br />
than Rs. 5 crore in value, an Exit Load <strong>of</strong> 1% is<br />
payable if Units are redeemed / switched-out within<br />
1 year from <strong>the</strong> date <strong>of</strong> allotment.<br />
● In respect <strong>of</strong> each purchase / switch-in <strong>of</strong> Units equal<br />
to or greater than Rs. 5 crore in value, no Exit Load<br />
is payable.<br />
Applications routed through any Distributor/Agent/Broker: 1%<br />
Applications not routed through any Distributor/Agent/Broker<br />
(Direct Applications): Nil<br />
● In respect <strong>of</strong> each purchase /<br />
switch-in <strong>of</strong> Units, upto and<br />
including Rs. 2 crore in<br />
value, an Exit Load <strong>of</strong> 1.00%<br />
is payable if Units are<br />
redeemed / switched - out<br />
within 1 year from date <strong>of</strong><br />
allotment.<br />
● In respect <strong>of</strong> each purchase /<br />
switch-in <strong>of</strong> Units greater<br />
than Rs. 2 crore in value, no<br />
Exit Load is payable.<br />
● In respect <strong>of</strong> each purchase /<br />
switch-in <strong>of</strong> Units, upto and<br />
including Rs. 2 crore in<br />
value, an Exit Load <strong>of</strong><br />
1.00% is payable if Units<br />
are redeemed / switched -<br />
out within 15 <strong>month</strong>s from<br />
date <strong>of</strong> allotment.<br />
● In respect <strong>of</strong> each purchase /<br />
switch-in <strong>of</strong> Units greater<br />
than Rs. 2 crore in value, no<br />
Exit Load is payable.<br />
No Entry/Exit Load shall be levied on bonus units and units allotted on dividend reinvestment.<br />
Direct Applications &<br />
Applications routed through any<br />
Agent/Distributor/Broker: Nil<br />
● In respect <strong>of</strong> each purchase /<br />
switch-in <strong>of</strong> Units, upto and<br />
including Rs. 10 Lakh in<br />
value, an Exit Load <strong>of</strong> 0.50%<br />
is payable if Units are<br />
redeemed / switched - out<br />
within six <strong>month</strong>s from<br />
date <strong>of</strong> allotment.<br />
● In respect <strong>of</strong> each purchase /<br />
switch-in (per Investor, per<br />
day) <strong>of</strong> Units, greater than<br />
Rs. 10 Lakh in value, no exit<br />
load is applicable.<br />
Investment<br />
Plan / Options<br />
Minimum<br />
Application Amount<br />
Short Term Plan (STP) & Long Term Plan (LTP). Each Plan<br />
<strong>of</strong>fers Growth, Monthly Dividend & Quarterly Dividend<br />
Option. The Dividend Option <strong>of</strong>fers Dividend Payout and<br />
Reinvestment facility.<br />
Short Term Plan : Purchase :<br />
(Growth & Quarterly Dividend Option) – Rs. 5,000 and<br />
any amount <strong>the</strong>reafter under each Option.<br />
(Monthly Dividend Option) – Rs. 25,000 and any<br />
amount <strong>the</strong>reafter.<br />
Additional Purchase : Rs. 1,000 and any amount<br />
<strong>the</strong>reafter.<br />
Long Term Plan : Purchase :<br />
(Growth & Quarterly Dividend Option) – Rs. 5,000 and<br />
any amount <strong>the</strong>reafter under each Option.<br />
(Monthly Dividend Option) – Rs. 25,000 and any<br />
amount <strong>the</strong>reafter.<br />
Additional Purchase : Rs. 1,000 and any amount<br />
<strong>the</strong>reafter.<br />
Growth & Dividend. The Dividend Option <strong>of</strong>fers Dividend Payout and Reinvestment facility.<br />
Purchase : Rs 5,000 and any amount <strong>the</strong>reafter.<br />
Additional Purchase : Rs. 1,000 and any amount <strong>the</strong>reafter.<br />
Lock-in Period<br />
Nil<br />
Nil<br />
Nil<br />
Nil<br />
Net Asset Value<br />
(NAV)<br />
Every Business Day<br />
Every Business Day<br />
Every Business Day<br />
Every Business Day<br />
Redemption<br />
Proceeds<br />
Normally despatched within 3 Business Days<br />
Normally depatched within<br />
3 Business Days<br />
Normally depatched within<br />
3 Business Days<br />
Normally despatched within<br />
3 Business Days<br />
Investors are advised to consult <strong>the</strong>ir tax advisors with respect to <strong>the</strong> tax consequences <strong>of</strong> <strong>the</strong> purchase, ownership and disposal <strong>of</strong> mutual fund units. For Tax Benefits / Consequences, Please refer to page 10<br />
8 <strong>July</strong> 20<strong>08</strong><br />
Intouchmutually
hdfc-fos.qxd 8/8/20<strong>08</strong> 3:36 PM Page 5<br />
Features <strong>of</strong> our following schemes<br />
<strong>HDFC</strong> High Interest <strong>Fund</strong> (HHIF)<br />
<strong>HDFC</strong> Short Term Plan (STP) <strong>HDFC</strong> Liquid <strong>Fund</strong> (HLF)<br />
<strong>HDFC</strong> Cash Management <strong>Fund</strong><br />
Nature <strong>of</strong> Scheme<br />
Investment Objective<br />
<strong>Fund</strong> Managers<br />
Inception Date<br />
(Date <strong>of</strong> Allotment)<br />
Entry / Sales Load<br />
(Non-SIP / STP)<br />
Exit Load<br />
(Non-SIP / STP)<br />
Investment<br />
Plan / Options<br />
Minimum<br />
Application Amount<br />
Lock-in Period<br />
Net Asset Value<br />
(NAV)<br />
Redemption<br />
Proceeds<br />
Open-ended Income Scheme<br />
To generate income by investing in a<br />
range <strong>of</strong> debt and money market<br />
instruments <strong>of</strong> various maturity dates<br />
with a view to maximise income while<br />
maintaining <strong>the</strong> optimum balance <strong>of</strong><br />
yield, safety and liquidity.<br />
Anil Bamboli (HHIF) (since Feb 16, 04),<br />
Shobhit Mehrotra - STP (since Sep 1, 07)<br />
HHIF : April 28, 1997<br />
HHIF-STP : February 6, 2002<br />
Open-ended Income Scheme<br />
To generate regular income through<br />
investment in Debt Securities and<br />
Money Market Instruments.<br />
Anil Bamboli (since Jan 13, 04)<br />
February 28, 2002<br />
Growth & Dividend (Dividend Option<br />
<strong>of</strong>fers Reinvestment facility only).<br />
Purchase : Rs. 5,000 and any<br />
amount <strong>the</strong>reafter.<br />
Additional Purchase : Rs. 1,000 and<br />
any amount <strong>the</strong>reafter.<br />
Nil<br />
Every Business Day<br />
Normally despatched within 3 Business<br />
Days.<br />
Open-ended Liquid Income Scheme<br />
To enhance income consistent with a high<br />
level <strong>of</strong> liquidity, through a judicious portfolio<br />
mix comprising <strong>of</strong> money market and debt<br />
instruments.<br />
Shobhit Mehrotra (since Feb 16, 04)<br />
HLF : October 17, 2000<br />
HLF – Premium Plan & HLF – Premium Plus Plan :<br />
February 24, 2003<br />
Savings & Call Plan: Open ended High<br />
Liquidity Income Scheme.<br />
Savings Plus Plan (erstwhile Investment Plan<br />
- Growth Option): Open-ended<br />
Income Scheme.<br />
Savings & Call Plan: To generate<br />
optimal returns while maintaining<br />
safety and high liquidity.<br />
Savings Plus Plan: To generate regular<br />
income through investment in debt<br />
securities and money market instruments.<br />
Anil Bamboli - Savings Plan (Since Feb, 05)<br />
Savings Plus Plan (since Sep 1, 07)<br />
Bharat Pareek - Call Plan (since May 23, <strong>08</strong>)<br />
Savings & Savings Plus Plan :<br />
November 18, 1999<br />
Call Plan : February 6, 2002<br />
HHIF :<br />
● In respect <strong>of</strong> each purchase / Nil<br />
Savings, Savings Plus & Call Plan : Nil<br />
● In respect <strong>of</strong> each purchase / switch-in switch-in <strong>of</strong> Units, upto and<br />
<strong>of</strong> units up to and including Rs. 10 lakhs including Rs. 25 crore in value,<br />
in value, an Exit Load <strong>of</strong> 0.50%<br />
no Exit Load is payable.<br />
is payable if Units are redeemed / ● In respect <strong>of</strong> each purchase /<br />
switched-out within 6 <strong>month</strong>s<br />
switch-in (per Investor, per day) <strong>of</strong><br />
from <strong>the</strong> date <strong>of</strong> allotment.<br />
Units, greater than Rs. 25 crore in<br />
● In respect <strong>of</strong> each purchase / switch-in value, an Exit Load <strong>of</strong> 0.25% is<br />
<strong>of</strong> Units greater than Rs. 10 lakhs in payable if Units are redeemed /<br />
value, no Exit Load is payable.<br />
switched-out within 15 days from<br />
HHIF - STP : NIL<br />
<strong>the</strong> date <strong>of</strong> allotment.<br />
No Entry/Exit Load shall be levied on bonus units and units allotted on dividend reinvestment.<br />
HHIF : Growth, Quarterly, Half Yearly<br />
and Yearly Dividend Options.<br />
HHIF-STP : Growth & Dividend Option<br />
All Dividend Options <strong>of</strong>fer Dividend Payout<br />
and Reinvestment facility.<br />
(Under each Plan)<br />
Purchase : Rs. 5,000 and any amount<br />
<strong>the</strong>reafter.<br />
Additional Purchase : Rs. 1,000 and any<br />
amount <strong>the</strong>reafter.<br />
Nil<br />
Every Business Day<br />
Normally despatched within<br />
3 Business Days<br />
Direct Applications & Applications routed through any Agent/Distributor/Broker: Nil<br />
HLF, HLF - Premium Plan & HLF - Premium Plus Savings Plan & Call Plan : Growth Option &<br />
Plan. Each Plan <strong>of</strong>fers Growth & Dividend Daily Dividend Option (with Reinvestment<br />
Option.<br />
facility only). Savings Plan also <strong>of</strong>fers Weekly<br />
HLF - The Dividend Option <strong>of</strong>fers Daily Dividend Option (with payout and<br />
Dividend Option (Reinvestment facility only) Reinvestment facility.<br />
and Weekly and Monthly Dividend Option Savings Plus Plan : (Retail and Wholesale<br />
(with payout and Reinvestment facility). Option) Growth and Dividend Option.<br />
HLF Premium Plan - The Dividend Option <strong>of</strong>fers Dividend Option <strong>of</strong>fers Daily Dividend Option<br />
Daily Dividend Option (with Reinvestment facility<br />
only) and Weekly Dividend Option (with and Monthly Dividend Option with payout<br />
with Reinvestment facility only and Weekly<br />
payout and Reinvestment facility).<br />
and Reinvestment facility.<br />
HLF Premium Plus Plan - The Dividend Option<br />
<strong>of</strong>fers Weekly Dividend Option (with payout<br />
and Reinvestment facility).<br />
HLF : Growth Option : Rs. 10,000 and any<br />
amount <strong>the</strong>reafter. Dividend Option :<br />
Rs. 1,00,000 and any amount <strong>the</strong>reafter.<br />
HLF – Premium Plan (Purchase) :<br />
Rs. 5,00,00,000 and any amount<br />
<strong>the</strong>reafter <strong>for</strong> opening an account / folio<br />
(Under each Option).<br />
HLF – Premium Plus Plan (Purchase) :<br />
Rs. 20,00,00,000 and any amount<br />
<strong>the</strong>reafter <strong>for</strong> opening an account / folio<br />
(Under each Option).<br />
HLF - Premium Plan & HLF – Premium Plus<br />
Plan (Additional Purchase) : Re. 1 and and<br />
any amount <strong>the</strong>reafter under each Option.<br />
Nil<br />
All Year Round<br />
Normally despatched within 1 Business Day.<br />
Savings Plan : (Growth Option)<br />
Rs. 10,000 and any amount <strong>the</strong>reafter.<br />
(Dividend Option) Rs. 1,00,000 and any<br />
amount <strong>the</strong>reafter.<br />
Call Plan : (Under Each Option)<br />
Rs. 1,00,000 and any amount<br />
<strong>the</strong>reafter.<br />
Savings Plus Plan - Retail Option<br />
Growth, Weekly and Monthly Dividend<br />
Option<br />
Purchase : Rs. 5,000 and any amount<br />
<strong>the</strong>reafter.<br />
Additional Purchase : Rs. 1,000 and any<br />
amount <strong>the</strong>reafter.<br />
Daily Dividend Option<br />
Purchase / Additional Purchase:<br />
Rs. 1,00,000 and any amount<br />
<strong>the</strong>reafter.<br />
Savings Plus Plan - Wholesale Option<br />
Purchase : Rs. 1 Crore and any amount<br />
<strong>the</strong>reafter.<br />
Additional Purchase : Re. 1 and any<br />
amount <strong>the</strong>reafter.<br />
Nil<br />
Savings & Call Plan: All Year Round<br />
Savings Plus Plan: Every Business Day<br />
Savings & Call Plan : Normally despatched<br />
within 1 Business Day.<br />
Savings Plus Plan : Normally despatched<br />
within 3 Business Days.<br />
Investors are advised to consult <strong>the</strong>ir tax advisors with respect to <strong>the</strong> tax consequences <strong>of</strong> <strong>the</strong> purchase, ownership and disposal <strong>of</strong> mutual fund units. For Tax Benefits / Consequences, Please refer to page 10<br />
Intouchmutually <strong>July</strong> 20<strong>08</strong> 9
hdfc-fos.qxd 8/8/20<strong>08</strong> 3:36 PM Page 6<br />
Features <strong>of</strong> our following schemes<br />
Nature <strong>of</strong> Scheme<br />
<strong>HDFC</strong> Floating Rate Income <strong>Fund</strong><br />
Open-ended Income Scheme.<br />
<strong>HDFC</strong> Gilt <strong>Fund</strong><br />
Open-ended Income Scheme.<br />
Investment Objective<br />
To generate regular income through investment in a portfolio comprising substantially <strong>of</strong> floating<br />
rate debt / money market instruments, fixed rate debt / money market instruments swapped <strong>for</strong><br />
floating rate returns and fixed rate debt securities and money market instruments.<br />
To generate credit risk-free returns through investments<br />
in sovereign securities issued by <strong>the</strong> Central<br />
Government and / or a State Government.<br />
<strong>Fund</strong> Manager<br />
Inception Date<br />
(Date <strong>of</strong> Allotment)<br />
Entry / Sales Load<br />
(Non-SIP / STP)<br />
Shobhit Mehrotra (since Feb 16, 04)<br />
January 16, 2003<br />
Short Term Plan & Long Term Plan: Direct Applications & Applications routed through any<br />
Agent/Distributor/Broker: Nil<br />
Anil Bamboli (since Sep 1, 2007)<br />
<strong>July</strong> 25, 2001<br />
Direct Applications & Applications routed through any<br />
Agent/Distributor/Broker: Nil<br />
Exit Load<br />
(Non-SIP / STP)<br />
Investment<br />
Plan / Options<br />
Short Term Plan : Nil<br />
Long Term Plan : In respect <strong>of</strong> each purchase / switch-in <strong>of</strong> units, upto and including<br />
Nil<br />
Rs. 10 lakhs in value, an Exit Load <strong>of</strong> 0.50% is payable if units are redeemed / switched-out<br />
within 6 <strong>month</strong>s from <strong>the</strong> date <strong>of</strong> allotment.<br />
In respect <strong>of</strong> each purchase / switch-in <strong>of</strong> units greater than Rs. 10 lakhs in value, an Exit Load <strong>of</strong><br />
1% is payable if units are redeemed / switched-out within 6 <strong>month</strong>s from <strong>the</strong> date <strong>of</strong> allotment.<br />
No Entry/Exit Load shall be levied on bonus units and units allotted on dividend reinvestment.<br />
Short Term Plan : For investors who wish to invest <strong>for</strong> short time period.<br />
Long Term Plan : For investors who wish to invest <strong>for</strong> relatively longer time period.<br />
Short Term Plan - Wholesale & Retail Option : Growth and Dividend Option. The Dividend Option<br />
<strong>of</strong>fers Daily Dividend Option (with Reinvestment facility only) and Weekly and Monthly Dividend<br />
Option (with payout and Reinvestment facility).<br />
Long Term Plan : Growth and Dividend Option. The Dividend Option <strong>of</strong>fers Reinvestment<br />
facility only.<br />
Short Term Plan : For investors who wish to<br />
invest <strong>for</strong> short time period.<br />
Long Term Plan : For investors who wish to invest <strong>for</strong><br />
relatively longer time period.<br />
Each Plan <strong>of</strong>fers Growth and Dividend Options.<br />
The Dividend Option <strong>of</strong>fers Dividend Payout and<br />
Reinvestment facility.<br />
Minimum<br />
Application Amount<br />
Short Term Plan - Retail Option : (Growth Option, Weekly Dividend Option &<br />
Monthly Dividend Option)<br />
Purchase : Rs 5,000 and any amount <strong>the</strong>reafter.<br />
Additional Purchase : Rs 1,000 and any amount <strong>the</strong>reafter.<br />
(Daily Dividend Option)<br />
Purchase / Additional Purchase : Rs 1 lakh and any amount <strong>the</strong>reafter.<br />
Short Term Plan - Wholesale Option : (Growth Option, Daily Dividend Option,<br />
Weekly Dividend Option & Monthly Dividend Option)<br />
Under each option : Purchase : Rs 1 crore and any amount <strong>the</strong>reafter.<br />
Additional Purchase : Re 1 and and any amount <strong>the</strong>reafter.<br />
Long Term Plan : For Purchase :<br />
Rs. 5,000 and any amount <strong>the</strong>reafter.<br />
Additional Purchase : Rs. 1,000 and any amount <strong>the</strong>reafter.<br />
(Under each Plan / Option)<br />
Purchase :<br />
Rs. 5,000 and any amount <strong>the</strong>reafter.<br />
Additional Purchase :<br />
Rs. 1,000 and any amount <strong>the</strong>reafter.<br />
Lock-in Period<br />
Net Asset Value<br />
(NAV)<br />
Redemption<br />
Proceeds<br />
Nil<br />
Every Business Day<br />
Normally despatched within 3 Business Days.<br />
Nil<br />
Every Business Day<br />
Normally despatched within 3 Business Days.<br />
Investors are advised to consult <strong>the</strong>ir tax advisors with respect to <strong>the</strong> tax consequences <strong>of</strong> <strong>the</strong> purchase, ownership and disposal <strong>of</strong> mutual fund units.<br />
Tax Benefits / Consequences : Income distributed by <strong>the</strong> Scheme(s) will be exempt from Income-tax in <strong>the</strong> hands <strong>of</strong> investors. Distribution tax in case <strong>of</strong> Scheme(s) o<strong>the</strong>r than<br />
equity-oriented funds shall be payable by <strong>the</strong> mutual fund at <strong>the</strong> rate <strong>of</strong> 14.1625% (including surcharge @10%, education cess @2% and secondary and higher<br />
education cess @1%) on income distributed to an individual/HUF and at <strong>the</strong> rate <strong>of</strong> 22.66% (including surcharge @10%, education cess @2% and secondary and higher<br />
education cess @1%) on income distributed to any o<strong>the</strong>r investor. In case <strong>of</strong> income distributed by Liquid <strong>Fund</strong>s and Money Market <strong>Mutual</strong> <strong>Fund</strong>s, Dividend Distribution Tax is payable by <strong>the</strong> <strong>Mutual</strong> <strong>Fund</strong><br />
@28.325% (including surcharge @10%, education cess @2% and secondary and higher education cess @1%). Units <strong>of</strong> <strong>the</strong> Scheme(s) are not<br />
subject to Wealth-tax and Gift-tax. Unit holders are required to pay Securities Transaction Tax (STT) at <strong>the</strong> rate <strong>of</strong> 0.25% at <strong>the</strong> time <strong>of</strong> redemption / switch-out <strong>of</strong> units <strong>of</strong> an<br />
equity-oriented fund.<br />
Investors should be aware that <strong>the</strong> fiscal rules / tax laws may change and <strong>the</strong>re can be no guarantee that <strong>the</strong> current tax position may continue indefinitely. In view <strong>of</strong> individual nature <strong>of</strong> tax consequences,<br />
each investor is advised to consult his / her own pr<strong>of</strong>essional tax advisor.<br />
<strong>Fund</strong> Manager Total Experience<br />
Prashant Jain<br />
Over 16 years<br />
Shobhit Mehrotra<br />
Over 15 years<br />
Anil Bamboli<br />
Over 13 years<br />
Vinay Kulkarni<br />
Over 16 years<br />
Chirag Setalvad<br />
Over 11 years<br />
Srinivas Rao Ravuri Over 12 years<br />
Akashdeep Sarpal<br />
Over 13 years<br />
Bharat Pareek<br />
Over 6 years<br />
10 <strong>July</strong> 20<strong>08</strong><br />
Intouchmutually
hdfc-eq-r.qxd 8/8/20<strong>08</strong> 3:37 PM Page 1<br />
<strong>HDFC</strong><br />
Growth <strong>Fund</strong><br />
IN EQUITY - DIVERSIFIED CATEGORY<br />
(114 schemes) <strong>for</strong> 3 and 5 year<br />
periods ending <strong>July</strong> 31, 20<strong>08</strong><br />
An open-ended growth scheme<br />
<strong>HDFC</strong><br />
Equity <strong>Fund</strong><br />
IN EQUITY - DIVERSIFIED CATEGORY<br />
(114 schemes) <strong>for</strong> 3 and 5 year<br />
periods ending <strong>July</strong> 31, 20<strong>08</strong><br />
An open-ended growth scheme<br />
NAV (as at <strong>July</strong> 31, 20<strong>08</strong>)<br />
Relative Per<strong>for</strong>mance ^ (Growth Plan)<br />
NAV per Unit (Rs.)<br />
Growth Plan 56.819<br />
Dividend Plan 27.983<br />
NAV (as at <strong>July</strong> 31, 20<strong>08</strong>)<br />
Relative Per<strong>for</strong>mance ^ (Growth Plan)<br />
NAV per Unit (Rs.)<br />
Growth Plan 151.715<br />
Dividend Plan 34.998<br />
Date Period NAV Returns Benchmark<br />
per Unit (Rs.) (%)^ Returns (%)#<br />
Jan 31, <strong>08</strong> Last Six <strong>month</strong>s (182 days) 68.432 -16.97* -18.66*<br />
Jul 31, 07 Last 1 Year (366 days) 58.716 -3.22** -7.67**<br />
Jul 29, 05 Last 3 Years (1098 days) 27.256 27.66** 23.35**<br />
Jul 31, 03 Last 5 Years (1827 days) 11.435 37.75** 30.46**<br />
Sep 11, 00 Since Inception (2880 days) 10.000 24.63** 15.21**<br />
^Past per<strong>for</strong>mance may or may not be sustained in <strong>the</strong> future<br />
Per<strong>for</strong>mance <strong>of</strong> <strong>the</strong> Dividend Plan <strong>for</strong> <strong>the</strong> investor would be net <strong>of</strong> Distribution Tax as applicable<br />
* Absolute Returns ** Compounded Annualised Returns<br />
# SENSEX<br />
Portfolio – Top 10 Holdings (as at <strong>July</strong> 31, 20<strong>08</strong>)<br />
Company Industry + / Rating % to NAV<br />
EQUITY & EQUITY RELATED<br />
Reliance Industries Ltd. Petroleum Products 9.06<br />
State Bank <strong>of</strong> India Banks 5.21<br />
ICICI Bank Ltd. Banks 4.84<br />
ITC Ltd. Consumer Non Durables 4.82<br />
Bharti Airtel Ltd. Telecom - Services 4.78<br />
Divi’s Laboratories Ltd. Pharmaceuticals 4.66<br />
Housing Development Finance Corporation Ltd.$ Finance 4.33<br />
Oil & Natural Gas Corporation Ltd. Oil 4.25<br />
Suzlon Energy Ltd. Industrial Capital Goods 3.72<br />
Crompton Greaves Ltd. Industrial Capital Goods 3.47<br />
Total <strong>of</strong> Top Ten Equity Holdings 49.14<br />
Total Equity & Equity Related Holdings 93.44<br />
Debt / Money Market Instrument<br />
Government Securities SOV 0.51<br />
Total Debt / Money Market Instrument 0.51<br />
O<strong>the</strong>r Current Assets (Including Reverse Repos’ / CBLO) 6.05<br />
Grand Total 100.00<br />
Net Assets (Rs. In Lakhs) 96,<strong>08</strong>5.60<br />
Portfolio Turnover Ratio (Last 1 Year) 43.77%<br />
Industrial Capital Goods 13.07<br />
Pharmaceuticals 12.54<br />
Consumer Non Durables 11.52<br />
Banks 10.05<br />
Petroleum Products 9.06<br />
Telecom - Services 6.47<br />
Construction 5.40<br />
Media & Entertainment 5.36<br />
Auto Ancillaries 4.45<br />
+ Industry Classification as recommended by AMFI, $ Sponsor<br />
✤ Past per<strong>for</strong>mance is no guarantee <strong>of</strong> future results.<br />
♓ Please refer to page no 31 <strong>for</strong> details on <strong>the</strong> Rating Methodology<br />
Industry Allocation <strong>of</strong> Equity Holding (% <strong>of</strong> Net Assets)<br />
Finance 4.33<br />
Oil 4.25<br />
Chemicals 2.06<br />
S<strong>of</strong>tware 1.73<br />
Paper Products 1.03<br />
Ferrous Metals 0.80<br />
Textiles - Syn<strong>the</strong>tic 0.73<br />
Industrial Products 0.40<br />
Engineering 0.19<br />
Std Deviation<br />
Beta Sharpe Ratio*<br />
Risk Ratio (<strong>for</strong> <strong>the</strong> 3-yr period ended <strong>July</strong> 31, 20<strong>08</strong>) 6.40% 0.9430 0.52<br />
Source : CRISIL <strong>Fund</strong> Analyser<br />
* Risk-free rate assumed to be 9.40% (364-day Treasury Bill yield on 31-07-<strong>08</strong>)<br />
Intouchmutually<br />
Date Period NAV Returns Benchmark<br />
per Unit (Rs.) (%)^ Returns (%)#<br />
Jan 31, <strong>08</strong> Last Six <strong>month</strong>s (182 days) 188.420 -19.48* -20.52*<br />
Jul 31, 07 Last 1 Year (366 days) 172.325 -11.93** -8.62**<br />
Jul 29, 05 Last 3 Years (1098 days) 81.031 23.18** 19.41**<br />
Jul 31, 03 Last 5 Years (1827 days) 31.775 36.66** 29.75**<br />
Jul 31, 98 Last 10 Years (3653 days) 7.490 35.07** 18.70**<br />
Jan 01, 95 Since Inception (4960 days) 10.000 22.15** 9.77**<br />
^Past per<strong>for</strong>mance may or may not be sustained in <strong>the</strong> future<br />
Per<strong>for</strong>mance <strong>of</strong> <strong>the</strong> Dividend Plan <strong>for</strong> <strong>the</strong> investor would be net <strong>of</strong> Distribution Tax as applicable<br />
* Absolute Returns ** Compounded Annualised Returns<br />
#S&P CNX 500 (Please refer to page no 31)<br />
Portfolio – Top 10 Holdings (as at <strong>July</strong> 31, 20<strong>08</strong>)<br />
Company Industry + / Rating % to NAV<br />
EQUITY & EQUITY RELATED<br />
ICICI Bank Ltd. Banks 8.73<br />
Oil & Natural Gas Corporation Ltd. Oil 6.09<br />
State Bank <strong>of</strong> India Banks 5.71<br />
Divi’s Laboratories Ltd. Pharmaceuticals 4.48<br />
Crompton Greaves Ltd. Industrial Capital Goods 4.32<br />
Larsen & Toubro Ltd. Industrial Capital Goods 4.27<br />
United Phosphorus Ltd. Pesticides 4.23<br />
Punj Lloyd Ltd. Construction 3.82<br />
Hero Honda Motors Ltd. Auto 3.47<br />
Bank <strong>of</strong> Baroda Banks 3.22<br />
Total <strong>of</strong> Top Ten Equity Holdings 48.34<br />
Total Equity & Equity Related Holdings 98.40<br />
Debt / Money Market Instrument<br />
ICICI Bank Ltd. A1+ 0.29<br />
Total Debt / Money Market Instrument 0.29<br />
O<strong>the</strong>r Current Assets (Including Reverse Repos’ / CBLO) 1.31<br />
Grand Total 100.00<br />
Net Assets (Rs. In Lakhs) 359,7<strong>08</strong>.77<br />
Portfolio Turnover Ratio (Last 1 Year) 93.20%<br />
+ Industry Classification as recommended by AMFI<br />
Banks 20.49<br />
Industrial Capital Goods 14.88<br />
Pharmaceuticals 13.80<br />
Consumer Non Durables 8.74<br />
Media & Entertainment 7.76<br />
Construction 6.99<br />
Oil 6.09<br />
Auto Ancillaries 4.94<br />
Pesticides 4.23<br />
✤ Past per<strong>for</strong>mance is no guarantee <strong>of</strong> future results.<br />
♓ Please refer to page no 31 <strong>for</strong> details on <strong>the</strong> Rating Methodology<br />
Industry Allocation <strong>of</strong> Equity Holding (% <strong>of</strong> Net Assets)<br />
Auto 3.47<br />
S<strong>of</strong>tware 1.70<br />
Ferrous Metals 1.57<br />
Hardware 1.38<br />
Textiles - Silk 0.70<br />
Petroleum Products 0.68<br />
Chemicals 0.61<br />
Textiles - Syn<strong>the</strong>tic 0.37<br />
Std Deviation<br />
Beta Sharpe Ratio*<br />
Risk Ratio (<strong>for</strong> <strong>the</strong> 3-yr period ended <strong>July</strong> 31, 20<strong>08</strong>) 6.40% 0.9120 0.52<br />
Source : CRISIL <strong>Fund</strong> Analyser<br />
* Risk-free rate assumed to be 9.40% (364-day Treasury Bill yield on 31-07-<strong>08</strong>)<br />
<strong>July</strong> 20<strong>08</strong> 11
hdfc-eq-r.qxd 8/8/20<strong>08</strong> 3:37 PM Page 2<br />
<strong>HDFC</strong> Top<br />
200 <strong>Fund</strong><br />
IN EQUITY - DIVERSIFIED CATEGORY<br />
(114 schemes) <strong>for</strong> 3 and 5 year<br />
periods ending <strong>July</strong> 31, 20<strong>08</strong><br />
An open-ended growth scheme<br />
<strong>HDFC</strong> Capital<br />
Builder <strong>Fund</strong><br />
An open-ended growth scheme<br />
NAV (as at <strong>July</strong> 31, 20<strong>08</strong>)<br />
Relative Per<strong>for</strong>mance ^ (Growth Plan)<br />
NAV per Unit (Rs.)<br />
Growth Plan 123.902<br />
Dividend Plan 36.698<br />
NAV (as at <strong>July</strong> 31, 20<strong>08</strong>)<br />
NAV per Unit (Rs.)<br />
Growth Plan 67.228<br />
Dividend Plan 21.226<br />
Relative Per<strong>for</strong>mance ^ (Growth Plan)<br />
Date Period NAV Returns Benchmark<br />
per Unit (Rs.) (%) $$^ Returns (%)#<br />
Jan 31, <strong>08</strong> Last Six <strong>month</strong>s (182 days) 147.718 -16.12* -21.58*<br />
Jul 31, 07 Last 1 Year (366 days) 127.614 -2.90** -7.64**<br />
Jul 29, 05 Last 3 Years (1098 days) 60.758 26.73** 21.31**<br />
Jul 31, 03 Last 5 Years (1827 days) 24.240 38.53** 29.93**<br />
Jul 31, 98 Last 10 Years (3653 days) 13.384 27.40** 18.33**<br />
Oct 11, 96 Since Inception (4311 days) 10.000 25.85** 15.67**<br />
^Past per<strong>for</strong>mance may or may not be sustained in <strong>the</strong> future<br />
Per<strong>for</strong>mance <strong>of</strong> <strong>the</strong> Dividend Plan <strong>for</strong> <strong>the</strong> investor would be net <strong>of</strong> Distribution Tax as applicable<br />
* Absolute Returns ** Compounded Annualised Returns #BSE 200<br />
$$ Adjusted <strong>for</strong> <strong>the</strong> dividends declared under <strong>the</strong> scheme prior to its splittng into <strong>the</strong> Dividend<br />
and Growth Plans<br />
Portfolio – Top 10 Holdings (as at <strong>July</strong> 31, 20<strong>08</strong>)<br />
Company / Issuer Industry + % to NAV<br />
EQUITY & EQUITY RELATED<br />
ICICI Bank Ltd. Banks 6.69<br />
Oil & Natural Gas Corporation Ltd. Oil 5.06<br />
Reliance Industries Ltd. Petroleum Products 4.39<br />
Infosys Technologies Ltd. S<strong>of</strong>tware 4.27<br />
Larsen & Toubro Ltd. Industrial Capital Goods 4.26<br />
State Bank <strong>of</strong> India Banks 3.34<br />
Bharti Airtel Ltd. Telecom - Services 3.33<br />
Crompton Greaves Ltd. Industrial Capital Goods 3.11<br />
Housing Development Finance Corporation Ltd.$ Finance 3.02<br />
ITC Ltd. Consumer Non Durables 2.97<br />
Total <strong>of</strong> Top Ten Equity Holdings 40.44<br />
Total Equity & Equity Related Holdings 98.05<br />
O<strong>the</strong>r Current Assets (Including Reverse Repos’ / CBLO) 1.95<br />
Grand Total 100.00<br />
Net Assets (Rs. In Lakhs) 226,399.74<br />
Date Period NAV Returns Benchmark<br />
per Unit (Rs.) (%)^ Returns (%)#<br />
Jan 31, <strong>08</strong> Last Six <strong>month</strong>s (182 days) 88.367 -23.92* -20.52*<br />
Jul 31, 07 Last 1 Year (366 days) 76.914 -12.56** -8.62**<br />
Jul 29, 05 Last 3 Years (1098 days) 41.820 17.09** 19.41**<br />
Jul 31, 03 Last 5 Years (1827 days) 14.159 36.51** 29.75**<br />
Jul 31, 98 Last 10 Years (3653 days) 7.690 24.19** 18.70**<br />
Feb 01, 94 Since Inception (5294 days) 10.000 14.04** 8.47**<br />
^Past per<strong>for</strong>mance may or may not be sustained in <strong>the</strong> future<br />
Per<strong>for</strong>mance <strong>of</strong> <strong>the</strong> Dividend Plan <strong>for</strong> <strong>the</strong> investor would be net <strong>of</strong> Distribution Tax as applicable<br />
#S&P CNX 500 (Please refer to page no 31)<br />
** Compounded Annualised Returns<br />
* Absolute Returns<br />
Portfolio – Top 10 Holdings (as at <strong>July</strong> 31, 20<strong>08</strong>)<br />
Company Industry + % to NAV<br />
EQUITY & EQUITY RELATED<br />
ICICI Bank Ltd. Banks 6.15<br />
State Bank <strong>of</strong> India Banks 5.77<br />
Bharat Heavy Electricals Ltd. Industrial Capital Goods 4.81<br />
Exide Industries Ltd. Auto Ancillaries 4.60<br />
Crompton Greaves Ltd. Industrial Capital Goods 4.60<br />
Reliance Industries Ltd. Petroleum Products 3.94<br />
IPCA Laboratories Ltd. Pharmaceuticals 3.94<br />
Pidilite Industries Ltd. Consumer Non Durables 3.87<br />
Blue Star Ltd. Consumer Durables 3.83<br />
Britannia Industries Ltd. Consumer Non Durables 3.68<br />
Total <strong>of</strong> Top Ten Equity Holdings 45.19<br />
Total Equity & Equity Related Holdings 93.81<br />
O<strong>the</strong>r Current Assets (Including Reverse Repos’ / CBLO) 6.19<br />
Grand Total 100.00<br />
Net Assets (Rs. In Lakhs) 55,998.65<br />
Portfolio Turnover Ratio (Last 1 Year) 107.49%<br />
+ Industry Classification as recommended by AMFI, $ Sponsor<br />
✤ Past per<strong>for</strong>mance is no guarantee <strong>of</strong> future results.<br />
♓ Please refer to page no 31 <strong>for</strong> details on <strong>the</strong> Rating Methodology<br />
Industry Allocation <strong>of</strong> Equity Holding (% <strong>of</strong> Net Assets)<br />
Banks 17.81 Finance 3.02<br />
Industrial Capital Goods 13.97 Auto Ancillaries 2.44<br />
Consumer Non Durables 10.79 Pesticides 2.37<br />
Pharmaceuticals 9.59 Ferrous Metals 2.09<br />
S<strong>of</strong>tware 7.92 Transportation 1.45<br />
Petroleum Products 6.09 Media & Entertainment 1.39<br />
Oil 5.06 Gas 0.83<br />
Construction 4.68 Hardware 0.52<br />
Auto 4.22 Brewers 0.48<br />
Telecom - Services 3.33<br />
Std Deviation<br />
Beta Sharpe Ratio*<br />
Risk Ratio (<strong>for</strong> <strong>the</strong> 3-yr period ended <strong>July</strong> 31, 20<strong>08</strong>) 6.00% 0.8910 0.58<br />
Source : CRISIL <strong>Fund</strong> Analyser<br />
* Risk-free rate assumed to be 9.40% (364-day Treasury Bill yield on 31-07-<strong>08</strong>)<br />
Portfolio Turnover Ratio (Last 1 Year) 71.71%<br />
+ Industry Classification as recommended by AMFI<br />
Industry Allocation <strong>of</strong> Equity Holding (% <strong>of</strong> Net Assets)<br />
Industrial Capital Goods 19.60 Auto 3.33<br />
Banks 14.19 Telecom - Services 2.85<br />
Consumer Non Durables 10.99 Finance 2.76<br />
Pharmaceuticals 9.78 Gas 2.69<br />
S<strong>of</strong>tware 4.76 Construction 2.41<br />
Auto Ancillaries 4.60 Chemicals 1.99<br />
Petroleum Products 3.94 Ferrous Metals 1.61<br />
Consumer Durables 3.83 Textiles - Silk 0.69<br />
Industrial Products 3.79<br />
Std Deviation<br />
Beta Sharpe Ratio*<br />
Risk Ratio (<strong>for</strong> <strong>the</strong> 3-yr period ended <strong>July</strong> 31, 20<strong>08</strong>) 7.30% 0.9690 0.42<br />
Source : CRISIL <strong>Fund</strong> Analyser<br />
* Risk-free rate assumed to be 9.40% (364-day Treasury Bill yield on 31-07-<strong>08</strong>)<br />
12 <strong>July</strong> 20<strong>08</strong> Intouchmutually
hdfc-eq-r.qxd 8/8/20<strong>08</strong> 3:37 PM Page 3<br />
<strong>HDFC</strong> Core & Satellite <strong>Fund</strong><br />
An open-ended growth scheme<br />
<strong>HDFC</strong> Premier Multi-Cap <strong>Fund</strong><br />
An open-ended growth scheme<br />
NAV (as at <strong>July</strong> 31, 20<strong>08</strong>)<br />
NAV per Unit (Rs.)<br />
Growth Option 23.607<br />
Dividend Option 16.256<br />
Relative Per<strong>for</strong>mance ^ (Growth Option)<br />
NAV (as at <strong>July</strong> 31, 20<strong>08</strong>)<br />
Relative Per<strong>for</strong>mance ^ (Growth Option)<br />
NAV per Unit (Rs.)<br />
Growth Option 17.746<br />
Dividend Option 12.251<br />
Date Period NAV Returns Benchmark<br />
per Unit (Rs.) (%)^ Returns (%)#<br />
Jan 31, <strong>08</strong> Last Six <strong>month</strong>s (182 days) 31.834 -25.84* -21.58*<br />
Jul 31, 07 Last 1 Year (366 days) 28.547 -17.26** -7.64**<br />
Jul 29, 05 Last 3 Years (1098 days) 14.785 16.83** 21.31**<br />
Sep 17, 04 Since Inception (1413 days) 10.000 24.84** 25.56**<br />
^Past per<strong>for</strong>mance may or may not be sustained in <strong>the</strong> future<br />
Per<strong>for</strong>mance <strong>of</strong> <strong>the</strong> Dividend Option <strong>for</strong> <strong>the</strong> investor would be net <strong>of</strong> Distribution Tax as applicable<br />
*Absolute Returns #BSE 200 ** Compounded Annualised Returns<br />
Portfolio – Top 10 Holdings (as at <strong>July</strong> 31, 20<strong>08</strong>)<br />
Company Industry + % to NAV<br />
EQUITY & EQUITY RELATED<br />
United Phosphorus Ltd. Pesticides 6.69<br />
ICICI Bank Ltd. Banks 6.40<br />
State Bank <strong>of</strong> India Banks 5.93<br />
Crompton Greaves Ltd. Industrial Capital Goods 5.27<br />
Amtek Auto Ltd. Auto Ancillaries 3.74<br />
ITC Ltd. Consumer Non Durables 3.65<br />
Larsen & Toubro Ltd. Industrial Capital Goods 3.64<br />
Dishman Pharma & Chemicals Ltd. Pharmaceuticals 3.54<br />
Zee Entertainment Enterprises Ltd. Media & Entertainment 3.38<br />
Bharti Airtel Ltd. Telecom - Services 3.16<br />
Total <strong>of</strong> Top Ten Equity Holdings 45.40<br />
Total Equity & Equity Related Holdings 91.18<br />
O<strong>the</strong>r Current Assets (Including Reverse Repos’ / CBLO) 8.82<br />
Grand Total 100.00<br />
Net Assets (Rs. In Lakhs) 35,839.04<br />
Date Period NAV Returns Benchmark<br />
per Unit (Rs.) (%)^ Returns (%)#<br />
Jan 31, <strong>08</strong> Last Six <strong>month</strong>s (182 days) 22.894 -22.49* -20.52*<br />
Jul 31, 07 Last 1 Year (366 days) 21.130 -15.98** -8.62**<br />
Jul 29, 05 Last 3 Years (1098 days) 11.695 14.87** 19.41**<br />
Apr 06, 05 Since Inception (1212 days) 10.000 18.86** 21.57**<br />
^Past per<strong>for</strong>mance may or may not be sustained in <strong>the</strong> future<br />
Per<strong>for</strong>mance <strong>of</strong> <strong>the</strong> Dividend Option <strong>for</strong> <strong>the</strong> investor would be net <strong>of</strong> Distribution Tax as applicable<br />
* Absolute Returns ** Compounded Annualised Returns<br />
#S&P CNX 500 (Please refer to page no 31)<br />
Portfolio – Top 10 Holdings (as at <strong>July</strong> 31, 20<strong>08</strong>)<br />
Company / Issuer Industry + % to NAV<br />
EQUITY & EQUITY RELATED<br />
ICICI Bank Ltd. Banks 7.14<br />
Crompton Greaves Ltd. Industrial Capital Goods 6.29<br />
State Bank <strong>of</strong> India Banks 5.72<br />
Oil & Natural Gas Corporation Ltd. Oil 5.58<br />
United Phosphorus Ltd. Pesticides 5.52<br />
AIA Engineering Ltd. Industrial Capital Goods 4.43<br />
ITC Ltd. Consumer Non Durables 3.35<br />
Sun Pharmaceutical Industries Ltd. Pharmaceuticals 3.16<br />
Bharti Airtel Ltd. Telecom - Services 3.13<br />
Amtek Auto Ltd. Auto Ancillaries 3.04<br />
Total <strong>of</strong> Top Ten Equity Holdings 47.36<br />
Total Equity & Equity Related Holdings 92.26<br />
O<strong>the</strong>r Current Assets (Including Reverse Repos’ / CBLO) 7.74<br />
Grand Total 100.00<br />
Net Assets (Rs. In Lakhs) 44,632.27<br />
+ Industry Classification as recommended by AMFI<br />
Portfolio Turnover Ratio (Last 1 Year) 57.16%<br />
Portfolio Turnover Ratio (Last 1 Year) 56.90%<br />
+ Industry Classification as recommended by AMFI Industry Allocation <strong>of</strong> Equity Holding (% <strong>of</strong> Net Assets)<br />
Industry Allocation <strong>of</strong> Equity Holding (% <strong>of</strong> Net Assets)<br />
Industrial Capital Goods 18.60<br />
Banks 18.34<br />
Banks 16.73<br />
Pharmaceuticals 9.60<br />
Industrial Capital Goods 11.58 Consumer Non Durables 6.99<br />
Pharmaceuticals 9.10 Oil 5.58<br />
Media & Entertainment 8.75 Pesticides 5.52<br />
Consumer Non Durables 7.02 Media & Entertainment 4.55<br />
Pesticides 6.69<br />
Petroleum Products 4.40<br />
Auto 3.99<br />
Auto Ancillaries 6.44 Telecom - Services 3.13<br />
Petroleum Products 5.77 Auto Ancillaries 3.04<br />
Telecom - Services 3.16 Brewers 2.87<br />
Power 3.09 Metals - Aluminium 1.70<br />
Oil 2.78 Power 1.57<br />
Industrial Products 2.34 S<strong>of</strong>tware 1.28<br />
Construction 2.26<br />
Construction 1.21<br />
Transportation 0.94<br />
Consumer Durables 2.<strong>08</strong><br />
Ferrous Metals 0.40<br />
Brewers 1.78 Retailing 0.16<br />
Std Deviation<br />
Beta Sharpe Ratio*<br />
Risk Ratio (<strong>for</strong> <strong>the</strong> 3-yr period ended <strong>July</strong> 31, 20<strong>08</strong>) 6.40% 0.9090 0.53<br />
Source : CRISIL <strong>Fund</strong> Analyser<br />
* Risk-free rate assumed to be 9.40% (364-day Treasury Bill yield on 31-07-<strong>08</strong>)<br />
Std Deviation<br />
Beta Sharpe Ratio*<br />
Risk Ratio (<strong>for</strong> <strong>the</strong> 2-yr period ended <strong>July</strong> 31, 20<strong>08</strong>) 6.20% 0.8910 0.46<br />
Source : CRISIL <strong>Fund</strong> Analyser<br />
* Risk-free rate assumed to be 9.40% (364-day Treasury Bill yield on 31-07-<strong>08</strong>)<br />
Intouchmutually<br />
<strong>July</strong> 20<strong>08</strong> 13
hdfc-eq-r.qxd 8/8/20<strong>08</strong> 3:37 PM Page 4<br />
<strong>HDFC</strong> Index <strong>Fund</strong><br />
An open-ended index linked scheme<br />
<strong>HDFC</strong> Index <strong>Fund</strong><br />
An open-ended index linked scheme<br />
SENSEX Plan (Face Value per Unit: Rs. 32.161)<br />
NAV (as at <strong>July</strong> 31, 20<strong>08</strong>)<br />
NAV per Unit (Rs.)<br />
Growth Option 124.7425<br />
Relative Per<strong>for</strong>mance ^<br />
NIFTY Plan (Face Value per Unit: Rs. 10.326)<br />
NAV (as at <strong>July</strong> 31, 20<strong>08</strong>)<br />
NAV per Unit (Rs.)<br />
Growth Option 38.5692<br />
Relative Per<strong>for</strong>mance ^<br />
Date Period NAV Returns Benchmark<br />
per Unit (Rs.) (%)^ Returns (%)#<br />
Jan 31, <strong>08</strong> Last Six <strong>month</strong>s (182 days) 154.2977 -19.15* -17.67*<br />
Jul 31, 07 Last 1 Year (366 days) 142.2509 -12.28** -5.82**<br />
Jul 29, 05 Last 3 Years (1098 days) 72.0660 20.01** 26.38**<br />
Jul 31, 03 Last 5 Years (1827 days) 38.3030 26.60** 34.18**<br />
Jul 17, 02 Since Inception (2206 days) 32.1610^^ 25.14** 31.42**<br />
^Past per<strong>for</strong>mance may or may not be sustained in <strong>the</strong> future<br />
* Absolute Returns ** Compounded Annualised Returns<br />
#SENSEX (Total Returns Index)<br />
^^Face Value per Unit<br />
Portfolio – Top 10 Holdings (as at <strong>July</strong> 31, 20<strong>08</strong>)<br />
Company Industry + % to NAV<br />
EQUITY & EQUITY RELATED<br />
Reliance Industries Ltd. Petroleum Products 15.46<br />
Infosys Technologies Ltd. S<strong>of</strong>tware 7.42<br />
ICICI Bank Ltd. Banks 6.81<br />
Larsen & Toubro Ltd. Industrial Capital Goods 6.60<br />
Housing Development Finance Corporation Ltd.$ Finance 5.30<br />
Bharti Airtel Ltd. Telecom - Services 5.12<br />
ITC Ltd. Consumer Non Durables 4.78<br />
Oil & Natural Gas Corporation Ltd. Oil 4.11<br />
State Bank <strong>of</strong> India Banks 3.90<br />
<strong>HDFC</strong> Bank Ltd. Banks 3.81<br />
Total <strong>of</strong> Top Ten Equity Holdings 63.31<br />
Total Equity & Equity Related Holdings 96.97<br />
O<strong>the</strong>r Current Assets (Including Reverse Repos’ / CBLO) 3.03<br />
Grand Total 100.00<br />
Net Assets (Rs. In Lakhs) 5,191.34<br />
Portfolio Turnover Ratio (Last 1 Year) 114.06%<br />
+ Industry Classification as recommended by AMFI $ Sponsor<br />
Date Period NAV Returns Benchmark<br />
per Unit (Rs.) (%)^ Returns (%)#<br />
Jan 31, <strong>08</strong> Last Six <strong>month</strong>s (182 days) 46.6758 -17.37* -15.18*<br />
Jul 31, 07 Last 1 Year (366 days) 43.5962 -11.50** -3.38**<br />
Jul 29, 05 Last 3 Years (1098 days) 22.8070 19.<strong>08</strong>** 24.94**<br />
Jul 31, 03 Last 5 Years (1827 days) 12.0020 26.27** 31.64**<br />
Jul 17, 02 Since Inception (2206 days) 10.3260^^ 24.36** 28.90**<br />
^Past per<strong>for</strong>mance may or may not be sustained in <strong>the</strong> future<br />
* Absolute Returns ** Compounded Annualised Returns<br />
#S&P CNX Nifty (Total Returns Index)<br />
^^Face Value per Unit<br />
Portfolio – Top 10 Holdings (as at <strong>July</strong> 31, 20<strong>08</strong>)<br />
Company Industry + % to NAV<br />
EQUITY & EQUITY RELATED<br />
Reliance Industries Ltd. Petroleum Products 11.81<br />
Oil & Natural Gas Corporation Ltd. Oil 7.85<br />
Bharti Airtel Ltd. Telecom - Services 5.58<br />
National Thermal Power Corporation Power 5.17<br />
Reliance Communication Ltd. Telecom - Services 3.80<br />
Infosys Technologies Ltd. S<strong>of</strong>tware 3.34<br />
State Bank <strong>of</strong> India Banks 3.31<br />
DLF Ltd. Construction 3.21<br />
Bharat Heavy Electricals Ltd. Industrial Capital Goods 3.03<br />
Tata Consultancy Services Ltd. S<strong>of</strong>tware 3.00<br />
Total <strong>of</strong> Top Ten Equity Holdings 50.10<br />
Total Equity & Equity Related Holdings 96.32<br />
O<strong>the</strong>r Current Assets (Including Reverse Repos’ / CBLO) 3.68<br />
Grand Total 100.00<br />
Net Assets (Rs. In Lakhs) 2,468.17<br />
Portfolio Turnover Ratio (Last 1 Year) 318.59%<br />
+ Industry Classification as recommended by AMFI<br />
Industry Allocation <strong>of</strong> Equity Holding (% <strong>of</strong> Net Assets)<br />
Industry Allocation <strong>of</strong> Equity Holding (% <strong>of</strong> Net Assets) Petroleum Products 14.97 Ferrous Metals 3.90<br />
Telecom - Services 10.71 Pharmaceuticals 2.72<br />
Petroleum Products 15.46 Oil 4.11<br />
S<strong>of</strong>tware 10.02 Finance 2.39<br />
Banks 14.52 Ferrous Metals 3.23<br />
Oil 9.53 Auto 2.24<br />
S<strong>of</strong>tware 12.89 Auto 2.68<br />
Power 8.42 Metals - Aluminium 1.65<br />
Industrial Capital Goods 9.38 Construction 2.32<br />
Industrial Capital Goods 8.34 Non - Ferrous Metals 1.63<br />
Telecom - Services 8.61 Cement 1.84<br />
Consumer Non Durables 7.30 Metals - Aluminium 1.74<br />
Banks 8.16 Cement 1.46<br />
Finance 5.30 Pharmaceuticals 1.26 Consumer Non Durables 4.51 Gas 1.17<br />
Power 5.16 Non - Ferrous Metals 1.17 Construction 4.19 Media & Entertainment 0.31<br />
Tracking Error Since Inception (Annualised) 2.40% Tracking Error Since Inception (Annualised) 2.93%<br />
14 <strong>July</strong> 20<strong>08</strong> Intouchmutually
hdfc-eq-r.qxd 8/8/20<strong>08</strong> 3:37 PM Page 5<br />
<strong>HDFC</strong> Index <strong>Fund</strong><br />
An open-ended index linked scheme<br />
<strong>HDFC</strong> Arbitrage <strong>Fund</strong><br />
An open-ended equity <strong>Fund</strong><br />
SENSEX Plus Plan (Face Value per Unit: Rs. 32.161)<br />
NAV (as at <strong>July</strong> 31, 20<strong>08</strong>)<br />
Relative Per<strong>for</strong>mance ^<br />
Date Period NAV Returns Benchmark<br />
per Unit (Rs.) (%)^ Returns (%)#<br />
Jan 31, <strong>08</strong> Last Six <strong>month</strong>s (182 days) 186.0467 -17.85* -17.67*<br />
Jul 31, 07 Last 1 Year (366 days) 167.9078 -8.95** -5.82**<br />
Jul 29, 05 Last 3 Years (1098 days) 83.3850 22.31** 26.38**<br />
Jul 31, 03 Last 5 Years (1827 days) 39.2670 31.19** 34.18**<br />
Jul 17, 02 Since Inception (2206 days) 32.1610^^ 29.42** 31.42**<br />
^Past per<strong>for</strong>mance may or may not be sustained in <strong>the</strong> future<br />
* Absolute Returns ** Compounded Annualised Returns<br />
#SENSEX (Total Returns Index)<br />
^^ Face Value per Unit<br />
Portfolio – Top 10 Holdings (as at <strong>July</strong> 31, 20<strong>08</strong>)<br />
NAV per Unit (Rs.)<br />
Growth Option 152.8398<br />
Company Industry + % to NAV<br />
EQUITY & EQUITY RELATED<br />
Reliance Industries Ltd. Petroleum Products 10.36<br />
ICICI Bank Ltd. Banks 7.27<br />
State Bank <strong>of</strong> India Banks 7.22<br />
Bharti Airtel Ltd. Telecom - Services 6.61<br />
Infosys Technologies Ltd. S<strong>of</strong>tware 6.42<br />
Larsen & Toubro Ltd. Industrial Capital Goods 5.71<br />
ITC Ltd. Consumer Non Durables 4.65<br />
Housing Development Finance Corporation Ltd.$ Finance 4.58<br />
Dr Reddy’s Laboratories Ltd. Pharmaceuticals 4.04<br />
Oil & Natural Gas Corporation Ltd. Oil 3.55<br />
Total <strong>of</strong> Top Ten Equity Holdings 60.41<br />
Total Equity & Equity Related Holdings 94.04<br />
O<strong>the</strong>r Current Assets (Including Reverse Repos’ / CBLO) 5.96<br />
Grand Total 100.00<br />
Net Assets (Rs. In Lakhs) 3,660.09<br />
Portfolio Turnover Ratio (Last 1 Year) 270.37%<br />
+ Industry Classification as recommended by AMFI<br />
$ Sponsor<br />
Industry Allocation <strong>of</strong> Equity Holding (% <strong>of</strong> Net Assets)<br />
Banks 17.09<br />
S<strong>of</strong>tware 11.16<br />
Petroleum Products 10.36<br />
Consumer Non Durables 8.54<br />
Industrial Capital Goods 8.43<br />
Pharmaceuticals 8.28<br />
Telecom - Services 8.11<br />
Finance 4.58<br />
Oil 3.55<br />
Ferrous Metals 2.80<br />
Auto 2.32<br />
Transportation 2.29<br />
Auto Ancillaries 2.06<br />
Construction 2.01<br />
Power 0.84<br />
Consumer Durables 0.81<br />
Cement 0.52<br />
Non - Ferrous Metals 0.29<br />
NAV (as at <strong>July</strong> 31, 20<strong>08</strong>)<br />
Relative Per<strong>for</strong>mance ^ - Growth Option<br />
NAV per Unit (Rs.)<br />
Retail Plan<br />
Growth Option 10.580<br />
Monthly Dividend Option 10.049<br />
Quarterly Dividend Option 10.049<br />
Wholesale Plan<br />
Growth Option 10.602<br />
Monthly Dividend Option 10.052<br />
Quarterly Dividend Option 10.052<br />
Date Period NAV Returns Benchmark<br />
per Unit (Rs.) (%)^ Returns (%)#<br />
Retail Plan<br />
Jan 31, <strong>08</strong> Last Six <strong>month</strong>s (182 days) 10.264 3.<strong>08</strong>* 3.69*<br />
Oct 23, 07 Since Inception (282 days) 10.000 5.80* 5.45*<br />
Wholesale Plan<br />
Jan 31, <strong>08</strong> Last Six <strong>month</strong>s (182 days) 10.271 3.22* 3.69*<br />
Oct 23, 07 Since Inception (282 days) 10.000 6.02* 5.45*<br />
^Past per<strong>for</strong>mance may or may not be sustained in <strong>the</strong> future<br />
Per<strong>for</strong>mance <strong>of</strong> <strong>the</strong> Dividend Option <strong>for</strong> <strong>the</strong> investor would be net <strong>of</strong> Distribution Tax as applicable<br />
* Absolute Returns #CRISIL Liquid <strong>Fund</strong> Index<br />
Portfolio – Top 10 Holdings (as at <strong>July</strong> 31, 20<strong>08</strong>)<br />
Company / Issuer Industry + % to NAV<br />
EQUITY & EQUITY RELATED<br />
Hindalco Industries Ltd. Non - Ferrous Metals 3.20<br />
India Cements Ltd. Cement 3.<strong>08</strong><br />
Welspun-Gujarat Stahl Rohren Ltd. Ferrous Metals 2.28<br />
Chennai Petroleum Corporation Ltd. Petroleum Products 2.18<br />
Reliance Industries Ltd. Petroleum Products 2.11<br />
Mahanagar Telephone Nigam Ltd. Telecom - Services 2.05<br />
Century Textiles & Industries Ltd. Cement 2.04<br />
Jindal Steel & Power Ltd. Ferrous Metals 1.95<br />
GTL Ltd. S<strong>of</strong>tware 1.94<br />
Adlabs Films Ltd. Media & Entertainment 1.78<br />
Total <strong>of</strong> Top Ten Equity Holdings 22.61<br />
Total Equity & Equity Related Holdings 70.64<br />
O<strong>the</strong>r Current Assets (Including Reverse Repos’ / CBLO) 29.36<br />
Grand Total 100.00<br />
Net Assets (Rs. In Lakhs) 42,146.77<br />
Portfolio Turnover Ratio (Last 1 Year) 3<strong>08</strong>.11%<br />
+ Industry Classification as recommended by AMFI<br />
Industry Allocation <strong>of</strong> Equity Holding (% <strong>of</strong> Net Assets)<br />
Banks 7.57<br />
Telecom - Services 6.18<br />
Petroleum Products 6.17<br />
Ferrous Metals 5.99<br />
Cement 5.20<br />
Finance 4.86<br />
S<strong>of</strong>tware 4.00<br />
Construction 3.91<br />
Non - Ferrous Metals 3.20<br />
Textile Products 2.90<br />
Consumer Non Durables 2.87<br />
Media & Entertainment 2.65<br />
Industrial Capital Goods 2.12<br />
Power 1.96<br />
Pharmaceuticals 1.52<br />
Chemicals 1.42<br />
Consumer Durables 1.27<br />
Transportation 1.13<br />
Auto Ancillaries 0.93<br />
Retailing 0.78<br />
Gas 0.68<br />
Minerals/Mining 0.68<br />
Auto 0.67<br />
Hotels 0.56<br />
Metals - Aluminium 0.47<br />
Brewers 0.36<br />
Oil 0.29<br />
Paper Products 0.20<br />
Industrial Products 0.06<br />
Fertilisers 0.03<br />
Aviation 0.01<br />
Intouchmutually<br />
<strong>July</strong> 20<strong>08</strong> 15
hdfc-eq-r.qxd 8/8/20<strong>08</strong> 3:37 PM Page 6<br />
<strong>HDFC</strong> Balanced <strong>Fund</strong><br />
An open-ended balanced scheme<br />
NAV (as at <strong>July</strong> 31, 20<strong>08</strong>)<br />
NAV per Unit (Rs.)<br />
Growth Plan 33.229<br />
Dividend Plan 16.729<br />
Relative Per<strong>for</strong>mance ^ (Growth Plan)<br />
<strong>HDFC</strong><br />
Prudence <strong>Fund</strong><br />
NAV (as at <strong>July</strong> 31, 20<strong>08</strong>)<br />
An open-ended balanced scheme<br />
NAV per Unit (Rs.)<br />
Growth Plan 116.022<br />
Dividend Plan 23.435<br />
Relative Per<strong>for</strong>mance ^ (Growth Plan)<br />
IN HYBRID EQUITY - ORIENTED CATEGORY<br />
(26 schemes) <strong>for</strong> 3 and 5 year<br />
periods ending <strong>July</strong> 31, 20<strong>08</strong><br />
Date Period NAV Returns Benchmark<br />
per Unit (Rs.) (%)^ Returns (%)#<br />
Jan 31, <strong>08</strong> Last Six <strong>month</strong>s (182 days) 37.757 -11.99* -10.27*<br />
Jul 31, 07 Last 1 Year (366 days) 33.681 -1.34** -0.59**<br />
Jul 29, 05 Last 3 Years (1098 days) 21.953 14.77** 16.09**<br />
Jul 31, 03 Last 5 Years (1827 days) 12.237 22.09** 19.71**<br />
Sep 11, 00 Since Inception (2880 days) 10.000 16.44** N.A.<br />
^Past per<strong>for</strong>mance may or may not be sustained in <strong>the</strong> future<br />
Per<strong>for</strong>mance <strong>of</strong> <strong>the</strong> Dividend Plan <strong>for</strong> <strong>the</strong> investor would be net <strong>of</strong> Distribution Tax as applicable<br />
* Absolute Returns ** Compounded Annualised Returns<br />
N.A. Not Available<br />
#CRISIL Balanced <strong>Fund</strong> Index<br />
Portfolio – Top Holdings (as at <strong>July</strong> 31, 20<strong>08</strong>)<br />
Company / Issuer Industry + / Rating % to NAV<br />
EQUITY & EQUITY RELATED<br />
Coromandel Fertilisers Ltd. Fertilisers 8.33<br />
Reliance Industries Ltd. Petroleum Products 6.67<br />
Sun Pharmaceutical Industries Ltd. Pharmaceuticals 4.12<br />
Balkrishna Industries Ltd. Auto Ancillaries 3.91<br />
The Federal Bank Ltd. Banks 3.73<br />
ICICI Bank Ltd. Banks 3.41<br />
ITC Ltd. Consumer Non Durables 3.37<br />
Larsen & Toubro Ltd. Industrial Capital Goods 3.27<br />
Infosys Technologies Ltd. S<strong>of</strong>tware 3.<strong>08</strong><br />
Crompton Greaves Ltd. Industrial Capital Goods 3.01<br />
Total <strong>of</strong> Top Ten Equity Holdings 42.90<br />
Total Equity & Equity Related Holdings 69.16<br />
Debt / Money Market Instrument<br />
Housing Dev. Finance Corpn Ltd.$ AAA 4.56<br />
Indian Oil Corporation Ltd. LAA+ 4.52<br />
Loan Securitisation Trust - Grasim Industries Ltd. AAA(SO) 4.33<br />
Credit Asset Tr XVII (Shri Tra Fin) AA(SO) 3.84<br />
Loan Securitisation Trust - Bajaj Auto Ltd. AAA(SO) 3.54<br />
State Bank <strong>of</strong> India AAA 2.32<br />
Loan Securitisation Trust - Reliance Industries Ltd. AAA(SO) 0.96<br />
Total Debt / Money Market Instrument<br />
(aggregated holdings in a single issuer) 24.07<br />
O<strong>the</strong>r Current Assets (Including Reverse Repos’ / CBLO) 6.77<br />
Grand Total 100.00<br />
Net Assets (Rs. In Lakhs) 10,265.76<br />
Date Period NAV Returns Benchmark<br />
per Unit (Rs.) (%)$$^ Returns (%)#<br />
Jan 31, <strong>08</strong> Last Six <strong>month</strong>s (182 days) 144.739 -19.84* -10.27*<br />
Jul 31, 07 Last 1 Year (366 days) 130.200 -10.86** -0.59**<br />
Jul 29, 05 Last 3 Years (1098 days) 70.143 18.21** 16.09**<br />
Jul 31, 03 Last 5 Years (1827 days) 19.230 28.71** 19.71**<br />
Jul 31, 98 Last 10 Years (3653 days) 11.410 27.25** N.A.<br />
Feb 01, 94 Since Inception (5294 days) 10.000 20.53** N.A.<br />
^Past per<strong>for</strong>mance may or may not be sustained in <strong>the</strong> future<br />
Per<strong>for</strong>mance <strong>of</strong> <strong>the</strong> Dividend Plan <strong>for</strong> <strong>the</strong> investor would be net <strong>of</strong> Distribution Tax as applicable<br />
* Absolute Returns ** Compounded Annualised Returns #CRISIL Balanced <strong>Fund</strong> Index<br />
$$ Adjusted <strong>for</strong> <strong>the</strong> dividends declared under <strong>the</strong> scheme prior to its splittng into <strong>the</strong> Dividend<br />
and Growth Plans<br />
N.A. Not Available<br />
Portfolio – Top 10 Holdings (as at <strong>July</strong> 31, 20<strong>08</strong>)<br />
Company / Issuer Industry + / Rating % to NAV<br />
EQUITY & EQUITY RELATED<br />
ICICI Bank Ltd. Banks 5.40<br />
Oil & Natural Gas Corporation Ltd. Oil 3.76<br />
Crompton Greaves Ltd. Industrial Capital Goods 2.86<br />
AIA Engineering Ltd. Industrial Capital Goods 2.79<br />
Punj Lloyd Ltd. Construction 2.73<br />
GlaxoSmithkline Consumer Healthcare Consumer Non Durables 2.65<br />
United Phosphorus Ltd. Pesticides 2.49<br />
State Bank <strong>of</strong> India Banks 2.37<br />
Divi’s Laboratories Ltd. Pharmaceuticals 2.35<br />
Larsen& Toubro Ltd. Industrial Capital Goods 2.12<br />
Total <strong>of</strong> Top Ten Equity Holdings 29.52<br />
Total Equity & Equity Related Holdings 75.27<br />
Debt / Money Market Instrument<br />
National Bank <strong>for</strong> Agriculture & Rural Development AAA 3.80<br />
ICICI Bank Ltd. A1+/AAA 3.12<br />
Housing Development Finance Corporation Ltd.$ AAA 3.67<br />
State Bank <strong>of</strong> India AAA 2.36<br />
Sundaram Finance Ltd. LAA+ 1.85<br />
Axis Bank Ltd. AAA(I) 1.23<br />
Infrastructure Dev. Fin. Corp. Ltd. AAA/AAA(I) 1.00<br />
GE Capital Services India AAA 0.82<br />
L & T Finance Ltd AA+ 0.82<br />
Punjab National Bank** AAA 0.79<br />
Total <strong>of</strong> Top Ten Debt / Money Market Instrument<br />
(aggregated holdings in a single issuer) 18.67<br />
Total Debt / Money Market Instrument 22.92<br />
O<strong>the</strong>r Current Assets (Including Reverse Repos’ / CBLO) 1.81<br />
Grand Total 100.00<br />
Net Assets (Rs. In Lakhs) 242,500.58<br />
Portfolio Turnover Ratio (Last 1 Year) 72.71%<br />
+ Industry Classification as recommended by AMFI $ Sponsor<br />
✤ Past per<strong>for</strong>mance is no guarantee <strong>of</strong> future results.<br />
♓ Please refer to page no 31 <strong>for</strong> details on <strong>the</strong> Rating Methodology<br />
Portfolio Turnover Ratio (Last 1 Year) 38.22%<br />
+ Industry Classification as recommended by AMFI $ Sponsor<br />
Industry Allocation <strong>of</strong> Equity Holding (% <strong>of</strong> Net Assets)<br />
Industry Allocation <strong>of</strong> Equity Holding (% <strong>of</strong> Net Assets) Banks 12.81 Textile Products 1.44<br />
Industrial Capital Goods 9.80 Power 1.37<br />
Industrial Capital Goods 10.87 S<strong>of</strong>tware 3.<strong>08</strong> Pharmaceuticals 8.69 Chemicals 1.22<br />
Pharmaceuticals 8.90 Telecom - Services 2.33 Consumer Non Durables 8.38 Trading 1.20<br />
Banks 8.89 Construction 2.29 Construction 5.93 Auto 1.16<br />
Fertilisers 8.33 Power 2.17 Media & Entertainment 5.61 Paper Products 1.16<br />
Auto Ancillaries 6.96 Chemicals 1.90<br />
Auto Ancillaries 5.21 Petroleum Products 0.92<br />
Oil 3.76 Textiles - Silk 0.55<br />
Petroleum Products 6.67 Consumer Durables 1.83<br />
Industrial Products 3.16 Ferrous Metals 0.23<br />
Consumer Non Durables 4.94<br />
Pesticides 2.49 Textiles - Syn<strong>the</strong>tic 0.18<br />
16 <strong>July</strong> 20<strong>08</strong> Intouchmutually
hdfc-eq-r.qxd 8/8/20<strong>08</strong> 3:37 PM Page 7<br />
<strong>HDFC</strong> Children’s Gift <strong>Fund</strong><br />
An open-ended balanced scheme<br />
Investment Plan<br />
NAV (as at <strong>July</strong> 31, 20<strong>08</strong>)<br />
Relative Per<strong>for</strong>mance ^<br />
NAV per Unit (Rs.)<br />
Growth Option 25.455<br />
<strong>HDFC</strong> Children’s Gift <strong>Fund</strong><br />
An open-ended balanced scheme<br />
Savings Plan<br />
NAV (as at <strong>July</strong> 31, 20<strong>08</strong>)<br />
Relative Per<strong>for</strong>mance ^<br />
NAV per Unit (Rs.)<br />
Growth Option 16.274<br />
Date Period NAV Returns Benchmark<br />
per Unit (Rs.) (%)^$ Returns (%)#<br />
Jan 31, <strong>08</strong> Last Six <strong>month</strong>s (182 days) 28.349 -10.21* -10.27*<br />
Jul 31, 07 Last 1 Year (366 days) 27.565 -7.63** -0.59**<br />
Jul 29, 05 Last 3 Years (1098 days) 18.767 10.66** 16.09**<br />
Jul 31, 03 Last 5 Years (1827 days) 13.603 19.44** 19.71**<br />
Mar 02, 01 Since Inception (27<strong>08</strong> days) 10.000 17.50** N.A.<br />
^Past per<strong>for</strong>mance may or may not be sustained in <strong>the</strong> future<br />
* Absolute Returns ** Compounded Annualised Returns N.A. Not Available<br />
#CRISIL Balanced <strong>Fund</strong> Index $ Adjusted <strong>for</strong> bonus units declared under <strong>the</strong> scheme<br />
Portfolio – Top Holdings (as at <strong>July</strong> 31, 20<strong>08</strong>)<br />
Company / Issuer Industry + / Rating % to NAV<br />
EQUITY & EQUITY RELATED<br />
Reliance Industries Ltd. Petroleum Products 7.07<br />
Coromandel Fertilisers Ltd. Fertilisers 4.91<br />
Shanthi Gears Ltd. Industrial Products 3.69<br />
Biocon Ltd. Pharmaceuticals 3.59<br />
Sun Pharmaceutical Industries Ltd. Pharmaceuticals 3.57<br />
Blue Star Ltd. Consumer Durables 3.46<br />
Bharti Airtel Ltd. Telecom - Services 3.37<br />
Divi’s Laboratories Ltd. Pharmaceuticals 3.23<br />
Godawari Power & Ispat Ltd. Ferrous Metals 3.<strong>08</strong><br />
Satyam Computer Services Ltd. S<strong>of</strong>tware 3.07<br />
Total <strong>of</strong> Top Ten Equity Holdings 39.04<br />
Total Equity & Equity Related Holdings 73.71<br />
Debt / Money Market Instrument<br />
ICICI Bank Ltd. AAA 5.61<br />
JUS Trust - Jet Airways AAA(SO) 4.48<br />
M&M Financial Services Ltd. AA+ 3.81<br />
CREDIT ASSET TR XVII (SHRI TRA FIN) AA(SO) 3.02<br />
Sundaram Finance Ltd. AA+ 2.25<br />
Loan Securitisation Trust - Bajaj Auto Ltd. AAA(SO) 1.59<br />
Housing Dev. Finance Corpn Ltd.$ AAA 1.44<br />
TML FINANCIAL SERVICES LTD AA+ 1.35<br />
Loan Securitisation Trust - Grasim Industries Ltd. AAA(SO) 0.43<br />
Total Debt / Money Market Instrument<br />
(aggregated holdings in a single issuer) 23.98<br />
O<strong>the</strong>r Current Assets (Including Reverse Repos’ / CBLO) 2.31<br />
Grand Total 100.00<br />
Net Assets (Rs. In Lakhs) 13,045.89<br />
Portfolio Turnover Ratio (Last 1 Year) 50.09%<br />
+ Industry Classification as recommended by AMFI $ Sponsor<br />
Total outstanding position (as at <strong>July</strong> 31, 20<strong>08</strong>) in Derivative Instruments<br />
(Interest Rate Swaps) (Notional) Rs. 500 lakhs.<br />
Industry Allocation <strong>of</strong> Equity Holding (% <strong>of</strong> Net Assets)<br />
Industrial Capital Goods 10.97<br />
Pharmaceuticals 10.39<br />
Petroleum Products 7.07<br />
Consumer Non Durables 6.<strong>08</strong><br />
S<strong>of</strong>tware 5.74<br />
Industrial Products 5.57<br />
Fertilisers 4.91<br />
Banks 4.74<br />
Consumer Durables 3.46<br />
Telecom - Services 3.37<br />
Ferrous Metals 3.<strong>08</strong><br />
Chemicals 2.74<br />
Transportation 2.34<br />
Hotels 2.11<br />
Finance 1.14<br />
Date Period NAV Returns Benchmark<br />
per Unit (Rs.) (%)^$ Returns (%)#<br />
Jan 31, <strong>08</strong> Last Six <strong>month</strong>s (182 days) 16.886 -3.62* -3.29*<br />
Jul 31, 07 Last 1 Year (366 days) 15.355 5.97** 2.24**<br />
Jul 29, 05 Last 3 Years (1098 days) 13.501 6.41** 7.15**<br />
Jul 31, 03 Last 5 Years (1827 days) 13.494 9.40** 7.67**<br />
Mar 02, 01 Since Inception (27<strong>08</strong> days) 10.000 10.63** N.A.<br />
^Past per<strong>for</strong>mance may or may not be sustained in <strong>the</strong> future<br />
* Absolute Returns ** Compounded Annualised Returns N.A. Not Available<br />
#CRISIL MIP Blended Index<br />
$ Adjusted <strong>for</strong> bonus units declared under <strong>the</strong> scheme<br />
Portfolio – Top 10 Holdings (as at <strong>July</strong> 31, 20<strong>08</strong>)<br />
Company / Issuer Industry + / Rating % to NAV<br />
EQUITY & EQUITY RELATED<br />
Coromandel Fertilisers Ltd. Fertilisers 1.16<br />
Blue Star Ltd. Consumer Durables 1.13<br />
Shanthi Gears Ltd. Industrial Products 1.03<br />
Infosys Technologies Ltd. S<strong>of</strong>tware 1.00<br />
United Phosphorus Ltd. Pesticides 0.99<br />
Sun Pharmaceutical Industries Ltd. Pharmaceuticals 0.96<br />
Britannia Industries Ltd. Consumer Non Durables 0.89<br />
Torrent Cables Ltd Electric Utilities 0.88<br />
Carborundum Universal Ltd. Auto Ancillaries 0.85<br />
Crompton Greaves Ltd. Industrial Capital Goods 0.83<br />
Total <strong>of</strong> Top Ten Equity Holdings 9.72<br />
Total Equity & Equity Related Holdings 18.13<br />
Debt / Money Market Instrument<br />
Housing Dev. Finance Corpn Ltd.$ AAA 10.92<br />
Loan Securitisation Trust - Grasim Industries Ltd. AAA(SO) 10.79<br />
Power Finance Corporation Ltd AAA 9.21<br />
Credit Asset Tr XVII (Shri Tra Fin) AA(SO) 7.67<br />
TML Financial Services Ltd. AA+ 7.50<br />
ICICI Bank Ltd. AAA 6.43<br />
National Bank <strong>for</strong> Agriculture & Rural Development AAA 5.71<br />
DSP Merrill Lynch Capital Ltd. AA+ 4.71<br />
State Bank <strong>of</strong> India AAA 4.64<br />
Sundaram Finance Ltd. AA+ 3.81<br />
Total <strong>of</strong> Top Ten Debt / Money Market Instrument<br />
(aggregated holdings in a single issuer) 71.39<br />
Total Debt / Money Market Instrument 76.35<br />
O<strong>the</strong>r Current Assets (Including Reverse Repos’ / CBLO) 5.52<br />
Grand Total 100.00<br />
Net Assets (Rs. In Lakhs) 5,145.06<br />
Average Portfolio Maturity (O<strong>the</strong>r than equity investments)<br />
1.87 years<br />
Modified Duration (Debt Instruments)<br />
1.60 years<br />
+ Industry Classification as recommended by AMFI $ Sponsor<br />
Industry Allocation <strong>of</strong> Equity Holding (% <strong>of</strong> Net Assets)<br />
Pharmaceuticals 2.43<br />
Industrial Capital Goods 2.26<br />
Consumer Non Durables 2.03<br />
Industrial Products 1.68<br />
Auto Ancillaries 1.53<br />
S<strong>of</strong>tware 1.51<br />
Construction 1.29<br />
Banks 1.24<br />
Fertilisers 1.16<br />
Consumer Durables 1.13<br />
Pesticides 0.99<br />
Electric Utilities 0.88<br />
Intouchmutually<br />
<strong>July</strong> 20<strong>08</strong> 17
hdfc-eq-r.qxd 8/8/20<strong>08</strong> 3:37 PM Page 8<br />
<strong>HDFC</strong> Long Term<br />
Advantage <strong>Fund</strong>*<br />
IN EQUITY - TAX PLANNING CATEGORY<br />
(18 schemes) <strong>for</strong> 3 and 5 year<br />
periods ending <strong>July</strong> 31, 20<strong>08</strong><br />
<strong>HDFC</strong><br />
TaxSaver<br />
IN EQUITY - TAX PLANNING CATEGORY<br />
(18 schemes) <strong>for</strong> 3 and 5 year<br />
periods ending <strong>July</strong> 31, 20<strong>08</strong><br />
An open-ended equity linked savings scheme with a lock-in period <strong>of</strong> 3 years<br />
* Previously <strong>HDFC</strong> Tax Plan 2000<br />
NAV (as at <strong>July</strong> 31, 20<strong>08</strong>)<br />
NAV per Unit (Rs.)<br />
Growth Plan 88.972<br />
Dividend Plan 34.604<br />
Relative Per<strong>for</strong>mance ^ (Growth Plan)<br />
An open-ended equity linked savings scheme with a lock-in period <strong>of</strong> 3 years<br />
NAV (as at <strong>July</strong> 31, 20<strong>08</strong>)<br />
Relative Per<strong>for</strong>mance ^ (Growth Plan)<br />
NAV per Unit (Rs.)<br />
Growth Plan 135.953<br />
Dividend Plan 50.262<br />
Date Period NAV Returns Benchmark<br />
per Unit (Rs.) (%)^ Returns (%)#<br />
Jan 31, <strong>08</strong> Last Six <strong>month</strong>s (182 days) 112.202 -20.70* -18.66*<br />
Jul 31, 07 Last 1 Year (366 days) 102.976 -13.56** -7.67**<br />
Jul 29, 05 Last 3 Years (1098 days) 58.385 15.03** 23.35**<br />
Jul 31, 03 Last 5 Years (1827 days) 19.094 36.00** 30.46**<br />
Jan 02, 01 Since Inception (2767 days) 10.000 33.42** 18.29**<br />
^Past per<strong>for</strong>mance may or may not be sustained in <strong>the</strong> future<br />
Per<strong>for</strong>mance <strong>of</strong> <strong>the</strong> Dividend Plan <strong>for</strong> <strong>the</strong> investor would be net <strong>of</strong> Distribution Tax as applicable<br />
* Absolute Returns ** Compounded Annualised Returns #SENSEX<br />
Portfolio – Top 10 Holdings (as at <strong>July</strong> 31, 20<strong>08</strong>)<br />
Company Industry + / Rating % to NAV<br />
EQUITY & EQUITY RELATED<br />
Reliance Industries Ltd. Petroleum Products 6.27<br />
ICICI Bank Ltd. Banks 6.05<br />
Colgate-Palmolive (India) Ltd. Consumer Non Durables 4.87<br />
State Bank <strong>of</strong> India Banks 4.51<br />
Blue Star Ltd. Consumer Durables 4.32<br />
Crompton Greaves Ltd. Industrial Capital Goods 4.<strong>08</strong><br />
Exide Industries Ltd. Auto Ancillaries 3.47<br />
Thermax Ltd. Industrial Capital Goods 3.42<br />
Infosys Technologies Ltd. S<strong>of</strong>tware 3.34<br />
Satyam Computer Services Ltd. S<strong>of</strong>tware 3.22<br />
Total <strong>of</strong> Top Ten Equity Holdings 43.55<br />
Total Equity & Equity Related Holdings 91.25<br />
Debt / Money Market Instrument / Government Securities<br />
ICICI Bank Ltd. A1+ 1.99<br />
Government Securities SOV 0.70<br />
Total Debt / Money Market Instrument / Government Securities 2.69<br />
O<strong>the</strong>r Current Assets (Including Reverse Repos’ / CBLO) 6.06<br />
Grand Total 100.00<br />
Net Assets (Rs. In Lakhs) 71,<strong>08</strong>6.01<br />
Portfolio Turnover Ratio (Last 1 Year) 39.51%<br />
+ Industry Classification as recommended by AMFI<br />
Industrial Capital Goods 20.16<br />
Consumer Non Durables 13.38<br />
Banks 12.05<br />
Auto Ancillaries 7.16<br />
S<strong>of</strong>tware 6.56<br />
Industrial Products 6.52<br />
Petroleum Products 6.27<br />
Pesticides 4.74<br />
✤ Past per<strong>for</strong>mance is no guarantee <strong>of</strong> future results.<br />
♓ Please refer to page no 31 <strong>for</strong> details on <strong>the</strong> Rating Methodology<br />
Industry Allocation <strong>of</strong> Equity Holding (% <strong>of</strong> Net Assets)<br />
Consumer Durables 4.32<br />
Pharmaceuticals 2.69<br />
Telecom - Services 2.25<br />
Gas 1.91<br />
Textile Products 1.30<br />
Ferrous Metals 1.02<br />
Hardware 0.92<br />
Date Period NAV Returns Benchmark<br />
per Unit (Rs.) (%)$$^ Returns (%)#<br />
Jan 31, <strong>08</strong> Last Six <strong>month</strong>s (182 days) 173.277 -21.54* -20.52*<br />
Jul 31, 07 Last 1 Year (366 days) 163.610 -16.86** -8.62**<br />
Jul 29, 05 Last 3 Years (1098 days) 87.966 15.57** 19.41**<br />
Jul 31, 03 Last 5 Years (1827 days) 25.504 39.70** 29.75**<br />
Jul 31, 98 Last 10 Years (3653 days) 12.780 38.92** 18.70**<br />
Mar 31, 96 Since Inception (4505 days) 10.000 33.16** 13.81**<br />
^Past per<strong>for</strong>mance may or may not be sustained in <strong>the</strong> future<br />
Per<strong>for</strong>mance <strong>of</strong> <strong>the</strong> Dividend Plan <strong>for</strong> <strong>the</strong> investor would be net <strong>of</strong> Distribution Tax as applicable<br />
* Absolute Returns #S&P CNX 500 (Please refer to page no 31)<br />
** Compounded Annualised Returns<br />
$$ Adjusted <strong>for</strong> <strong>the</strong> dividends declared under <strong>the</strong> scheme prior to its splittng into <strong>the</strong> Dividend<br />
and Growth Plans<br />
Portfolio – Top 10 Holdings (as at <strong>July</strong> 31, 20<strong>08</strong>)<br />
Company Industry + % to NAV<br />
EQUITY & EQUITY RELATED<br />
ICICI Bank Ltd. Banks 6.51<br />
Oil & Natural Gas Corporation Ltd. Oil 6.14<br />
State Bank <strong>of</strong> India Banks 5.36<br />
Larsen & Toubro Ltd. Industrial Capital Goods 4.54<br />
Crompton Greaves Ltd. Industrial Capital Goods 4.52<br />
United Phosphorus Ltd. Pesticides 3.70<br />
Thermax Ltd. Industrial Capital Goods 3.27<br />
Siemens Ltd. Industrial Capital Goods 3.24<br />
Bharti Airtel Ltd. Telecom - Services 3.04<br />
ITC Ltd. Consumer Non Durables 2.98<br />
Total <strong>of</strong> Top Ten Equity Holdings 43.30<br />
Total Equity & Equity Related Holdings 93.77<br />
O<strong>the</strong>r Current Assets (Including Reverse Repos’ / CBLO) 6.23<br />
Grand Total 100.00<br />
Net Assets (Rs. In Lakhs) 126,245.35<br />
Portfolio Turnover Ratio (Last 1 Year) 60.86%<br />
+ Industry Classification as recommended by AMFI<br />
✤ Past per<strong>for</strong>mance is no guarantee <strong>of</strong> future results.<br />
♓ Please refer to page no 31 <strong>for</strong> details on <strong>the</strong> Rating Methodology<br />
Industry Allocation <strong>of</strong> Equity Holding (% <strong>of</strong> Net Assets)<br />
Banks 18.45<br />
Industrial Capital Goods 16.90<br />
Consumer Non Durables 11.37<br />
Pharmaceuticals 10.66<br />
Auto Ancillaries 7.87<br />
Oil 6.14<br />
Media & Entertainment 5.93<br />
Auto 3.71<br />
Pesticides 3.70<br />
Telecom - Services 3.04<br />
S<strong>of</strong>tware 1.66<br />
Transportation 1.66<br />
Construction 1.47<br />
Paper Products 1.00<br />
Trading 0.16<br />
Industrial Products 0.05<br />
Std Deviation<br />
Beta Sharpe Ratio*<br />
Std Deviation<br />
Beta Sharpe Ratio*<br />
Risk Ratio (<strong>for</strong> <strong>the</strong> 3-yr period ended <strong>July</strong> 31, 20<strong>08</strong>) 6.00% 0.8090 0.45<br />
Source : CRISIL <strong>Fund</strong> Analyser<br />
* Risk-free rate assumed to be 9.40% (364-day Treasury Bill yield on 31-07-<strong>08</strong>)<br />
Risk Ratio (<strong>for</strong> <strong>the</strong> 3-yr period ended <strong>July</strong> 31, 20<strong>08</strong>) 6.70% 0.9280 0.43<br />
Source : CRISIL <strong>Fund</strong> Analyser<br />
* Risk-free rate assumed to be 9.40% (364-day Treasury Bill yield on 31-07-<strong>08</strong>)<br />
18 <strong>July</strong> 20<strong>08</strong> Intouchmutually
hdfc-sip.qxd 8/8/20<strong>08</strong> 3:33 PM Page 1<br />
Benefits <strong>of</strong> Systematic Investment Plan (SIP)<br />
The Terms & Conditions <strong>of</strong> <strong>the</strong> SIP facility have been revamped effective<br />
September 1, 2004 and January 3, 2005 and it is now more flexible and<br />
convenient <strong>for</strong> investors. To illustrate <strong>the</strong> advantages <strong>of</strong> SIP investments,<br />
this is how your investments would have grown if you had invested say Rs. 1,000<br />
systematically on <strong>the</strong> first Business Day <strong>of</strong> every <strong>month</strong> over a period <strong>of</strong> time.<br />
<strong>HDFC</strong> GROWTH FUND<br />
SIP Investments Since Inception 5 Year SIP 3 Year SIP 1 Year SIP<br />
Total Amount Invested (Rs. ‘000) 95.00 60.00 36.00 12.00<br />
Mkt Value as on <strong>July</strong> 31, 20<strong>08</strong> (Rs. ‘000) 339.72 111.88 42.70 9.93<br />
Returns (Annualised)* (%) 31.84 26.03 12.<strong>08</strong> -35.32<br />
Benchmark Returns (Annualised) (%) # 22.77 20.15 5.67 -39.86<br />
# SENSEX<br />
Past per<strong>for</strong>mance may or may not be sustained in <strong>the</strong> future.<br />
<strong>HDFC</strong> EQUITY FUND<br />
SIP Investments Since 10 year 5 Year 3 Year 1 Year<br />
Inception SIP SIP SIP SIP<br />
Total Amount Invested (Rs. ‘000) 163.00 120.00 60.00 36.00 12.00<br />
Mkt Value as on <strong>July</strong> 31, 20<strong>08</strong> (Rs. ‘000) 1,585.05 665.04 110.35 40.38 10.16<br />
Returns (Annualised)* (%) 29.98 32.18 24.63 7.61 -27.22<br />
Benchmark Returns (Annualised) (%) # 17.00 20.95 19.53 7.19 -27.99<br />
# S&P CNX 500 (Please refer to page no 31)<br />
Past per<strong>for</strong>mance may or may not be sustained in <strong>the</strong> future.<br />
<strong>HDFC</strong> TOP 200 FUND<br />
SIP Investments Since 10 year 5 Year 3 Year 1 Year<br />
Inception SIP SIP SIP SIP<br />
Total Amount Invested (Rs. ‘000) 142.00 120.00 60.00 36.00 12.00<br />
Mkt Value as on <strong>July</strong> 31, 20<strong>08</strong> (Rs. ‘000) 898.01 612.09 117.44 43.67 10.65<br />
Returns (Annualised)* (%) 28.60 30.64 27.24 12.97 -20.16<br />
Benchmark Returns (Annualised) (%) # 19.04 21.17 20.30 8.71 -28.26<br />
# BSE 200<br />
Past per<strong>for</strong>mance may or may not be sustained in <strong>the</strong> future.<br />
<strong>HDFC</strong> CAPITAL BUILDER FUND<br />
SIP Investments Since 10 year 5 Year 3 Year 1 Year<br />
Inception SIP SIP SIP SIP<br />
Total Amount Invested (Rs. ‘000) 174.00 120.00 60.00 36.00 12.00<br />
Mkt Value as on <strong>July</strong> 31, 20<strong>08</strong> (Rs. ‘000) 933.65 477.81 104.25 38.64 9.86<br />
Returns (Annualised)* (%) 20.87 26.05 22.27 4.66 -31.35<br />
Benchmark Returns (Annualised) (%) # 15.81 20.95 19.53 7.19 -27.99<br />
# S&P CNX 500 (Please refer to page no 31)<br />
Past per<strong>for</strong>mance may or may not be sustained in <strong>the</strong> future.<br />
<strong>HDFC</strong> PREMIER MULTI-CAP FUND<br />
SIP Investments Since Inception 3 Year SIP 1 Year SIP<br />
Total Amount Invested (Rs. ‘000) 40.00 36.00 12.00<br />
Market Value as <strong>July</strong> 31, 20<strong>08</strong> (Rs. ‘000) 43.90 36.99 9.83<br />
Returns (Annualised)* (%) 5.52 1.77 -31.67<br />
Benchmark Returns (Annualised) (%) # 10.67 7.19 -27.99<br />
# S&P CNX 500 (Please refer to page no 31)<br />
Past per<strong>for</strong>mance may or may not be sustained in <strong>the</strong> future.<br />
<strong>HDFC</strong> CORE & SATELLITE FUND<br />
SIP Investments Since Inception 3 Year SIP 1 Year SIP<br />
Total Amount Invested (Rs. ‘000) 47.00 36.00 12.00<br />
Market Value as <strong>July</strong> 31, 20<strong>08</strong> (Rs. ‘000) 58.25 36.05 9.69<br />
Returns (Annualised)* (%) 10.96 0.09 -33.66<br />
Benchmark Returns (Annualised) (%) # 16.03 8.71 -28.26<br />
# BSE 200<br />
Past per<strong>for</strong>mance may or may not be sustained in <strong>the</strong> future.<br />
<strong>HDFC</strong> BALANCED FUND<br />
SIP Investments Since Inception 5 Year SIP 3 Year SIP 1 Year SIP<br />
Total Amount Invested (Rs. ‘000) 95.00 60.00 36.00 12.00<br />
Mkt Value as on <strong>July</strong> 31, 20<strong>08</strong> (Rs. ‘000) 203.66 86.73 39.88 11.22<br />
Returns (Annualised)* (%) 18.73 14.72 6.77 -11.86<br />
Benchmark Returns (Annualised) (%) # N.A. 14.55 8.70 -14.43<br />
# CRISIL Balanced <strong>Fund</strong> Index<br />
Past per<strong>for</strong>mance may or may not be sustained in <strong>the</strong> future.<br />
<strong>HDFC</strong> PRUDENCE FUND<br />
SIP Investments Since 10 year 5 Year 3 Year 1 Year<br />
Inception SIP SIP SIP SIP<br />
Total Amount Invested (Rs. ‘000) 174.00 120.00 60.00 36.00 12.00<br />
Mkt Value as on <strong>July</strong> 31, 20<strong>08</strong> (Rs. ‘000) 1,226.85 492.42 98.<strong>08</strong> 39.55 10.27<br />
Returns (Annualised)* (%) 24.<strong>08</strong> 26.61 19.75 6.21 -25.62<br />
Benchmark Returns (Annualised) (%) # N.A. N.A. 14.55 8.70 -14.43<br />
# CRISIL Balanced <strong>Fund</strong> Index<br />
Past per<strong>for</strong>mance may or may not be sustained in <strong>the</strong> future.<br />
<strong>HDFC</strong> CHILDREN’S GIFT FUND - INVESTMENT PLAN<br />
SIP Investments Since Inception 5 Year SIP 3 Year SIP 1 Year SIP<br />
Total Amount Invested (Rs. ‘000) 89.00 60.00 36.00 12.00<br />
Mkt Value as on <strong>July</strong> 31, 20<strong>08</strong> (Rs. ‘000) 167.62 80.51 37.30 10.68<br />
Returns (Annualised)* (%) 16.70 11.71 2.31 -19.71<br />
Benchmark Returns (Annualised) (%) # 14.44 14.44 8.28 -18.06<br />
# CRISIL Balanced <strong>Fund</strong> Index<br />
Past per<strong>for</strong>mance may or may not be sustained in <strong>the</strong> future.<br />
<strong>HDFC</strong> CHILDREN’S GIFT FUND - SAVINGS PLAN<br />
SIP Investments Since Inception 5 Year SIP 3 Year SIP 1 Year SIP<br />
Total Amount Invested (Rs. ‘000) 89.00 60.00 36.00 12.00<br />
Mkt Value as on <strong>July</strong> 31, 20<strong>08</strong> (Rs. ‘000) 124.25 71.04 38.65 11.94<br />
Returns (Annualised)* (%) 8.83 6.69 4.68 -0.98<br />
Benchmark Returns (Annualised) (%) # 6.49 6.49 5.20 -3.09<br />
# CRISIL MIP Blended Index<br />
Past per<strong>for</strong>mance may or may not be sustained in <strong>the</strong> future.<br />
<strong>HDFC</strong> LONG TERM ADVANTAGE FUND<br />
SIP Investments Since Inception 5 Year SIP 3 Year SIP 1 Year SIP<br />
Total Amount Invested (Rs. ‘000) 91.00 60.00 36.00 12.00<br />
Mkt Value as on <strong>July</strong> 31, 20<strong>08</strong> (Rs. ‘000) 345.10 100.36 36.86 10.14<br />
Returns (Annualised)* (%) 34.36 20.70 1.54 -27.39<br />
Benchmark Returns (Annualised) (%) # 24.72 22.16 9.69 -25.60<br />
# SENSEX<br />
Past per<strong>for</strong>mance may or may not be sustained in <strong>the</strong> future.<br />
<strong>HDFC</strong> TAXSAVER<br />
SIP Investments Since 10 year 5 Year 3 Year 1 Year<br />
Inception SIP SIP SIP SIP<br />
Total Amount Invested (Rs. ‘000) 145.00 120.00 60.00 36.00 12.00<br />
Mkt Value as on <strong>July</strong> 31, 20<strong>08</strong> (Rs. ‘000) 1,553.38 720.58 110.17 36.53 9.89<br />
Returns (Annualised)* (%) 35.70 33.67 24.56 0.95 -30.90<br />
Benchmark Returns (Annualised) (%) # 18.70 20.95 19.53 7.19 -27.99<br />
# S&P CNX 500 (Please refer to page no 31<br />
Past per<strong>for</strong>mance may or may not be sustained in <strong>the</strong> future.<br />
<strong>HDFC</strong> MF MIP - SHORT TERM PLAN<br />
SIP Investments Since Inception 3 Year SIP 1 Year SIP<br />
Total Amount Invested (Rs. ‘000) 56.00 36.00 12.00<br />
Market Value as <strong>July</strong> 31, 20<strong>08</strong> (Rs. ‘000) 63.31 37.86 11.86<br />
Returns (Annualised)* (%) 5.20 3.31 -2.12<br />
Benchmark Returns (Annualised) (%) # 6.37 5.20 -3.09<br />
# CRISIL MIP BLENDED INDEX<br />
Past per<strong>for</strong>mance may or may not be sustained in <strong>the</strong> future.<br />
<strong>HDFC</strong> MF MIP - LONG TERM PLAN<br />
SIP Investments Since Inception 3 Year SIP 1 Year SIP<br />
Total Amount Invested (Rs. ‘000) 56.00 36.00 12.00<br />
Market Value as <strong>July</strong> 31, 20<strong>08</strong> (Rs. ‘000) 68.44 39.06 11.58<br />
Returns (Annualised)* (%) 8.55 5.38 -6.43<br />
Benchmark Returns (Annualised) (%) # 6.37 5.20 -3.09<br />
# CRISIL MIP BLENDED INDEX<br />
Past per<strong>for</strong>mance may or may not be sustained in <strong>the</strong> future.<br />
* Load is not taken into consideration and <strong>the</strong> Returns are <strong>of</strong> Growth Plan / Option. Investors are<br />
advised to refer to <strong>the</strong> Relative Per<strong>for</strong>mance table furnished in this booklet <strong>for</strong> non-SIP returns.<br />
Past per<strong>for</strong>mance may or may not be sustained in <strong>the</strong> future.<br />
Disclaimer: The above investment simulation is <strong>for</strong> illustrative purposes only and should not be<br />
construed as a promise on minimum returns and safeguard <strong>of</strong> capital. The AMC / <strong>Mutual</strong> <strong>Fund</strong> is<br />
not guaranteeing or promising or <strong>for</strong>ecasting any returns. SIP does not assure a pr<strong>of</strong>it or guarantee<br />
protection against a loss in a declining market.<br />
Please refer SIP Enrolment Form or contact nearest ISC <strong>for</strong> SIP Load Structure.<br />
Intouchmutually<br />
<strong>July</strong> 20<strong>08</strong> 19
hdfc-dt.qxd 8/8/20<strong>08</strong> 3:39 PM Page 1<br />
<strong>HDFC</strong> MF MIP -<br />
Short Term Plan<br />
Portfolio – Top 10 Holdings (as at <strong>July</strong> 31, 20<strong>08</strong>)<br />
Company / Issuer Industry + / Rating % to NAV<br />
EQUITY & EQUITY RELATED<br />
Crompton Greaves Ltd. Industrial Capital Goods 1.54<br />
T. V. Today Network Ltd. Media & Entertainment 1.33<br />
ICICI Bank Ltd. Banks 1.14<br />
Amtek Auto Ltd. Auto Ancillaries 0.97<br />
Oil & Natural Gas Corporation Ltd. Oil 0.94<br />
Blue Star Ltd. Consumer Durables 0.89<br />
ITC Ltd. Consumer Non Durables 0.88<br />
Jagran Prakashan Ltd. Media & Entertainment 0.79<br />
Pidilite Industries Ltd. Consumer Non Durables 0.78<br />
Biocon Ltd. Pharmaceuticals 0.65<br />
Total <strong>of</strong> Top Ten Equity Holdings 9.91<br />
Total Equity & Equity Related Holdings 13.47<br />
Debt / Money Market Instrument<br />
Housing Dev. Finance Corpn Ltd.$ AAA 18.94<br />
IDBI Bank Ltd. AA+ 14.21<br />
LIC Housing Finance Ltd. AAA 9.41<br />
Auto Sec Trust Mixed Pool A AAA(SO) 6.84<br />
TML Financial Services Ltd. AA+ 5.93<br />
UBL Trust Series 61 P1+(SO) 5.69<br />
Credit Asset Tr XLIX F1+ (IND) (SO) 4.78<br />
Kotak Mahindra Prime Ltd. P1+ 4.64<br />
ILSS 1 Trust 2009 AAA(SO) 4.53<br />
Infrastructure Dev. Fin. Corp. Ltd. LAAA 4.40<br />
Total <strong>of</strong> Top Ten Debt / Money Market Instrument<br />
(aggregated holdings in a single issuer) 79.37<br />
Total Debt/ Money Market Instrument 82.20<br />
O<strong>the</strong>r Current Assets (Including Reverse Repos’ / CBLO) 4.33<br />
Grand Total 100.00<br />
Net Assets (Rs. In Lakhs) 10,617.70<br />
Average Portfolio Maturity<br />
Modified Duration (Debt Instruments)<br />
An open-ended income scheme. Monthly income is not assured and is<br />
subject to availability <strong>of</strong> distributable surplus<br />
NAV (as at <strong>July</strong> 31, 20<strong>08</strong>)<br />
NAV per Unit (Rs.)<br />
Growth Option 13.5004<br />
Monthly Dividend Option 9.8749<br />
Quarterly Dividend Option 10.1251<br />
Relative Per<strong>for</strong>mance^(Growth Option)<br />
Date Period NAV Returns Benchmark<br />
per Unit (Rs.) (%)^ Returns (%)#<br />
Jan 31, <strong>08</strong> Last Six Months (182 days) 13.8622 -2.61* -3.29*<br />
Jul 31, 07 Last 1 Year (366 days) 13.3335 1.25** 2.24**<br />
Jul 29, 05 Last 3 Years (1098 days) 11.6150 5.13** 7.15**<br />
Dec 26, 03 Since Inception (1679 days) 10.0000 6.74** 6.20**<br />
^Past Per<strong>for</strong>mance may or may not be sustained in <strong>the</strong> future<br />
Per<strong>for</strong>mance <strong>of</strong> <strong>the</strong> Dividend Option <strong>for</strong> <strong>the</strong> investor would be net <strong>of</strong> Distribution Tax as applicable<br />
* Absolute Returns ** Compounded Annualised Returns #Crisil MIP Blended Index<br />
1.80 years (o<strong>the</strong>r than equity investments)<br />
281 days<br />
<strong>HDFC</strong> MF MIP -<br />
Long Term Plan<br />
NAV (as at <strong>July</strong> 31, 20<strong>08</strong>)<br />
NAV per Unit (Rs.)<br />
Growth Option 15.7393<br />
Monthly Dividend Option 10.7691<br />
Quarterly Dividend Option 11.0720<br />
Relative Per<strong>for</strong>mance^(Growth Option)<br />
Date Period NAV Returns Benchmark<br />
per Unit (Rs.) (%)^ Returns (%)#<br />
Jan 31, <strong>08</strong> Last Six Months (182 days) 16.7207 -5.87* -3.29*<br />
Jul 31, 07 Last 1 Year (366 days) 15.7602 -0.13** 2.24**<br />
Jul 29, 05 Last 3 Years (1098 days) 11.9890 9.47** 7.15**<br />
Dec 26, 03 Since Inception (1679 days) 10.0000 10.36** 6.20**<br />
^Past Per<strong>for</strong>mance may or may not be sustained in <strong>the</strong> future<br />
Per<strong>for</strong>mance <strong>of</strong> <strong>the</strong> Dividend Option <strong>for</strong> <strong>the</strong> investor would be net <strong>of</strong> Distribution Tax as applicable<br />
* Absolute Returns ** Compounded Annualised Returns #Crisil MIP Blended Index<br />
Portfolio – Top 10 Holdings (as at <strong>July</strong> 31, 20<strong>08</strong>)<br />
Company / Issuer Industry + / Rating % to NAV<br />
EQUITY & EQUITY RELATED<br />
ICICI Bank Ltd. Banks 1.86<br />
State Bank <strong>of</strong> India Banks 1.77<br />
Oil & Natural Gas Corporation Ltd. Oil 1.66<br />
Punj Lloyd Ltd. Construction 1.35<br />
GlaxoSmithkline Consumer Healthcare Ltd. Consumer Non Durables 1.17<br />
Siemens Ltd. Industrial Capital Goods 1.17<br />
Britannia Industries Ltd. Consumer Non Durables 1.15<br />
Crompton Greaves Ltd. Industrial Capital Goods 1.13<br />
The Federal Bank Ltd. Banks 1.11<br />
Page Industries Ltd Textile Products 1.02<br />
Total <strong>of</strong> Top Ten Equity Holdings 13.39<br />
Total Equity & Equity Related Holdings 25.22<br />
Debt / Money Market Instrument<br />
Tata Sons Ltd. AAA 7.14<br />
Sundaram Finance Ltd. AA+ 4.99<br />
Canara Bank P1+ 3.80<br />
Rural Electrification Corporation Ltd. AAA 3.44<br />
National Bank <strong>for</strong> Agriculture & Rural Development AAA 3.12<br />
Power Finance Corporation Ltd. AAA 3.12<br />
Tata Steel Ltd. AAA 2.80<br />
ICICI Bank Ltd. A1+/AAA 2.51<br />
Citicorp Maruti Finance Ltd. AAA 2.49<br />
Infrastructure Dev. Fin. Corp. Ltd. AAA(I)/LAAA 2.36<br />
Total <strong>of</strong> Top Ten Debt / Money Market Instrument<br />
(aggregated holdings in a single issuer) 35.77<br />
Total Debt / Money Market Instrument Instrument 66.54<br />
O<strong>the</strong>r Current Assets (Including Reverse Repos’ / CBLO) 8.24<br />
Grand Total 100.00<br />
Net Assets (Rs. In Lakhs) 120,221.70<br />
Average Portfolio Maturity<br />
Modified Duration (Debt Instruments)<br />
An open-ended income scheme. Monthly income is not assured and is<br />
subject to availability <strong>of</strong> distributable surplus<br />
2.24 years (o<strong>the</strong>r than equity investments)<br />
1.72 years<br />
+ Industry Classification as recommended by AMFI,<br />
+ Industry Classification as recommended by AMFI<br />
$ Sponsor<br />
20 <strong>July</strong> 20<strong>08</strong><br />
Intouchmutually
hdfc-dt.qxd 8/8/20<strong>08</strong> 3:39 PM Page 2<br />
<strong>HDFC</strong> Multiple Yield <strong>Fund</strong><br />
An open-ended income scheme<br />
<strong>HDFC</strong> Multiple Yield <strong>Fund</strong> - Plan 2005<br />
An open-ended income scheme<br />
NAV (as at <strong>July</strong> 31, 20<strong>08</strong>)<br />
NAV per Unit (Rs.)<br />
Growth Option 13.4275<br />
Dividend Option 10.1705<br />
Relative Per<strong>for</strong>mance ^ (Growth Option)<br />
Date Period NAV Returns Benchmark<br />
per Unit (Rs.) (%)^ Returns (%)#<br />
Jan 31, <strong>08</strong> Last Six Months (182 days) 13.6054 -1.31* -3.29*<br />
Jul 31, 07 Last 1 Year (366 days) 12.7744 5.10** 2.24**<br />
Jul 29, 05 Last 3 Years (1098 days) 10.8830 7.23** 7.15**<br />
Sep 17, 04 Since Inception (1413 days) 10.0000 7.91** 7.59**<br />
^Past Per<strong>for</strong>mance may or may not be sustained in <strong>the</strong> future<br />
Per<strong>for</strong>mance <strong>of</strong> <strong>the</strong> Dividend Option <strong>for</strong> <strong>the</strong> investor would be net <strong>of</strong> Distribution Tax as applicable<br />
*Absolute Returns # Crisil MIP Blended Index ** Compounded Annualised Returns<br />
Portfolio – Top Holdings (as at <strong>July</strong> 31, 20<strong>08</strong>)<br />
Company / Issuer Industry + / Rating % to NAV<br />
EQUITY & EQUITY RELATED<br />
Divi’s Laboratories Ltd. Pharmaceuticals 1.81<br />
Crisil Ltd, Finance 1.78<br />
Colgate-Palmolive (India) Ltd. Consumer Non Durables 1.76<br />
AIA Engineering Ltd. Industrial Capital Goods 1.53<br />
Britannia Industries Ltd. Consumer Non Durables 1.48<br />
IPCA Laboratories Ltd. Pharmaceuticals 1.42<br />
3M India Ltd. Trading 1.38<br />
Solar Explosives Ltd. Chemicals 1.33<br />
Crompton Greaves Ltd. Industrial Capital Goods 1.10<br />
ICICI Bank Ltd. Banks 1.10<br />
Total <strong>of</strong> Top Ten Equity Holdings 14.69<br />
Total Equity & Equity Related Holdings 20.57<br />
Debt / Money Market Instrument<br />
IDBI Bank Ltd. A1+ 15.15<br />
KRS LOAN TRUST P1 9.10<br />
Citi Financial Consumer Finance (India) Ltd. AAA 8.58<br />
GE Cap Transportation Financial Ser A1+ 7.88<br />
ING Vysya Bank Ltd. P1+ 7.74<br />
ICICI Bank Ltd. P1+ 6.29<br />
Total Debt / Money Market Instrument<br />
(aggregated holdings in a single issuer) 54.74<br />
O<strong>the</strong>r Current Assets (Including Reverse Repos’ / CBLO) 24.69<br />
Grand Total 100.00<br />
Net Assets (Rs. In Lakhs) 5,818.97<br />
NAV (as at <strong>July</strong> 31, 20<strong>08</strong>)<br />
NAV per Unit (Rs.)<br />
Growth Option 12.1652<br />
Dividend Option 10.0711<br />
Relative Per<strong>for</strong>mance ^ (Growth Option)<br />
Date Period NAV Returns Benchmark<br />
per Unit (Rs.) (%)^ Returns (%)#<br />
Jan 31, <strong>08</strong> Last Six Months (182 days) 12.2165 -0.42* -3.29*<br />
Jul 31, 07 Last 1 Year (366 days) 11.4970 5.80** 2.24**<br />
Aug 17, 05 Since Inception (1079 days) 10.0000 6.85** 7.00**<br />
^Past Per<strong>for</strong>mance may or may not be sustained in <strong>the</strong> future<br />
Per<strong>for</strong>mance <strong>of</strong> <strong>the</strong> Dividend Option <strong>for</strong> <strong>the</strong> investor would be net <strong>of</strong> Distribution Tax as applicable<br />
* Absolute Returns # Crisil MIP Blended Index ** Compounded Annualised Returns<br />
Portfolio – Holdings (as at <strong>July</strong> 31, 20<strong>08</strong>)<br />
Company / Issuer Industry + / Rating % to NAV<br />
EQUITY & EQUITY RELATED<br />
Coromandel Fertilisers Ltd. Fertilisers 1.20<br />
Castrol India Ltd. Oil 1.00<br />
Shanthi Gears Ltd. Industrial Products 0.94<br />
Pidilite Industries Ltd. Consumer Non Durables 0.87<br />
Savita Chemicals Ltd. Chemicals 0.85<br />
Sadbhav Engineering Ltd. Construction 0.84<br />
Crompton Greaves Ltd. Industrial Capital Goods 0.84<br />
Mo<strong>the</strong>rson Sumi Systems Ltd. Auto Ancillaries 0.83<br />
AIA Engineering Ltd. Industrial Capital Goods 0.81<br />
Blue Star Ltd. Consumer Durables 0.79<br />
Total <strong>of</strong> Top Ten Equity Holdings 8.97<br />
Total Equity & Equity Related Holdings 15.45<br />
Debt / Money Market Instrument<br />
Citi Financial Consumer Finance (India) Ltd. AAA 14.03<br />
ING Vysya Bank Ltd. P1+ 12.66<br />
Credit Asset Sr LVIII (Fullerton) LAAA(SO) 8.67<br />
Reliance Capital Ltd. A1+ 6.50<br />
Geetanjali Trading and Investment P1+ 5.62<br />
Total Debt / Money Market Instrument<br />
(aggregated holdings in a single issuer) 47.48<br />
O<strong>the</strong>r Current Assets (Including Reverse Repos’ / CBLO) 37.07<br />
Grand Total 100.00<br />
Net Assets (Rs. In Lakhs) 3,557.11<br />
Average Portfolio Maturity 123 days Average Portfolio Maturity 198 days<br />
Modified Duration (Debt Instruments)<br />
115 days Modified Duration (Debt Instruments)<br />
135 days<br />
+ Industry Classification as recommended by AMFI<br />
+ Industry Classification as recommended by AMFI<br />
Intouchmutually <strong>July</strong> 20<strong>08</strong> 21
hdfc-dt.qxd 8/8/20<strong>08</strong> 3:39 PM Page 3<br />
<strong>HDFC</strong> Income <strong>Fund</strong><br />
An open-ended income scheme<br />
<strong>HDFC</strong> High Interest <strong>Fund</strong><br />
An open-ended income scheme<br />
NAV (as at <strong>July</strong> 31, 20<strong>08</strong>)<br />
NAV per Unit (Rs.)<br />
Growth Option 17.8636<br />
Dividend Option 10.1695<br />
Relative Per<strong>for</strong>mance^(Growth Option)<br />
Date Period NAV Returns Benchmark<br />
per Unit (Rs.) (%)^ Returns (%)#<br />
Jan 31, <strong>08</strong> Last Six <strong>month</strong>s (182 days) 18.3290 -2.54* -1.39*<br />
Jul 31, 07 Last 1 Year (366 days) 17.2794 3.37** 2.48**<br />
Jul 29, 05 Last 3 Years (1098 days) 16.0627 3.60** 3.95**<br />
Jul 31, 03 Last 5 Years (1827 days) 15.0600 3.47** 3.60**<br />
Sep 11, 00 Since Inception (2880 days) 10.0000 7.63** N.A.<br />
^Past Per<strong>for</strong>mance may or may not be sustained in <strong>the</strong> future<br />
Per<strong>for</strong>mance <strong>of</strong> <strong>the</strong> Dividend Option <strong>for</strong> <strong>the</strong> investor would be net <strong>of</strong> Distribution Tax as applicable<br />
* Absolute Returns ** Compounded Annualised Returns<br />
# Crisil Composite Bond <strong>Fund</strong> Index N.A. Not Available<br />
Portfolio – Top 10 Holdings (as at <strong>July</strong> 31, 20<strong>08</strong>)<br />
Issuer Rating % to NAV<br />
DEBT / MONEY MARKET INSTRUMENTS / GOVERNMENT SECURITIES<br />
Citi Financial Consumer Finance (India) Ltd. AAA 12.56<br />
Rural Electrification Corporation Ltd. AAA 9.19<br />
Credit Asset Trust Sr XXVI AAA(SO) 8.75<br />
Loan Securitisation Trust - Bajaj Auto Ltd. AAA(SO) 7.66<br />
JUS Trust - Jet Airways AAA(SO) 7.57<br />
Housing Development Finance Corporation Ltd.$ AAA 6.11<br />
ICICI Bank Ltd. AAA 3.61<br />
Export - Import Bank <strong>of</strong> India AAA 2.54<br />
Credit Asset Trust Sr SR XLVII AAA(Ind)(SO) 2.47<br />
Tata Steels Ltd. AAA 2.41<br />
Total <strong>of</strong> Top Ten Debt / Money Market Instrument<br />
(aggregated holdings in a single issuer) 62.87<br />
Total Debt / Money Market Instrument 67.58<br />
O<strong>the</strong>r Current Assets (Including Reverse Repos’ / CBLO) 32.42<br />
Grand Total 100.00<br />
Net Assets (Rs. In Lakhs) 19,671.43<br />
NAV (as at <strong>July</strong> 31, 20<strong>08</strong>)<br />
NAV per Unit (Rs.)<br />
Growth Plan 26.2833<br />
Quarterly Dividend Option 10.4573<br />
Half-Yearly Dividend Option 10.2265<br />
Yearly Dividend Option 10.6805<br />
Relative Per<strong>for</strong>mance ^ (Growth Plan)<br />
Date Period NAV Returns Benchmark<br />
per Unit (Rs.) (%)^ Returns (%)#<br />
Jan 31, <strong>08</strong> Last Six <strong>month</strong>s (182 days) 26.6289 -1.30* -1.39*<br />
Jul 31, 07 Last 1 Year (366 days) 25.2640 4.02** 2.48**<br />
Jul 29, 05 Last 3 Years (1098 days) 23.5286 3.75** 3.95**<br />
Jul 31, 03 Last 5 Years (1827 days) 22.0174 3.60** 3.60**<br />
Jul 31, 98 Last 10 Years (3653 days) 11.8623 8.27** N.A.<br />
Apr 28, 97 Since Inception (4112 days) 10.0000 8.96** N.A.<br />
^Past Per<strong>for</strong>mance may or may not be sustained in <strong>the</strong> future<br />
Per<strong>for</strong>mance <strong>of</strong> <strong>the</strong> Dividend Option <strong>for</strong> <strong>the</strong> investor would be net <strong>of</strong> Distribution Tax as applicable<br />
* Absolute Returns ** Compounded Annualised Returns<br />
#CRISIL Composite Bond <strong>Fund</strong> Index<br />
N.A. Not Available<br />
Portfolio – Holdings (as at <strong>July</strong> 31, 20<strong>08</strong>)<br />
Issuer Rating % to NAV<br />
DEBT / MONEY MARKET INSTRUMENTS / GOVERNMENT SECURITIES<br />
Government Securities SOV 19.47<br />
Citi Financial Consumer Finance (India) Ltd. AAA 14.11<br />
Power Finance Corporation Ltd. AAA 13.25<br />
Housing Development Finance Corporation Ltd.$ AAA 10.40<br />
K. Raheja Universal Pvt. Ltd. UNRATED 8.61<br />
Amaravati Greenlands Pvt Ltd. UNRATED 7.<strong>08</strong><br />
State Bank <strong>of</strong> India AAA 6.75<br />
JUS Trust - Jet Airways AAA(SO) 5.78<br />
Total Debt / Money Market Instrument / Government Securities<br />
(aggregated holdings in a single issuer) 85.45<br />
O<strong>the</strong>r Current Assets (Including Reverse Repos’ / CBLO) 14.55<br />
Grand Total 100.00<br />
Net Assets (Rs. In Lakhs) 3,536.27<br />
Average Portfolio Maturity<br />
Modified Duration<br />
2.66 years<br />
1.86 years<br />
$ Sponsor<br />
Average Portfolio Maturity<br />
Modified Duration<br />
3.59 years<br />
2.66 years<br />
$ Sponsor<br />
22 <strong>July</strong> 20<strong>08</strong><br />
Intouchmutually
hdfc-dt.qxd 8/8/20<strong>08</strong> 3:39 PM Page 4<br />
<strong>HDFC</strong> Short Term Plan<br />
An open-ended income scheme<br />
NAV (as at <strong>July</strong> 31, 20<strong>08</strong>)<br />
NAV per Unit (Rs.)<br />
Growth Option 14.9740<br />
Dividend Reinvestment Option 10.3382<br />
Relative Per<strong>for</strong>mance ^ (Growth Option)<br />
Date Period NAV Returns Benchmark<br />
per Unit (Rs.) (%)^ Returns (%)#<br />
Jan 31, <strong>08</strong> Last Six <strong>month</strong>s (182 days) 14.5196 3.13* 3.69*<br />
Jul 31, 07 Last 1 Year (366 days) 13.9152 7.59** 6.91**<br />
Jul 29, 05 Last 3 Years (1098 days) 12.1833 7.10** 6.57**<br />
Jul 31, 03 Last 5 Years (1827 days) 11.1601 6.05** 5.62**<br />
Feb 28, 02 Since Inception (2345 days) 10.0000 6.49** N.A.<br />
^Past Per<strong>for</strong>mance may or may not be sustained in <strong>the</strong> future<br />
Per<strong>for</strong>mance <strong>of</strong> <strong>the</strong> Dividend Option <strong>for</strong> <strong>the</strong> investor would be net <strong>of</strong> Distribution Tax as applicable<br />
* Absolute Returns ** Compounded Annualised Returns<br />
# Crisil Liquid <strong>Fund</strong> Index N.A. Not Available<br />
Portfolio – Top 10 Holdings (as at <strong>July</strong> 31, 20<strong>08</strong>)<br />
Issuer Rating % to NAV<br />
DEBT / MONEY MARKET INSTRUMENTS<br />
Hongkong & Shanghai Bank Ltd F1+ 10.09<br />
Tata Sons Ltd AAA 8.87<br />
Power Finance Corporation Ltd. AAA 8.79<br />
Indian Oil Corporation Ltd. LAA+ 8.47<br />
State Bank <strong>of</strong> Travancore P1+ 8.24<br />
SME Loan Receivables Tr Aug 2007 AAA(SO) 6.92<br />
K. Raheja Universal Pvt. Ltd. UNRATED 4.63<br />
Credit Asset Trust Sr XLVII AAA(Ind)(SO) 4.42<br />
ILSS 1 Trust 2009 AAA(SO) 4.38<br />
Export - Import Bank <strong>of</strong> India AAA 4.31<br />
Total <strong>of</strong> Top Ten Debt / Money Market Instrument<br />
(aggregated holdings in a single issuer) 69.12<br />
Total Debt / Money Market Instrument 83.86<br />
O<strong>the</strong>r Current Assets (Including Reverse Repos’ / CBLO) 16.14<br />
Grand Total 100.00<br />
Net Assets (Rs. In Lakhs) 10,973.14<br />
<strong>HDFC</strong> High Interest <strong>Fund</strong><br />
- Short Term Plan<br />
NAV (as at <strong>July</strong> 31, 20<strong>08</strong>)<br />
An open-ended income scheme<br />
NAV per Unit (Rs.)<br />
Growth Option 15.4382<br />
Dividend Option 10.6367<br />
Relative Per<strong>for</strong>mance ^ (Growth Option)<br />
Date Period NAV Returns Benchmark<br />
per Unit (Rs.) (%)^ Returns (%)#<br />
Jan 31, <strong>08</strong> Last Six Months (182 days) 14.8685 3.83* -1.39*<br />
Jul 31, 07 Last 1 Year (366 days) 14.1248 9.27** 2.48**<br />
Jul 29, 05 Last 3 Years (1098 days) 12.3307 7.76** 3.95**<br />
Jul 31, 03 Last 5 Years (1827 days) 11.2601 6.51** 3.60**<br />
Feb 06, 02 Since Inception (2367 days) 10.0000 6.93** N.A.<br />
^Past Per<strong>for</strong>mance may or may not be sustained in <strong>the</strong> future<br />
Per<strong>for</strong>mance <strong>of</strong> <strong>the</strong> Dividend Option <strong>for</strong> <strong>the</strong> investor would be net <strong>of</strong> Distribution Tax as applicable<br />
* Absolute Returns ** Compounded Annualised Returns<br />
# Crisil Composite Bond <strong>Fund</strong> Index N.A. Not Available<br />
Average Portfolio Maturity<br />
In Debt - Short-term Category<br />
(16 schemes) <strong>for</strong> 18 <strong>month</strong>s period<br />
ending June 30, 20<strong>08</strong><br />
Portfolio – Top 10 Holdings (as at <strong>July</strong> 31, 20<strong>08</strong>)<br />
Issuer Rating % to NAV<br />
DEBT / MONEY MARKET INSTRUMENTS<br />
Housing Development Finance Corporation Ltd.$ AAA 10.68<br />
UBL Trust Series 61 P1+(SO) 8.30<br />
Corporation Bank P1+ 8.12<br />
ICICI Bank Ltd. A1+ 6.83<br />
Citicorp Finance (India) Ltd. AAA 5.12<br />
Citi Financial Consumer Finance (India) Ltd. AAA 5.00<br />
ILSS 1 Trust 2009 AAA(SO) 4.96<br />
State Bank <strong>of</strong> Bikaner & Jaipur P1+ 4.09<br />
Auto Sec Trust Mixed Pool A AAA(SO) 3.57<br />
BHPC Auto Sec Tr Feb <strong>08</strong> I AAA(SO) 3.51<br />
Total <strong>of</strong> Top Ten Debt / Money Market Instrument<br />
(aggregated holdings in a single issuer) 60.18<br />
Total Debt / Money Market Instrument 93.39<br />
O<strong>the</strong>r Current Assets (Including Reverse Repos’ / CBLO) 6.61<br />
Grand Total 100.00<br />
Net Assets (Rs. In Lakhs) 29,096.96<br />
1.09 years<br />
Average Portfolio Maturity 1.24 years Modified Duration 175 days<br />
Modified Duration<br />
1.00 years<br />
✤ Past per<strong>for</strong>mance is no guarantee <strong>of</strong> future results.<br />
♓ Please refer to page no 31 <strong>for</strong> details on <strong>the</strong> Rating Methodology<br />
$ Sponsor<br />
Intouchmutually <strong>July</strong> 20<strong>08</strong> 23
hdfc-dt.qxd 8/8/20<strong>08</strong> 3:39 PM Page 5<br />
<strong>HDFC</strong> Gilt <strong>Fund</strong><br />
An open-ended income scheme<br />
Short Term Plan<br />
Long Term Plan<br />
NAV (as at <strong>July</strong> 31, 20<strong>08</strong>)<br />
NAV per Unit (Rs.)<br />
Growth Option 14.4977<br />
Dividend Option 10.5218<br />
NAV (as at <strong>July</strong> 31, 20<strong>08</strong>)<br />
NAV per Unit (Rs.)<br />
Growth Option 16.71<strong>08</strong><br />
Dividend Option 10.2464<br />
Relative Per<strong>for</strong>mance^(Growth Option)<br />
Date Period NAV Returns Benchmark<br />
per Unit (Rs.) (%)^ Returns (%)#<br />
Jan 31, <strong>08</strong> Last Six <strong>month</strong>s (182 days) 14.4577 0.28* 19.34*<br />
Jul 31, 07 Last 1 Year (366 days) 13.9820 3.68** 23.24**<br />
Jul 29, 05 Last 3 Years (1098 days) 12.7592 4.34** 12.07**<br />
Jul 31, 03 Last 5 Years (1827 days) 11.8403 4.13** 9.04**<br />
Jul 25, 01 Since Inception (2563 days) 10.0000 5.43** N.A.<br />
^Past Per<strong>for</strong>mance may or may not be sustained in <strong>the</strong> future<br />
Per<strong>for</strong>mance <strong>of</strong> <strong>the</strong> Dividend Option <strong>for</strong> <strong>the</strong> investor would be net <strong>of</strong> Distribution Tax as applicable<br />
* Absolute Returns ** Compounded Annualised Returns<br />
#I-Sec Si-Bex<br />
N.A. Not Available<br />
Portfolio – Holdings (as at <strong>July</strong> 31, 20<strong>08</strong>)<br />
Issuer Rating % to NAV<br />
Government Securites / Treasury Bills<br />
7.27% GOI 2013 SOV 37.53<br />
11.40% GOI 20<strong>08</strong> SOV 0.11<br />
Total Government Securites / Treasury Bills 37.64<br />
O<strong>the</strong>r Current Assets (Including Reverse Repos’ / CBLO) 62.36<br />
Grand Total 100.00<br />
Net Assets (Rs. In Lakhs) 880.33<br />
Relative Per<strong>for</strong>mance^(Growth Option)<br />
Date Period NAV Returns Benchmark<br />
per Unit (Rs.) (%)^ Returns (%)#<br />
Jan 31, <strong>08</strong> Last Six Months (182 days) 17.2223 -2.97* -9.17*<br />
Jul 31, 07 Last 1 Year (366 days) 15.9026 5.07** -3.44**<br />
Jul 29, 05 Last 3 Years (1098 days) 15.0159 3.62** 3.11**<br />
Jul 31, 03 Last 5 Years (1827 days) 14.4336 2.97** 3.11**<br />
Jul 25, 01 Since Inception (2563 days) 10.0000 7.59** N.A.<br />
^Past Per<strong>for</strong>mance may or may not be sustained in <strong>the</strong> future<br />
Per<strong>for</strong>mance <strong>of</strong> <strong>the</strong> Dividend Option <strong>for</strong> <strong>the</strong> investor would be net <strong>of</strong> Distribution Tax as applicable<br />
* Absolute Returns ** Compounded Annualised Returns<br />
#I-Sec Li-Bex<br />
N.A. Not Available<br />
Portfolio – Holdings (as at <strong>July</strong> 31, 20<strong>08</strong>)<br />
Issuer Rating % to NAV<br />
Government Securities / Treasury Bills<br />
5.48% GOI 2009 SOV 34.65<br />
7.27% GOI 2013 SOV 9.20<br />
Total Government Securites / Treasury Bills 43.85<br />
O<strong>the</strong>r Current Assets (Including Reverse Repos’ / CBLO) 56.15<br />
Grand Total 100.00<br />
Net Assets (Rs. In Lakhs) 1,397.12<br />
Average Portfolio Maturity 1.91 years Average Portfolio Maturity 0.77 years<br />
Modified Duration 1.50 years Modified Duration 235 days<br />
24 <strong>July</strong> 20<strong>08</strong><br />
Intouchmutually
hdfc-dt1.qxd 8/8/20<strong>08</strong> 3:38 PM Page 1<br />
<strong>HDFC</strong> Floating Rate Income <strong>Fund</strong><br />
An open-ended income scheme<br />
Short Term Plan<br />
NAV (as at <strong>July</strong> 31, 20<strong>08</strong>)<br />
NAV per Unit (Rs.)<br />
Retail Option<br />
Growth Option 14.0404<br />
Daily Dividend Reinvestment Option 10.<strong>08</strong>09<br />
Weekly Dividend Option 10.1426<br />
Monthly Dividend Option 10.1513<br />
Wholesale Option<br />
Growth Option 14.0770<br />
Daily Dividend Reinvestment Option 10.<strong>08</strong>09<br />
Weekly Dividend Option 10.1429<br />
Monthly Dividend Option 10.1516<br />
Relative Per<strong>for</strong>mance^- Retail Option (Growth Option)<br />
Date Period NAV Returns Benchmark<br />
per Unit (Rs.) (%)^ Returns (%)#<br />
Jan 31, <strong>08</strong> Last 6 <strong>month</strong>s (182 days) 13.4765 4.18* 3.69*<br />
Jul 31, 07 Last 1 Year (366 days) 12.9395 8.48** 6.91**<br />
Jul 29, 05 Last 3 Years (1098 days) 11.3283 7.40** 6.57**<br />
Jul 31, 03 Last 5 Years (1827 days) 10.2965 6.39** 5.62**<br />
Jan 16, 03 Since Inception (2023 days) 10.0101 6.29** 5.55**<br />
^Past per<strong>for</strong>mance may or may not be sustained in <strong>the</strong> future<br />
Per<strong>for</strong>mance <strong>of</strong> <strong>the</strong> Dividend Option <strong>for</strong> <strong>the</strong> investor would be net <strong>of</strong> Distribution Tax as applicable<br />
* Absolute Returns ** Compounded Annualised Returns #Crisil Liquid <strong>Fund</strong> Index<br />
Portfolio – Top 10 Holdings (as at <strong>July</strong> 31, 20<strong>08</strong>)<br />
Issuer Rating % to NAV<br />
DEBT / MONEY MARKET INSTRUMENTS<br />
<strong>HDFC</strong> Bank Ltd. – 7.23<br />
Indian Retail ABS Trust 96 20<strong>08</strong> AAA(SO) 5.63<br />
Kotak Mahindra Bank Ltd. P1+ 4.64<br />
Housing Development Finance Corporation Ltd. $ AAA 5.26<br />
State Bank <strong>of</strong> Bikaner & Jaipur P1+ 3.42<br />
IDBI Bank Ltd. AA/A1+ 3.07<br />
Citicorp Finance (India) Ltd. AAA 2.95<br />
India Loan Sec Sr 8 Tr 20<strong>08</strong> AAA(SO) 2.65<br />
UBL Trust Series 61 P1+(SO) 2.59<br />
BHPC Auto Sec Tr Nov II AAA(SO) 2.42<br />
Total <strong>of</strong> Top Ten Debt / Money Market Instrument<br />
(aggregated holdings in a single issuer) 39.86<br />
Total Debt / Money Market Instrument 82.93<br />
O<strong>the</strong>r Current Assets (Including Reverse Repos’ / CBLO) 17.07<br />
Grand Total 100.00<br />
Net Assets (Rs. In Lakhs) 271,774.45<br />
Average Portfolio Maturity<br />
Modified Duration<br />
299 days<br />
91 days<br />
$ Sponsor<br />
Total outstanding position (as at <strong>July</strong> 31, 20<strong>08</strong>) in Derivative Instruments<br />
(Interest Rate Swaps) (Notional) Rs. 2,500 lakhs.<br />
Long Term Plan<br />
NAV (as at <strong>July</strong> 31, 20<strong>08</strong>)<br />
NAV per Unit (Rs.)<br />
Growth Option 13.8779<br />
Dividend Reinvestment Option 10.1776<br />
Relative Per<strong>for</strong>mance^(Growth Option)<br />
Date Period NAV Returns Benchmark<br />
per Unit (Rs.) (%)^ Returns (%)#<br />
Jan 31, <strong>08</strong> Last Six <strong>month</strong>s (182 days) 13.2366 4.84* 3.69*<br />
Jul 31, 07 Last 1 Year (366 days) 12.6820 9.40** 6.91**<br />
Jul 29, 05 Last 3 Years (1098 days) 11.2369 7.27** 6.57**<br />
Jul 31, 03 Last 5 Years (1827 days) 10.2749 6.19** 5.62**<br />
Jan 16, 03 Since Inception (2023 days) 10.0104 6.07** 5.55**<br />
^Past per<strong>for</strong>mance may or may not be sustained in <strong>the</strong> future<br />
Per<strong>for</strong>mance <strong>of</strong> <strong>the</strong> Dividend Option <strong>for</strong> <strong>the</strong> investor would be net <strong>of</strong> Distribution Tax as applicable<br />
* Absolute Returns ** Compounded Annualised Returns #Crisil Liquid <strong>Fund</strong> Index<br />
Portfolio – Top 10 Holdings (as at <strong>July</strong> 31, 20<strong>08</strong>)<br />
Issuer Rating % to NAV<br />
DEBT / MONEY MARKET INSTRUMENTS<br />
<strong>HDFC</strong> Bank Ltd. – 9.23<br />
Axis Bank Ltd. – 9.20<br />
Global Trade Finance Ltd. P1+ 8.38<br />
State Bank <strong>of</strong> Patiala P1+ 5.12<br />
Bharti Ventures Ltd. UNRATED 4.65<br />
Tata Capital Ltd. A1+ 4.61<br />
UBL Trust Series 61 P1+(SO) 3.34<br />
Credit Asset Trust Series XLVI F1+ (IND) (SO) 2.79<br />
Ranbaxy Holding Company Pvt. Ltd. P1 2.33<br />
Nirma Ltd. P1+ 2.33<br />
Total <strong>of</strong> Top Ten Debt / Money Market Instrument<br />
(aggregated holdings in a single issuer) 51.98<br />
Total Debt / Money Market Instrument 79.71<br />
O<strong>the</strong>r Current Assets (Including Reverse Repos’ / CBLO) 20.29<br />
Grand Total 100.00<br />
Net Assets (Rs. In Lakhs) 215,038.89<br />
Average Portfolio Maturity<br />
Modified Duration<br />
73 days<br />
49 days<br />
Intouchmutually <strong>July</strong> 20<strong>08</strong> 25
hdfc-dt1.qxd 8/8/20<strong>08</strong> 3:38 PM Page 2<br />
<strong>HDFC</strong><br />
Liquid <strong>Fund</strong><br />
An open-ended liquid income scheme<br />
IN DEBT: ULTRA SHORT-TERM CATEGORY<br />
(39 schemes) <strong>for</strong> 18 <strong>month</strong> period<br />
ending <strong>July</strong> 31, 20<strong>08</strong><br />
<strong>HDFC</strong> Cash<br />
Management <strong>Fund</strong><br />
IN DEBT: ULTRA SHORT-TERM CATEGORY<br />
(39 schemes) <strong>for</strong> 18 <strong>month</strong> period<br />
ending <strong>July</strong> 31, 20<strong>08</strong><br />
An open-ended high liquidity income scheme<br />
NAV (as at <strong>July</strong> 31, 20<strong>08</strong>)<br />
NAV per Unit (Rs.)<br />
<strong>HDFC</strong> Liquid <strong>Fund</strong><br />
Growth Option 16.5450<br />
Daily Dividend Reinvestment Option 10.1982<br />
Weekly Dividend Option 10.3177<br />
Monthly Dividend Option 10.2705<br />
<strong>HDFC</strong> Liquid <strong>Fund</strong> - Premium Plan<br />
Growth Option 16.6712<br />
Daily Dividend Reinvestment Option 12.2598<br />
<strong>HDFC</strong> Liquid <strong>Fund</strong> - Premium Plus Plan<br />
Growth Option 16.7063<br />
Weekly Dividend Option 12.4267<br />
Relative Per<strong>for</strong>mance^(Growth Option)<br />
Date Period NAV Returns Benchmark<br />
per Unit (Rs.) (%)^ Returns (%)#<br />
Liquid <strong>Fund</strong><br />
Jul 24, <strong>08</strong> Last 7 days 16.5166 0.17* 0.16*<br />
Jul 16, <strong>08</strong> Last 15 days 16.4843 0.37* 0.34*<br />
Jun 30, <strong>08</strong> Last 1 <strong>month</strong> (31 days) 16.4217 0.75* 0.68*<br />
Apr 30, <strong>08</strong> Last 3 <strong>month</strong>s (92 days) 16.1947 2.16* 1.70*<br />
Jan 31, <strong>08</strong> Last 6 <strong>month</strong>s (182 days) 15.8704 4.25* 3.69*<br />
Jul 31, 07 Last 1 Year (366 days) 15.2613 8.39** 6.91**<br />
Jul 29, 05 Last 3 Years (1098 days) 13.3874 7.29** 6.57**<br />
Jul 31, 03 Last 5 Years (1827 days) 12.2282 6.23** 5.62**<br />
Oct 17, 00 Since Inception (2844 days) 10.0000 6.68** N.A.<br />
^Past per<strong>for</strong>mance may or may not be sustained in <strong>the</strong> future<br />
N.A. Not Available<br />
Per<strong>for</strong>mance <strong>of</strong> <strong>the</strong> Dividend Option <strong>for</strong> <strong>the</strong> investor would be net <strong>of</strong> Distribution Tax as applicable<br />
* Absolute Returns ** Compounded Annualised Returns # Crisil Liquid <strong>Fund</strong> Index<br />
Portfolio – Top 10 Holdings (as at <strong>July</strong> 31, 20<strong>08</strong>)<br />
Issuer Rating % to NAV<br />
DEBT / MONEY MARKET INSTRUMENTS<br />
ICICI Bank Ltd. A1+/P1+ 6.85<br />
Reliance Capital Ltd. A1+ 6.01<br />
Indian Oil Corporation Ltd. A1+ 3.89<br />
Tata Motors Ltd. P1+ 2.92<br />
Shree Cement Ltd. PR1+ 2.92<br />
UCO Bank P1+ 2.66<br />
Century Textiles & Industries Ltd. F1+ 2.53<br />
State Bank <strong>of</strong> Patiala P1+ 2.15<br />
Indian Bank F1+ 2.13<br />
<strong>HDFC</strong> Bank Ltd. – 1.93<br />
Total <strong>of</strong> Top Ten Debt / Money Market Instrument<br />
(aggregated holdings in a single issuer) 33.99<br />
Total Debt / Money Market Instrument 81.96<br />
O<strong>the</strong>r Current Assets (Including Reverse Repos’ / CBLO) 18.04<br />
Grand Total 100.00<br />
Net Assets (Rs. In Lakhs) 514,354.64<br />
Average Portfolio Maturity<br />
102 days<br />
Savings Plan<br />
NAV (as at <strong>July</strong> 31, 20<strong>08</strong>)<br />
Relative Per<strong>for</strong>mance^(Growth Option)<br />
Date Period NAV Returns Benchmark<br />
per Unit (Rs.) (%)^$$ Returns (%)#<br />
Jul 24, <strong>08</strong> Last 7 days 17.3627 0.17* 0.16*<br />
Jul 16, <strong>08</strong> Last 15 days 17.3288 0.37* 0.34*<br />
Jun 30, <strong>08</strong> Last 1 <strong>month</strong> (31 days) 17.2637 0.75* 0.68*<br />
Apr 30, <strong>08</strong> Last 3 <strong>month</strong>s (92 days) 17.0243 2.16* 1.70*<br />
Jan 31, <strong>08</strong> Last 6 <strong>month</strong>s (182 days) 16.6845 4.24* 3.69*<br />
Jul 31, 07 Last 1 Year (366 days) 16.0394 8.41** 6.91**<br />
Jul 29, 05 Last 3 Years (1098 days) 14.0316 7.40** 6.57**<br />
Jul 31, 03 Last 5 Years (1827 days) 12.7535 6.39** 5.62**<br />
Nov 18, 99 Since Inception (3178 days) 10.0000 6.61** N.A.<br />
^Past per<strong>for</strong>mance may or may not be sustained in <strong>the</strong> future<br />
Per<strong>for</strong>mance <strong>of</strong> <strong>the</strong> Dividend Option <strong>for</strong> <strong>the</strong> investor would be net <strong>of</strong> Distribution Tax as applicable<br />
* Absolute Returns ** Compounded Annualised Returns #Crisil Liquid <strong>Fund</strong> Index<br />
$$ Adjusted <strong>for</strong> <strong>the</strong> dividends declared under <strong>the</strong> scheme prior to its splitting into <strong>the</strong> Dividend<br />
and Growth Plans<br />
N.A. Not Available<br />
Portfolio – Top 10 Holdings (as at <strong>July</strong> 31, 20<strong>08</strong>)<br />
Issuer Rating % to NAV<br />
DEBT / MONEY MARKET INSTRUMENTS<br />
ICICI Bank Ltd. A1+/P1+ 8.56<br />
<strong>HDFC</strong> Bank Ltd. – 7.68<br />
Canara Bank P1+ 5.98<br />
Reliance Capital Ltd. A1+ 4.94<br />
Vijaya Bank PR1+ 3.53<br />
Oriental Bank <strong>of</strong> Commerce P1+ 2.83<br />
IDBI Bank Ltd. A1+ 2.66<br />
State Bank <strong>of</strong> Mysore A1+ 2.51<br />
IWT Loan Trust P1 (SO) 2.43<br />
Bharti Ventures Ltd. UNRATED 1.94<br />
Total <strong>of</strong> Top Ten Debt / Money Market Instrument<br />
(aggregated holdings in a single issuer) 43.06<br />
Total Debt / Money Market Instrument 71.23<br />
O<strong>the</strong>r Current Assets (Including Reverse Repos’ / CBLO) 28.77<br />
Grand Total 100.00<br />
Net Assets (Rs. In Lakhs) 258,379.10<br />
Average Portfolio Maturity<br />
NAV per Unit (Rs.)<br />
Growth Option 17.3927<br />
Daily Dividend Reinvestment Option 10.6364<br />
Weekly Dividend Option 10.6405<br />
113 days<br />
Modified Duration 76 days Modified Duration 90 days<br />
✤ Past per<strong>for</strong>mance is no guarantee <strong>of</strong> future results.<br />
♓ Please refer to page no 31 <strong>for</strong> details on <strong>the</strong> Rating Methodology<br />
Total outstanding position (as at <strong>July</strong> 31, 20<strong>08</strong>) in Derivative Instruments<br />
(Interest Rate Swaps) (Notional) Rs. 2,500 lakhs.<br />
✤ Past per<strong>for</strong>mance is no guarantee <strong>of</strong> future results.<br />
♓ Please refer to page no 31 <strong>for</strong> details on <strong>the</strong> Rating Methodology<br />
26 <strong>July</strong> 20<strong>08</strong> Intouchmutually
hdfc-dt1.qxd 8/8/20<strong>08</strong> 3:38 PM Page 3<br />
<strong>HDFC</strong> Cash Management <strong>Fund</strong><br />
Savings Plus Plan<br />
An open-ended income scheme<br />
NAV (as at <strong>July</strong> 31, 20<strong>08</strong>)<br />
NAV per Unit (Rs.)<br />
Retail Option<br />
Growth Option 18.0699<br />
Daily Dividend Reinvestment Option 10.0315<br />
Weekly Dividend Option 10.0210<br />
Monthly Dividend Option 10.0160<br />
Wholesale Option<br />
Growth Option 18.1490<br />
Daily Dividend Reinvestment Option 10.0315<br />
Weekly Dividend Option 10.0214<br />
Monthly Dividend Option 10.0164<br />
Relative Per<strong>for</strong>mance^- Retail Plan (Growth Option)<br />
Date Period NAV Returns Benchmark<br />
per Unit (Rs.) (%)^ Returns (%)#<br />
Jan 31, <strong>08</strong> Last Six <strong>month</strong>s (182 days) 17.3564 4.11* 3.69*<br />
Jul 31, 07 Last 1 Year (366 days) 16.6937 8.22** 6.91**<br />
Jul 29, 05 Last 3 Years (1098 days) 14.6151 7.31** 6.57**<br />
Jul 31, 03 Last 5 Years (1827 days) 13.3849 6.18** 5.62**<br />
Nov 18, 99 Since Inception (3178 days) 10.0000 7.03** N.A.<br />
^Past per<strong>for</strong>mance may or may not be sustained in <strong>the</strong> future N.A. Not Available<br />
Per<strong>for</strong>mance <strong>of</strong> <strong>the</strong> Dividend Option <strong>for</strong> <strong>the</strong> investor would be net <strong>of</strong> Distribution Tax as applicable<br />
* Absolute Returns ** Compounded Annualised Returns #Crisil Liquid <strong>Fund</strong> Index<br />
Portfolio – Top 10 Holdings (as at <strong>July</strong> 31, 20<strong>08</strong>)<br />
Issuer Rating % to NAV<br />
DEBT / MONEY MARKET INSTRUMENTS<br />
ICICI Bank Ltd. A1+/P1+ 6.51<br />
Tata Motors Ltd. P1+ 4.93<br />
Oriental Bank <strong>of</strong> Commerce P1+ 3.82<br />
State Bank <strong>of</strong> Patiala P1+ 3.00<br />
Housing Development Finance Corporation Ltd.$ AAA 2.99<br />
Reliance Capital Ltd. A1+ 2.79<br />
<strong>HDFC</strong> Bank Ltd. – 2.65<br />
State Bank <strong>of</strong> Mysore A1+ 2.47<br />
Indian Retail ABS Trust 95 AAA(SO) 2.17<br />
Corporation Bank P1+ 1.80<br />
Total <strong>of</strong> Top Ten Debt / Money Market Instrument<br />
(aggregated holdings in a single issuer) 33.13<br />
Total Debt / Money Market Instrument 80.32<br />
O<strong>the</strong>r Current Assets (Including Reverse Repos’ / CBLO) 19.68<br />
Grand Total 100.00<br />
Net Assets (Rs. In Lakhs) 1,114,523.96<br />
Call Plan<br />
An open-ended high liquidity income scheme<br />
NAV (as at <strong>July</strong> 31, 20<strong>08</strong>)<br />
NAV per Unit (Rs.)<br />
Growth Option 14.1788<br />
Daily Dividend Reinvestment Option 10.4266<br />
Relative Per<strong>for</strong>mance^(Growth Option)<br />
Date Period NAV Returns Benchmark<br />
per Unit (Rs.) (%)^ Returns (%)#<br />
Jul 24, <strong>08</strong> Last 7 days 14.1560 0.16* 0.16*<br />
Jul 16, <strong>08</strong> Last 15 days 14.1289 0.35* 0.34*<br />
Jun 30, <strong>08</strong> Last 1 <strong>month</strong>s (31 days) 14.0798 0.70* 0.68*<br />
Apr 30, <strong>08</strong> Last 3 <strong>month</strong>s (92 days) 13.9<strong>08</strong>2 1.95* 1.70*<br />
Jan 31, <strong>08</strong> Last 6 <strong>month</strong>s (182 days) 13.6923 3.55* 3.69*<br />
Jul 31, 07 Last 1 Year (366 days) 13.2112 7.30** 6.91**<br />
Jul 29, 05 Last 3 Years (1098 days) 11.6646 6.70** 6.57**<br />
Jul 31, 03 Last 5 Years (1827 days) 10.7586 5.67** 5.62**<br />
Feb 06, 02 Since Inception (2367 days) 10.0000 5.53** N.A.<br />
^Past per<strong>for</strong>mance may or may not be sustained in <strong>the</strong> future N.A. Not Available<br />
Per<strong>for</strong>mance <strong>of</strong> <strong>the</strong> Dividend Option <strong>for</strong> <strong>the</strong> investor would be net <strong>of</strong> Distribution Tax as applicable<br />
* Absolute Returns ** Compounded Annualised Returns #Crisil Liquid <strong>Fund</strong> Index<br />
Portfolio – Holdings (as at <strong>July</strong> 31, 20<strong>08</strong>)<br />
Issuer Rating % to NAV<br />
DEBT / MONEY MARKET INSTRUMENTS<br />
Citicorp Maruti Finance Ltd. AAA 10.98<br />
Blue Star Ltd. PR1+ 8.79<br />
GE Capital Services India AAA 8.79<br />
Kesoram Industries Ltd PR1+ 8.79<br />
Madras Cements Ltd A1+ 8.79<br />
Raymond Ltd. PR1+ 8.79<br />
Reliance Capital Ltd. A1+ 8.79<br />
United Phosphorus Ltd. PR1+ 8.79<br />
Total Debt / Money Market Instrument 72.51<br />
O<strong>the</strong>r Current Assets (Including Reverse Repos’ / CBLO) 27.49<br />
Grand Total 100.00<br />
Net Assets (Rs. In Lakhs) 2,276.06<br />
Average Portfolio Maturity<br />
Modified Duration<br />
1 day<br />
1 day<br />
Average Portfolio Maturity<br />
154 days<br />
Modified Duration<br />
76 days<br />
$ Sponsor<br />
Total outstanding position (as at <strong>July</strong> 31, 20<strong>08</strong>) in Derivative Instruments<br />
(Interest Rate Swaps) (Notional) Rs. 7,500 lakhs.<br />
Note <strong>for</strong> All Open-Ended Schemes (as at <strong>July</strong> 31, 20<strong>08</strong>)<br />
i) Total NPAs provided <strong>for</strong> and its percentage to NAV : Nil<br />
ii) Investment in ADR/GDR/Foreign Securities : Nil<br />
iii) Total outstanding exposure in derivative instruments (Notional) :<br />
a) Equity : Nil<br />
b) Debt : Interest Rates Swaps / Forward Rate Agreement<br />
<strong>HDFC</strong> Children’s Gift <strong>Fund</strong> - Investment Plan Rs. 500.00 lakhs<br />
<strong>HDFC</strong> Floating Rate Income <strong>Fund</strong> - Short Term Plan Rs. 2,500.00 lakhs<br />
<strong>HDFC</strong> Liquid <strong>Fund</strong><br />
Rs. 2,500.00 lakhs<br />
<strong>HDFC</strong> Cash Management <strong>Fund</strong> - Savings Plus Plan Rs. 7,500.00 lakhs<br />
Total<br />
Rs.13,000.00 lakhs<br />
Intouchmutually <strong>July</strong> 20<strong>08</strong> 27
hdfc-div.qxd 8/8/20<strong>08</strong> 3:39 PM Page 1<br />
Dividend History ^<br />
<strong>HDFC</strong> MF Monthly Income Plan (MIP)<br />
(An open-ended income scheme. Monthly income is not assured and is subject to availability <strong>of</strong> distributable surplus)<br />
Short Term Plan (Dividend Option)<br />
Monthly (Dividend Option)<br />
(Last 3 <strong>month</strong>s)<br />
Record Cum Div Dividend Per unit (Re.) For<br />
Date NAV (Rs.) Individuals & HUF O<strong>the</strong>rs<br />
Dec 26, 07 10.4922 0.0600 0.0558<br />
Jan 25, <strong>08</strong> 10.3562 0.0600 0.0558<br />
Feb 25, <strong>08</strong> 10.1723 0.0600 0.0558<br />
Long Term Plan (Dividend Option)<br />
Monthly (Dividend Option)<br />
(Since Jan 20<strong>08</strong>)<br />
Record Cum Div Dividend Per unit (Re.) For<br />
Date NAV (Rs.) Individuals & HUF O<strong>the</strong>rs<br />
Feb 25, <strong>08</strong> 11.9196 0.0900 0.<strong>08</strong>37<br />
Mar 25, <strong>08</strong> 11.4896 0.0900 0.<strong>08</strong>37<br />
Apr 25, <strong>08</strong> 11.6063 0.0900 0.<strong>08</strong>37<br />
May 26, <strong>08</strong> 11.4675 0.0900 0.<strong>08</strong>37<br />
Jun 25, <strong>08</strong> 10.9375 0.0900 0.<strong>08</strong>37<br />
Jul 25, <strong>08</strong> 10.9<strong>08</strong>4 0.9000 0.<strong>08</strong>37<br />
<strong>HDFC</strong> Multiple Yield <strong>Fund</strong><br />
(Dividend Option)<br />
Record Cum Div Dividend Per unit (Re.) For<br />
Date NAV (Rs.) Individuals & HUF O<strong>the</strong>rs<br />
Oct 13, 05 11.0409 0.9000 0.8381<br />
Oct 12, 06 10.7938 0.6700 0.6240<br />
<strong>HDFC</strong> Multiple Yield <strong>Fund</strong> - Plan 2005<br />
<strong>HDFC</strong> Income <strong>Fund</strong><br />
Dividend Option (Since June 2007)<br />
Record Date Cum Dividend NAV (Rs.) Dividend Per unit (Re.) For<br />
Individuals & HUF<br />
O<strong>the</strong>rs<br />
Jun 25, 07 10.2440 0.1000 0.0931<br />
Sep 25, 07 10.4650 0.1500 0.1396<br />
Dec 26, 07 10.6323 0.2000 0.1861<br />
Mar 25, <strong>08</strong> 10.5750 0.2000 0.1861<br />
<strong>HDFC</strong> High Interest <strong>Fund</strong>-Short Term Plan<br />
Dividend Option (Last 6 <strong>month</strong>s)<br />
Record Cum Div Dividend Per unit (Re.) For<br />
Date NAV (Rs.) Individuals & HUF O<strong>the</strong>rs<br />
Feb 01, <strong>08</strong> 10.6725 0.<strong>08</strong>29 0.0772<br />
Mar 03, <strong>08</strong> 10.6410 0.0554 0.0515<br />
Apr 01, <strong>08</strong> 10.6409 0.0666 0.0620<br />
<strong>HDFC</strong> High Interest <strong>Fund</strong><br />
Quarterly (Dividend Option)<br />
(Since June 2007)<br />
Record Cum Div Dividend Per unit (Re.) For<br />
Date NAV (Rs.) Individuals & HUF O<strong>the</strong>rs<br />
Jun 25, 07 10.5059 0.1000 0.0931<br />
Sep 25, 07 10.6923 0.1500 0.1396<br />
Dec 26, 07 10.7893 0.2000 0.1861<br />
Mar 25, <strong>08</strong> 10.8026 0.2000 0.1861<br />
Yearly (Dividend Option) (Since March 2005)<br />
Quarterly (Dividend Option)<br />
(Since June 2007)<br />
Record Cum Div Dividend Per unit (Re.) For<br />
Date NAV (Rs.) Individuals & HUF O<strong>the</strong>rs<br />
Jun 25, 07 10.5658 0.1800 0.1675<br />
Sep 25, 07 10.6223 0.1800 0.1675<br />
Dec 26, 07 10.8695 0.1800 0.1675<br />
Mar 25, <strong>08</strong> 10.2838 0.1000 0.0931<br />
Quarterly (Dividend Option)<br />
(Since June 2007)<br />
Record Cum Div Dividend Per unit (Re.) For<br />
Date NAV (Rs.) Individuals & HUF O<strong>the</strong>rs<br />
Jun 25, 07 12.1402 0.2000 0.1861<br />
Sep 25, 07 12.3797 0.2000 0.1861<br />
Dec 26, 07 13.0328 0.2700 0.2513<br />
Mar 25, <strong>08</strong> 11.9047 0.2700 0.2513<br />
Jun 25, <strong>08</strong> 11.3412 0.2700 0.2513<br />
Record Cum Div Dividend Per unit (Re.) For<br />
Date NAV (Rs.) Individuals & HUF O<strong>the</strong>rs<br />
Dec 12, 07 11.2528 1.0000 0.9307<br />
(Dividend Option)<br />
Record Cum Div Dividend Per unit (Re.) For Record Cum Div Dividend Per unit (Re.) For<br />
Date NAV (Rs.) Individuals & HUF O<strong>the</strong>rs Date NAV (Rs.) Individuals & HUF O<strong>the</strong>rs<br />
Nov 16, 06 10.9001 0.7500 0.6985 Dec 12, 07 11.2388 1.0000 0.9307<br />
Record Cum Div Dividend Per unit (Re.) For<br />
Date NAV (Rs.) Individuals & HUF O<strong>the</strong>rs<br />
May 02, <strong>08</strong> 10.6705 0.<strong>08</strong>12 0.0756<br />
Jun 02, <strong>08</strong> 10.6555 0.0700 0.0600<br />
Jul 01, <strong>08</strong> 10.6042 0.0231 0.0216<br />
Half-yearly (Dividend Option)<br />
(Since September 2006)<br />
Record Cum Div Dividend Per unit (Re.) For<br />
Date NAV (Rs.) Individuals & HUF O<strong>the</strong>rs<br />
Sep 26, 06 10.5576 0.3000 0.2794<br />
Mar 26, 07 10.2068 0.0500 0.0466<br />
Sep 25, 07 10.5831 0.3000 0.2792<br />
Mar 25, <strong>08</strong> 10.7407 0.3500 0.3258<br />
Record Date Cum Dividend NAV (Rs.) Dividend Per unit (Re.) For<br />
Individuals & HUF<br />
O<strong>the</strong>rs<br />
Mar 24, 05 10.9273 0.5000 0.4676<br />
Mar 26, 07 10.8913 0.2500 0.2328<br />
Mar 25, <strong>08</strong> 11.5996 0.7000 0.6515<br />
^ Past per<strong>for</strong>mance may or may not be sustained in <strong>the</strong> future.<br />
All dividends are on face value <strong>of</strong> Rs.10 per Unit. After payment <strong>of</strong> <strong>the</strong> dividend, <strong>the</strong> per Unit NAV will fall to<br />
<strong>the</strong> extent <strong>of</strong> <strong>the</strong> payout and statutory levy.<br />
Dividend History ^<br />
<strong>HDFC</strong> Growth <strong>Fund</strong><br />
Record Cum Div Dividend Per unit (Rs.) For<br />
Date NAV (Rs.) Individuals & HUF O<strong>the</strong>rs<br />
Dec 15, 04 17.711 2.00 2.00<br />
Dec 30, 05 23.123 2.50 2.50<br />
<strong>HDFC</strong> Equity <strong>Fund</strong><br />
Record Date NAV per Unit (Rs.) Dividend<br />
Cum Dividend Per Unit (Rs.)<br />
Jul 15, 03 17.097 2.00<br />
Sep 30, 03 18.792 2.50<br />
Mar 19, 04 20.790 1.50<br />
<strong>HDFC</strong> Top 200 <strong>Fund</strong><br />
Record Date NAV per Unit (Rs.) Dividend<br />
Cum Dividend Per Unit (Rs.)<br />
Jul 15, 03 16.272 2.00<br />
Oct 31, 03 19.899 2.50<br />
Mar <strong>08</strong>, 04 21.959 1.50<br />
<strong>HDFC</strong> Capital Builder <strong>Fund</strong><br />
Record Cum Div Dividend Per unit (Rs.) For<br />
Date NAV (Rs.) Individuals & HUF O<strong>the</strong>rs<br />
Feb 04, 05 22.552 5.00 5.00<br />
Feb 17, 06 26.620 5.00 5.00<br />
Record Cum Div Dividend Per unit (Rs.) For<br />
Date NAV (Rs.) Individuals & HUF O<strong>the</strong>rs<br />
Jan 13, 06 19.301 2.25 2.25<br />
Jan 11, 07 22.610 3.00 3.00<br />
Jan 10, <strong>08</strong> 28.229 3.00 3.00<br />
<strong>HDFC</strong> Arbitrage <strong>Fund</strong> (Since January 20<strong>08</strong>)<br />
Monthly (Dividend Option) Quarterly (Dividend Option)<br />
Record Cum Div Dividend Per unit (Re.) For<br />
Date NAV (Rs.) Individuals & HUF O<strong>the</strong>rs<br />
Retail Option<br />
Jan 31, <strong>08</strong> 10.2640 0.2500 0.2500<br />
Mar 25, <strong>08</strong> 10.1050 0.1050 0.1050<br />
Apr 25, <strong>08</strong> 10.0470 0.0470 0.0470<br />
May 26, <strong>08</strong> 10.0630 0.0630 0.0630<br />
Jun 25, <strong>08</strong> 10.0500 0.0500 0.0500<br />
Wholesale Option<br />
Jan 31, <strong>08</strong> 10.2710 0.2600 0.2600<br />
Mar 25, <strong>08</strong> 10.1050 0.1050 0.1050<br />
Apr 25, <strong>08</strong> 10.0480 0.0480 0.0480<br />
May 26, <strong>08</strong> 10.0660 0.0660 0.0660<br />
Jun 25, <strong>08</strong> 10.0520 0.0520 0.0520<br />
<strong>HDFC</strong> Balanced <strong>Fund</strong><br />
Record Cum Div Dividend Per unit (Rs.) For<br />
Date NAV (Rs.) Individuals & HUF O<strong>the</strong>rs<br />
Dec 30, 05 18.272 2.00 2.00<br />
Dec 28, 06 20.588 2.50 2.50<br />
<strong>HDFC</strong> Prudence <strong>Fund</strong><br />
Record Date NAV per Unit (Rs.) Dividend<br />
Cum Dividend Per Unit (Rs.)<br />
Jul 15, 03 18.737 2.00<br />
Dec 26, 03 23.711 3.00<br />
Mar 15, 04 20.247 1.50<br />
Dividend Plan<br />
Record Cum Div Dividend Per unit (Rs.) For<br />
Date NAV (Rs.) Individuals & HUF O<strong>the</strong>rs<br />
Dec 28, 06 29.681 3.50 3.50<br />
Dec 27, 07 42.928 4.00 4.00<br />
(Since December 2004)<br />
Dividend Plan<br />
Record Cum Div Dividend Per unit (Rs.) For<br />
Date NAV (Rs.) Individuals & HUF O<strong>the</strong>rs<br />
Nov 30, 04 23.445 3.00 3.00<br />
Mar 17, 06 41.877 5.00 5.00<br />
Mar 07, 07 40.352 5.00 5.00<br />
Mar 07, <strong>08</strong> 45.4470 5.50 5.50<br />
Dividend Plan<br />
Record Cum Div Dividend Per unit (Rs.) For<br />
Date NAV (Rs.) Individuals & HUF O<strong>the</strong>rs<br />
Dec 15, 04 24.066 3.00 3.00<br />
Feb 17, 06 36.409 4.50 4.50<br />
Feb 07, 07 42.968 5.00 5.00<br />
Feb 07, <strong>08</strong> 48.129 5.00 5.00<br />
Dividend Plan<br />
Record Cum Div Dividend Per unit (Rs.) For<br />
Date NAV (Rs.) Individuals & HUF O<strong>the</strong>rs<br />
Feb 07, 07 26.389 3.00 3.00<br />
Feb 07, <strong>08</strong> 30.891 3.50 3.50<br />
<strong>HDFC</strong> Core & Satellite <strong>Fund</strong> <strong>HDFC</strong> Premier Multi-Cap <strong>Fund</strong><br />
Dividend Option Dividend Option<br />
<strong>HDFC</strong> Long Term Advantage <strong>Fund</strong><br />
(An open-ended equity linked savings scheme with a lock-in period <strong>of</strong> 3 years)<br />
Record Cum Div Dividend Per unit (Rs.) For<br />
Date NAV (Rs.) Individuals & HUF O<strong>the</strong>rs<br />
Feb 04, 05 32.5880 5.00 5.00<br />
Jan 13, 06 44.2700 6.00 6.00<br />
<strong>HDFC</strong> TaxSaver<br />
(An open-ended equity linked savings scheme with a lock-in period <strong>of</strong> 3 years)<br />
Record Cum Div Dividend Per unit (Rs.) For<br />
Date NAV (Rs.) Individuals & HUF O<strong>the</strong>rs<br />
Feb 17, 05 40.572 5.00 5.00<br />
Mar 17, 06 67.<strong>08</strong>0 7.50 7.50<br />
Record Cum Div Dividend Per unit (Rs.) For<br />
Date NAV (Rs.) Individuals & HUF O<strong>the</strong>rs<br />
Mar 03, 06 15.756 1.75 1.75<br />
Feb 21, 07 16.654 2.00 2.00<br />
Feb 21, <strong>08</strong> 17.516 2.00 2.00<br />
Record Cum Div Dividend Per unit (Re.) For<br />
Date NAV (Rs.) Individuals & HUF O<strong>the</strong>rs<br />
Retail Option<br />
Jan 31, <strong>08</strong> 10.2640 0.2500 0.2500<br />
Mar 25, <strong>08</strong> 10.1<strong>08</strong>0 0.1<strong>08</strong>0 0.1<strong>08</strong>0<br />
Jun 25, <strong>08</strong> 10.1610 0.1610 0.1610<br />
Wholesale Option<br />
Jan 31, <strong>08</strong> 10.2710 0.2600 0.2600<br />
Mar 25, <strong>08</strong> 10.1040 0.1040 0.1040<br />
Jun 25, <strong>08</strong> 10.1680 0.1680 0.1680<br />
Dividend Plan<br />
Record Cum Div Dividend Per unit (Rs.) For<br />
Date NAV (Rs.) Individuals & HUF O<strong>the</strong>rs<br />
Dec 27, 07 22.7440 2.50 2.50<br />
Dividend Plan<br />
Record Cum Div Dividend Per unit (Rs.) For<br />
Date NAV (Rs.) Individuals & HUF O<strong>the</strong>rs<br />
Mar 18, 05 25.265 5.00 5.00<br />
Mar 03, 06 30.543 5.00 5.00<br />
Feb 21, 07 32.483 5.00 5.00<br />
Feb 21, <strong>08</strong> 33.503 5.00 5.00<br />
Dividend Plan<br />
Record Cum Div Dividend Per unit (Rs.) For<br />
Date NAV (Rs.) Individuals & HUF O<strong>the</strong>rs<br />
Jan 11, 07 46.4680 6.00 6.00<br />
Jan 10, <strong>08</strong> 56.1710 6.00 6.00<br />
Dividend Plan<br />
Record Cum Div Dividend Per unit (Rs.) For<br />
Date NAV (Rs.) Individuals & HUF O<strong>the</strong>rs<br />
Mar 07, 07 60.360 7.50 7.50<br />
Mar 07, <strong>08</strong> 66.0920 8.00 8.00<br />
28 <strong>July</strong> 20<strong>08</strong> Intouchmutually
hdfc-div.qxd 8/8/20<strong>08</strong> 3:39 PM Page 2<br />
Dividend History ^<br />
<strong>HDFC</strong> Cash Management <strong>Fund</strong><br />
Savings Plus Plan (Daily Dividend Option) (Last 6 <strong>month</strong>s)<br />
Month Record Date Ex-dividend NAV per Unit (Rs.) Aggregate Dividend Per Unit (Re.)<br />
<strong>for</strong> <strong>the</strong> <strong>month</strong> Individuals & HUF O<strong>the</strong>rs<br />
Retail Option<br />
February 20<strong>08</strong> Daily 10.0315 0.0525 0.0491<br />
March 20<strong>08</strong> Daily 10.0315 0.0579 0.0540<br />
April 20<strong>08</strong> Daily 10.0315 0.0549 0.0511<br />
May 20<strong>08</strong> Daily 10.0315 0.0527 0.0489<br />
June 20<strong>08</strong> Daily 10.0315 0.0545 0.0507<br />
<strong>July</strong> 20<strong>08</strong> Daily 10.0315 0.06<strong>08</strong> 0.0564<br />
Wholesale Option<br />
February 20<strong>08</strong> Daily 10.0315 0.0557 0.0521<br />
March 20<strong>08</strong> Daily 10.0315 0.0611 0.0567<br />
April 20<strong>08</strong> Daily 10.0315 0.0583 0.0545<br />
May 20<strong>08</strong> Daily 10.0315 0.0553 0.0520<br />
June 20<strong>08</strong> Daily 10.0315 0.0576 0.0539<br />
<strong>July</strong> 20<strong>08</strong> Daily 10.0315 0.0640 0.0600<br />
Record Cum Div Dividend Per unit (Re.) For<br />
Date NAV (Rs.) Individuals & HUF O<strong>the</strong>rs<br />
Retail Plan<br />
Feb 04, <strong>08</strong> 10.0299 0.0139 0.0129<br />
Feb 11, <strong>08</strong> 10.0287 0.0129 0.0120<br />
Feb 18, <strong>08</strong> 10.0288 0.0129 0.0120<br />
Feb 25, <strong>08</strong> 10.0291 0.0132 0.0123<br />
Mar 03, <strong>08</strong> 10.0292 0.0133 0.0124<br />
Mar 10, <strong>08</strong> 10.0287 0.0128 0.0119<br />
Mar 17, <strong>08</strong> 10.0293 0.0134 0.0124<br />
Mar 24, <strong>08</strong> 10.0300 0.0140 0.0131<br />
Mar 31, <strong>08</strong> 10.0316 0.0155 0.0144<br />
Apr 07, <strong>08</strong> 10.0298 0.0138 0.0129<br />
Apr 15, <strong>08</strong> 10.0309 0.0148 0.0138<br />
Apr 21, <strong>08</strong> 10.0269 0.0113 0.0105<br />
Apr 28, <strong>08</strong> 10.0289 0.0131 0.0122<br />
May 05, <strong>08</strong> 10.0290 0.0131 0.0122<br />
May 12, <strong>08</strong> 10.0287 0.0129 0.0120<br />
May 20, <strong>08</strong> 10.0313 0.0151 0.0141<br />
May 26, <strong>08</strong> 10.0270 0.0114 0.0106<br />
Jun 02, <strong>08</strong> 10.0296 0.0136 0.0127<br />
Jun 09, <strong>08</strong> 10.0291 0.0133 0.0123<br />
Jun 16, <strong>08</strong> 10.0295 0.0136 0.0126<br />
Jun 23, <strong>08</strong> 10.0294 0.0135 0.0126<br />
Jul 07, <strong>08</strong> 10.0297 0.0138 0.0128<br />
Jul 14, <strong>08</strong> 10.0300 0.0140 0.0131<br />
Jul 21, <strong>08</strong> 10.0302 0.0142 0.0133<br />
Jul 28, <strong>08</strong> 10.0306 0.0145 0.0135<br />
Weekly Dividend Option (Last 6 <strong>month</strong>s)<br />
Record Cum Div Dividend Per unit (Re.) For<br />
Date NAV (Rs.) Individuals & HUF O<strong>the</strong>rs<br />
Wholesale Plan<br />
Feb 04, <strong>08</strong> 10.0309 0.0072 0.0067<br />
Feb 11, <strong>08</strong> 10.0384 0.0196 0.0183<br />
Feb 18, <strong>08</strong> 10.0317 0.0155 0.0144<br />
Feb 25, <strong>08</strong> 10.0301 0.0141 0.0131<br />
Mar 03, <strong>08</strong> 10.0301 0.0141 0.0131<br />
Mar 10, <strong>08</strong> 10.0297 0.0137 0.0128<br />
Mar 17, <strong>08</strong> 10.0301 0.0142 0.0132<br />
Mar 24, <strong>08</strong> 10.03<strong>08</strong> 0.0147 0.0137<br />
Mar 31, <strong>08</strong> 10.0323 0.0159 0.0148<br />
Apr 07, <strong>08</strong> 10.03<strong>08</strong> 0.0147 0.0136<br />
Apr 15, <strong>08</strong> 10.0321 0.0159 0.0148<br />
Apr 21, <strong>08</strong> 10.0276 0.0119 0.0111<br />
Apr 28, <strong>08</strong> 10.0299 0.0139 0.0129<br />
May 05, <strong>08</strong> 10.0299 0.0139 0.0129<br />
May 12, <strong>08</strong> 10.0295 0.0136 0.0127<br />
May 20, <strong>08</strong> 10.0323 0.0161 0.0149<br />
May 26, <strong>08</strong> 10.0277 0.0120 0.0111<br />
Jun 02, <strong>08</strong> 10.0305 0.0145 0.0135<br />
Jun 09, <strong>08</strong> 10.0299 0.0140 0.0130<br />
Jun 16, <strong>08</strong> 10.0304 0.0144 0.0134<br />
Jun 23, <strong>08</strong> 10.0304 0.0144 0.0134<br />
Jul 07, <strong>08</strong> 10.0306 0.0146 0.0136<br />
Jul 14, <strong>08</strong> 10.0310 0.0149 0.0139<br />
Jul 21, <strong>08</strong> 10.0312 0.0150 0.0140<br />
Jul 28, <strong>08</strong> 10.0315 0.0153 0.0143<br />
Monthly Dividend Option (Last 6 <strong>month</strong>s)<br />
Record Cum Div Dividend Per unit (Re.) For<br />
Date NAV (Rs.) Individuals & HUF O<strong>the</strong>rs<br />
Retail Option<br />
February 25, <strong>08</strong> 10.0696 0.0531 0.0494<br />
March 31, <strong>08</strong> 10.<strong>08</strong>79 0.0691 0.0643<br />
April 28, <strong>08</strong> 10.0697 0.0531 0.0494<br />
May 26, <strong>08</strong> 10.0691 0.0526 0.0490<br />
<strong>July</strong> 28, <strong>08</strong> 10.0737 0.0567 0.0527<br />
Wholesale Option<br />
January 28, <strong>08</strong> 10.<strong>08</strong>39 0.0656 0.0611<br />
February 25, <strong>08</strong> 10.0735 0.0565 0.0525<br />
March 31, <strong>08</strong> 10.0922 0.0729 0.0679<br />
April 28, <strong>08</strong> 10.0735 0.0565 0.0526<br />
May 26, <strong>08</strong> 10.0725 0.0556 0.0517<br />
<strong>July</strong> 28, <strong>08</strong> 10.0776 0.0601 0.0559<br />
^ Past per<strong>for</strong>mance may or may not be sustained in <strong>the</strong> future.<br />
All dividends are on face value <strong>of</strong> Rs.10 per Unit. After payment <strong>of</strong> <strong>the</strong> dividend, <strong>the</strong> per Unit NAV will fall to<br />
<strong>the</strong> extent <strong>of</strong> <strong>the</strong> payout and statutory levy.<br />
<strong>HDFC</strong> Cash Management <strong>Fund</strong><br />
Savings Plan (Daily Dividend Reinvestment Option) (Last 6 <strong>month</strong>s)<br />
Month Record Date Ex-dividend NAV per Unit (Rs.) Aggregate Dividend Per Unit (Re.)<br />
<strong>for</strong> <strong>the</strong> <strong>month</strong> Individuals & HUF O<strong>the</strong>rs<br />
February 20<strong>08</strong> Daily 10.6364 0.0551 0.0551<br />
March 20<strong>08</strong> Daily 10.6364 0.0565 0.0565<br />
April 20<strong>08</strong> Daily 10.6364 0.0555 0.0555<br />
May 20<strong>08</strong> Daily 10.6364 0.0577 0.0577<br />
June 20<strong>08</strong> Daily 10.6364 0.0563 0.0563<br />
<strong>July</strong> 20<strong>08</strong> Daily 10.6364 0.0591 0.0591<br />
Record Cum Div Dividend Per unit (Re..) For<br />
Date NAV (Rs.) Individuals & HUF O<strong>the</strong>rs<br />
Feb 01, <strong>08</strong> 10.6421 0.0135 0.0135<br />
Feb <strong>08</strong>, <strong>08</strong> 10.6417 0.0127 0.0127<br />
Feb 15, <strong>08</strong> 10.6414 0.0130 0.0130<br />
Feb 22, <strong>08</strong> 10.6413 0.0129 0.0129<br />
Feb 29, <strong>08</strong> 10.6413 0.0130 0.0130<br />
Mar 07, <strong>08</strong> 10.6406 0.0124 0.0124<br />
Mar 14, <strong>08</strong> 10.6405 0.0123 0.0123<br />
Mar 24, <strong>08</strong> 10.6496 0.0195 0.0195<br />
Mar 28, <strong>08</strong> 10.6348 0.0079 0.0079<br />
Apr 04, <strong>08</strong> 10.6428 0.0141 0.0141<br />
Apr 11, <strong>08</strong> 10.6411 0.0128 0.0128<br />
Apr 21, <strong>08</strong> 10.6491 0.0190 0.0190<br />
Apr 25, <strong>08</strong> 10.6340 0.0073 0.0073<br />
Weekly Dividend Option (Last 6 <strong>month</strong>s)<br />
Record Cum Div Dividend Per unit (Re.) For<br />
Date NAV (Rs.) Individuals & HUF O<strong>the</strong>rs<br />
May 02, <strong>08</strong> 10.6410 0.0127 0.0127<br />
May 09, <strong>08</strong> 10.6410 0.0127 0.0127<br />
May 16, <strong>08</strong> 10.6415 0.0131 0.0131<br />
May 23, <strong>08</strong> 10.6415 0.0131 0.0131<br />
May 30, <strong>08</strong> 10.6419 0.0134 0.0134<br />
Jun 06, <strong>08</strong> 10.6417 0.0100 0.0100<br />
Jun 13, <strong>08</strong> 10.6419 0.0100 0.0100<br />
Jun 20, <strong>08</strong> 10.6422 0.0100 0.0100<br />
Jun 27, <strong>08</strong> 10.6425 0.0100 0.0100<br />
Jul 04, <strong>08</strong> 10.6421 0.0136 0.0136<br />
Jul 11, <strong>08</strong> 10.6423 0.0137 0.0137<br />
Jul 18, <strong>08</strong> 10.6422 0.0137 0.0137<br />
Jul 25, <strong>08</strong> 10.6431 0.0143 0.0143<br />
<strong>HDFC</strong> Cash Management <strong>Fund</strong> (Call Plan)<br />
Daily Dividend Reinvestment Option (Last 6 <strong>month</strong>s)<br />
Month Record Date Ex-dividend NAV per Unit (Rs.) Aggregate Dividend Per Unit (Re.)<br />
<strong>for</strong> <strong>the</strong> <strong>month</strong> Individuals & HUF O<strong>the</strong>rs<br />
February <strong>08</strong> Daily 10.4266 0.0444 0.0444<br />
March <strong>08</strong> Daily 10.4266 0.0454 0.0454<br />
April <strong>08</strong> Daily 10.4266 0.0381 0.0381<br />
May <strong>08</strong> Daily 10.4266 0.0478 0.0478<br />
June <strong>08</strong> Daily 10.4266 0.0503 0.0503<br />
<strong>July</strong> <strong>08</strong> Daily 10.4266 0.0543 0.0543<br />
<strong>HDFC</strong> Liquid <strong>Fund</strong><br />
(Daily Dividend Reinvestment Option) (Last 6 <strong>month</strong>s)<br />
Month Record Date Ex-dividend NAV per Unit (Rs.) Aggregate Dividend Per Unit (Re.)<br />
<strong>for</strong> <strong>the</strong> <strong>month</strong> Individuals & HUF O<strong>the</strong>rs<br />
February 20<strong>08</strong> Daily 10.1982 0.0533 0.0533<br />
March 20<strong>08</strong> Daily 10.1982 0.0548 0.0548<br />
April 20<strong>08</strong> Daily 10.1982 0.0529 0.0529<br />
May 20<strong>08</strong> Daily 10.1982 0.0554 0.0554<br />
June 20<strong>08</strong> Daily 10.1982 0.0543 0.0543<br />
<strong>July</strong> 20<strong>08</strong> Daily 10.1982 0.0576 0.0576<br />
<strong>HDFC</strong> Liquid <strong>Fund</strong><br />
Monthly Dividend Option (Last 6 <strong>month</strong>s)<br />
Record Date Cum Dividend NAV (Rs.) Dividend Per unit (Re.) For<br />
Individuals & HUF<br />
O<strong>the</strong>rs<br />
Feb 25, <strong>08</strong> 10.3279 0.0506 0.0506<br />
Mar 31, <strong>08</strong> 10.3449 0.0638 0.0638<br />
Apr 28, <strong>08</strong> 10.3273 0.0501 0.0501<br />
May 26, <strong>08</strong> 10.3274 0.0502 0.0502<br />
<strong>July</strong> 28, <strong>08</strong> 10.3323 0.0540 0.0540<br />
<strong>HDFC</strong> Liquid <strong>Fund</strong> - Premium Plan<br />
(Daily Dividend Option) (Last 6 <strong>month</strong>s)<br />
Month Record Date Ex-dividend NAV per Unit (Rs.) Aggregate Dividend Per Unit (Re.)<br />
<strong>for</strong> <strong>the</strong> <strong>month</strong> Individuals & HUF O<strong>the</strong>rs<br />
February 20<strong>08</strong> Daily 12.2598 0.0644 0.0644<br />
March 20<strong>08</strong> Daily 12.2598 0.0666 0.0666<br />
April 20<strong>08</strong> Daily 12.2598 0.0643 0.0643<br />
May 20<strong>08</strong> Daily 12.2598 0.0672 0.0672<br />
June 20<strong>08</strong> Daily 12.2598 0.0640 0.0640<br />
<strong>July</strong> 20<strong>08</strong> Daily 12.2598 0.0696 0.0696<br />
Intouchmutually<br />
<strong>July</strong> 20<strong>08</strong> 29
hdfc-div.qxd 8/8/20<strong>08</strong> 3:39 PM Page 3<br />
Dividend History ^<br />
<strong>HDFC</strong> Gilt <strong>Fund</strong> (Since December 2006)<br />
Short Term Plan (Dividend Option)<br />
Record Cum Div Dividend Per unit (Re.) For<br />
Date NAV (Rs.) Individuals & HUF O<strong>the</strong>rs<br />
Mar 26, 07 10.5816 0.1000 0.0931<br />
Jun 25, 07 10.6272 0.1000 0.0931<br />
Sep 25, 07 10.6616 0.1000 0.0931<br />
Dec 26, 07 10.6982 0.1000 0.0931<br />
Mar 25, <strong>08</strong> 10.8113 0.1000 0.0931<br />
Jun 25, <strong>08</strong> 10.6134 0.1000 0.0931<br />
<strong>HDFC</strong> Floating Rate Income <strong>Fund</strong><br />
Short Term Plan (Weekly Dividend Option) (Last 6 <strong>month</strong>s)<br />
Record Cum Div Dividend Per unit (Re.) For<br />
Date NAV (Rs.) Individuals & HUF O<strong>the</strong>rs<br />
Retail Option<br />
Feb 04, <strong>08</strong> 10.1522 0.0147 0.0137<br />
Feb 11, <strong>08</strong> 10.15<strong>08</strong> 0.0135 0.0125<br />
Feb 18, <strong>08</strong> 10.1507 0.0134 0.0125<br />
Feb 25, <strong>08</strong> 10.1511 0.0137 0.0128<br />
Mar 03, <strong>08</strong> 10.1509 0.0136 0.0127<br />
Mar 10, <strong>08</strong> 10.15<strong>08</strong> 0.0135 0.0126<br />
Mar 17, <strong>08</strong> 10.1511 0.0138 0.0128<br />
Mar 24, <strong>08</strong> 10.1515 0.0142 0.0132<br />
Mar 31, <strong>08</strong> 10.1531 0.0155 0.0144<br />
Apr 07, <strong>08</strong> 10.1522 0.0147 0.0137<br />
Apr 15, <strong>08</strong> 10.1529 0.0153 0.0142<br />
Apr 21, <strong>08</strong> 10.1487 0.0117 0.0109<br />
Apr 28, <strong>08</strong> 10.1511 0.0138 0.0128<br />
May 05, <strong>08</strong> 10.1507 0.0134 0.0125<br />
May 12, <strong>08</strong> 10.1506 0.0133 0.0124<br />
May 20, <strong>08</strong> 10.1532 0.0156 0.0145<br />
May 26, <strong>08</strong> 10.1488 0.0117 0.0109<br />
Jun 02, <strong>08</strong> 10.1515 0.0141 0.0132<br />
Jun 09, <strong>08</strong> 10.1511 0.0138 0.0128<br />
Jun 16, <strong>08</strong> 10.1516 0.0142 0.0132<br />
Jun 23, <strong>08</strong> 10.1512 0.0139 0.0129<br />
Jul 07, <strong>08</strong> 10.1519 0.0144 0.0134<br />
Jul 14, <strong>08</strong> 10.1523 0.0148 0.0138<br />
Jul 21, <strong>08</strong> 10.1521 0.0147 0.0136<br />
Jul 28, <strong>08</strong> 10.1526 0.0150 0.0140<br />
Feb 01, <strong>08</strong> 10.2191 0.0422 0.0393<br />
Feb 18, <strong>08</strong> 10.2214 0.0442 0.0412<br />
Mar 03, <strong>08</strong> 10.2059 0.0307 0.0285<br />
Mar 17, <strong>08</strong> 10.1931 0.0194 0.0181<br />
Apr 01, <strong>08</strong> 10.2134 0.0372 0.0346<br />
Apr 16, <strong>08</strong> 10.2091 0.0335 0.0311<br />
May 02, <strong>08</strong> 10.2287 0.0506 0.0471<br />
May 16, <strong>08</strong> 10.1994 0.0250 0.0232<br />
Long Term Plan (Dividend Option)<br />
Record Cum Div Dividend Per unit (Re.) For<br />
Date NAV (Rs.) Individuals & HUF O<strong>the</strong>rs<br />
Dec 26, 06 10.3609 0.1500 0.1397<br />
Jun 25, 07 10.2828 0.1000 0.0931<br />
Sep 25, 07 10.3120 0.1500 0.1396<br />
Dec 26, 07 10.4530 0.1500 0.1396<br />
Mar 25, <strong>08</strong> 10.5135 0.1500 0.1396<br />
Record Cum Div Dividend Per unit (Re.) For<br />
Date NAV (Rs.) Individuals & HUF O<strong>the</strong>rs<br />
Wholesale Option<br />
Feb 04, <strong>08</strong> 10.1529 0.0153 0.0142<br />
Feb 11, <strong>08</strong> 10.1515 0.0141 0.0131<br />
Feb 18, <strong>08</strong> 10.1514 0.0140 0.0131<br />
Feb 25, <strong>08</strong> 10.1517 0.0143 0.0133<br />
Mar 03, <strong>08</strong> 10.1516 0.0142 0.0132<br />
Mar 10, <strong>08</strong> 10.1515 0.0141 0.0131<br />
Mar 17, <strong>08</strong> 10.1518 0.0144 0.0134<br />
Mar 24, <strong>08</strong> 10.1521 0.0146 0.0136<br />
Mar 31, <strong>08</strong> 10.1536 0.0160 0.0147<br />
Apr 07, <strong>08</strong> 10.1531 0.0155 0.0145<br />
Apr 15, <strong>08</strong> 10.1536 0.0159 0.0148<br />
Apr 21, <strong>08</strong> 10.1493 0.0122 0.0113<br />
Apr 28, <strong>08</strong> 10.1518 0.0143 0.0133<br />
May 05, <strong>08</strong> 10.1514 0.0140 0.0131<br />
May 12, <strong>08</strong> 10.1512 0.0139 0.0129<br />
May 20, <strong>08</strong> 10.1539 0.0163 0.0152<br />
May 26, <strong>08</strong> 10.1492 0.0121 0.0112<br />
Jun 02, <strong>08</strong> 10.1522 0.0147 0.0137<br />
Jun 09, <strong>08</strong> 10.1518 0.0144 0.0134<br />
Jun 16, <strong>08</strong> 10.1523 0.0148 0.0138<br />
Jun 23, <strong>08</strong> 10.1518 0.0144 0.0134<br />
Jul 07, <strong>08</strong> 10.1525 0.0150 0.0140<br />
Jul 14, <strong>08</strong> 10.1529 0.0154 0.0143<br />
Jul 21, <strong>08</strong> 10.1528 0.0153 0.0142<br />
Jul 28, <strong>08</strong> 10.1533 0.0156 0.0146<br />
Long Term Plan (Fortnightly Dividend Reinvestment Option) (Last 6 <strong>month</strong>s)<br />
Jun 02, <strong>08</strong> 10.2097 0.0340 0.0316<br />
Jun 16, <strong>08</strong> 10.1939 0.0201 0.0188<br />
Jul 01, <strong>08</strong> 10.2307 0.0524 0.0488<br />
<strong>July</strong> 7, <strong>08</strong> 10.1918 0.0183 0.0170<br />
<strong>July</strong> 14, <strong>08</strong> 10.1903 0.0170 0.0158<br />
<strong>July</strong> 21, <strong>08</strong> 10.1881 0.0151 0.0140<br />
<strong>July</strong> 28, <strong>08</strong> 10.1901 0.0168 0.0157<br />
<strong>HDFC</strong> Short Term Plan<br />
Dividend Reinvestment Option (Last 6 <strong>month</strong>s)<br />
Record Cum Div Dividend Per unit (Re.) For<br />
Date NAV (Rs.) Individuals & HUF O<strong>the</strong>rs<br />
Feb 01, <strong>08</strong> 10.3571 0.0350 0.0325<br />
Feb 18, <strong>08</strong> 10.3455 0.0248 0.0231<br />
Mar 03, <strong>08</strong> 10.3451 0.0244 0.0227<br />
Mar 17, <strong>08</strong> 10.3372 0.0175 0.0163<br />
Apr 01, <strong>08</strong> 10.3453 0.0246 0.0229<br />
Apr 16, <strong>08</strong> 10.3585 0.0362 0.0337<br />
<strong>HDFC</strong> Floating Rate Income <strong>Fund</strong><br />
Short Term Plan (Daily Dividend Option)<br />
Month Record Date Ex-dividend NAV per Unit (Rs.) Aggregate Dividend Per Unit (Re.)<br />
<strong>for</strong> <strong>the</strong> <strong>month</strong> Individuals & HUF O<strong>the</strong>rs<br />
Retail Option<br />
February 20<strong>08</strong> Daily 10.<strong>08</strong>09 0.0543 0.0510<br />
March 20<strong>08</strong> Daily 10.<strong>08</strong>09 0.0595 0.0554<br />
April 20<strong>08</strong> Daily 10.<strong>08</strong>09 0.0564 0.0528<br />
May 20<strong>08</strong> Daily 10.<strong>08</strong>09 0.0539 0.0505<br />
June 20<strong>08</strong> Daily 10.<strong>08</strong>09 0.0555 0.0520<br />
<strong>July</strong> 20<strong>08</strong> Daily 10.<strong>08</strong>09 0.0628 0.0584<br />
Wholesale Option<br />
February 20<strong>08</strong> Daily 10.<strong>08</strong>09 0.0562 0.0528<br />
March 20<strong>08</strong> Daily 10.<strong>08</strong>09 0.0610 0.0569<br />
April 20<strong>08</strong> Daily 10.<strong>08</strong>09 0.0584 0.0548<br />
May 20<strong>08</strong> Daily 10.<strong>08</strong>09 0.0560 0.0525<br />
June 20<strong>08</strong> Daily 10.<strong>08</strong>09 0.0577 0.0541<br />
<strong>July</strong> 20<strong>08</strong> Daily 10.<strong>08</strong>09 0.0651 0.0606<br />
<strong>HDFC</strong> Floating Rate Income <strong>Fund</strong><br />
Record Cum Div Dividend Per unit (Re.) For<br />
Date NAV (Rs.) Individuals & HUF O<strong>the</strong>rs<br />
May 02, <strong>08</strong> 10.3900 0.0638 0.0594<br />
May 16, <strong>08</strong> 10.3305 0.0117 0.01<strong>08</strong><br />
Jun 02, <strong>08</strong> 10.3530 0.0314 0.0292<br />
June 16, <strong>08</strong> 10.3250 0.0068 0.0064<br />
Jul 16, <strong>08</strong> 10.3356 0.0161 0.0150<br />
(Last 6 <strong>month</strong>s)<br />
Short Term Plan (Monthly Dividend Option) (Last 6 <strong>month</strong>s)<br />
Record Date Cum Dividend NAV (Rs.) Dividend Per unit (Re.) For<br />
Individuals & HUF<br />
O<strong>the</strong>rs<br />
Retail Option<br />
Feb 25, <strong>08</strong> 10.2076 0.0556 0.0517<br />
Mar 31, <strong>08</strong> 10.2250 0.0709 0.0660<br />
Apr 28, <strong>08</strong> 10.2075 0.0556 0.0517<br />
May 26, <strong>08</strong> 10.2060 0.0542 0.0505<br />
<strong>July</strong> 28, <strong>08</strong> 10.2115 0.0591 0.0550<br />
Wholesale Option<br />
Feb 25, <strong>08</strong> 10.2102 0.0539 0.0539<br />
Mar 31, <strong>08</strong> 10.2283 0.0686 0.0686<br />
Apr 28, <strong>08</strong> 10.2099 0.0537 0.0537<br />
May 26, <strong>08</strong> 10.2<strong>08</strong>5 0.0525 0.0525<br />
<strong>July</strong> 28, <strong>08</strong> 10.2143 0.0572 0.0572<br />
<strong>HDFC</strong> Liquid <strong>Fund</strong><br />
Weekly Dividend Option (Last 6 <strong>month</strong>s)<br />
Record Cum Div Dividend Per unit (Re.) For<br />
Date NAV (Rs.) Individuals & HUF O<strong>the</strong>rs<br />
Record Cum Div Dividend Per unit (Re.) For<br />
Date NAV (Rs.) Individuals & HUF O<strong>the</strong>rs<br />
^ Past per<strong>for</strong>mance may or may not be sustained in <strong>the</strong> future.<br />
All dividends are on face value <strong>of</strong> Rs.10 per Unit. After payment <strong>of</strong> <strong>the</strong> dividend, <strong>the</strong> per Unit NAV will fall to <strong>the</strong> extent <strong>of</strong> <strong>the</strong> payout and statutory levy.<br />
Record Cum Div Dividend Per unit (Re.) For<br />
Date NAV (Rs.) Individuals & HUF O<strong>the</strong>rs<br />
Liquid <strong>Fund</strong> Premium Plan Premium Plus Plan<br />
Feb 04, <strong>08</strong> 10.3272 0.0132 0.0132 Feb 04, <strong>08</strong> 12.4968 0.0163 0.0163 Feb 04, <strong>08</strong> 12.4384 0.0162 0.0162<br />
Feb 11, <strong>08</strong> 10.3255 0.0118 0.0118 Feb 11, <strong>08</strong> 12.4950 0.0149 0.0149 Feb 11, <strong>08</strong> 12.4367 0.0149 0.0149<br />
Feb 18, <strong>08</strong> 10.3263 0.0124 0.0124 Feb 18, <strong>08</strong> 12.4952 0.0150 0.0150 Feb 18, <strong>08</strong> 12.4368 0.0150 0.0150<br />
Feb 25, <strong>08</strong> 10.3266 0.0127 0.0127 Feb 25, <strong>08</strong> 12.4959 0.0156 0.0156 Feb 25, <strong>08</strong> 12.4374 0.0154 0.0154<br />
Mar 03, <strong>08</strong> 10.3263 0.0125 0.0125 Mar 03, <strong>08</strong> 12.4955 0.0153 0.0153 Mar 03, <strong>08</strong> 12.4372 0.0153 0.0153<br />
Mar 10, <strong>08</strong> 10.3256 0.0119 0.0119 Mar 10, <strong>08</strong> 12.4946 0.0146 0.0146 Mar 10, <strong>08</strong> 12.4362 0.0145 0.0145<br />
Mar 17, <strong>08</strong> 10.3261 0.0123 0.0123 Mar 17, <strong>08</strong> 12.4953 0.0151 0.0151 Mar 17, <strong>08</strong> 12.4369 0.0150 0.0150<br />
Mar 24, <strong>08</strong> 10.3278 0.0136 0.0136 Mar 24, <strong>08</strong> 12.4973 0.0167 0.0167 Mar 24, <strong>08</strong> 12.4389 0.0166 0.0166<br />
Mar 31, <strong>08</strong> 10.3280 0.0138 0.0138 Mar 31, <strong>08</strong> 12.4975 0.0168 0.0168 Mar 31, <strong>08</strong> 12.4392 0.0168 0.0168<br />
Apr 07, <strong>08</strong> 10.3270 0.0130 0.0130 Apr 07, <strong>08</strong> 12.4376 0.0156 0.0156<br />
Apr 15, <strong>08</strong> 10.3281 0.0139 0.0139 Apr 15, <strong>08</strong> 12.4393 0.0169 0.0169<br />
Apr 21, <strong>08</strong> 10.3241 0.01<strong>08</strong> 0.01<strong>08</strong> Apr 21, <strong>08</strong> 12.4345 0.0132 0.0132<br />
Apr 28, <strong>08</strong> 10.3263 0.0125 0.0125 Apr 28, <strong>08</strong> 12.4371 0.0152 0.0152<br />
May 05, <strong>08</strong> 10.3265 0.0126 0.0126 May 05, <strong>08</strong> 12.4372 0.0153 0.0153<br />
May 12, <strong>08</strong> 10.3259 0.0122 0.0122 May 12, <strong>08</strong> 12.4365 0.0147 0.0147<br />
May 20, <strong>08</strong> 10.3291 0.0147 0.0147 May 20, <strong>08</strong> 12.4405 0.0178 0.0178<br />
May 26, <strong>08</strong> 10.3242 0.01<strong>08</strong> 0.01<strong>08</strong> May 26, <strong>08</strong> 12.4346 0.0132 0.0132<br />
Jun 02, <strong>08</strong> 10.3271 0.0131 0.0131 Jun 02, <strong>08</strong> 12.4382 0.0161 0.0161<br />
Jun 09, <strong>08</strong> 10.3264 0.0125 0.0125 Jun 09, <strong>08</strong> 12.4372 0.0153 0.0153<br />
Jun 16, <strong>08</strong> 10.3270 0.0131 0.0131 Jun 16, <strong>08</strong> 12.4381 0.0159 0.0159<br />
Jun 23, <strong>08</strong> 10.3271 0.0131 0.0131 Jun 23, <strong>08</strong> 12.4381 0.0160 0.0160<br />
Jul 07, <strong>08</strong> 10.3269 0.0129 0.0129 Jul 07, <strong>08</strong> 12.4377 0.0157 0.0157<br />
Jul 14, <strong>08</strong> 10.3277 0.0136 0.0136 Jul 14, <strong>08</strong> 12.4389 0.0166 0.0166<br />
Jul 21, <strong>08</strong> 10.3279 0.0137 0.0137 Jul 21, <strong>08</strong> 12.4390 0.0167 0.0167<br />
Jul 28, <strong>08</strong> 10.3281 0.0139 0.0139 Jul 28, <strong>08</strong> 12.4395 0.0171 0.0171<br />
30 <strong>July</strong> 20<strong>08</strong> Intouchmutually
hdfc-bk1.qxd 8/8/20<strong>08</strong> 3:40 PM Page 1<br />
Methodology<br />
Value Research Ratings<br />
Value Research <strong>Fund</strong> Ratings are a composite measure <strong>of</strong> historical risk-adjusted returns. In <strong>the</strong> case <strong>of</strong> equity and hybrid funds this rating is based on <strong>the</strong> weighted average <strong>month</strong>ly<br />
returns <strong>for</strong> <strong>the</strong> last 3 and 5-year periods. In <strong>the</strong> case <strong>of</strong> debt funds this rating is based on <strong>the</strong> weighted average weekly returns <strong>for</strong> <strong>the</strong> last 18 <strong>month</strong>s and 3-year periods and<br />
in case <strong>of</strong> short-term debt funds - weekly returns <strong>for</strong> <strong>the</strong> last 18 <strong>month</strong>s. These ratings do not take into consideration any entry or exit load.<br />
Five-stars indicate that a fund is in <strong>the</strong> top 10 per cent <strong>of</strong> its category in terms <strong>of</strong> historical risk-adjusted returns. Four stars indicate that a fund is in <strong>the</strong> next 22.5 per cent <strong>of</strong><br />
its category, <strong>the</strong> next 35% receive three stars, <strong>the</strong> next 22.5% receive two stars and <strong>the</strong> bottom 10% receive one star. The number <strong>of</strong> schemes in each category is mentioned along<br />
side <strong>the</strong> categories name. Equity Diversified (114), Equity : Index (19), Equity Tax Planning (18), Hybrid Equity Oriented (26), Hybrid: Monthly Income (34), Debt: Medium-term<br />
(35), Gilt: Medium and Long-term (29), Gilt: Short-term (10), Debt: Ultra Short-term (39), Debt: Ultra Short-term Institutional (43), Debt: Short-term (16), Debt: Floating Rate Shortterm<br />
(18), Debt: Floating Rate Short-term Institutional (11) Debt: Floating Rate Long-term (11), Hybrid: Debt-oriented (17), Debt: Liquid Plus: (11). These <strong>Fund</strong> Ratings are as on<br />
<strong>July</strong> 31, 20<strong>08</strong>.<br />
The Value Research Ratings are published in Monthly <strong>Mutual</strong> <strong>Fund</strong> Per<strong>for</strong>mance Report and <strong>Mutual</strong> <strong>Fund</strong> Insight. The Ratings are subject to change every <strong>month</strong>. The Rating<br />
is based on primary data provided by respective funds, Value Research does not guarantee <strong>the</strong> accuracy.<br />
# S&P CNX 500<br />
<strong>HDFC</strong> Equity <strong>Fund</strong>, <strong>HDFC</strong> Capital Builder <strong>Fund</strong>, <strong>HDFC</strong> TaxSaver and <strong>HDFC</strong> Premier Multi-Cap <strong>Fund</strong>, which are benchmarked to S&P CNX 500 Index are not sponsored, endorsed,<br />
sold or promoted by India Index Services & Products Limited (IISL). IISL is not responsible <strong>for</strong> any errors or omissions or <strong>the</strong> results obtained from <strong>the</strong> use <strong>of</strong> such index and in<br />
no event shall IISL have any liability to any party <strong>for</strong> any damages <strong>of</strong> whatsoever nature (including lost pr<strong>of</strong>its) resulted to such party due to purchase or sale or o<strong>the</strong>rwise <strong>of</strong><br />
such product benchmarked to such index.<br />
Disclaimer:<br />
The in<strong>for</strong>mation contained herein should not be altered in any way, transmitted to, copied or distributed, in part or in whole, to any o<strong>the</strong>r person or to <strong>the</strong> media or reproduced<br />
in any <strong>for</strong>m, without prior written consent <strong>of</strong> <strong>HDFC</strong> Asset Management Company Limited (<strong>HDFC</strong> AMC) or <strong>the</strong> relevant owner <strong>of</strong> <strong>the</strong> intellectual property, as <strong>the</strong> case may<br />
be. All Intellectual property and intellectual property rights belong to <strong>the</strong> relevant owner <strong>of</strong> <strong>the</strong> intellectual property, and “Intouch <strong>Mutual</strong>ly” is a trademark <strong>of</strong> <strong>HDFC</strong> AMC.<br />
Any in<strong>for</strong>mation herein contained does not constitute and shall be deemed not to constitute an advice, an <strong>of</strong>fer to sell/ purchase or as an invitation or solicitation to do so<br />
<strong>for</strong> any securities <strong>of</strong> any entity, and fur<strong>the</strong>r, <strong>HDFC</strong> AMC / its subsidiaries / affiliates / sponsors / trustee (<strong>HDFC</strong> AMC Group) or <strong>the</strong>ir <strong>of</strong>ficers, employees, personnel, directors may<br />
be associated in a commercial, pr<strong>of</strong>essional or personal capacity or may have a commercial interest including as proprietary traders in or with <strong>the</strong> securities and/ or companies<br />
or issues or matters as contained in this publication and such commercial capacity or interest whe<strong>the</strong>r or not differing with or conflicting with this publication, shall not make or<br />
render (<strong>HDFC</strong> AMC Group) liable in any manner whatsoever & (<strong>HDFC</strong> AMC Group) or any <strong>of</strong> <strong>the</strong>ir <strong>of</strong>ficers, employees, personnel, directors shall not be liable <strong>for</strong> any loss, damage,<br />
liability whatsoever <strong>for</strong> any direct or indirect loss arising from <strong>the</strong> use or access <strong>of</strong> any in<strong>for</strong>mation that may be displayed in this publication from time to time. Recipients<br />
<strong>of</strong> <strong>the</strong> in<strong>for</strong>mation contained herein should exercise due care and caution and read <strong>the</strong> <strong>of</strong>fer documents (including if necessary, obtaining <strong>the</strong> advice <strong>of</strong> tax / legal / accounting /<br />
financial / o<strong>the</strong>r pr<strong>of</strong>essionals) prior to taking <strong>of</strong> any decision, acting or omitting to act, on <strong>the</strong> basis <strong>of</strong> <strong>the</strong> in<strong>for</strong>mation contained herein. The printing and mailing cost <strong>of</strong> this<br />
newsletter is charged to <strong>the</strong> respective schemes subject to Securities & Exchange Board <strong>of</strong> India (<strong>Mutual</strong> <strong>Fund</strong>s) Regulations, 1996.<br />
Editorial opinions expressed in Intouch <strong>Mutual</strong>ly (Page no. 3 & 4) are not necessarily those <strong>of</strong> <strong>HDFC</strong> AMC Group, or any <strong>of</strong> <strong>the</strong>ir <strong>of</strong>ficers, employees, personnel, directors and<br />
<strong>HDFC</strong> AMC Group and <strong>the</strong>ir <strong>of</strong>ficers, employees, personnel, directors do not accept responsibility <strong>for</strong> <strong>the</strong> editorial content. <strong>HDFC</strong> AMC Group or any <strong>of</strong> <strong>the</strong>ir <strong>of</strong>ficers, employees,<br />
personnel, directors make no representation as to <strong>the</strong> accuracy, completeness or reliability <strong>of</strong> <strong>the</strong> editorial content and hereby disclaim any liability with regard to <strong>the</strong> same.<br />
Intouchmutually<br />
<strong>July</strong> 20<strong>08</strong> 31
hdfc-bk.qxd 8/8/20<strong>08</strong> 3:41 PM Page 2<br />
Visit us at<br />
www.hdfcfund.com<br />
Telephone Services<br />
Toll-free number : 1800 233 6767<br />
Dedicated number : 60006767<br />
Intouchmutually, <strong>July</strong> 20<strong>08</strong>, RNI Regd. No. MAHENG/2003/1<strong>08</strong>04<br />
WANT TO HAVE THE LATEST INFORMATION ABOUT US <br />
ANDHRA PRADESH<br />
<strong>HDFC</strong> AMC Ltd., 6-3-883/7, 2nd Floor, Saphire Square, Somajiguda, Hyderabad 500 282.<br />
Tel: 040 - 2341 7401-05, Fax: 040 - 2341 7407.<br />
<strong>HDFC</strong> AMC Ltd., 2nd Floor, Centurion Bank Complex, Near Benz Circle,<br />
M. G. Road, Vijayawada - 520 010 Tel. No: (<strong>08</strong>66)-3988029<br />
<strong>HDFC</strong> AMC Ltd., Ground Floor, Saigopal Arcade, Opp Waltair Club, Waltair Main Road, Siripuram,<br />
Visakhapatnam 530 003. Tel: <strong>08</strong>91- 276 9636, Fax: <strong>08</strong>91 - 255 0411.<br />
ASSAM<br />
<strong>HDFC</strong> AMC Ltd., Premises- 1C, 1st Floor, Ganpati Enclave, G.S.Road, Guwahati -781 007<br />
Tel No.: (0361)-2464759/60 Fax No.: (0361)-2464758<br />
BIHAR<br />
<strong>HDFC</strong> AMC Ltd., C/o. Hera Enclave (adjacent to Sahara Unique Showroom), Mezzanine Floor,<br />
New Dak Bungalow Road, Patna 800 001.<br />
Tel: 0612 - 2230540. 3201439, 2200747, 9931770771Fax: 0612 - 2200747.<br />
DELHI<br />
<strong>HDFC</strong> AMC Ltd., 4th Floor, Mohan Dev Bldg., 13, Tolstoy Marg, Connaught Place,<br />
New Delhi 110 001.Tel: 011 - 6632 4000. Fax: 011 - 2335 1317.<br />
GOA<br />
<strong>HDFC</strong> AMC Ltd., Ground Floor, G3 & G4 Jivottam, Minguel Miranda Road, Off. Abade Faria Road,<br />
Margao - 403 601, Tel.No-<strong>08</strong>32 - 2737410 / 2737411,Fax No-<strong>08</strong>32-2736477<br />
<strong>HDFC</strong> AMC Ltd., A3, First Floor, Krishna Building, Opp. Education Dept, Behind Susheela Building, G.P. Road,<br />
Panaji, Goa 403 001. Tel: <strong>08</strong>32 - 242 5609, 242 5610, Fax: <strong>08</strong>32 - 242 5614.<br />
GUJARAT<br />
<strong>HDFC</strong> AMC Ltd., 2nd Floor, Megha House, Besides Gruh House, Mithakhali Six Roads,<br />
Ahmedabad 380 009. Tel: (B) 079 - 4005 0055/66 Telefax: 079 - 4005 0506.<br />
<strong>HDFC</strong> AMC Ltd., Maruti Sharanam, No.117, 1st Floor, Anand-Vidhyanagar Road, Opposite Nandbhumi<br />
Party Plot, Anand - 388 001. Tel : (02692) - 398200 Fax : (02692) - 398222<br />
<strong>HDFC</strong> AMC Ltd., 2nd Floor, Gangotri Plaza, Opposite Daxinamurty School, Waghawadi Road,<br />
Bhavnagar - 364 001. Tel : (0278) - 3988029 Fax : (0278) - 3984039<br />
<strong>HDFC</strong> AMC Ltd., 2nd Floor, Keshav Complex, P N Marg, Opposite Dhanvantry,<br />
Jamnagar - 361 001. Tel : (0288) - 3988029 Fax : (0288) - 3982426<br />
<strong>HDFC</strong> AMC Ltd., Upper Ground Floor, Gokulesh, R C Dutt Road,<br />
Vadodara 390 007. Tel: 0265 6621110, 6621120, Fax 0265 6621150.<br />
<strong>HDFC</strong> AMC Ltd., U1 - U3, Jolly Plaza, Opp Athwa Gate Police Station,<br />
Athwa Gate, Surat 395 001. Tel: 0261 - 246 0<strong>08</strong>2 / 83. Fax: 0261 - 246 0091.<br />
<strong>HDFC</strong> AMC Ltd., 2nd Floor, Shiv Darshan,Dr Radha Krishnan Road, 5, Jagnath Plot Corner,<br />
Rajkot - 360 001. Tel: 0281 552 4881/2<br />
HARYANA<br />
<strong>HDFC</strong> AMC Ltd., 1175 B Royal 1, 1st Floor, Adjoining Gurudawara, G.T Road, Panipat - 132 103<br />
Tel: (0180) 3985400/ 01 Fax: (0180) 3985403<br />
JAMMU & KASHMIR<br />
<strong>HDFC</strong> AMC Ltd., Hall No-102 A/2, South Block, Bahu Plaza, Gandhi Nagar, Jammu - 180 012<br />
Tel No.: (0191)-2477911/12/13 (0191) 2474297/98/99<br />
JHARKHAND<br />
<strong>HDFC</strong> AMC Ltd., Vardhan Complex, 1st Floor, Opp. Sreelea<strong>the</strong>rs Showroom, Bank More,<br />
Dhanbad - 826 001 Tel No.: (0326) 3205352, 2301756 Fax No.: (0326) 2300552<br />
<strong>HDFC</strong> AMC Ltd., Gayatri Enclave, “K” Road, Bistupur, Jamshedpur 831 001.<br />
Tel: 0657 - 2426730. Telefax: 0657 - 3291826.<br />
<strong>HDFC</strong> AMC Ltd., Pradhan Towers, 1st Floor, 5, Main Road, Ranchi - 834 001<br />
Tel No.: (0651) 6003358 Fax No.: (0651) 3242077<br />
KARNATAKA<br />
<strong>HDFC</strong> AMC Ltd., No.114, 1st Floor, Prestige Towers, 99 & 100, Residency Road,<br />
Bangalore 560 025. Tel: <strong>08</strong>0 - 6620 5300, Fax: <strong>08</strong>0 - 4112 5255.<br />
<strong>HDFC</strong> AMC Ltd., Plot # 8 & 73, 3rd Floor, Rajesh Building, Super Market, Main Road,<br />
Gulbarga - 585 101. Tel: (<strong>08</strong>472) 399910 Fax: (<strong>08</strong>472) 271041<br />
<strong>HDFC</strong> AMC Ltd., No. 1, First Floor, Revankar Com<strong>for</strong>ts, Vivekanand Road, Court Circle,<br />
Hubli - 580 029. Tel No.: (<strong>08</strong>36) 4252 294 / 95 Fax No: (<strong>08</strong>36) 4252 290<br />
<strong>HDFC</strong> AMC Ltd., UG - II, 6 & 7, Upper Ground Floor, Maximus Commercial Complex,<br />
Light House Hill Road, Opp. KMC, Mangalore 575 001.<br />
Tel: <strong>08</strong>24 428 5333 (B), 428 5337 (D) Fax: <strong>08</strong>24 - 428 5336.<br />
<strong>HDFC</strong> AMC Ltd., No. 2918, CH 51 / 1 B, 1st Floor, Patel Mansion, Kantharaj Urs Road,<br />
Saraswathipuram, Mysore - 570 009. Tel No.: (<strong>08</strong>21) 4000 530 Fax No: (<strong>08</strong>21) 4000 535<br />
KERALA<br />
<strong>HDFC</strong> AMC Ltd., 3rd Floor, City Mall, Opposite YMCA, Kannur Road, Calicut - 673 001.<br />
Tel: (0495) - 4099222 / 333, 3982310 Fax: (0495) - 3982330<br />
<strong>HDFC</strong> AMC Ltd., Ground Floor, Cinema Cum Commercial Complex,<br />
Behind Ravipuram Bus Stop, M.G. Road, Kochi 682 016,<br />
Tel: 0484 - 235 7707 / <strong>08</strong>, 394 3058 / 059, 235 8462. Telefax: 0484 - 235 8462.<br />
<strong>HDFC</strong> AMC Ltd., Ground Floor, Bhadra Tower, Cotton Hill Road, Vazhuthacaud, Thycaud PO,<br />
Trivandrum - 695 014. Tel: 0471 - 3983 730 / 731 / 732, Fax: 0471 - 3983 738<br />
MADHYA PRADESH<br />
<strong>HDFC</strong> AMC Ltd.,Ranjit Towers, Zone II, 8 MP Nagar, Bhopal 462 011.<br />
Tel: 0755 - 428 5385, 427 7772, 527 3330 Fax: 0755 - 427 3331.<br />
<strong>HDFC</strong> AMC Ltd., First Floor, Alakhnanda Towers, Shrimant Madhav Rao Scindia Marg, City Centre,<br />
Gwalior - 474 001. Tel No.: (0751) - 4066060, 3988029 Fax No.: (0751) - 3982803<br />
<strong>HDFC</strong> AMC Ltd., 15/3, Sterling Arcade, Race Course Rd., Indore - 452 001.<br />
Tel: 0731 - 424 5434 / 35 (B) Fax: 0731 - 424 5436.<br />
<strong>HDFC</strong> AMC Ltd., First Floor, Muthye Udyog Bhawan,1039, Wright Town, Opp. Telephone Exchange,<br />
Jabalpur - 482 002. Tel No.: (0761) - 4049800, 3988029 Fax No.: (0761) - 4068814<br />
MAHARASHTRA<br />
<strong>HDFC</strong> AMC Ltd., 2nd Floor, Renuka Commercial Complex, Samarth Nagar, Nirala Bazar,<br />
Nageshwar Wadi Road, Aurangabad - 431 001. Tel: (0240) - 3988029 Fax: (0240) - 3982068<br />
<strong>HDFC</strong> AMC Ltd., 138, Ground Floor, Kavya Ratnavali Chowk, Omkareshwar Road, Jalgaon – 425 002.<br />
Tel. No.: (0257) 3982100/ 01 Fax : (0257) 3982114<br />
e-mail<br />
INVESTOR SERVICE CENTRES (ISCs)<br />
For any query or suggestions:-<br />
Investors may contact us at:<br />
cliser@hdfcfund.com<br />
Distributors may contact us at:<br />
broser@hdfcfund.com<br />
SMS: <strong>HDFC</strong>MF to 56767<br />
<strong>HDFC</strong> AMC Ltd., Royal Prestige, C1/C9, 1st Floor, E - Ward, Sykes Extension,<br />
Rajarampuri Road, Kolhapur - 416 0<strong>08</strong>. Tel : (0231) - 3988029 Fax : (0231) - 3982060<br />
<strong>HDFC</strong> AMC Ltd., Shop No. 3, Ground Floor, Abhishek Building,Irla Bridge, S.V. Road, Andheri (W),<br />
Mumbai - 400 058. Tel.: (022) 32157334/332 Fax: (022) 26241131<br />
<strong>HDFC</strong> AMC Ltd., Mistry Bhavan, 1st Flr, 122, Backbay Reclamation, Dinsha Vachha Road, Churchgate,<br />
Mumbai 400 020. Tel: 022 - 6631 6300 Fax: 022 - 2282 1144.<br />
<strong>HDFC</strong> AMC Ltd., Shop # 7, Abhilasha Building, Punjabi Lane, Borivali (W), Mumbai - 400 092<br />
Tel: (022) 32157268 / 342 Fax: (022) 32719222<br />
<strong>HDFC</strong> AMC Ltd Shop No. 1 & 2, Ground Floor, Atlantic Tower, R B Mehta Road,<br />
Near Railway Station, Ghatkopar (East), Mumbai - 400 077.<br />
Tel: (022) 65253409/<strong>08</strong>/06/21 Fax: (022) 25116805<br />
<strong>HDFC</strong> AMC Ltd., 106-110, Shriram Shyam Towers, 2nd Floor, Next to NIT Building, Kingsway, Sadar,<br />
Nagpur 440 001. Tel: 0712 - 663 0301 / 02 / 04, Fax: 0712 - 663 0206.<br />
<strong>HDFC</strong> AMC Ltd., G-1 & G-2, Ground Floor, Suyojit Heights Opp. Rajiv Gandhi Bhavan, Sharanpur Road,<br />
Nashik 422 002. Tel: 0253 - 661 1831/32 (B), 661 1835 (D) Fax: 0253 - 661 1836.<br />
<strong>HDFC</strong> AMC Ltd., <strong>HDFC</strong> House, 2nd Floor, Shivaji Nagar, University Road, Pune 411 005.<br />
Tel: 020 - 2552 1680 / 2552 1681, Fax: 020 - 2552 1683.<br />
<strong>HDFC</strong> AMC Ltd Shop No. 21/22, Ground Floor, Rajdeep CHS, Near Malhar Cinema,<br />
Gokhale Road, Thane (West) - 400 602. Tel: (022) 67124172/73/74/75/76 Fax: (022) 67124177<br />
<strong>HDFC</strong> AMC Ltd., BSE 1, Tech Building, 109, A Wing, 1st Floor,<br />
Opposite Vashi railway station, Sector 30, Vashi - 400 703. Tel: (022) - 39880299<br />
ORISSA<br />
<strong>HDFC</strong> AMC Ltd., 2nd Floor, Vinayak 96, Janpath, Bhubaneshwar 751 001<br />
Tel: 0674 - 645 0502, 645 1502, Telefax: 0674 - 253 1483.<br />
<strong>HDFC</strong> AMC Ltd., 1st Floor, Plot No. 2690 (P) Bajrakabati Road, Ranihat, Cuttack – 753 001.<br />
Tel: (0671) 2323724/ 725 Fax: (0671) 2324741<br />
<strong>HDFC</strong> AMC Ltd., Praful Tower, 1st Floor, Panposh Road, Rourkela - 769 004<br />
Tel No.: (0661) - 3988029,3982060/70 Fax No.: (0661) -3982068<br />
PONDICHERRY<br />
<strong>HDFC</strong> AMC Ltd., No.17, I Floor, Sree Velayudham Complex, Near Indhira Gandhi Square, Natesan Nagar,<br />
Pondicherry - 605 005. Tel: (0413) 3043 293 / 500 / 600 Fax: (0413) 2206776<br />
PUNJAB<br />
<strong>HDFC</strong> AMC Ltd., SCO-28, 1st Floor, Taneja Towers, District Shopping Complex, Ranjit Avenue,<br />
Amritsar-143 001. Tel: (0183) 3988029 / 2570 Fax: (0183) 3982599<br />
<strong>HDFC</strong> AMC Ltd., SCO 375-376, Ground Floor, Sector 35-B, Chandigarh 160 022.<br />
Tel: 0172 - 262 3397, 262 4497, Fax: 0172 - 301 3839.<br />
<strong>HDFC</strong> AMC Ltd., 2nd Floor, Above ING Vysya Bank, Adjacent to Sekhon Grand Hotel,<br />
Namdev Chowk, G T Road, Jalandhar City - 144 001.<br />
Tel: (0181) 3988029 / 970 Fax: (0181) 3982966<br />
<strong>HDFC</strong> AMC Ltd., SCO 122, Feroze Gandhi Market, Ludhiana 141 001.<br />
Tel: 0161 - 277 4321, 501 4321, Fax: 0161 - 301 3838.<br />
RAJASTHAN<br />
<strong>HDFC</strong> AMC Ltd., Moondhra Bhavan, 3 Ajmer Rd, Jaipur 302 001.<br />
Tel: 0141 - 511 1125, 237 4968, Fax: 0141 - 511 1126.<br />
<strong>HDFC</strong> AMC Ltd., Gulab Singh Building, 11, Chopasani Road, Jodhpur - 342 003.<br />
Tel: (0291) - 510 1927, 510 1937. Fax: 0291 - 5105919<br />
<strong>HDFC</strong> AMC Ltd., 1st Floor, Gowardhan Plaza, 25, Trench Colony, Opposite Lok Kalamandal,<br />
Udaipur - 313 001. Tel: (0294) 3988029 Fax: (0294) 3982000<br />
TAMIL NADU<br />
<strong>HDFC</strong> AMC Ltd., ITC Centre, 1st Floor, 760 Anna Salai, Chennai 600 002.<br />
Tel: 044 - 4397 9797, Fax: 044 - 2841 5855<br />
<strong>HDFC</strong> AMC Ltd., 1st Floor, No1 Bhimsena Garden Street, Royapettah High Road, Mylapore,<br />
Chennai – 600 004. Tel: (044) 30913060 Fax: (044) 30913<strong>08</strong>2<br />
<strong>HDFC</strong> AMC Ltd., 1371A, Ground Floor, Nadar Building Trichy Road, Coimbatore 641 018.<br />
Tel: 0422 - 439 1861 / 62 / 63, Fax: 0422 - 439 1714.<br />
<strong>HDFC</strong> AMC Ltd., Investor Service Centre No 127C/3 East Veli Street, Madurai Tel: 0452 - 3988029<br />
<strong>HDFC</strong> AMC Ltd., First floor, Ram Complex, No. 454/3, Meyanoor Main Road, Salem - 636 009.<br />
Tel : (0427) 3982680/700 Fax : (0427) 233361<br />
<strong>HDFC</strong> AMC Ltd., No. 60, Sri Krishna Arcade, First Floor, Tennur High Road, Tennur, Trichy - 620 017<br />
Tel: (0431) 3982830 Fax: (0431) 3982835<br />
UTTARANCHAL<br />
<strong>HDFC</strong> AMC Ld., 76, Rajpur Road, Near RTO, Dehradun - 248 001<br />
Tel: (0135) 3988029/ 7434 Fax: (0135) 3987444<br />
UTTAR PRADESH<br />
<strong>HDFC</strong> AMC Ltd., B2, 1st Floor, 9/4, Shankar Point, Sanjay Place, Agra - 282 002<br />
Tel: (0562) 3984761-73 Fax: (0562) 3984777<br />
<strong>HDFC</strong> AMC Ltd., 1st Floor, 16/80 D, Behind SBI Main, Civil Lines, Kanpur 2<strong>08</strong> 001.<br />
Tel: 0512 - 233 1484-87, Fax: 0512 - 233 1487.<br />
<strong>HDFC</strong> AMC Ltd., 4 Shahnajaf Road, Lucknow 226 001.<br />
Tel: 0522 - 220 7591, 220 0163, Fax: 0522 - 223 04<strong>08</strong>.<br />
<strong>HDFC</strong> AMC Ltd., Parsvnath Plaza-II, UGF Hall No.4, Delhi Road, Moradabad - 244 001<br />
Tel No.: (0591) 3988029 / 3982131 Fax No.: (0591) 3982137<br />
<strong>HDFC</strong> AMC Ltd., K-24/25, Premises No. 36 & 37, Pearl Plaza, Sector-18, Noida - 201 301<br />
Tel No.: (0120) 3988029 Fax No.: (0120) 3980610<br />
<strong>HDFC</strong> AMC Ltd., D-64/127, 4th Floor, Arihant Complex, Sigra, Varanasi - 221010.<br />
Tel: 9935177068, 9935147068<br />
WEST BENGAL<br />
<strong>HDFC</strong> AMC Ltd., City Plaza, City Centre, 1st Floor, Durgapur - 713 216<br />
Tel: (0343) 3982150 Fax: (0343) 3982153<br />
<strong>HDFC</strong> AMC Ltd., Menaka Estate, 1st Floor, 3 Red Cross Place, Kolkata 700 001.<br />
Tel. 033 - 2242 7849/53/56/59. Fax: 033 - 2243 9582.<br />
<strong>HDFC</strong> AMC Ltd., Gitanjali Complex, 2nd Floor, Above Corporation Bank, Sevoke Road,<br />
Siliguri 734 001. Tel No.: (0353) - 6453474 Fax No.: (0353) 2545270<br />
Registered Office: Ramon House, 3rd Floor, H.T. Parekh Marg, 169, Backbay Reclamation, Churchgate, Mumbai 400 020.<br />
Risk <strong>Fact</strong>ors: <strong>Mutual</strong> <strong>Fund</strong>s and securities investments are subject to market risks and <strong>the</strong>re can be no assurance or guarantee that <strong>the</strong> Scheme(s) objectives will be achieved. As with any investment in securities, <strong>the</strong> Net<br />
Asset Value <strong>of</strong> Units issued under <strong>the</strong> Scheme(s) may go up or down depending on <strong>the</strong> various factors and <strong>for</strong>ces affecting <strong>the</strong> capital markets. Past per<strong>for</strong>mance <strong>of</strong> <strong>the</strong> Sponsors and <strong>the</strong>ir affiliates/AMC/<strong>Mutual</strong> <strong>Fund</strong> and<br />
its Scheme(s) do not indicate <strong>the</strong> future per<strong>for</strong>mance <strong>of</strong> <strong>the</strong> Scheme(s) <strong>of</strong> <strong>the</strong> <strong>Mutual</strong> <strong>Fund</strong>. The Sponsors are not responsible or liable <strong>for</strong> any loss or shortfall resulting from <strong>the</strong> operations <strong>of</strong> <strong>the</strong> Scheme(s) beyond <strong>the</strong><br />
contribution <strong>of</strong> Rs.1 lakh each made by <strong>the</strong>m towards <strong>the</strong> corpus <strong>of</strong> <strong>the</strong> <strong>Mutual</strong> <strong>Fund</strong>. The names <strong>of</strong> <strong>the</strong> Scheme(s) <strong>of</strong> <strong>the</strong> <strong>HDFC</strong> <strong>Mutual</strong> <strong>Fund</strong> do not in any manner indicate ei<strong>the</strong>r <strong>the</strong> quality <strong>of</strong> <strong>the</strong> Scheme(s) or <strong>the</strong>ir<br />
future prospects and returns. “Standard & Poor’s® and “S&P® are trademarks <strong>of</strong> The McGraw-Hill Companies, Inc. and have been licensed <strong>for</strong> use by India Index Services & Products Limited (IISL), which has sublicensed<br />
such marks to <strong>the</strong> <strong>HDFC</strong> Asset Management Company Limited. The S&P CNX Nifty is not compiled, calculated or distributed by Standard & Poor’s and Standard & Poor’s and IISL make no representation regarding <strong>the</strong><br />
advisability <strong>of</strong> investing in products that utilize any such Index as a component. All rights in <strong>the</strong> SENSEX vest in Bombay Stock Exchange Ltd. (“BSE”). BSE and SENSEX are trademarks <strong>of</strong> BSE and are used by <strong>HDFC</strong> Asset<br />
Management Company Limited under license. BSE shall not be liable in any manner whatsoever (including in negligence) <strong>for</strong> any loss arising to any person whosoever out <strong>of</strong> use <strong>of</strong> or reliance on <strong>the</strong> SENSEX by any person.<br />
Investors in <strong>the</strong> Scheme(s) are not being <strong>of</strong>fered any guaranteed/assured returns. Please read <strong>the</strong> respective Offer Documents carefully be<strong>for</strong>e investing. In view <strong>of</strong> <strong>the</strong> individual nature <strong>of</strong> tax consequences, each investor<br />
is advised to consult his/her pr<strong>of</strong>essional tax advisor. Applications would be accepted at Investor Service Centres (ISCs) and on-going Redemptions (subject to completion <strong>of</strong> Lock-in-Period, if any) can be made at <strong>the</strong> ISCs<br />
on all Business Days.The AMC will calculate and publish NAVs on all Business Days. This <strong>month</strong>ly newsletter contains unaudited figures. Statutory Details: <strong>HDFC</strong> <strong>Mutual</strong> <strong>Fund</strong> has been set up as a trust sponsored by Housing<br />
Development Finance Corporation Limited and Standard Life Investments Limited (liability restricted to <strong>the</strong>ir contribution <strong>of</strong> Rs 1 lakh each to <strong>the</strong> corpus) with <strong>HDFC</strong> Trustee Company Limited as <strong>the</strong> Trustee (Trustee under<br />
<strong>the</strong> Indian Trusts Act, 1882) and with <strong>HDFC</strong> Asset Management Company Limited as <strong>the</strong> Investment Manager.<br />
Published and printed by Shailendra Sharad Kalelkar <strong>for</strong> and on behalf <strong>of</strong> Business Standard Limited from H4, Paragon Condominium, Opposite Century Mills, P B Marg, Worli, Mumbai 400013, and<br />
printed at Print House India Private Limited, 6, Datta Mandir Road, Bhandup (W), Mumbai 400 078. Editor: Suveen K. Sinha.