Kilimanjaro - Tanzania Online Gateway
Kilimanjaro - Tanzania Online Gateway
Kilimanjaro - Tanzania Online Gateway

You also want an ePaper? Increase the reach of your titles
YUMPU automatically turns print PDFs into web optimized ePapers that Google loves.
TABLE OF CONTENTS<br />
Pages<br />
FOREWORD..........................................................................................................................v<br />
SECTION I<br />
1.0 LAND PEOPLE AND CLIMATE: .........................................................................1<br />
1.1 Geographical Location:............................................................................................ 1<br />
1.2 Land Area and Administrative Units:.................................................................... 1<br />
1.3 Ethnic Groups:........................................................................................................... 2<br />
1.4 Early Contacts With Europeans:............................................................................ 3<br />
1.5 Population Size, Growth and Density:................................................................... 4<br />
1.6 Migration:................................................................................................................ 17<br />
1.7 Unemployment:....................................................................................................... 19<br />
1.8 Climate and Soil:...................................................................................................... 20<br />
1.8 Physical Features:................................................................................................... 21<br />
1.10 Agro-Econimic/Ecological Zone:......................................................................... 21<br />
1.11 Land Use Pattern and Utilization:......................................................................... 25<br />
1.12 Land Scarcity:.......................................................................................................... 27<br />
SECTION II<br />
2.0 REGIONAL ECONOMY.......................................................................................28<br />
2.1 Introduction:............................................................................................................ 28<br />
2.2 Regional GDP and Per Capita GDP....................................................................... 28<br />
2.3 Socio-economic Indicators:................................................................................... 34<br />
2.4 Productive Sector: .................................................................................................. 35<br />
2.4.1 Agriculture:................................................................................................. 35<br />
2.4.2 Livestock Development:........................................................................... 52<br />
2.4.3 Natural Resources:..................................................................................... 61<br />
2.5 Manufacturing Sector:........................................................................................... 71<br />
i
SECTION III<br />
3.0 ECONOMIC INFRASTRUCTURE......................................................................75<br />
3.1 Introduction:............................................................................................................ 75<br />
3.2 Roads Network........................................................................................................ 75<br />
3.3 Railways:.................................................................................................................. 79<br />
3.4 Air Transport:.......................................................................................................... 79<br />
3.5 Electricity:................................................................................................................ 80<br />
3.6 Telecommunication/Telephone:........................................................................... 81<br />
3.7 Fuel Wood:.............................................................................................................. 82<br />
SECTION IV<br />
4.0 SOCIAL SERVICES : ............................................................................................83<br />
4.1 EDUCATION SECTOR:........................................................................................ 83<br />
4.1.1 Introduction:............................................................................................... 83<br />
4.1.2 Enrolment:................................................................................................... 85<br />
4.1.3 Dropouts:.................................................................................................... 93<br />
4.1.4 Primary School Facilities:.......................................................................... 96<br />
4.1.5 Nursery Schools:...................................................................................... 104<br />
4.1.6 Secondary Schools:................................................................................. 104<br />
4.1.7 Vocational Training Centres:.................................................................. 108<br />
4.1.8 Literacy:..................................................................................................... 108<br />
4.2 HEALTH SECTOR ................................................................................................ 113<br />
4.2.1 Introduction:............................................................................................. 113<br />
4.2.2 Organisational Structure ......................................................................... 115<br />
4.2.3 Referral System......................................................................................... 116<br />
4.2.4 Adequacy and Accessibility:................................................................. 117<br />
4.2.5 Health Indicators:..................................................................................... 123<br />
4.3 WATER SECTOR................................................................................................. 130<br />
4.3.1 Introduction.............................................................................................. 130<br />
4.3.2 Rural Water Supply ................................................................................. 131<br />
4.3.3 Coverage of Rural Water Supply:.......................................................... 132<br />
4.3.4 Water Schemes Management ................................................................ 133<br />
4.3.5 Rural Water Supply Scheme Inventory ................................................ 134<br />
4.3.6 Problems Facing Rural Water Supply:.................................................. 135<br />
4.3.7 Technology:.............................................................................................. 136<br />
ii
4.3.8 Future Strategy:........................................................................................ 138<br />
4.3.9 Urban Water Supply:............................................................................... 138<br />
4.3.10 Urban Water Supply Coverage:.............................................................. 139<br />
4.3.11 Sanitation:................................................................................................. 140<br />
SECTION V<br />
5.0 OTHER DEVELOPMENT ISSUES:................................................................. 142<br />
5.1 Gender Development:........................................................................................... 142<br />
5.2 Cooperatives:........................................................................................................ 148<br />
5.3 Programmes and Various Activities Supported By NGO’s in <strong>Kilimanjaro</strong><br />
Region 1995 ........................................................................................................... 149<br />
SECTION VI<br />
6.0 POTENTIAL INVESTIMENT AREAS ............................................................ 153<br />
6.1 Agriculture:............................................................................................................ 153<br />
6.2 Livestock:............................................................................................................... 154<br />
6.3 Forestry:................................................................................................................. 155<br />
6.4 Tourism: ................................................................................................................. 155<br />
6.5 Industrial Sector:................................................................................................... 156<br />
6.6 Women Development:......................................................................................... 156<br />
ANNEXES<br />
ANNEX A .......................................................................................................................... 157<br />
<strong>Kilimanjaro</strong> Region in a Nutshell........................................................................ 157<br />
ANNEX B .......................................................................................................................... 163<br />
Hai District Summary............................................................................................ 163<br />
ANNEX C .......................................................................................................................... 167<br />
Mwanga District Summary .................................................................................. 167<br />
ANNEX D .......................................................................................................................... 171<br />
Same District Summary ....................................................................................... 171<br />
iii
ANNEX E........................................................................................................................... 175<br />
Rombo District Summary ............................................................................................ 175<br />
ANNEX F........................................................................................................................... 179<br />
Moshi Rural District Summary ................................................................................... 179<br />
ANNEX G.......................................................................................................................... 183<br />
Moshi Urban District Summary .................................................................................. 183<br />
ANNEX H.......................................................................................................................... 186<br />
1.0 INFORMATION ABOUT TANZANIA............................................................ 186<br />
1.1 GENERAL............................................................................................................. 186<br />
Population.............................................................................................................. 187<br />
Land Use................................................................................................................ 188<br />
Arable Land:.......................................................................................................... 188<br />
Lakes....................................................................................................................... 188<br />
Mountain Summits (Metres Above Sea Level)................................................ 188<br />
Climate.................................................................................................................... 189<br />
1.2 SOCIAL SERVICES ........................................................................................... 190<br />
Health Facilities..................................................................................................... 190<br />
Education............................................................................................................... 190<br />
1.3 NATIONAL PARKS ........................................................................................... 191<br />
iv
FOREWORD<br />
1. As we approach the 21st Century the problems facing rural<br />
areas in developing countries like <strong>Tanzania</strong> are numerous and<br />
formidable. Social and Economic services are deteriorating<br />
and proving to be unsustainable; school enrollment rates are<br />
declining; food situation is precarious; infant and maternal<br />
mortality rates continue to be high; unemployment is on the<br />
rise triggering off mass migration of youth from the rural areas<br />
into already overcrowded urban centres; in <strong>Kilimanjaro</strong><br />
Region, for example, land pressure is escalating and<br />
deforestation is going on at an alarming rate.<br />
2. This situation has arisen because of many factors including ill -<br />
prepared rural development programmes and weak monitoring<br />
and supervision of the implementation of development<br />
programmes and sectoral strategies. The observed<br />
shortcomings in the policy formulation, project identification,<br />
design, and implementation in the developing countries is in<br />
turn attributed to lack of reliable and adequate data and<br />
information on the rural development process.<br />
3. The publication of Regional Socio-economic Profiles series by<br />
the Planning Commission in collaboration with Regional<br />
Commissioner's offices should be viewed as a fruitful attempt<br />
towards finding solutions to the existing problem of data and<br />
information gap.<br />
4. The Regional Profile series cover a wide range of data and<br />
information on geography, population, social economic<br />
v
parameters, social services, economic infrastructure and<br />
productive sectors. The publications so far have proved to be<br />
of high demand and a vital source of information to many<br />
policy makers, planners, researchers, donors and functional<br />
managers.<br />
The Planning Commission has found it a worthwhile effort to<br />
extend the exercise to cover even more regions. Readers are<br />
invited to make suggestions and constructive criticisms which<br />
can assist in improving the quality and effectiveness of future<br />
Profiles.<br />
5. I would like to take this opportunity to acknowledge with<br />
thanks once again the financial support of the Royal<br />
Norwegian Embassy which facilitated the preparation of the<br />
<strong>Kilimanjaro</strong> Region Socio-Economic Profile. I would also like<br />
to thank both the Planning Commission and <strong>Kilimanjaro</strong><br />
Regional Planning Staff who put a lot of effort into ensuring<br />
the successful completion of this task.<br />
Nassoro W. Malocho (MP)<br />
MINISTER OF STATE<br />
PLANNING AND PARASTATAL SECTOR REFORM<br />
vi
December, 1998<br />
vii
SECTION I<br />
1.0 LAND PEOPLE AND CLIMATE:<br />
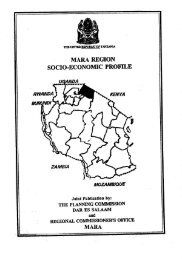
1.1 Geographical Location:<br />
<strong>Kilimanjaro</strong> region as its name reflects, the famous snow covered<br />
Mount <strong>Kilimanjaro</strong> is within this region. The mountain has two<br />
peaks Mawenzi and Kibo and its highest peak Kibo, towers as<br />
high as 5,895 meters above sea level snowcapped throughout the<br />
year. <strong>Kilimanjaro</strong> is the highest mountain - Africa second to<br />
Mount Everest. Mount <strong>Kilimanjaro</strong> and the Pare mountains<br />
(2,000 - 2,500m.) from the backbone of the region, running<br />
through the middle of it in a lengthwise direction.<br />
<strong>Kilimanjaro</strong> region is located in the north eastern part of <strong>Tanzania</strong><br />
Mainland. It lies south of the Equater between latitudes 2 0 25 1<br />
and 4 0 15 1 . Longitudinally the region is between 36 0 25 1 30 11<br />
and 38 0 10 1 45 11 east of Greenwich. The region has a common<br />
border with Kenya in the north, to the southeast it shares border<br />
with Tanga region; to the south and west the region borders with<br />
Arusha region.<br />
1.2 Land Area and Administrative Units:<br />
<strong>Kilimanjaro</strong> region covers an areas of 13,209 sq km or 1.4<br />
percent of the area of the entire <strong>Tanzania</strong> Mainland. Sizewise the<br />
region is one of the smallest regions in <strong>Tanzania</strong>.<br />
1
<strong>Kilimanjaro</strong> region is divided into six districts namely: Rombo,<br />
Mwanga, Same, Hai, Moshi Rural and Moshi Municipality. The<br />
districts are further divided into 26 divisions, 114 wards and 402<br />
villages as highlighted in table I.<br />
TABLE I: LAND AREA AND ADMINISTRATIVE UNITS KILIMANJARO<br />
REGION<br />
District Area sq<br />
km<br />
Administrative Units<br />
Divisions Wards Villages<br />
Hai 2,112 4 11 65<br />
Rombo 1,442 5 20 57<br />
Mwanga 2,698 5 16 58<br />
Same 5,186 6 24 72<br />
Moshi Urban 58 2 16 -<br />
Moshi Rural 1,713 4 27 150<br />
Total 13,209 26 114 402<br />
Source:<br />
Regional Commissioner’s Office, <strong>Kilimanjaro</strong><br />
Fig. 1: Land Area and Administrative Units <strong>Kilimanjaro</strong> Region<br />
6000<br />
5000<br />
4000<br />
3000<br />
2000<br />
1000<br />
0<br />
Hai<br />
Rombo<br />
Mwanga<br />
Same<br />
Moshi<br />
Urban<br />
Moshi<br />
Rural<br />
1.3 Ethnic Groups:<br />
2
There are two main ethnic groups in <strong>Kilimanjaro</strong> region. These<br />
are Chagga, who are the majority, and Pare. There are other<br />
small ethnic groups who reside in the region, like Wakahe and<br />
Wakwavi. Within these two main ethnic groups there are subethnic<br />
groups sometimes identified by their different dialects. For<br />
example, Wagweno among the Pare who speak Kipare and<br />
Kigweno reside in the northen part of Pare. The different dialects<br />
among the Chagga which are identified according to the<br />
geographical identity. For example, Kichagga Kimachame may<br />
be differentiated From Kichagga Kibosho through their way of<br />
speaking and other linguistic characteristics. However, Kiswahili<br />
is the main language for communication among the various groups.<br />
Socially there is little separation between the two main tribes and<br />
inter marriage is a common phenomenon. Invariably both tribes<br />
are energetic, industrious, thrifty and enterprising.<br />
1.4 Early Contacts with Europeans:<br />
The region’s contact with Europeans could be traced back to<br />
1840's with the advent of Missionaries. In 1848 the two<br />
Missionaries. Rebman and Krapf visited the area and thus<br />
became the first Europeans to see Mount <strong>Kilimanjaro</strong>. The arrival<br />
of Missionaries was followed by the establishment of trade<br />
relationship in 1880's. In May 1985, the Germans established a<br />
protectorate over <strong>Kilimanjaro</strong>, but concerned as they were with<br />
consolidating their hold on the coast, they did little to quell the<br />
territorial feuds in the region. The Germans enforced a hash rule<br />
in <strong>Kilimanjaro</strong> which resulted in clashes with the Wachagga. At<br />
first the Germans were defeated, but in 1893 Mangi, the leader of<br />
3
Wachagga was defeated and the Germans took over, but again in<br />
1916 the Germans were ousted when the British troops occupied<br />
<strong>Kilimanjaro</strong>.<br />
1.5 Population Size, Growth and Density:<br />
<strong>Kilimanjaro</strong> region had a population of 1,108,699 in 1988<br />
(Population Census 1988) with an average annual growth rate of<br />
2.1 percent slightly lower than the national rate of 2.8 percent.<br />
This regional population represents 4.9 percent of the total<br />
<strong>Tanzania</strong> Mainland population of 22,533,758 (Population Census<br />
1988, National Profile Analytical report). The region’s population<br />
has been increasing at varied rates between the 1967- 1978 and<br />
1978-1988 census periods. It increased by absolute numbers of<br />
249,665 from 1967 to 1978 and 201,631 people from 1978 to<br />
1988 or 38.2 and 22.3 percent increases respectively.<br />
It is reported in the Census reports of 1978 and 1988 that the<br />
region’s population had grown at 2.9 percent annually between<br />
1967 and 1978 and at 2.1 percent annually between 1978 and<br />
1988. Table II shows the region’s population development by<br />
district from 1967-1988, and the population projections for 1995,<br />
1998 and the year 2000. Based on the 1978/1988 regional<br />
annual growth rate of 2.1%, the region’s population is estimated to<br />
be 1,509,750 by the year 2000. Population projections by<br />
district for 1995, 1998 and 2000 are further computed and<br />
indicated in the table just mentioned.<br />
In the 1988 Census Moshi Urban population experienced a very<br />
rapid growth. For instance between 1978 - 1988 the town<br />
4
population rose, from 52,046 people in 1978 census to 96,838<br />
people in 1988 at an average annual growth rate of 6.2%. The<br />
rapid population rate was also noted in Mwanga districts, where<br />
the population of the district grew from 24,563 people in 1978 to<br />
98,260 people in 1988, reflecting an average growth rate of 4.7<br />
percent.<br />
TABLE II: POPULATION DISTRIBUTION BY DISTRICT AND<br />
PROJECTIONS KILIMANJARO REGION, 1967-2000<br />
District Population Census Results and Growth rates Population Projections<br />
1967<br />
Census<br />
1978<br />
Census<br />
1988<br />
Census<br />
Annual<br />
Growth<br />
Rates<br />
1978/1988<br />
1995 1998 2000<br />
Rombo 114,311 157,715 200,859 2.4% 237,603 255,342 267,897<br />
Mwanga - 74,563 98,260 4.7% 136,540 157,215 172,711<br />
Same 149,635 133,628 170,053 1.4% 187,562 195,608 201,162<br />
Moshi (R) 361,914 316,920 342,553 1.9% 391,281 414,232 430,276<br />
Hai - 172,444 200,136 1.3% 219,203 227,921 233,924<br />
Moshi (U) 26,864 52,046 96,838 6.2% 149,462 180,015 203,780<br />
Total 652,772 902,437 1,108,699 2.1% 1,321,65<br />
1<br />
1,430,33<br />
3<br />
1,509,750<br />
Source:<br />
1988 Population Census, <strong>Kilimanjaro</strong> Regional Profile<br />
1988 Population Census, National Profile, The Analytical<br />
5
Fig. 2:<br />
Population Distribution by District and Sex <strong>Kilimanjaro</strong> Region,<br />
1978, 1988 and 1995 (Estimates)<br />
Thousands<br />
400<br />
350<br />
300<br />
250<br />
200<br />
150<br />
100<br />
50<br />
0<br />
Rombo Mwanga Same Moshi (R) Hai Moshi (U)<br />
Pop. 1978 Pop. 1988<br />
Table II shows that with a land area of 13,209 sq. km the<br />
population density of <strong>Kilimanjaro</strong> has increased from 68 person<br />
per sq. km. in 1978 to 84 persons per sq. km. in 1988. By 1995<br />
the population density was estimated at 100 persons per sq. km.<br />
Although the region could be described as one of the densely<br />
populated regions I the country it is worth noting that the<br />
population is unevenly distributed. The highlands are the most<br />
populated areas with an average of 600 persons per sq. km.<br />
Likewise the intermediate sone, which lies between altitude 900-<br />
1100 meters above sea level, has a high population density of 250<br />
people per sq.km at district level, Rombo and Moshi Rural<br />
districts are the most populated with 160 and 256 people per<br />
sq.km respectively (Estimates of 1995). According to<br />
population projections of 1998 and the year 2000 population<br />
densities are estimated to be 172 and 271 (for 1998; 181 and<br />
281 people/sq.km. in the year 2000 for the two most densely rural<br />
6
districts in the region respectively (Table III) According to table<br />
IV it is observed that <strong>Kilimanjaro</strong> region is the third densely<br />
populated region with 84 people/sq.km. this is after Dar es<br />
Salaam and Mwanza regions (1988 population census). The<br />
population distribution pattern in the region is by and large<br />
influenced by land fertility and demotic conditions. This explains<br />
the reason for concentration of the population in the highlands.<br />
TABLE III: POPULATION DISTRIBUTION BY DISTRICT AND<br />
DISTRIBUTION BY DISTRICT KILIMANJARO REGION, 1988 -<br />
2000<br />
District<br />
Land<br />
Area<br />
sq.km.<br />
Census<br />
Population<br />
1988<br />
Populati<br />
on<br />
Density<br />
1988<br />
Population<br />
Projection<br />
1995<br />
Popula<br />
tion<br />
Densit<br />
y 1995<br />
Populatio<br />
n<br />
Projectio<br />
n 1998<br />
Popula<br />
tion<br />
Densit<br />
y 1998<br />
Populatio<br />
n<br />
Projectio<br />
n 200<br />
Popula<br />
tion<br />
Densit<br />
y 2000<br />
Rombo 1,482 200,859 136 237,603 160 255,342 172 267,897 181<br />
Mwanga 2,170 98,260 45 136,540 63 157,215 72 172,711 80<br />
Same 5,630 170,053 30 187,562 33 195,608 35 201,162 36<br />
Moshi Rural 1,529 342,553 224 391,281 256 414,232 271 430,276 281<br />
Hai 2,369 200,136 84 219,203 93 227,921 96 233,924 99<br />
Moshi Urban 29 96,838 3,339 149,462 5154 180,015 6,209 203,780 7,027<br />
Total 13,209 1,108,699 84 1,321,651 100 1,430,333 108 1,509,750 114<br />
Source: 1. Compiled data: Population Census, 1988<br />
7
Fig. 3a: Population Census Results by District, <strong>Kilimanjaro</strong> Region, 1988<br />
400<br />
350<br />
300<br />
250<br />
200<br />
150<br />
100<br />
50<br />
0<br />
Rombo<br />
Mwanga<br />
Same<br />
Moshi<br />
Rural<br />
Hai<br />
Moshi<br />
Urban<br />
Fig. 3b: Population Projections (thousands) by district for the years of 1995, 1998 and<br />
2000<br />
Thousands<br />
450<br />
400<br />
350<br />
300<br />
250<br />
200<br />
150<br />
100<br />
50<br />
0<br />
Rombo Mwanga Same Moshi<br />
Rural<br />
Hai<br />
Moshi<br />
Urban<br />
1995 1998 200<br />
8
TABLE:IV:<br />
TANZANIA MAINLAND POPULATION AND POPULATION<br />
DENSITY AND PERCENT INCREASE (1978-1988) BY<br />
REGIONS:<br />
Region 1988<br />
Census<br />
Densities Per sq.km.<br />
1978<br />
Census<br />
9<br />
1988<br />
Census<br />
Percent Increase<br />
1978-1988<br />
Arusha 1,351,675 12.4 16.2 29<br />
Mwanza 1,878,271 71.8 93.5 31<br />
Dodoma 1,237,819 23.5 30.0 28<br />
<strong>Kilimanjaro</strong> 1,108,699 68.1 83.7 22<br />
Tanga 1,283,636 38.9 48.1 23<br />
Morogoro 1,222,737 13.3 17.3 30<br />
Coast 638,015 15.9 19.6 24<br />
Dar<br />
Salaam<br />
es<br />
1,360,850 553.2 976.9 77<br />
Lindi 646,550 6.2 9.8 53<br />
Shinyanga 1,763,960 26.1 34.9 34<br />
Mtwara 889,494 46.2 53.2 15<br />
Ruvuma 783,327 8.9 12.3 38<br />
Iringa 1,208,914 16.2 21.3 31<br />
Mbeya 1,476,199 12.9 24.5 37<br />
Singida 791,814 11.3 16.0 45<br />
Tabora 1,036,293 10.7 13.6 27<br />
Rukwa 694,974 8.0 10.1 23<br />
Kigoma 853,263 17.5 23.1 32<br />
Kagera 1,326,183 35.5 46.6 32<br />
Mara 970,942 33.2 43.7 49
Total 23,170,993 19.8 26.2 32<br />
Source:<br />
1988 Population Census, National Profile, The Analytical Report<br />
Table V(a) shows the regional population by district, sex and age<br />
groups in 1988. In all the region’s districts the female population<br />
exceeded that of the males. The same trend existed among most<br />
age groups. Table V(b) shows the highest proportion of the<br />
population aged 0-14 years, which constituted 46.4 percent,<br />
which is above the national average of 45.7 percent (Population<br />
Census, 1988 National Profile - The Analytical Report). The 15-<br />
44 years age group which was the most economically active group<br />
constituted 37.2 percent. Those of the age group of 45-64 years<br />
formed 9.7 percent. Hence categorically the productive age<br />
group in all, formed 46.9 percent of the total regional population in<br />
1988.<br />
The dependants i.e. the children and those aged (65+years of age)<br />
formed 52.3 percent of the region’s total population. The ratio of<br />
dependants to the economically productive age group was 111.4<br />
which meant that there were 111.4 dependants for every 100<br />
workers. This ratio though alarmingly favoured the dependants,<br />
was not a good sign for a country like <strong>Tanzania</strong> whose resources<br />
are still much undeveloped. This situation created much strain on<br />
limited resources. This too implied that in 1988 the region’s<br />
520,061 productive population had to feed and care for 579,536<br />
people.<br />
10
TABLE V(a):<br />
POPULATION DISTRIBUTION BY SEX AND AGE GROUPS BY<br />
DISTRICT, KILIMANJARO REGION 1988<br />
District Sex Age Groups in Years<br />
0-14 15-44 45-64 65+ Not<br />
stated<br />
Total<br />
Moshi Rural Male 79,156 53,160 16,490 11,253 - 160,494<br />
Female 79,709 71,956 18,374 12,455 - 182,494<br />
Total 158,865 125,116 34,864 23,708 - 342,553<br />
Hai Male 45,654 34,193 10,481 5,677 2,687 98,692<br />
Female 44,542 40,686 10,780 5,436 - 101,444<br />
Total 90,196 74,879 21,261 11,113 2,687 200,136<br />
Rombo Male 50,125 28,977 8,353 6,596 28 94,079<br />
Female 50,377 39,170 9,696 7,537 - 106,780<br />
Total 100,502 68,147 18,049 14,133 28 200,859<br />
Mwanga Male 23,371 14,233 4,366 2,270 2,011 46,251<br />
Female 22,745 18,045 4,874 2,585 3,760 52,009<br />
Total 46,116 32,278 9,240 4,855 5,771 98,260<br />
Same Male 41,093 27,791 8,445 4,648 380 82,357<br />
Moshi<br />
Urban<br />
Regional<br />
total<br />
Female 40,493 33,194 9,093 4,916 - 87,696<br />
Total 81,586 60,985 17,538 9,564 380 170,053<br />
Male 18,035 25,427 3,782 1,055 236 48,535<br />
Female 18,769 25,900 2,595 1,039 - 48,303<br />
Total 36,804 51,327 6,377 2,094 236 96,838<br />
Male 254,434 183,781 51,917 31,499 5,342 529,973<br />
Female 256,635 228,951 55,412 33,968 3,760 578,726<br />
Total 514,069 412,732 107,329 65,467 9,102 1,108,699<br />
Source:<br />
Population Census 1988, <strong>Kilimanjaro</strong> Regional Profile<br />
11
Fig. 3c:<br />
Thousands<br />
160<br />
140<br />
120<br />
100<br />
80<br />
60<br />
40<br />
20<br />
Total Population Distribution (Thousands) by District and Age Group,<br />
<strong>Kilimanjaro</strong> Region, 1988<br />
0<br />
0-14 15-44 45-64 65+<br />
Age Groups & District<br />
Moshi Rural Hai Rombo Mwanga Same Moshi Urban<br />
TABLE V(a): TANZANIA DISTRIBUTION BY BROAD AGE GROUPS<br />
KILIMANJARO REGION 1988<br />
Age Group Population %<br />
0-14 Years 514,069 46.4<br />
15-44 Years 412,732 37.2<br />
45-64 Years 107,329 9.7<br />
65+ years 65,467 5.9<br />
Not Stated 9,102 0.8<br />
Total 1,108,699 100.0<br />
Source Population Census 1988 <strong>Kilimanjaro</strong> Regional Profile<br />
13
Fig. 3d: <strong>Tanzania</strong> Distribution by Broad Age Groups <strong>Kilimanjaro</strong> Region 1988<br />
Thousands<br />
600<br />
500<br />
400<br />
300<br />
200<br />
100<br />
0<br />
0-14 15-44 45-64 65+ Not<br />
Stated<br />
Table V(c) shows distribution of the 1988 population census<br />
between the sexes in <strong>Kilimanjaro</strong> region. The regional sex ratio<br />
stood at 91.6. This meant that for every 100 females there were<br />
91.6 males. There were a lot more women compared to men in<br />
the region. Moshi Urban district was the exception where there<br />
was an aqual proportion between the two sexes. Moshi Rural had<br />
the least proportion of males to females i.e. 87.7 males for every<br />
100 females.<br />
14
TABLE V(c):<br />
POPULATION DISTRIBUTION BY SEX AND DISTRICT,<br />
KILIMANJARO REGION, 1998<br />
District Male Female Total Sex Ratio<br />
Moshi Rural 160,059 182,494 342,553 87.7<br />
Hai 98,692 101,444 200,136 97.3<br />
Rombo 94,079 106,780 200,859 88.1<br />
Mwanga 46,251 52,009 98,260 88.9<br />
Same 82,357 87,696 170,053 93.9<br />
Moshi Urban 48,535 48,303 96,838 10.5<br />
Total 529,973 578,726 1,108,699 91.6<br />
Source:<br />
Population Census 1988, <strong>Kilimanjaro</strong> Regional Profile.<br />
<strong>Kilimanjaro</strong> region had 205,972 households in 1988 with an<br />
average household size of 5.3 people. Apparently there was<br />
virtually no significant difference in household sizes among the rural<br />
region’s districts, this ranged between 5.3-5.6 people per<br />
household. Moshi urban district had the lowest household size of<br />
4.3 (see table V(d). In respect of household numbers, Moshi<br />
rural district had the highest with 63,540 households while<br />
Mwanga district had the least number of 16,486.<br />
15
Fig. 3e: Population Distribution by Sex and District, <strong>Kilimanjaro</strong> Region, 1998<br />
Thousands<br />
200<br />
180<br />
160<br />
140<br />
120<br />
100<br />
80<br />
60<br />
40<br />
20<br />
0<br />
Moshi<br />
Rural<br />
Hai<br />
Rombo<br />
Mwanga<br />
Same<br />
Moshi<br />
Urban<br />
Male<br />
Female<br />
TABLE V(d):<br />
POPULATION BY SEX AND DISTRICT NUMBER OF<br />
HOUSEHOLDS AND AVERAGE HOUSEHOLD SIZE<br />
KILIMANJARO REGION, 1988<br />
District Population Number of<br />
Household<br />
s<br />
Male Female Total<br />
Average<br />
Househo<br />
ld size<br />
Sex-Ratio<br />
Moshi Rural 160,059 182,494 342,553 63,540 5.4 87.6<br />
Hai 98,692 101,444 200,136 37,318 5.3 94.6<br />
Rombo 94,079 106,780 200,859 35,648 5.6 88.1<br />
Mwanga 46,251 52,009 98,260 16,486 5.6 91.7<br />
Same 82,357 87,696 170,053 30,337 5.6 93.5<br />
Moshi Urban 48,535 48,303 96,838 22,643 4.3 100.5<br />
Total 529,973 58,726 1,108,69<br />
9<br />
205,972 5.3 91.2<br />
16
Source:<br />
Population Census 1988, <strong>Kilimanjaro</strong> Regional Profile<br />
Table V(e) shows the region’s population distribution by<br />
district Urban/Rural orientation in 1988. There were more<br />
residents in rural areas than in urban areas, accounting for<br />
85.5 percent of the region’s population. There were more<br />
households in rural areas than in the urban; 82.2% of these<br />
were in the former areas. One interesting thing to note was<br />
the bigger household size in rural areas than in urban areas<br />
which averaged 5.5 people while in urban areas the size<br />
averaged 4.3 people. The reflected bigger household sizes<br />
in rural areas than in urban might be due to more tendency<br />
in the rural areas to embrace firmly the family ties and values<br />
while economically conscious.<br />
TABLE V(e):<br />
POPULATION, HOUSEHOLD SIZE BY DISTRICT AND BY<br />
RURAL/URBAN ORIENTATION, KILIMANJARO REGION, 1988<br />
District<br />
Population<br />
Total<br />
Number of Households<br />
Average Household<br />
Size<br />
Rural Urban Rural Urban Total Rural Urban<br />
Moshi Rural 339,979 2,574 342,553 62,890 650 63,540 5.4 4.0<br />
Hai 185,582 14,554 200,136 33,899 3,419 37,318 5.4 4.3<br />
Rombo 199,051 1,808 200,859 35,078 570 35,648 5.7 3.2<br />
Mwanga 98,260 - 98,260 16,486 - 16,486 5.6 -<br />
Same 125,251 44,802 170,053 21,018 9,319 30,337 5.9 4.8<br />
Moshi Urban - 96,838 96,838 - 22,643 22,643 - 4.2<br />
Total 948,123 160,576 1,108,699 169,371 36,601 205,97<br />
2<br />
5.5 4.3<br />
Source:<br />
Population Census 1988, <strong>Kilimanjaro</strong> Regional Profile.<br />
17
1.6 Migration:<br />
It is generally believed that the population of the region would<br />
have been much higher than the quoted figure of 1,104,068 (1988<br />
population census). The Wachagga and their neighbours the<br />
Wapare have a tradition of seeking green pasture. Population<br />
Census analysis indicates that <strong>Kilimanjaro</strong> region during the period<br />
of 10 years (1978-1988) experienced relatively a higher figure of<br />
- 124,383 Net lifetime migration to other regions of the mainland.<br />
The negative net lifetime migration figure means that the region<br />
was losing more people to other parts of the country than those<br />
moving in. This is the highest figure in the country followed by<br />
Iringa region which had - 120,198 net lifetime migration (Table<br />
VI). In fact the Wachagga people might be the most mobile<br />
ethnic group in the whole country, found in large numbers in all<br />
regions either schooling working, permanently settled or during<br />
business.<br />
The most basic reason behind this sort of movement lies in the<br />
agricultural sector. The sector has failed to satisfy economically<br />
the rural population and particularly so, the young generation. The<br />
high population density already experienced in the rural areas in<br />
the region has made it imposssible for the agricultural sector to<br />
absorb or accomodate more. Lack of industrial development in<br />
the region has also contributed to this net outflow.<br />
18
Table VI: Lifetime Migration By Region, <strong>Tanzania</strong> (1988 - Census)<br />
Region<br />
Lifetime in<br />
Migration<br />
Lifetime out<br />
Migration<br />
Net Lifetime<br />
Migration<br />
Gross<br />
Migration<br />
Lindi 95,200 145,031 -9,831 240,231<br />
Arusha 218,427 76,703 141,724 295,130<br />
<strong>Kilimanjaro</strong> 93,040 217,423 -124,383 310,463<br />
Tanga 98,747 150,915 -52,168 249,662<br />
Morogoro 172,393 141,956 30,437 314,349<br />
Coast 103,804 207,716 -103,912 311,520<br />
Dar es Salaam 651,246 150,625 500,621 801,871<br />
Dodoma 89,900 190,985 -101,085 280,885<br />
Mtwara 46,299 144,988 -98,689 191,287<br />
Ruvuma 66,442 81,661 -15,219 148,103<br />
Iringa 49,282 169,480 -120,198 218,762<br />
Mbeya 160,377 113,378 46,999 273,755<br />
Singida 86,651 150,531 -63,880 237,182<br />
Tabora 241,729 175,359 66,370 417,088<br />
Rukwa 87,599 49,294 38,305 136,893<br />
Kigoma 26,795 129,718 -102,923 156,513<br />
Shinyanga 288,210 281,447 6,763 569,657<br />
Kagera 103,713 109,693 -5,980 213,406<br />
Mwanza 270,142 303,646 -33,504 573,788<br />
Mara 75,987 115,865 -39,878 191,852<br />
Total 3,025,983 3,106,414 -80,431 6,132,397<br />
Source:<br />
1988 Population Census, National Profile, analytical Report<br />
19
1.7 Unemployment:<br />
Table VII:<br />
Sex<br />
District<br />
Male<br />
Both open and disguised unemployment is a serious problem<br />
facing all regions in the country. <strong>Kilimanjaro</strong> region is not an<br />
exceptional to the rule, however, it tries hard to mitigate the<br />
magnitude of the problem by encouraging emigration of the youth<br />
out of the region. The 1988 census estimated umployment in the<br />
region at 306,214 about 40.6 of the total labour force. Out of<br />
306,214 unemployed, 176,096 were female. It is observed from<br />
table VII that 54% of the unemployed were identified in the<br />
districts of Moshi Rural and Hai. Moshi urban district was the<br />
least in terms of unemployment rate at 9% of the total unemployed<br />
population 10 years and above years of age.<br />
Population 10 Years and Above by Sex, District and Occupation in<br />
<strong>Kilimanjaro</strong> Region 1988<br />
Office &<br />
Sales work<br />
Occupation<br />
Agricultur<br />
al work<br />
20<br />
Industry<br />
un-specific<br />
work<br />
Not<br />
employe<br />
d<br />
Rombo 3150 31289 2445 21621 58505<br />
Mwanga 1785 13795 1300 11475 28355<br />
Same 2614 31337 1847 18018 53816<br />
Total<br />
Moshi (R) 9285 38699 15640 43713 107337<br />
Hai 4388 30500 5397 25102 65387<br />
Moshi (U) 9233 4107 12437 10189 35966<br />
Total 30455 149727 39066 130118 349366<br />
Female<br />
Rombo 225 40596 1547 27849 72217
Mwanga 1143 16185 347 15338 33013<br />
Same 1686 38728 382 19484 60280<br />
Moshi (R) 8806 55183 6793 59748 130530<br />
Hai 2649 29240 2175 37481 71545<br />
Moshi (U) 7436 7398 4574 16196 35604<br />
Total 23945 187330 15818 176096 403189<br />
Both Sexes<br />
Rombo 5375 71885 3992 49470 130722<br />
Mwanga 2928 29980 1647 26813 61368<br />
Same 4300 70065 2229 37502 114096<br />
Moshi (R) 18091 93882 22433 103461 23867<br />
Hai 7037 59740 7572 62583 136932<br />
Moshi (U 16669 11505 17011 26385 71570<br />
Total 54400 337057 54884 306214 752555<br />
Source:<br />
1988 Population Census, Regional Profile <strong>Kilimanjaro</strong><br />
1.8 Climate and Soil:<br />
The seasonal rainfall distribution in particular greatly influences<br />
agricultural practices. In the <strong>Kilimanjaro</strong> region the year can be<br />
divided into four periods with respect to the amount of rainfall:<br />
There are two rainy seasons - a major one in April - May and a<br />
minor one in September - November, and two dry seasons, a<br />
major one in December - January and a minor one in July -<br />
August. There is marked variation in the amount of rainfall<br />
according to altitude and the direction of the slope in the<br />
mountainous areas. The mean annual rainfall varies from 500 mm<br />
in the lowlands to over 2,000mm in the mountainous areas (over<br />
1,600 meters above sea level). Temperatures are closely related<br />
21
to altitude. During the rains, extra cloud cover and evaporative<br />
cooling tend to reduce maximum temperatures. Cloud cover also<br />
tend to raise minimum temperatures. The hot season lasts from<br />
October - March with high humidity; temperatures going up as far<br />
as 40 0 C. In the lowlands. In the mountainous areas temperature<br />
ranges from about 15 0 - 30 0 C. The soils of the region vary, there<br />
are alluvial soils which are potential agriculturally through irrigation<br />
farming due to unreliability of rainfall in those areas.<br />
1.8 Physical Features:<br />
The dominant physical feature is a main chain of mountains running<br />
from North-North West to South-South East with land sloping<br />
away to a minimum height of 305m above sea level on either side.<br />
The snow capped Mount <strong>Kilimanjaro</strong> provides an endless supply<br />
of water to the lower slopes along numerous streams. Most of the<br />
rivers in this region peter out after running into the plains, Ruvu<br />
(Pangani) river and Kikuletwa river gather water from the upper<br />
streams and keep flowing even in the dry season. Both rivers join<br />
together at some point, approximately 38 kilometers south of<br />
Moshi municipality, forming a large artificial lake called Nyumba<br />
ya Mungu extending about 6 kilometers from north to south. The<br />
water discharged from the dam, forms Pangani river, which turns<br />
around and flows southward in the neighbourhood of Mkomazi at<br />
the southern tip of South Pare mountain system forming the largest<br />
water system in this region.<br />
1.10 Agro-Econimic/Ecological Zone:<br />
22
The <strong>Kilimanjaro</strong> region comprised of four ecological zones based<br />
on altitude, soils and climate. The zones include, the peak of<br />
<strong>Kilimanjaro</strong> Mountain, Highlands, Intermediate (middle) and<br />
Lowland Plains (Tambarare) Zones.<br />
(i)<br />
(ii)<br />
<strong>Kilimanjaro</strong> Mountain Peak Zone:<br />
It lies between 1,800 and 5,895 meters above sea<br />
level and receives annual rainfall of more than 2000mm.<br />
The area between 1,800 and 2,400 meters is designated<br />
both as the <strong>Kilimanjaro</strong> Naional park and Forest reserve.<br />
Due to its altitude and weather conditions, the zone<br />
remains uninhabited.<br />
Highlands Zone:<br />
The highlands zone lies between 1,000 and 1,800<br />
meters above sea level. The annual average rainfall falls<br />
between 1250 and 2000mm. While temperatures range<br />
between 15 0 Centigrade and 20 0 Centigrade. The<br />
Highland zone has good and very fertile soil following the<br />
remains of volcanic rocks rich in magnesium and calcium.<br />
On the western part of Mt. <strong>Kilimanjaro</strong> a lot of wheat,<br />
beans and barley are grown and dairy cattle raised as<br />
well. Other agricultural products grown include, coffee,<br />
bananas, fruits and irish potatoes. The main problems in<br />
the Highland zone are population pressure exerted on a<br />
small land area giving rise to a population density of 650<br />
people per sq. Kilometer and soil erosion caused by the<br />
tendency of the people to cut-down trees, in search of<br />
timber and sometimes for acquiring more land for<br />
agricultural activities, or simply for settlement.<br />
23
(iii)<br />
(iv)<br />
Intermediate Zone<br />
It lies between 900 and 1100 meters above sealevel<br />
and receives enough annual rainfall ranging between<br />
800 and 1250 mm. It has a moderate soil fertility which is<br />
good for coffee plantations, bananas, maize, beans and<br />
suitable for dairy cattle, goats, pigs, rabbits and poultry<br />
farming. Like in the Highlands zone, it has a high<br />
population density of 250 persons per sq kilometer<br />
leading to land shortage and soil erosion.<br />
Lowland Plains zone<br />
This zone lies below 900 meters above sea level<br />
and has an average annual ranfall of between 700 and 900<br />
mm, while temperatures are above 30 0 Centigrade.<br />
Common crops grown in this zone include, maize, cotton,<br />
rice, sorghum, cassava and pigeon peas. Domestic<br />
animals that thrive well in the area are beef cattle, goats<br />
and sheep. It is from this zone where the best hay for<br />
cattle is found, during the dry season livestock keepers<br />
from the highland and intermediate zones obtain or<br />
purchase hay from this zone. Population density is low<br />
with less than 50 people per sq.km. Low density is due to<br />
unfavorable climate, explained by devastating effects of<br />
frequent floods during long rains and the dry nature of the<br />
zone. It is in this zone that irrigation farming is getting<br />
popular through efficient utilization of river water from the<br />
highlands.<br />
24
Table VIII: SUMMARY OF AGRO-ECONOMIC ZONES KILIMANJARO REGION<br />
Zone<br />
i)<br />
<strong>Kilimanjaro</strong><br />
Mountain<br />
peak<br />
Popu<br />
lation<br />
Density<br />
(sq.km)<br />
Genera<br />
l<br />
morpho<br />
-logy<br />
- Steep<br />
Mounta<br />
in<br />
ii) Highlands 600 Sloppin<br />
g hills<br />
and<br />
plateau<br />
x<br />
iii)<br />
Intermediate<br />
iv) Lowland<br />
Plains<br />
250 Gentle<br />
plain<br />
and<br />
moderat<br />
ely<br />
sloppin<br />
g hills<br />
50 Flat<br />
plains<br />
Altitude<br />
range<br />
(M)<br />
1800-<br />
5895<br />
1000-<br />
1800<br />
900-<br />
1100<br />
Domi<br />
nant<br />
Soils<br />
Volcan<br />
ic<br />
Volcan<br />
ic<br />
Moder<br />
ate<br />
fertile<br />
soil<br />
900 Variabl<br />
es<br />
Economic<br />
Activity<br />
Tourism<br />
activities<br />
Agricultur<br />
e<br />
Wheat,<br />
Benas,<br />
barley<br />
coffee,<br />
bananas,<br />
fruits<br />
Livestock<br />
Cattle,<br />
goats,<br />
pigs<br />
Agricultur<br />
e<br />
Coffee,<br />
Bananas,<br />
maize,<br />
beans<br />
Livestock:<br />
Cattle,<br />
goats,<br />
pigs,<br />
rabbits<br />
and<br />
poultry<br />
Agricultur<br />
e<br />
Maize,<br />
cotton,<br />
rice,<br />
sorghum,<br />
cassava,<br />
peas<br />
Livestock<br />
Cattle,<br />
goats,<br />
sheep<br />
Rain<br />
fall<br />
(MM)<br />
2000-<br />
over<br />
1250-<br />
2000<br />
800-<br />
1250<br />
700-<br />
900<br />
Tempe<br />
rature<br />
( 0C)<br />
-below<br />
15<br />
15-20<br />
20-30<br />
30-over<br />
Source: <strong>Kilimanjaro</strong> Regional Development Plan 1990/91<br />
25
1.11 Land Use Pattern and Utilization:<br />
The land use in the region can be classified as follows:-<br />
Agricultural and Cultivated land<br />
Government Forest Reserves<br />
Local Authority Forest Reserves<br />
Forest Plantations<br />
Game Reserves<br />
Controlled Area and Woodlands<br />
Marginal lands settlement<br />
6,433 sq km<br />
333,640 ha.<br />
212,880 ha.<br />
5,750 ha.<br />
373,000 ha.<br />
276,800 ha.<br />
64,700 ha.<br />
Total<br />
1,342,370 ha.<br />
Source: <strong>Kilimanjaro</strong> Region Development Plan, 1990/91<br />
i) In <strong>Kilimanjaro</strong> region agricultural land occupies a total<br />
area of 6,433 sq.km. of which 333,640 ha. Is under<br />
cultivation. This is 22% of the total area of the region. Out<br />
of this 15% is under cultivation settlements. Over 70% of<br />
the agricultural hectarage is held by small holders, while<br />
the remaining 30 percent is cultivated by both public and<br />
private corporations or large farms.<br />
ii)<br />
The area between 1,100 and 1800m. (a.s.l.) around the<br />
slopes of mount <strong>Kilimanjaro</strong> and Pare mountains are<br />
suitable for agricultural production with favourable living<br />
environment. Becasue of the population pressure the type<br />
of cultivation so far assumes the following characteristics.<br />
27
- Cultivation and housing is very dense in the<br />
highland zones with cultivation rate of 98% and<br />
population density above 20 person/km 2<br />
- Net agricultural hectarage on average is 0.66 ha.<br />
Per household<br />
- Over 65% of the smallholder live and are engaged<br />
in cultivation of banana and coffee, while livestock<br />
is stalllfed. The same small holders own pieces of<br />
agricultural land in the low lands for the annual<br />
crops, where maize, beans and oilseed are grown.<br />
iii)<br />
iv)<br />
Between 900-1100 (a.s.l.) Rate of cultivation is about<br />
35% while the population density is around 60<br />
person/km 2 . Gross agricultural is about 2.72<br />
ha/household. Mixed farming is practiced by small holder<br />
farmers.<br />
In the lowlands the rate of cultivation is very low, less than<br />
10% of the total activities and the population density is 25<br />
person per km 2 with an average hectarage of 1.27<br />
ha/household.<br />
Due to the nature of the land, majority of livestock keepers are<br />
found in the lowlands, and grazing is their dominant economic<br />
activity.<br />
28
1.12 Land Scarcity:<br />
Crop production and agricultural expansion in the region is likely<br />
to face physical limitations (Arable land is only 48.7% of the total<br />
land areas). In the highland areas for instance, a family owns an<br />
average of 0.5 of a hectare while in lowland area a family owns<br />
1.5 hectares. The scramble for land and scarcity of land in<br />
<strong>Kilimanjaro</strong> region is thus being experienced day after day. In<br />
addition, environmental degradation is increasingly taking place<br />
due to poor farm management system such as non-use of soil<br />
erosion control methods. In this regard, the region needs to<br />
intensify land management practices in order to improve land<br />
productivity per unit area Generally the experience of land<br />
limitation is the factor which mostly contributes to the movement<br />
of people out of the region.<br />
29
2.0 REGIONAL ECONOMY<br />
2.1 Introduction:<br />
SECTION II<br />
The greater part of the population (75%) in the region still lives in<br />
the rural areas heavily dependent on agriculture and livestock<br />
keeping for their livelihood. Main cash crops in the region include<br />
coffee which is grown in plantations as well as smallholders.<br />
Wheat and barley are grown in the state farms. Cardamon, sisal,<br />
cotton, sunflower and groundnuts are gaining ground for<br />
expansion. The region is a major coffee producer and its<br />
production accounts for an average of 30% to 36% of the total<br />
national coffee production.<br />
Livestock is ranked as a second vital economic activity in the<br />
region. Modern dairy farming is practised in the highlands and<br />
intermediate zones. Whereas the people in the lowlands are<br />
engaged in “unscientific” ranching. Apart from agriculture and<br />
livestock, which contributes about 60% to the Regional GDP,<br />
there are also varied industrial and commercial activities<br />
undertaken in the region.<br />
2.2 Regional GDP and Per Capita GDP<br />
The Region’s Gross Dometstic Product trend for the last 15 years<br />
(1980-1994) portrays a gradual but significant increase (Table<br />
IX). GDP earnings accrued in the region increased from<br />
Tshs.1,950 million in 1980 to Tshs.72,898 million in 1994.<br />
30
However devaluation of the T.shilling over the years within the<br />
period appears to negate the seemingly big growth. For instance<br />
the region’s GDP in 1980 was Tshs. 1,950 million equivalent to<br />
USA $ 237 million at the exchange rate of Tshs.8.22/Dollar. At<br />
the end of 1994 the region had a GDP of Tshs.72,898 million but<br />
the exchange rate was at Tshs.553/USA $, this was equivalent to<br />
132 million USA $ GDP earning. This data infact tells us that the<br />
region’s economy infact had gone down in real terms. It means<br />
that for the region to earn at the income value of 1980 had to<br />
produce almost twice as much in 1994.<br />
It is observed that throughout the period (1980-1983) the region’s<br />
GDP contribution to the Naitonal GDP had been constant at 5%.<br />
Subsequent years from 1984 to 1989 its contribution gradually<br />
dropped to 2% then surfaced again to 4% from 1990-1994.<br />
<strong>Kilimanjaro</strong> ranks 10th in GDP contribution to the Nation’s<br />
economy among the Mainland regions as by 1994 (Table X).<br />
A quick look at the Per Capita GDP of the region (Table IX)<br />
shows a similar trend of growth to that of the regional GDP. The<br />
region experienced a per Capita GDP of over USA $ 250 in<br />
1980 - 1982 . This however took a dramatic decline from 1983-<br />
1989 when it went down as low as USA $ 33, then temporarly<br />
improved to 127 USA $ in 1990 but could not sustain much when<br />
it plunged down again to a final rest of 101 Dollars in 1994.<br />
These fluctuations in Per Capita earning in real terms had been<br />
contributed by the unstability of the T.Shilling against the value of<br />
the USA $. For this reason the <strong>Kilimanjaro</strong> man has experienced<br />
decreasing economic power and ranks 8th in comparison to other<br />
regions in the country (Table XI).<br />
31
Table IX: REGIONAL GDP AT CURRENT PRICES AND % CHANGE 1980 -<br />
1994 KILIMANJARO REGION<br />
Year<br />
GDP at<br />
current<br />
price in<br />
Tsh.<br />
Million<br />
s<br />
%<br />
Change<br />
Per Capital GDP Current<br />
Price Tshs. And in USA<br />
Dollar<br />
%<br />
Chang<br />
e<br />
Average<br />
%<br />
Contrib<br />
ution to<br />
GDP<br />
Naitona<br />
l GDP<br />
TShs. Exchange Dollar<br />
Rate<br />
1980 1950 - 2073 8.22 252 - 5.00<br />
1981 2168 11.2 2258 8.35 270 7.1 5.00<br />
1982 2643 21.9 2695 9.52 283 4.8 5.00<br />
1983 2868 8.5 2868 12.44 230 18.7 5.00<br />
1984 2276 -20.4 2227 18.16 123 46.5 3.00<br />
1985 2991 31.4 2865 16.50 174 41.5 3.00<br />
1986 3886 29.9 3647 51.70 71 59.2 3.00<br />
1987 2979 -23.3 2738 83.70 33 53.5 2.00<br />
1988 5254 76.4 4750 125 38 15.2 2.00<br />
1989 8241 56.9 7245 192 38 0.0 2.00<br />
1990 29215 254.5 24975 197 127 234.2 4.00<br />
1991 36484 24.9 30329 234 130 2.4 4.00<br />
1992 45347 24.3 36655 335 109 16.2 4.00<br />
1993 56805 25.3 44650 480 93 14.7 4.00<br />
1994 72898 28.3 55716 553 101 8.6 4.00<br />
Average 18400.3 - 15046.1 138 33.2 3.7<br />
Source: 1. National Accounts for <strong>Tanzania</strong> 1976-1994, 11th Edition, August, 1995<br />
2. Bank of <strong>Tanzania</strong> Economic Bulletin 1995 Vol.XXIV No.4<br />
32
Fig. 4a: Regional GDP at Current Prices 1980 - 1994, <strong>Kilimanjaro</strong> Region<br />
80000<br />
70000<br />
60000<br />
50000<br />
40000<br />
30000<br />
20000<br />
10000<br />
0<br />
1980<br />
1981<br />
1982<br />
1983<br />
1984<br />
1985<br />
1986<br />
1987<br />
1988<br />
1989<br />
1990<br />
1991<br />
1992<br />
1993<br />
1994<br />
Fig. 4b: Per Capital GDP Current Price Tshs. 1980 - 1994, <strong>Kilimanjaro</strong> Region<br />
60000<br />
50000<br />
40000<br />
30000<br />
20000<br />
10000<br />
0<br />
1980<br />
1981<br />
1982<br />
1983<br />
1984<br />
1985<br />
1986<br />
1987<br />
1988<br />
1989<br />
1990<br />
1991<br />
1992<br />
1993<br />
1994<br />
33
Table X: Regional GDP and Contribution Ranking, Mainland, 1994<br />
Region Average % Annual GDP<br />
Contribution<br />
GDP Contribution<br />
Ranking<br />
<strong>Kilimanjaro</strong> 3.67 10<br />
Dar es salaam 20.33 1<br />
Arusha 7.80 2<br />
Mwanza 7.67 3<br />
Mbeya 6.00 4<br />
Shinyanga 5.80 5<br />
Iringa 5.53 6<br />
Tanga 5.52 7<br />
Morogoro 4.67 8<br />
Kagera 3.67 9<br />
Mara 3.47 11<br />
Tabora 3.40 12<br />
Ruvuma 3.33 13<br />
Mtwara 3.27 14<br />
Rukwa 3.13 15<br />
Dodoma 3.07 16<br />
Singida 2.87 17<br />
Kigoma 2.53 18<br />
Lindi 2.00 19<br />
Coast 1.00 20<br />
Total 100.0<br />
Source: National Accounts of <strong>Tanzania</strong>, 1976 - 1994 11th Edition, August, 1995<br />
34
Table XI: Comparison of Per Capita Incomes for <strong>Tanzania</strong> Mainland Regions,<br />
1994<br />
Rank Number Region Per Capita Income TShs.<br />
8 <strong>Kilimanjaro</strong> 55,716<br />
1 Dar es Salaam 197,107<br />
2 Arusha 91,024<br />
3 Rukwa 80,669<br />
4 Iringa 64,502<br />
5 Tanga 60,021<br />
6 Mtwara 59,533<br />
7 Morogoro 59,370<br />
9 Singida 55,644<br />
10 Shinyanga 52,746<br />
11 Ruvuma 52,537<br />
12 Kagera 50,105<br />
13 Mbeya 48,737<br />
14 Mwanza 48,508<br />
15 Tabora 44,984<br />
16 Mara 43,748<br />
17 Dodoma 39,604<br />
18 Lindi 38,340<br />
19 Kigoma 30,103<br />
20 Coast 22,624<br />
Source: Naitonal Accounts of <strong>Tanzania</strong> 1976-1994 11th Edition, August 1995<br />
35
2.3 Socio-economic Indicators:<br />
Table XII:<br />
Notwithstanding the stagnacy of the regional GDP and per Capita<br />
GDP discussed above, the people living in the rural areas in<br />
<strong>Kilimanjaro</strong> region are relatively more accessible to social services<br />
like water, health and education compare to residents of other<br />
regions. People there also live in comparatively up to date<br />
houses.<br />
Socio-Economic indicators such as life expectancy at birth,<br />
literacy rate, primary school enrolment rate, infant and child<br />
mortality, population per health facility, population per physician<br />
and others discussed in detail elsewhere in this document portray<br />
the region as being relatively developed compared to others.<br />
Table XII below compares <strong>Kilimanjaro</strong> region with a handful<br />
regions using some few selected Socio-economic indicators.<br />
Selected Social and Economic Indicators for <strong>Kilimanjaro</strong>: a<br />
comparison 1994<br />
Indicators National K/Njar<br />
o<br />
Arusha Kagera Mbeya Iringa Mwanz<br />
a<br />
Regional GDP In<br />
(Tshs.Mill)<br />
1,659,9<br />
29<br />
72,898 145,19<br />
2<br />
80,537 84,903 92,02<br />
1<br />
107,55<br />
3<br />
1. Per capita Income (Tshs.) 62,138 55,716 91,024 50,105 48,737 64,50<br />
2<br />
48,508<br />
3. Life expectancy (1988) 50 59 57 45 47 45 48<br />
4. Infant Motality rate<br />
(1994)<br />
5. Population growth rate<br />
(1988 census)<br />
6. Population density per<br />
km 2 (1988 census)<br />
7. Enrolment rate (GER) for<br />
primary school % (1995)<br />
161 92 82 213 167 190 160<br />
2.8 2.1 3.8 2.7 3.1 2.7 2.6<br />
26 96 16 47 25 21 96<br />
74.2 91.6 75.7 57.3 79.6 80.9 67.6<br />
37
8. Literacy rate (1988) (%) 61.2 95 58.1 59.5 61.9 68.3 57.3<br />
9. Population accessible to<br />
clean water % (1994)<br />
10. Number of primary<br />
schools<br />
11. Number of Secondary<br />
schols<br />
50.5 59 37.4 28.4 48.7 48.2 56.4<br />
10,454 701 573 677 809 707 811<br />
405 91 54 37 27 44 34<br />
12. Number Dispensary 3,014 225 180 145 186 186 238<br />
13. People per Dispensary 10,000 4,957 7,511 9,144 7,936 8,574 7,891<br />
14. Number of Health<br />
centers (1994)<br />
276 15 11 12 17 16 25<br />
15. People per Health center 50,000 88,913 122,90<br />
9<br />
110,50<br />
0<br />
86,824 75,56<br />
3<br />
72,231<br />
16. Number of Hospital 175 13 14 11 11 13 12<br />
17. People per Hospital 10,000 97,412 96,571 120,54<br />
5<br />
134,18<br />
2<br />
93,00<br />
0<br />
170,72<br />
7<br />
18. Number of Doctors<br />
(1994)<br />
1,086 45 45 27 26 29 25<br />
19. People per Doctor<br />
(1994)<br />
24,930 28,142 30,044 49,111 56,769 41,69<br />
0<br />
75,120<br />
Source:<br />
Compiled data, Planning Commission,<br />
2.4 Productive Sector:<br />
2.4.1 Agriculture:<br />
The region may be divided into three zones. The<br />
Lowlands (1,500m and below); the Highlands (1,500-<br />
3000m); and the Forest (above 3000m). With the<br />
exception of land above 3000m. most of the land can be<br />
used for agricultural activities. Agricultural land on the<br />
other hand can be classified into four main zones: The<br />
Coffee zone which can grow coffee, bananas, maize,<br />
38
eans and dairy cattle. The Wheat zone, where the<br />
agricultural activities include Wheat, beans maize and dairy<br />
production. The Lower zone, which includes areas<br />
suitable for ranching as well as areas suitable for maize,<br />
cotton, beans and paddy. The Forestry zone, accounts<br />
for 388,500Ha. of forest and National park.<br />
39
2.4.1.1 The Coffee Zone:<br />
The zone is the typical one of the region. It is intensely<br />
cultivated with coffee and bananas in pure or mixed<br />
stands, and is very densely populated and forms the core<br />
of the region’s economy. Although more than 60 percent<br />
of the zone gets 1,000mm or more of rainfall annually,<br />
much of this rainfall is concentrated in the rainy season.<br />
Consequently, in the dry season those crops which are not<br />
irrigated suffer from lack of water.<br />
2.4.1.2 The Wheat Zone:<br />
This zone is located in the western part of Mt. <strong>Kilimanjaro</strong><br />
and suitable for wheat, beans, maize and dairy, though<br />
other crops can also be grown. Wheat crop production is<br />
done on a large scale by the NAFCO and private farmers.<br />
The farms planted with wheat are located in areas with<br />
annual rainfall of 600 to 700mm but due to year to year<br />
fluctuations in the rainfall, the wheat yields are not stable.<br />
In addition to dairy farming practiced by large farmers,<br />
beef cattle and goats are grazed on natural pastures called<br />
the Massai steppe.<br />
2.4.1.3 The Lower Zone:<br />
The lower zone borders Moshi and Hai Districts and<br />
extends south of the banana/coffee zone on the sourthern<br />
slopes of Mt. <strong>Kilimanjaro</strong> and borders at its southern most<br />
end with the Kikuletwa river and Pare district. The land<br />
40
scape is generally very gentle except the area to the North<br />
of the Highway connecting Arusha and Mombasa where<br />
the landscape is mildly rolling. The Rombo district lower<br />
zone on the other hand, borders with and extends to the<br />
east of the coffee zone and on the east it borders The<br />
Republic of Kenya. The Pare district lower zone<br />
encompasses a large area of flat land that stretches to the<br />
east of the hills of north and sourth Pare (Mwanga and<br />
Same) and reaches up to the national border with The<br />
Republic of Kenya. Two thirds of this zone is taken up by<br />
the Mkomazi game reserve. Depending on the location,<br />
the lower zone I Moshi Rural and Hai districts can<br />
accommodate a variety of agricultural activities. In the<br />
south eastern part of the lower zone where irrigation water<br />
is available, paddy, and maize are cultivated in rotation<br />
and in many cases double-cropping of paddy and maize<br />
or maize followed by maize is practiced. In Moshi rural<br />
district, this part is endowed with abundant subterranean<br />
water, and has many springs including Miwaleni spring<br />
which would support irrigation farming with minimum<br />
effort. The Rombo lower zone is suitable for rain fed crop<br />
activities because it gets some rain during the long and<br />
short seasons. (Crops like finger millet, maize, beans and<br />
groundnut). Most farms in the lower zone are owned by<br />
farmers who commute from their homes in the coffee<br />
zone.<br />
2.4.1.4 Forestry Zone:<br />
41
The forestry zone in the district of Hai, Moshi<br />
Rural and rombo, form the Kilimajaro National park.<br />
They border the coffee zone and are covered by forests.<br />
In Rombo and Hai district Irish potatoes and maize are<br />
grown at the height of between 1,800 to 2,000m in reforested<br />
blocks. The forestry zone in Pare district,<br />
however, consists of steep mountains which are poorly<br />
covered by trees.<br />
2.4.1.5 Crop Production Pattern:<br />
The economic development of the region started long time<br />
back and depends greatly on agriculture which contributes<br />
more than 60 percent of the region’s GDP. The important<br />
cash crops include coffee, cotton, sugar-cane, sisal,<br />
sunflower, beans, wheat, whereas important food crops<br />
are bananas, and maize.<br />
2.4.1.6 Food Crops:<br />
The most important food crops are bananas and maize<br />
(Table XIII). The amount of maize being produced is a<br />
clear indication of the extent to which maize has now been<br />
accepted as a co-staple to bananas.<br />
Table XIII: Food Crop Production (Tonnes 1990/91-1995/96) <strong>Kilimanjaro</strong><br />
Region<br />
Crops 1990/91 1991/9 1992/9 1993/94 1994/95 1995/96<br />
2 3<br />
Maize 85865 156472 77866 138007 157203 183645<br />
Paddy 25943 14094 21381 25126 30845 35464<br />
Vegetable 36930 57081 21822 25701 33870 47600<br />
42
Beans 31409 23667 11562 17503 22326 21367<br />
Cassava 11330 7160 30489 10830 20090 40540<br />
Bananas 708430 749238 55185 354125 544962 657510<br />
3<br />
Irish Potatoes 22400 68185 40395 26850 82510 54018<br />
Sweet Potatoes 59000 1290 787 10196 97500 2020<br />
Millet 3293 2837 2856 3906 4450 4350<br />
Sorghun 573 1150 1252 4213 3883 6300<br />
Wheat 4510 2060 3634 3160 4140 4765<br />
Fruits 6000 5751 12000 9500 16845 15720<br />
Source: Regional Commissioner’s Office, <strong>Kilimanjaro</strong><br />
Fig. 5a: Food Crop Production (Tonnes 1990/91-1994/95) <strong>Kilimanjaro</strong> Region<br />
800000<br />
700000<br />
600000<br />
500000<br />
400000<br />
300000<br />
200000<br />
100000<br />
0<br />
1990/91 1991/92 1992/93<br />
Fig. 5b: Food Crop Production (Tonnes 1993/94-1995/96) <strong>Kilimanjaro</strong> Region<br />
43
700000<br />
600000<br />
500000<br />
400000<br />
300000<br />
200000<br />
100000<br />
0<br />
1993/94 1994/95 1995/96<br />
In the past most of the maize was eaten when it was still green but<br />
changes in food preference later influenced the people to accept<br />
maize meal as their diet. In fact, in the lowlands maize is the main<br />
staple food. This change has caused pressure on maize and<br />
facilitated the expansion of settlements at lowlands, as the crop<br />
provides food and cash. Bananas are mainly grown in the<br />
highlands and today it stands as a cash crop. Other food crops<br />
include, cassava, millet, sorghum, beans, potatoes, fruits and<br />
vegetables and various pulses grown for regional consumption and<br />
for export to other regions.<br />
2.4.1.7 Food Adequacy:<br />
The estimated regional requirement for cereal<br />
food crops is 316,496.0 Metric tons per annum while<br />
average production of the same is about 306,624.0 tons.<br />
The estimated regional requirement for protein food crops<br />
44
is 90,929.0 Metric tons while the average production of<br />
the same is about 86,981.0 tons, effecting protein food<br />
crops food shortage in <strong>Kilimanjaro</strong> region to the tune of<br />
3,948.0 Metric tons.<br />
N.B: The high volume of productivity in the case of bananas is<br />
attributed to acceptability of high yielding varieties (PARS)<br />
which was introduced recently by research and extension<br />
coupled by market demand in Dar es Salaam.<br />
2.4.1.8 Cash Crops:<br />
In the highland area the main cash crops grown in homestead<br />
plots is coffee inter-cropped with bananas. Coffee<br />
introduced in <strong>Tanzania</strong> in 1890's was first grown in<br />
<strong>Kilimanjaro</strong> region in the 1910s. Table XIV below shows<br />
the type of major cash crops produced in the region.<br />
TABLE XIV: CASH CROP PRODUCTION, 1988/89 - 1990/91 (TONS)<br />
Crops 1990/91 1991/92 1992/9 1993/9 1994/95 1995/96<br />
3 4<br />
Coffee 16584 17031 17207 12288 9421 12400<br />
Cotton 569 1153 0 190 254 265<br />
Sugarcane 40,000 40,000 33,100 33,200 35,100 33,100<br />
Wheat 4510 2060 3634 316 4140 4765<br />
Sunflower 1524 1972 120 775 2983 4876<br />
Cardamon 11 7 10 100 10 10<br />
Source:<br />
Regional Commissioner’s Office, <strong>Kilimanjaro</strong><br />
Fig. 6: Cash Crop Production, 1990/91 - 1995/96<br />
45
45000<br />
40000<br />
35000<br />
30000<br />
25000<br />
20000<br />
15000<br />
10000<br />
5000<br />
0<br />
1990/91 1991/92 1992/93 1993/94 1994/95 1995/96<br />
Coffee Cotton Sugarcane<br />
Wheat Sunflower Cardamon<br />
It is observed in table XIV above that coffee production in<br />
1994/95 fell very significantly to 9421 tons from 17,207 tons<br />
produced in 1992/93. A drop in volume in 1994/95 must have<br />
been influenced by both wheather and coffee prices which fell<br />
down in 1990, and hence affecting production volume.<br />
Nonetheless coffee still remains the most important cash crop in<br />
the region and at national level it accounts for 36.4 percent of total<br />
national coffee production. Confirming further the importance of<br />
coffee in the region, particularly in Moshi Rural, Hai and Rombo<br />
districts, 68 percent of the planted area is under coffee/bananas<br />
whereas only 17 percent is so planted in Mwanga and Same<br />
district.<br />
In the region as a whole coffee/bananas crops occupy 23 percent<br />
of the total cultivated area followed by maize, bans/maize each at<br />
46
Table XV(a):<br />
14 percent. Table shows the number of hectares put under coffee<br />
production by each district. Table XV(a)<br />
District<br />
HECTARES UNDER COFFEE PRODUCTION<br />
BY DISTRICT, 1990/91 KILIMANJARO REGION<br />
Hectare Cultivated (Coffee)<br />
Hai 20,823.85<br />
Moshi Rural 35,117.00<br />
Rombo 159,945.10<br />
Mwanga 2,317.50<br />
Same 2,727.08<br />
Total 76,930.53<br />
Source:<br />
TFNC Report No. 1231: The Situation Analysis of Food and Nutritional problems<br />
facing Women and Children in <strong>Kilimanjaro</strong> Region.<br />
47
Fig. 6: Hectares Under Coffee Production by District 1990<br />
80000<br />
70000<br />
60000<br />
50000<br />
40000<br />
30000<br />
20000<br />
10000<br />
0<br />
Coffee<br />
Cotton<br />
Sugarcane<br />
Wheat<br />
Sunflower<br />
Cardamon<br />
Oats<br />
(shier)<br />
1988/89(Year) 1989/90(Year) 1990/91(Year)<br />
Table XV(b) compares hectares under coffee production over a<br />
decade and a half (1977 - 1995) and calculated average coffee<br />
yields/ha. among principal coffee producing regions in the country.<br />
Mbeya region alone shows positive growth in yield/ha. over the<br />
stated period while the rest of the principal coffee growing regions<br />
show declines in this respect. Kilimnjaro and Arusha regions are<br />
worse of changes of - 42 and - 38 percent respectively.<br />
48
TABLE XV(b):<br />
Region<br />
Kilimanja<br />
r<br />
o<br />
HECTARES UNDER COFFEE AND AVERAGE TONS CLEAN<br />
COFFEE PER HA. AMONG MAJOR COFFEE PRODUCING<br />
REGIONS, TANZANIA MAINLAND<br />
Hectare<br />
1977-88<br />
Hectare<br />
1990-95<br />
Average<br />
Yield 1977-<br />
88<br />
Average<br />
Yield 1990-<br />
95<br />
Yield Change<br />
(%)<br />
60,393 70,326 262 153 -42<br />
Arusha 11,777 19,078 282 176 -38<br />
Kagera 45,012 59,012 232 184 -26<br />
Mbeya 25,481 48,746 155 186 +20<br />
Ruvuma 15,382 36,633 290 254 -12<br />
Iringa 2,444 6,838 320 300 -7<br />
Other 5,725 18,500 215 180 -16<br />
National 166,214 259,133 251 203 -19<br />
Source: MDB Reports, 1997<br />
Paddy ranks fourth with 7 percent of the cultivated land. In Same<br />
and Mwanga cardomon is grown as a spice and cash crop which<br />
has a relatively good market price, Cotton production is now<br />
confine to Same district due to competition with their better priced<br />
crops like paddy and sunflower and poor marketing facilities for<br />
the cotton crop.<br />
2.4.1.9 Food Storage:<br />
The problem of food storage is principally caused<br />
by the existence of inadequate and poor storage facilties<br />
49
which renders stored crops vulnerable to insects, pests<br />
and rodents.<br />
In most households, the widely used storage<br />
facilities include drums, ‘vihenge’, sacks and ceilings.<br />
However, of recent the prices of drums and construction<br />
of vihenges have jgone up hence poor families have to rely<br />
on the cheaper techniques which are easily attacked by<br />
pests and rodents. The use of Actelic super Dust (ASD)<br />
on maize and pulses has greatly reduced storage losses.<br />
Due to lack of adquate knowledge on food preservation<br />
techniques highly nutritious vegetables and fruits are forced<br />
to be consumed only seasonally. The region has a total of<br />
196 godowns with a capacity of 84,663.2 metric tones<br />
distributed amongst the districts as indicated below:-<br />
TABLE XVI: DETAILS OF GODOWNS IN KILIMANJARO REGION<br />
District Number of Total Capacity owner<br />
Purpose<br />
godowns Metric (T)<br />
Moshi Rural 63 53,797 KNCU, CDRF, General Goods<br />
NMC, TCMB, inputs and Food<br />
Village<br />
crops<br />
Hai 53 7,153 - do -<br />
Same 36 11,550 VCU, Villages, - do -<br />
CDTF,<br />
PADECO<br />
Rombo 26 11,018 KNCU, Villages, - do -<br />
NMC<br />
Mwanga 18 1,145 VCU Village - do -<br />
Total 196 84,663<br />
Source: Regional Commissioner’s Office, <strong>Kilimanjaro</strong>.<br />
50
2.4.1.10Irrigation:<br />
According to the Japanes Planning Team (RIDEP,<br />
<strong>Kilimanjaro</strong> 1977) 5.4 percent of the region’s cultivated land is<br />
irrigated compared with only 4 percent in <strong>Tanzania</strong> as a whole.<br />
Within the region, irrigation coverage is exceptionally high in<br />
Moshi rural, Hai, Rombo and Pare districts (Mwanga and Same).<br />
This is due to the fact that these two districts (Moshi Rural and<br />
Hai) are in densely populated mountain slopes where a large<br />
amount of water is available and utilised, and the fact that an<br />
increasing number of people who are gradually being forced by<br />
population pressure to move downhill and settle in lowland areas<br />
are using an increasingly large amount of water for irrigation<br />
farming. Rombo has very few permanent streams and irrigation in<br />
the district is negligible, even within the Coffee/banana belt. In<br />
<strong>Kilimanjaro</strong> region, water plays a very crucial role. Three sources<br />
of irrigation water may be considered: surface water, underground<br />
water and dams. Water resources in Moshi rural, Hai and<br />
Rombo districts originate primarily from rain in the mountain area<br />
and from the melting snow on the mountain slopes, forming<br />
numerous tream flowing down the mountain.<br />
TABLE XVII: TRADITIONAL IRRIGATION WATER SOURCES,<br />
KILIMANJARO REGION, 1990<br />
District No. of Rivers DMS Traditional Irrigation Channels<br />
Same 6 1 52<br />
Mwanga 5 1 26<br />
Rombo 2 - 16<br />
Moshi 8 - 260<br />
Hai 7 - 154<br />
51
Total 28 2 508<br />
Source:<br />
TFNC Report No.1231<br />
It is estimated that about 52,000 hectares of land are put under<br />
traditional irrigation system. Using traditional irrigation system,<br />
farmers grow coffee, bananas, cardamon, vegetables and fruits.<br />
Modern irrigation schemes are employed in Arusha Chini area<br />
where the Tanganyika Planting Company is irrigating over 7,800<br />
ha. Of sugarcane. Other areas include, the Miwalani-Kahe of the<br />
kahe basin managed by Naitonal Food Corporation Farm<br />
(NAFCO) and Miwaleni villages. Lower Moshi and Ndungu<br />
irrigation projects constructed through Japanese assistance are<br />
among the modern irrigation schemes. There are also eleven<br />
dams and reservoirs in the region, but Nyumba ya Mungu Dam is<br />
the largest of all dams and the most reliable source of water for<br />
irrigation. Except for the Nyumba ya Mungu dam in Mwanga<br />
district completed in 1968, most of the dams were built in the<br />
second half of 1950's and therefore do not provide reliable<br />
sources of water for irrigation. Rehabilitation of the jold dams and<br />
construction of new ones is necessary in order to harvest farm<br />
water for irrigation. Table XVIII below shows the capacity of<br />
irrigation dams in the region.<br />
52
TABLE XVII:<br />
DAM IRRIGATION WATER SOURCES<br />
Location<br />
Capacity of Storage<br />
(M)<br />
Volume (m 3 )<br />
Pare District.<br />
1. Nyumba ya Mungu 1,140,000 603,000<br />
2. Shungula 24,700 18,733<br />
3. Dindira 274 14,411<br />
4. Shatto 739 55,800<br />
5. Ranzi 286 18,780<br />
Moshi District<br />
1. Sholo 90 21,000<br />
2. Urenga 180 35,000<br />
3. Mworoworo 158 26,950<br />
4. Ukiashi 158 67,760<br />
Source:<br />
Regional Agriculture and Livestock Office, Moshi, <strong>Kilimanjaro</strong> Region<br />
(i)<br />
Lower Moshi:<br />
The Lower Moshi Irrigation Project began in 1984, and<br />
was completed in April 1987. The project study involved<br />
irrigation potential areas of Rau River system (ha.2300)<br />
Miwaleni Pump Scheme (ha.2000), Himo River system<br />
(ha.1000) and ground water system (ha.1020). Crops<br />
grown under the Lower Moshi scheme include paddy<br />
900-1100 hectares cultivated during rain-season, 400<br />
hectares during dry season while 900 hectares are put<br />
under maize. Perennial crops occupy 300 hectares. Rice<br />
production in Lower Moshi Irrigation Project, has<br />
surpassed the target put at 4.5 tons per hectare to register<br />
an average of 6.5 tons per hectare recorded in 1990.<br />
Problems facing the project include, inadequate water<br />
53
supply for irrigation purposes either due to drought or<br />
huge water demand by various users including those<br />
employing traditional Irrigation schemes.<br />
In order to curb inadequate water supply for irrigation, the<br />
region needs to explore more seriously the posibility of<br />
getting some underground water or attempts should be<br />
made to draw water from Miwaleni Project/Kikuletwa.<br />
(ii)<br />
Ndungu Irrigation Project:<br />
Ndungu irrigation Project is among five irrigation projects<br />
in Mkomazi Valley. The five projects include, Ndungu<br />
(ha.680), Gonja (ha.600), Kihurio (ha.1670), Kisiwani<br />
(ha.360) and Igoma (ha.750) Ndungu Project was<br />
completed in 1990 and agricultural activity began<br />
immediately, with an average production of 5.5 tons per<br />
hectare. The table below indicates a trend in paddy and<br />
maize production in both Lower Moshi and Ndungu<br />
Irrigation schemes.<br />
54
TABLE XVIII: LOWER MOSHI AND NDUNGU IRRIGATION PRODUCTION<br />
1989-1993<br />
Year Crop Lower Moshi Project Ndungu Project<br />
Area<br />
Cultivated<br />
(Ha)<br />
Product<br />
ion<br />
(tons)<br />
Area<br />
cltivated<br />
(Ha)<br />
Production<br />
(tons)<br />
1989 Paddy 484 3025 680 8645<br />
Maize - - - -<br />
1990 Paddy 901 4981 1663 11.008<br />
Maize 217 434 - -<br />
1991 Paddy 680 3740 680 8,638<br />
Maize 437 854 - -<br />
1992 Paddy 480 1680 485 3657<br />
Maize 450 675 - -<br />
1993 Paddy 950 4080 N.A. N.A.<br />
Maize N.A N.A. - -<br />
Source: Regional Commissioner’s Office <strong>Kilimanjaro</strong> Region, Moshi, 1995<br />
The two irrigation projects enabled the region to increase paddy<br />
production by 124 percentage from 17100 tons in 1985 to<br />
35,464 tons in the year 1995/96. It is being observed from table<br />
XVIII that the cultivated areas in both projects fluctuate very<br />
much in terms of the number of hectares and the same applies to<br />
production volume. For instance, the areas cultivated for rice in<br />
Lower Moshi project in 1989 was 484 hectares while in 1990 the<br />
number of hectares increased to 901 and dropped to 680<br />
hectares in 1991 and 480 hectares in 1992. In 1993 the number<br />
went up incredibly to 950 hectares. Despite these fluctuations in<br />
the number of hectares and paddy production volume, the two<br />
projects have been successful in achieving the objective of<br />
increasing food production and provision of employment, hence<br />
living standards alleviation of the farmers and the people around<br />
the project areas.<br />
55
2.4.1.11 Farm Inputs:<br />
TABLE XIX:<br />
Availability of farm inputs is generally a problem to small farmers<br />
and <strong>Kilimanjaro</strong> farmers cannot be the exception. Farm inputs if<br />
correctly applied are very central in the improvement of both<br />
quality and quantity of farm yields. The main problems with farm<br />
inputs have always been later delivery or high prices of these<br />
inputs or short supply. Tables XIX and XXI give information on<br />
the availability of farm inputs and farm implements to farmers in<br />
<strong>Kilimanjaro</strong> region.<br />
FARM INPUTS AVAILABILITY TO KILIMANJARO REGION<br />
FARMERS, 1986/87 - 1990/91<br />
Year Improved Seeds (Tons) Fertilizers (Tons)<br />
1986/87 872 6074<br />
1987/88 872 6575<br />
1988/89 444 7522<br />
1989/90 252 9641<br />
1990/91 379 8314<br />
Source:<br />
TFNC Report No. 1231: The Situation analysis of food and Nutritional Problems in<br />
<strong>Kilimanjaro</strong> Region<br />
56
TABLE XXI: PESTICIDES MADE AVAILABLE TO FARMERS, 1988/89 -<br />
1991/92, KILIMANJARO REGION<br />
Type of<br />
Pesticide<br />
1988/89 1989/90 1990/91 1991/92<br />
Quantity<br />
Required<br />
Actual<br />
Quantity<br />
Required<br />
Actual<br />
Quantity<br />
Required<br />
Actual<br />
Quanti<br />
ty<br />
Requir<br />
ed<br />
Actu<br />
al<br />
Kocide Mt. 1500 6.86 1035 199.98 - - - -<br />
Bayleton Mt. - 70 20 12 41 41 42 -<br />
Blue Copper 1590 210 700 - 820 120 678 -<br />
Red Copper 660 - 810 - - - 157 -<br />
Delan - - - - 20 - -<br />
Octave Mt. - 39920 - - - - -<br />
Bravo Lt. 262875 69960 468000 93686 450000 - 10000<br />
0<br />
Dyrene - - 23900 231810 - 30000<br />
0<br />
-<br />
Title Lt. - 38500 - 20000 - - -<br />
Dursban Lt. 225000 34660 404152 139340 285000 14000 60000<br />
Selectron Lt. - - 35000 34000 160000 20000 90000<br />
Dieldrin Lt. - - 10000 4000 20000 - 10000<br />
Endosulfan Lt. - - 2000 - 3000 - 30892<br />
Bayfidan - - 1500 - 1500 -<br />
Source:<br />
TFMC Report No.1231: The Situational Analysis of fooe and Nutritional Problems<br />
Facing Women and children in <strong>Kilimanjaro</strong> Region.<br />
2.4.2 Livestock Development:<br />
About 2018 sq. km. Equivalent to 15.3% of the total area<br />
of the region is under livestock farming. Despite scarcity<br />
57
of grazing land, livestock keeping could still be ranked<br />
second predominant economic activity after crop farming.<br />
Households living in the highlands and intermediate zones<br />
practice modern dairy farming is under zero grazing or stall<br />
feeding whereas those in the lowlands are engaged in what<br />
may be termed as “traditional ranching”. And most of the<br />
cattle reared mider this system are mainly local zebu. The<br />
other types of livestock are evenly distributed on both<br />
zones. The number of various livestock units kept in the<br />
region in 1993/94 is as sown in Table XXII.<br />
TABLE XXII: KILIMANJARO REGION LIVESTOCK SUMMARY DATA 1993/94<br />
Livestock Category Total Household<br />
Average<br />
National<br />
Regional<br />
% on<br />
National<br />
Total<br />
Cattle 1,617,593 485,448 3.88 3.57<br />
Goats 8,641,222 490,338 5.48 6.91<br />
Sheep 2,692,716 206,904 2.96 7.68<br />
Chickens and other poultry 21,530,083 1,029,495 5.83 4.78<br />
Pigs 429,682 14,873 - 3.32<br />
Donkey 272,427 202,378 - 4.46<br />
Buffalos 13,916 2,282 - 16.40<br />
Rabbits 269,455 15,666 - 5.81<br />
Source:<br />
1. Compiled from National Sample Census of Agriculture 1993/94 Report Vol II Page<br />
42-57<br />
2. Regional Agricultural and Livestock Development Office, <strong>Kilimanjaro</strong> Region,<br />
Moshi.<br />
58
TABLE XXIII:<br />
In comparison with regions like Mwanza, Shinyanga, Mara and<br />
Dodoma, <strong>Kilimanjaro</strong> region could be regarded to have relatively<br />
smaller livestock populations. Cattle, sheep and goats are central<br />
to stock farming in the region, they are raised in great numbers<br />
and considered more important than other animals. Livestock<br />
population is unevenly distributed among the districts in the region<br />
as Table XXIII indicates.<br />
NUMBER OF DOMESTIC ANIMALS KEPT BY DISTRICT<br />
1993/94, KILIMANJARO REGION<br />
District Cattle Goats Sheep Donkeys Pigs<br />
Hai 94,753 88,454 33,237 3,976 -<br />
Rombo 59,102 150,978 55,622 - 10,618<br />
Moshi Rural 125,419 41,498 52,071 190,380 3,531<br />
Same 123,259 110,893 37,345 5,918 -<br />
Mwanga 82,915 98,515 28,629 2,104 724<br />
Total 485,448 490,338 206,904 202,378 14,873<br />
Source:<br />
Regional Agricultural and Livestock Development Office <strong>Kilimanjaro</strong> Region, Moshi.<br />
Fig. 7: Domestic Animals kept by District , <strong>Kilimanjaro</strong> Region, 1993/94<br />
59
200000<br />
180000<br />
160000<br />
140000<br />
120000<br />
100000<br />
80000<br />
60000<br />
40000<br />
20000<br />
0<br />
Hai Rombo Moshi Rural Same Mwanga<br />
Cattle Goats Sheep Donkeys Pigs<br />
TABLE XXIV: LIVESTOCK POPULATION GROWTH 1986/87 - 1990/91,<br />
KILIMANJARO REGION<br />
Year Cattle Sheep Goats<br />
1986/87 418,000 221,000 441,000<br />
1987/88 421,000 225,000 445,000<br />
1988/89 425,000 229,000 450,000<br />
1989/90 428,000 234,000 454,000<br />
1990/91 431,000 237,000 458,000<br />
Source:<br />
Regional Commissioner’s Office <strong>Kilimanjaro</strong>, Moshi.<br />
Fig. 8: Livestock Population growth (Thousands)<br />
60
Thousands<br />
500<br />
400<br />
300<br />
200<br />
100<br />
0<br />
1986/87 1987/88 1988/89 1989/90 1990/91<br />
Cattle Sheep Goats<br />
In the highland zone where land is scarce, stall-feeding of cattle<br />
and goats is a common practice. Often the care of these animals<br />
is the duty of women, helped by children. The animals are fed<br />
with different types of feeds, the most common of which are<br />
banana leaves, and varieties of grass such as Guatemala grass,<br />
Guinea grass, Napper grass etc. In the lowlands cattle and goats<br />
graze on natural pasture, there are more cattle in this area than in<br />
the highlands and are kept mostly for beef. In the highland area,<br />
cattle are main source of manure for the bananas and coffee fields<br />
apart from being sources of milk, cooking fat, meat and hides.<br />
The majority of cattle raised in the highland zone are of Zebu<br />
breed orgin but crossed with Exotic breeds such as Jersey,<br />
Fresians, and Sahiwals. Pure exotic breeds are mostly kept in<br />
areas at altitudes of 1,300 meters or 50 above sea level. Cattle<br />
keeping in the region is of three ways: the first group of ownership<br />
is the large scale, mainly Institutions such as DAFCO, NAFCO,<br />
KARATA and KNCU 1984 Ltd. This group tends to herd the<br />
61
mixed breeds of Zebu and Exotic. The second group is that<br />
which feeds livestock in stalls and in most cases only 2 cattle or<br />
about that number is raised depending on land availability. The<br />
main motive for this group is to serve as a source of manure for<br />
their crops and some milk for domestic consumption. The third<br />
group is found mainly in the lowlands and specializes in raising the<br />
short Horn Zebu type. The breed serves both for beef and milk<br />
and it is the type usually traded at livestock auction. For instance<br />
in 1985, about 24,600 cattle (Zebu) were auctioned.<br />
One of the factors preventing an appreciable increase in the<br />
number of domestic animals is low livestock infrastructure<br />
facilities. Table XXV below shows livestock infrastructure facility<br />
status in <strong>Kilimanjaro</strong> Region. From the table it is clear that the<br />
available infrastructure is not adequate to cater for the number of<br />
domestic animals in the region. For instance 56 dips in the regions<br />
serve for about 8,679 cattle instead of 5,000 for each dip. Thus,<br />
an appreciable increase in the number of domestic animals would<br />
mean more investment in livestock infrastructure. The<br />
infrastructure in the region is highlighted in Table XXV.<br />
TABLE XXV: LIVESTOCK INFRASTRUCTURE STATUS IN KILIMANJARO<br />
REGION<br />
District<br />
Type of Facility<br />
Dips Abattoirs Crushers Health<br />
Cente<br />
Hide/Skin<br />
shed<br />
Cattle<br />
Dams<br />
r<br />
Mwanga 13 16 5 8 2 13<br />
Hai 12 - 9 9 - -<br />
Same 9 4 6 9 2 14<br />
Rombo 12 6 9 - - -<br />
Moshi Rural 10 5 - - - -<br />
Total 56 31 29 26 4 27<br />
62
Source:<br />
Mpango wa Maendeleo wa Mwaka 1990/91 - <strong>Kilimanjaro</strong> Region<br />
The 1984 Livestock Census results revealed that only 40 percent<br />
of the cattle in the region were productive in terms of milk. Milk<br />
demand in the region is over and above the supply. The<br />
inadequacy of this animal product is mainly attributed by poor and<br />
inadequate pastures and health facilities. Heifer project<br />
International has been introduced in the region in an attempt to<br />
increase milk supply. The project is supported and sponsored by<br />
Religious Institutions in the Region. Table XXVI shows the extent<br />
of involvement of religious, institutions in dairy cattle farming.<br />
63
TAB LE XXVI:<br />
INVOLVEMENT OF RELIGIOUS INSTITUTIONS IN DAIRY<br />
CATTLE FARMING- IN KILILIMANJARO REGION 1990<br />
District Dairy Cattle (No) Sponsor<br />
Moshi Rural 155 Lutheran Church and Romann Catholic<br />
Rombo 20 Roman Catholic<br />
Hai 16 Roman Catholic<br />
Mwanga 104 Roman Catholic and Lutheran Church<br />
Same 18 Lutheran Church and roman Catholic<br />
Total 313<br />
Source:<br />
TFNC Report No.1231: The Situation Analysis of Food and Nutritional Problems in<br />
Kilimnjaro Region, 1990<br />
2.4.2.1 Livestck Services:<br />
NALERP (National Agriculture and Livestock Extension<br />
Rehabilitation Project) The project involves training of field staff<br />
and farmers through bi-monthly workshops, monthly training<br />
sessions, seminars, long and short courses, field days, study tours<br />
and demonstration. The region is divided into 47 and 409<br />
Extension division and villages respectively.<br />
Bull centres and Molasses Tanks:<br />
The region has 39 Bull centres and 55 Molasses tanks; extending<br />
services to surrounding farmers. However, most of these have<br />
ceased to function due to various operational problems.<br />
Artificial Insemination:<br />
64
The region has 24 Artificial Insemination Centres, of which only 8<br />
are operational.<br />
District Total No of Centres No. Of Operating Centres<br />
Moshi Rural 10 3<br />
Same 2 -<br />
Mwanga 3 1<br />
Rombo 3 2<br />
Hai 6 2<br />
Total 24 8<br />
Source: Regional Commissioner’s Office, <strong>Kilimanjaro</strong><br />
Shortage of liquid Nitrogen, funds and transport facilties are the<br />
major operational problems.<br />
Veterinary Centres and Cattle Dips:<br />
There are 26 veterinary centres and 56 cattle Dips. However<br />
most of then have ceased to function due to operational problems.<br />
Abattoirs and Slaughter Slabs:<br />
The region has 31 abattoirs and 120 slaughter slabs shown below.<br />
65
TABLE XXVII:<br />
ABATTOIRS AND LIVESTOCK SLAUGHTERS SLABS ARE<br />
IN KILIMANJARO REGION 1995.<br />
Year Abattoi Slabs Slaughters<br />
Cattle Shee Goats Pigs<br />
1988/89 31 387 48832 2674 13565 6913<br />
1989/90 31 388 36204 1755 6062 6357<br />
1990/91 31 390 40650 2110 7658 4800<br />
1991/92 31 390 36952 2641 6991 2834<br />
1992/93 31 220 38167 2545 7163 2468<br />
1993/94 31 220 40161 2642 6555 2763<br />
1994/95 31 120 33729 3252 6570 2433<br />
Source: <strong>Kilimanjaro</strong> regional Livestock Development Office, Moshi, 1995<br />
TABLE XXVIII: HIDES AND SKINS FACILITIES AND SALES,<br />
KILIMANJARO REGION, 1996 HIDES AND SKINS<br />
Year<br />
Open<br />
frames<br />
Hide<br />
shed<br />
s<br />
Stores<br />
66<br />
Cattl<br />
e<br />
Sales<br />
Goats<br />
Sheep<br />
1988/89 46 226 8 23498 11336 2965<br />
1989/90 46 226 7 27746 8300 7326<br />
1990/91 46 226 10 35405 12025 6378<br />
1991/92 46 226 13 28227 1381 501<br />
1992/93 46 226 15 44740 11701 3513
1993/94 46 226 23 52333 9137 1734<br />
1994/95 46 226 11 36363 9774 3717<br />
Source: Regional Livestock Development Office Moshi, 1995<br />
2.4.3 Natural Resources:<br />
<strong>Kilimanjaro</strong> region is rich in natural resources. Rare tree<br />
species such as astigmia “Msoo” are found no where else in the<br />
world except in Rau Forest in <strong>Kilimanjaro</strong> region. Even the<br />
largest “Mvule” tree in the whole country (<strong>Tanzania</strong>) is again<br />
found in the Rau forest in <strong>Kilimanjaro</strong> region. Mvule tree is famous<br />
for producing hard wood mostly preferred in furniture making<br />
activities. <strong>Kilimanjaro</strong> also as a mountain is a tourist attraction<br />
earning the country substantial foreign currency. Other area of<br />
tourist attraction include, the Mweka caves used during war time<br />
period as hide-outs and the mwariko Art Gallery, where historical<br />
materials are displayed and other cultural arte facts kept.<br />
2.4.3.1 Forestry:<br />
The region has both natural and plantation forests. About<br />
139,832 hectares of land fall under natural forests mostly in the<br />
highland zone, where the famous tree such as Mvule, Mkanga and<br />
Msoo are also found. Natural forests can be seen also in the<br />
lowland areas of Rau, Kahe I and kahe II Forest Reserves in<br />
Moshi (R) district. Table XXIX provides good insight into where<br />
natural forests can be found in the region.<br />
67
TABLE XXIX: SPREAD OF NATURAL FORESTS IN KILIMANJARO REGION<br />
District Name of Forest Area (Hect)<br />
Moshi Rural <strong>Kilimanjaro</strong> Forest Reserve 107,828.0<br />
Rau Forest Reserve 20.0<br />
Kahe I Forest Reserve 885<br />
Kahe II Forest Reserve 202<br />
Same Kisomo 70.0<br />
Chome Forest Reserve 14,285<br />
Vumari Forest Reserve 1,825.7<br />
Chambo Forest Reserve 5467<br />
Kaizu Forest Reserve 3,070.1<br />
Karangare Forest Reserve 321.8<br />
Chungwani Forest Reserve 92.3<br />
Kakoka Forest Reserve 78.1<br />
Kaukoma forest Reserve 74.5<br />
Gonja forest Reserve 78.8<br />
Magoma 78.8<br />
Total Reserve Area 134,377.1<br />
Source: <strong>Kilimanjaro</strong> Regional Natura Resources office Moshi, 1995<br />
68
In addition to the above mentioned forest reserves, plans are<br />
under way to declare the following areas to be National Forest<br />
Reserves:-<br />
- Mwalla - 1,373 ha.<br />
- Kalumwenda - 583 ha.<br />
- Kamwalla I - 117 ha.<br />
- Kamwalla II - 293 ha.<br />
- Kiverenge - 2,155 ha<br />
The areas of Mwalla, Kaluwenda, Kamwalla I Kamwalla II and<br />
Kiverenge are to be declared Forest Reserves so as to enable the<br />
government protect natural forests which are increasingly being<br />
encroached . Being forest reserves, hardwood supply would<br />
increase as a result of being protected and river sources will be<br />
protected as a result.<br />
Plantation forests are being established in the region in order to<br />
check the devastating man activities of indiscriminate tree cutting<br />
and livestock overgrazing<br />
The afforestation programme has been growing year after year<br />
following deliberate efforts made by the government enhanced by<br />
self-awareness of the local people and the value they attach to the<br />
importance of trees. The programme raises seedlings up to<br />
required age and then distributed to needy institutions (villages,<br />
schools, etc) and individual persons. The table below shows the<br />
amount of tree seedlings raised and the number of hectares<br />
planted from 1985/86-1990/91 in the region.<br />
69
TABLE: XXX:<br />
SEEDLINGS RAISED AND HECTARES PLANTED, IN<br />
KILIMANJARO REGION, 1995<br />
Years Seedling Area Planted (Ha.)<br />
1985/86 1,030,000 515.0<br />
1986/87 1,575,000 787.0<br />
1987/88 3,406,000 1,703.0<br />
1988/89 4,757,000 2,368.6<br />
1989/90 4,432,060 2,417.0<br />
1990/91 3,767,687 2,508.0<br />
Source: <strong>Kilimanjaro</strong> Regional Natural Resources Office 1995<br />
Although the number of hectares planted has been increasing since<br />
1985/86 (table XXX) still a lot more has to be done to keep pace<br />
with the fast growing needs for forest products. <strong>Kilimanjaro</strong><br />
region will soon face serious environmental degradation if more<br />
trees are not replaced, and livestock not reduced to the level land<br />
carrying capacity can sustain.<br />
Between 1976 and 1991 the region raised about 28.6 million<br />
seedlings. The seedlings were distributed to individuals, schools,<br />
private institution, villages, NGO’s and Government department<br />
as indicated in Table XXXI. Most of the seedlings were raised<br />
from centralized Government nurseries and distributed free of<br />
charge.<br />
70
There are 19 operating government nurseries, 9 operated by<br />
Roman catholic church and 2 by <strong>Tanzania</strong> Environmental Society<br />
(a non Government Organisation working in the region). In high<br />
potential areas the survival rate for plantations of individuals is<br />
over 80%, in communal areas it is about 60% while in schools it is<br />
over 70%. In the marginal areas in communal lands the survival<br />
rate is below 50% while in schools it is above 55%.<br />
TABLE XXXI<br />
District<br />
SEEDLINGS RAISED IN THE REGION FROM 1976-1994 BY<br />
DISTRICTS.<br />
Total<br />
Seedlings<br />
Raised<br />
School and<br />
Institutions<br />
Distribution<br />
Villages Individuals Non-<br />
Government<br />
Organisatio<br />
n<br />
Departme<br />
nt<br />
Moshi (R) 3,377,235 1,222,620 124,227 1,643,801 139,557 24,675<br />
Moshi (U) 813,768 20,600 - 233,449 12,400 247,229<br />
Mwanga 1,627,500 536,150 144,230 574,680 115,630 246,810<br />
Same 29,994,442 1,133,606 108,660 1,552,675 141,045 58,362<br />
Hai 14,700,359 2,981,118 3,469,750 3,599,515 240,995 4,408,981<br />
Rombo 5,113,825 1,436,335 154,850 230,076 900,375 321,500<br />
Total 28,617,039 7,330,429 4,001,717 9,904,885 1,550,002 5,829,677<br />
Source: Regional Natural Resources Officer <strong>Kilimanjaro</strong>, Moshi, 1995<br />
2.4.3.2 Wildlife:<br />
<strong>Kilimanjaro</strong> is one of the regions that is endowed with richness in<br />
terms of wildlife. The <strong>Kilimanjaro</strong> National Park is a home of high<br />
altitude wildlife and a variety of insects,<br />
Mkomazi game reserve including Lotatema and Ruvu Controlled<br />
areas are verty impotant as sanctuaries for Savannah wildlife; the<br />
majority of species found are the bovine and few carnivorous; the<br />
71
number of bovine out numbers the carnivorous, and that is why a<br />
systematic cropping is conducted by Wildlife Division and<br />
<strong>Tanzania</strong> wildlife Co-operation (TAWICO). Wildlife game<br />
reserve covers an area of 7170 sq km. Of land distributed as<br />
table XXXII below indicates.<br />
TABLE XXXIII: LAND AREA FOR GAME RESERVE BY DISTRICT,<br />
KILIMANJARO REGION<br />
District Area Area<br />
(Sq<br />
kms)<br />
Conservation Status<br />
Same Mkomanzi 3234 Game Reserve<br />
Kalimawe 300 Game Controlled area<br />
Ruvu 1000 - do -<br />
Moshi (R) Mt. <strong>Kilimanjaro</strong> 1078 Game Reserve/forest<br />
<strong>Kilimanjaro</strong> National Park 758 Game Controlled area<br />
Hai Sanya/Leta Tema 800 Game controlled area<br />
Total 7,170<br />
Source:<br />
Regional Natural Resources Office - <strong>Kilimanjaro</strong>, Moshi<br />
Aquatic wildlife is also abundant, such as crodiles mostly found in<br />
Pangani, Nyumba ya Mungu Dam and Lake Jipe.<br />
In general wildlife conservation in <strong>Kilimanjaro</strong> region is being<br />
made difficult by several factors including shortage of necessary<br />
equipments for wildlife conservation and encroachment for more<br />
land by people around the reserve.<br />
72
2.4.3.3 Fishing:<br />
Fishing industry is not a common activity in the region due to lack<br />
of big lakes or rivers with enough fish. However, some minor<br />
fishing activitities goes on at the Nyumba ya Mungu Dam,<br />
Kilimawe, Mworoworo, Diondara and small lakes of Jipe and<br />
challa as well as in rivers of Kikuletwa and Ruvu. The fish from<br />
these lakes and rivers is of great importance to the region<br />
particularly in areas where protein food is scarce.<br />
Table XXXIII and XXXIV highlight fishing activities in the region.<br />
TABLE XXXIV: FISH INDUSTRY STATISTICS IN KILIMANJARO REGION, 1989 - 1991<br />
Year<br />
No. of fishermen<br />
No of fishing<br />
Vessels<br />
Fish Catch<br />
(Tons)<br />
Value (00<br />
Tshs)<br />
1989 11,703 485 1,642 54,000.0<br />
1990 1,270 583 2,032.5 40,627.0<br />
1991 850 632 1,617.1 30,840.0<br />
Sources: Ministry of Natural Resources and Tourism, Fisheries Division, Dar es Salaam<br />
74
TABLE XXXIV:<br />
FISH CATCH IN KILIMANJARO REGION<br />
FROM 1981/82 - 1993/94<br />
Year Quantity (Tons) Change (%)<br />
1981/82 7148.5 -<br />
1982/83 9245.2 29.3<br />
1983/84 9546.5 3.4<br />
1984/85 11562.9 21.7<br />
1985/86 4539.6 -60.7<br />
1986/87 3888.0 -14.3<br />
1987/88 9218.3 7.8<br />
1988/89 2118.1 -49.82<br />
1989/90 2032.5 -4.0<br />
1990/91 1617.1 -20.0<br />
1991/92 1468.8 -9.2<br />
1992/93 2749.5 8.7<br />
1993/94 4380.2 5.9<br />
Source: Regional Natural Resources, Fishery Division <strong>Kilimanjaro</strong> Region, Moshi, 1995<br />
Fig. 10: Fish Catch in <strong>Kilimanjaro</strong> Region, 1981/92 - 1993/94<br />
75
12000<br />
10000<br />
8000<br />
6000<br />
4000<br />
2000<br />
0<br />
1981/82<br />
1982/83<br />
1983/84<br />
1984/85<br />
1985/86<br />
1986/87<br />
1987/88<br />
1988/89<br />
1989/90<br />
1990/91<br />
1991/92<br />
1992/93<br />
1993/94<br />
Nyumba ya Mungu Dam which is about 180 sq km. And 41<br />
meters deep provides the main fishing ground for fishermen in the<br />
region. However, if this Dam is not well maintained sooner or<br />
later it may loose its original water storage capacity due to silting.<br />
In addition, the Ruvu (Pangani) and Kikuletwa rivers which<br />
constitute the main water source into the Dam are no longer<br />
flowing into the Dam with adequate water, hence fish survival put<br />
to a threat.<br />
These problems to a large extent, have reduced the volume of fish<br />
catch. It has been reported that fish catch dropped drasticallly to<br />
1,468 tons in 1991/92 from 11,500 tons recorded in 1984/85.<br />
Apart from problems facing the Dam, fishernmen too lack modern<br />
fishing gear and credit facilities to enable them sustain their<br />
activities.<br />
2.4.3.4 Beekeeping:<br />
76
Bee-keeping has great potential in <strong>Kilimanjaro</strong> region especially in<br />
Mwanga, Same, Hai and in some parts of Moshi Rural District.<br />
Potentiality in these areas is enhanced by availability of the Acacia<br />
woodlands. Table XXXV shows the magnitude of bee-keeping<br />
industry in the region.<br />
77
TABLE XXXV: BEE-KEEPING PRODUCTS AND VALUE IN KILIMANJARO<br />
REGION FROM 1983-1994<br />
Year Modern<br />
Bee<br />
Hives<br />
(No)<br />
Traditio<br />
nal Bee<br />
Hives<br />
(No)<br />
Bees Wax<br />
Honey<br />
Kgs. TShs. Kgs. TShs.<br />
1983 146 50,074 1221 37,850 125,850 4,225,000<br />
1984 233 52,086 4117 65,760 185,901 5,591,674<br />
1985 241 125,850 1485 17,385 121,638 4,456,360<br />
1986 258 137,690 53 4,830 5,471.8 2,852,800<br />
1987 262 143,967 74.5 4,845 53,112 5,117,960<br />
1988 296 140,607 87 7,260 97,644 8,546,000<br />
1989 350 140,607 220 88,000 115,000 4,600,000<br />
1990 563 147,818 347 38,800 142,150 5,868,000<br />
1991 815 184,922 1004 1,600 213,950 8,558,000<br />
1992 740 208,882 728 36,800 274,900 109,960,000<br />
1993 778 218,882 2500 1,500,000 27,500 16,500,000<br />
1994 778 218,882 1200 840,000 30,000 18,000,000<br />
Source: RDD’S Offise, <strong>Kilimanjaro</strong> Region, 1994.<br />
TABLE XXXVI: NUMBER OF BEE HIVES BY DISTRICT, KILIMANJARO<br />
REGION, 1995<br />
District Modern Beehives Traditional Beehives<br />
Mwanga 22 95,000<br />
Moshi (Rural) 400 67,207<br />
Same 300 28,115<br />
Hai 357 22,330<br />
Rombo - -<br />
Total 1079 221,212<br />
78
Source: RDD’s Office, <strong>Kilimanjaro</strong> Region, 1995<br />
79
Fig. 11: Production of Bee-wax and Honey (Tons) in <strong>Kilimanjaro</strong> region<br />
300000<br />
250000<br />
200000<br />
150000<br />
100000<br />
50000<br />
0<br />
1983<br />
1984<br />
1985<br />
1986<br />
1987<br />
1988<br />
1989<br />
1990<br />
1991<br />
1992<br />
1993<br />
1994<br />
Bees Wax (Kgs)<br />
Honey (Kgs)<br />
It is estimated that there were about 29,148 Bee-keepers in the<br />
region whose total honey production was 274,900 kgs (1992<br />
production) and beewax was recorded at 728 kgs. About<br />
Tshs.109,960,000 was earned through sales of honey and Bee<br />
wax. Bee-Keeping industry if taken seriously it could turn out to<br />
be one of the major foreign exchange earning sector in the region.<br />
2.5 Manufacturing<br />
The manufacturing industry is growing fast and it is increasingly<br />
contributing more to Regional GDP. Tables XXXVII(a) - (b) and<br />
XXXVIII highlight industrial output growth in terms of value of<br />
goods produced from 1987 - 1990 and type of goods generated<br />
in the region.<br />
80
TABLE XXXVIIa: INDUSTRIAL OUTPUT (000'SHS), KILIMANJARO REGION 1987 -<br />
1990<br />
Industry Activity<br />
Year (000 Shs)<br />
1987 1988 1989 1990<br />
Mining 35421 35421 19329 19329<br />
food manufacturing 456399 69898 2775646<br />
6<br />
282465<br />
Textile and Leather 266286 40025 662467 77844<br />
Wood products 129248 16192 523574 501799<br />
Paper and paer product 10432 64326 673886 941740<br />
Chemicals 520910 50436 857476 960271<br />
Machinery 196760 19216 360148 392035<br />
Electricity 156373 18935 440000 664461<br />
Other Manufacturing - - 59288 68143<br />
Source: <strong>Kilimanjaro</strong> Regional Statistics Abstract, 1993<br />
Due to land scarcity, young people are encouraged to engage themselves<br />
in small and medium industrial production:<br />
TABLE XXXVIIb:<br />
Type<br />
Industry<br />
of<br />
SMALL AND MEDIUM SCALE INDUSTRIES OPERATED<br />
IN KILIMANJARO REGION BY DISTRICT, 1997<br />
Mwanga Rombo Moshi ® Moshi (U) Hai Same<br />
Milling 38 76 113 27 55 72<br />
Sisal production 1 - - - - 2<br />
Oil Mills 2 4 5 6 4 2<br />
Saw Mills 9 16 - 19 8 9<br />
Metal Works 5 3 17 24 4 8<br />
81
Milk Production - - - - 1 -<br />
Malt - - - 1 - -<br />
Source: Regional Commissioner’s Office, <strong>Kilimanjaro</strong>, Moshi.<br />
TABLE XXXVIII:<br />
INDUSTRIES OPERATED IN KILIMANJARO REGION<br />
Industry<br />
82<br />
Activity<br />
1. Kibo Match Group Ltd. Pulp and paper Match Box<br />
2. Himo Tanners Leather Goods<br />
3. Bonnite Bottlers Soft Drinks<br />
4. African Flower Industry Mosquito Coiled<br />
5. Abcon Chemical Ltd. Chemicals<br />
6. SIDO Common Foundry facility<br />
7. <strong>Kilimanjaro</strong> machine Tools<br />
Ltd.<br />
Spare parts<br />
8. Moshi Textile Industries Textile Products<br />
9. Kibo Paltry Company Ltd.<br />
10. <strong>Kilimanjaro</strong> Utilization Furniture<br />
11. T.P.C. Ltd. Sugar<br />
12. Karimjee Agricultural Ltd. Sisal Products<br />
13. <strong>Tanzania</strong> Coffee Board Coffee Roasting<br />
14. ELCT Northen Diocese Printing Presee<br />
15. Super Coatings Paints<br />
16. <strong>Kilimanjaro</strong> Distillers Mineral Water<br />
17. Moshi Pesticides Ltd. Chemicals<br />
18. Moshi Leather Industries Leather Goods<br />
19. K.N. Tarimo and Sons Coffee, Roasting and Gemstone
20. Meatheru Industries Metal Works<br />
21. KAPS Industries Timber Works<br />
22. Kibo Industries Ltd. Artificial Leather<br />
23. TAN-OPTIC CO. LTD Glasses, spectacle<br />
24. Northern Packing Co. Ltd. Packing Boxes<br />
25. <strong>Kilimanjaro</strong> Auto &<br />
Machine Enq.<br />
26. Modern Retread &<br />
Roadways Ltd.<br />
Spare parts<br />
27. HAZ Industries Sweet<br />
Retread of Tyres<br />
28. <strong>Tanzania</strong> Bag Industries Sisal bags<br />
29. AMOCO Industries Sports Equipments<br />
30. Mawenzi Products Ltd. Tomato sauce, Juice<br />
31. Hussein Industries Soap<br />
32. Moroline Line Cosmetics<br />
33. <strong>Kilimanjaro</strong> Sawmill Sawmill, timber<br />
34. Zabira Bottlers 1991 Ltd. Soft Drinks<br />
35. COMFY Ltd. Sunflower Oil, Wheat Flower, Cotton Oil<br />
36. Packing Stationery Exercise Books<br />
37. Kiboroloni Oil Sunflower Oil<br />
38. Shah Industries leather Goods<br />
39. Tanscart Timber & Co. Mobile Sawmill<br />
40. <strong>Kilimanjaro</strong> Electro Planting<br />
41. Interchen Pharmacy Ltd. Human & Animal Drugs<br />
83
SECTION III<br />
3.0 ECONOMIC INFRASTRUCTURE<br />
3.1 Introduction:<br />
Comparatively, <strong>Kilimanjaro</strong> region is well served by a network of<br />
roads which link the rural population clusters and also provides<br />
easy communication with the surrounding areas. In addition, there<br />
is a reliable railway line from Dar es Salaam to Moshi<br />
(Municipality of the region) via Tanga, ending up in Arusha Town.<br />
Another railway line extends from Moshi to Voi in Kenya at the<br />
border. The region also enjoys good Air service provided<br />
through <strong>Kilimanjaro</strong> International Airport (KIA) and Moshi<br />
Airport. With regard to power supply, <strong>Kilimanjaro</strong> region is one<br />
of the few regions in the country benefitting from Japanese Rural<br />
Electrification Programme, which has made possible the<br />
electrification of almost all business centers in the region.<br />
3.2 Roads Network<br />
There are three classes of roads in the region, namely trunk roads,<br />
regional roads and feeder/district roads. Administratively, trunk<br />
roads fall under the Ministry of Works, while the Regional,<br />
District and feeder roads are the responsibilities of the Regional<br />
Government and District Authorities respectively.<br />
Although, the road density of <strong>Kilimanjaro</strong> Region is fairly<br />
developed compared with that of other parts of the country, it<br />
varies considerably between different districts within the region. It<br />
84
is low in terms of area in the Pare district while in Moshi district it<br />
is low in terms of population. The total mileage of roads in the<br />
region is shown in Table XXXIX where as Table XL shows the<br />
same by district.<br />
TABLE XXXIX: ROAD NETWORK IN KILIMANJARO (KMS)<br />
Type of Roads Mwanga Sam<br />
e<br />
Trunk Roads<br />
- Tarmac<br />
- Gravel<br />
-Earth<br />
50<br />
-<br />
97<br />
94<br />
Rombo Hai Mosh<br />
i<br />
Rural<br />
Mosh<br />
i<br />
Total<br />
Total (Kms) 50 191 44 27 68 640<br />
Regional Roads<br />
- Tarmac<br />
- Gravel<br />
- Earth<br />
-<br />
53<br />
140<br />
-<br />
-<br />
163<br />
-<br />
44<br />
-<br />
-<br />
108<br />
-<br />
-<br />
46<br />
33<br />
30<br />
61<br />
7<br />
-<br />
42<br />
80<br />
112<br />
60<br />
200<br />
295<br />
145<br />
200<br />
88<br />
166<br />
553<br />
Total (Kms) 193 163 108 109 234 807<br />
D/Feeder Roads<br />
-<br />
Tarmac/Gravel<br />
- Earth<br />
-<br />
263<br />
-<br />
414<br />
-<br />
618<br />
3<br />
387<br />
19<br />
568<br />
22<br />
2,250<br />
Total (Kms) 263 414 618 390 587 2,272<br />
Total<br />
Mileage(Kms)<br />
506 768 770 526 889 260 3,719<br />
Source: Regional engineer's Office, <strong>Kilimanjaro</strong>; Moshi<br />
85
TABLE XL:<br />
District<br />
TOTAL ROAD MILAGE AND ALL WEATHER ROADS BY<br />
DISTRICT<br />
Total Mileage<br />
(KM)<br />
All-Weather<br />
Roads (KM)<br />
All Weather Roads<br />
as % of Total<br />
Mwanga<br />
Same<br />
Rombo<br />
Hai<br />
Moshi Rural<br />
506<br />
768<br />
770<br />
526<br />
889<br />
246<br />
385<br />
136<br />
226<br />
304<br />
48.6<br />
50.1<br />
17.7<br />
43.0<br />
34.1<br />
Total 3459 1297 37.5<br />
Source: Regional Engineer's Office <strong>Kilimanjaro</strong><br />
Fig. 11: Total Road Mileage and all-weather road by District<br />
1000<br />
900<br />
800<br />
700<br />
600<br />
500<br />
400<br />
300<br />
200<br />
100<br />
0<br />
Mwanga Same Rombo Hai Moshi<br />
Rural<br />
Total Mileage (KM<br />
All-Weather Roads (KM)<br />
87
KILIMANJARO REGIONAL ROAD NETWORK<br />
88
In general, <strong>Kilimanjaro</strong> region has more tarmac roads than any<br />
other region in the country although their quality is poor due to<br />
lack of frequent maintenance. The problem with many roads in<br />
<strong>Kilimanjaro</strong> region is poor drainage system caused by lack of<br />
culverts.<br />
3.3 Railways:<br />
The Dar es Salaam Tanga railway line was built in the 1920's and<br />
later extended to Arusha via Moshi. This railway line is both for<br />
goods and passenger trains and serves several stations in<br />
<strong>Kilimanjaro</strong> region. There is also another railway line from Moshi<br />
to Voi. This line was very important during East Africa<br />
Community as it was the only one that linked <strong>Tanzania</strong> with both<br />
Kenya and Uganda, (the three countries that constituted the<br />
"Community". The Moshi/Tanga Dar es Salaam route is mainly<br />
used to transport bulky cargo such as timber, coffee, maize, beans<br />
and phosphate products. However, passenger train between<br />
Moshi and Dar es Salaam faces a cut-throat competition with<br />
road transport which has of late proved to be very efficient in time<br />
saving and reliability.<br />
3.4 Air Transport:<br />
<strong>Kilimanjaro</strong> region is served by the <strong>Kilimanjaro</strong> International<br />
Airport (KIA) and Moshi Airport. the KIA was built mainly to<br />
cater for international flights with a view to easy tourist<br />
accessibility to the Northern Tourist Circuit. It also caters for<br />
domestic flights to various destinations in the country. The Moshi<br />
89
Airport situated a few kilometers from Moshi Municipality mainly<br />
caters for non-commercial and charter air planes.<br />
3.5 Electricity:<br />
Electricity is most needed as an energy for development in a<br />
modern society and where it is lacking it becomes hard to engage<br />
in serious industrial development. The region's electricity is<br />
supplied by both Hydro and Thermal energy. Hydroelectricity is<br />
drawn from the National Grid (Kidatu/Hale Grid system supplying<br />
13.0 MW), Nyumba ya Mungu Station supplying 7.4 MW and<br />
Kikuletwa Station supplying 1.16 MW. Thermo electricity is<br />
mainly supplied by private institutions for their institutional needs.<br />
The largest Therm plants are stationed at Kome Hospital<br />
producing 92.0 KW, Kibo Match Factory producing 160.0<br />
KW., KCMC Hospital producing 92.0 KW and Sikh Saw Mills<br />
producing 84.0 KW. All the five districts and one Municipality<br />
are well served with hydro-electric power, with total number of<br />
15,826 consumers. The largest part of electricity is consumed by<br />
medium and light industries distributed all over the region.<br />
Out of 402 registered villages in the region, 116 villages, or<br />
29.9% of all villages in the region are supplied with electricity.<br />
Thus <strong>Kilimanjaro</strong> region commands a higher percentage of<br />
electricity distribution to villages and private households compared<br />
to other regions. The table below shows the number of villages<br />
and households supplied with electricity in the region.<br />
90
TABLE XLI: HOUSEHOLDS WITH ELECTRICITY SUPPLY 1994, KILIMANJARO<br />
REGION<br />
Electricity Supply %<br />
District Supplied Not<br />
Available<br />
%with<br />
electricity<br />
No of<br />
Villages<br />
With<br />
Electricity<br />
Rombo<br />
Mwanga<br />
Same<br />
Moshi (R)<br />
Hai<br />
Moshi (U)<br />
686<br />
555<br />
1497<br />
3825<br />
2561<br />
9686<br />
34943<br />
15929<br />
28831<br />
59684<br />
34753<br />
12950<br />
1.9<br />
3.4<br />
4.9<br />
6.0<br />
6.9<br />
42.8<br />
57<br />
58<br />
72<br />
150<br />
65<br />
-<br />
24<br />
22<br />
16<br />
26<br />
26<br />
-<br />
42.1<br />
34<br />
22.2<br />
17.3<br />
40.0<br />
-<br />
Total 18,810 187,095 9.1 402 114 28.9<br />
Source: Regional Commissioners office - <strong>Kilimanjaro</strong><br />
Fig. 12: Number of Village with electricity Supply by District 1994<br />
10000<br />
9000<br />
8000<br />
7000<br />
6000<br />
5000<br />
4000<br />
3000<br />
2000<br />
1000<br />
0<br />
Mwanga Same Rombo Hai Moshi<br />
Rural<br />
3.6 Telecommunication / Telephone<br />
The region is served by a total of 18 telephone exchanges two (2)<br />
of which are automatic and the remaining 16 are manual.<br />
However, due to the undergoing programme of restructing<br />
91
telecomms, manual telephone exchanges in Marangu, Same,<br />
Mwanga, Hai and Mkuu will be replaced by digital automatic<br />
exchanges, and wireless local loop (WILL) will be introduced at<br />
Marangu, Mwanga, Same, Mkuu and Hai.<br />
3.7 Fuel Wood:<br />
Fuel wood is another source of energy in the region although it has<br />
disastrous effects on the environmental eco-system. Like other<br />
parts of the country fuel wood still becomes the only dependable<br />
source of energy for cooking and other domestic energy in both<br />
rural and urban centre in <strong>Kilimanjaro</strong> region. Detailed fuel wood<br />
consumption survey in the region has not been adequately carried<br />
out. However, casual observation indicates that the consumption<br />
is 2.0 m 3 per capita per annum. This figure is within the national<br />
average of fuelwood consumption which stands at 2 m 3 per capita<br />
per annum. In the highlands where temperatures are generally<br />
low, substantial amounts of fuelwood are used for heating as well<br />
as for brewing local brew (Mbege). In the low lands fuelwood is<br />
used for fish-smoking, brick-burning, charcoal burning and pottery<br />
activities. With the population of about 1.2 million (1988 Census)<br />
fuelwood demand stands at 2.4 million m 3 of round wood.<br />
Fuelwood supply in the region was given as follows in 1988:-<br />
i) Fuelwood from farm residue........................510,000m 3<br />
ii) Fuelwood from Savanna Woodlands...........110,000m 3<br />
Total Supply..................................................620,000m 3<br />
Given a huge amount of wood requirement for fuel, if deliberate<br />
effort is not taken either to provide alternative energy sources or<br />
92
embarking on extensive afforestation programs, the over felling of<br />
trees may soon or later lead to environmental degradation.<br />
SECTION IV<br />
4.0 SOCIAL SERVICES:<br />
4.1 EDUCATION SECTOR:<br />
4.1.1 Introduction:<br />
<strong>Kilimanjaro</strong> Region has a bigger number of both primary and<br />
secondary schools than other regions in the country. At<br />
independence (1961) the region had only 35 and 7 primary and<br />
secondary schools respectively. By the mid of 1998 the number<br />
of primary schools was 707 an increase of 2,020%.<br />
The increase has been more pronounced in the districts of Same,<br />
Hai, Moshi rural and Rombo districts, see Table XLII.<br />
TABLE: XLII PRIMARY EXPANSION SCHOOLS 1961 - 1998<br />
District<br />
No. of Primary<br />
School 1961<br />
No. of<br />
Primary<br />
School<br />
1985<br />
93<br />
No. of<br />
Primary<br />
School 1995<br />
No. of<br />
Primary<br />
School 1998<br />
Hai 6 133 139 140<br />
Rombo 5 119 123 122<br />
Mwanga 3 85 89 89<br />
Same 6 134 140 141<br />
Moshi<br />
Rural<br />
14 194 195 191
Moshi<br />
Urban<br />
1 20 25 24<br />
Total 35 685 711 707<br />
Source: : <strong>Kilimanjaro</strong> Region Education Office, 1998<br />
TABLE: XLIII(a) DISTRIBUTION OF PRIMARY SCHOOLS AND PUPILS BY<br />
DISTRICT KILIMANJARO REGION 1998<br />
District No. of Pupils No. of Schools No. of Villages<br />
Rombo 50,991 122 57<br />
Moshi Rural 74,836 191 150<br />
Hai 41,568 140 65<br />
Moshi Urban 19,062 24 -<br />
Same 40,964 141 72<br />
Mwanga 26,130 89 58<br />
Total 253,551 707 402<br />
Source: Regional Education Office, <strong>Kilimanjaro</strong>, 1998<br />
The five rural district councils and one municipality have a total of<br />
707 primary schools. Thus a good number of villages among 402<br />
villages have on average 2 primary schools each. In effect, each<br />
village in Rombo, Hai and Same rural districts has two primary<br />
schools.<br />
Table XLIII(a) shows that Moshi rural has more primary school is<br />
the region and Moshi Urban the least. However there are more<br />
people in Moshi Urban district per school, 4,027/school (Table<br />
XLIII(b)) Mwanga which is the second least in the number of<br />
94
schools has the best proportion of 472 people per primary school<br />
in the district, on the average the region has 1562 people/school.<br />
95
TABLE XLIII(b):<br />
DISTRIBUTION OF PRIMARY SCHOOLS BY DISTRICT<br />
KILIMANJARO REGION, 1998<br />
District Population 1988 Number of Schools Population per<br />
School<br />
Rombo 200,889 122 1,647<br />
Mwanga 42,004 89 472<br />
Same 169,733 141 1,204<br />
Moshi Rural 342,896 191 1,795<br />
Hai 196,901 140 1,406<br />
Moshi Urban 96,645 24 4,027<br />
Total 1,104,068 707 1,562<br />
Source: Regional Education Office, Kilimnjaro<br />
<strong>Kilimanjaro</strong> region’s population/school ratio ranks best among several<br />
regions as illustrated here below in 1995. It is best served with number of<br />
primary schools.<br />
Table Region<br />
Population<br />
School Ratio<br />
Kagera Arusha Mwanz<br />
a<br />
Shinyanga<br />
Tang<br />
a<br />
Kilimanja<br />
ro<br />
2,396 2,992 2,740 2,401 2,329 1,575<br />
4.1.2 Enrolment:<br />
At independence the enrolment rate in the region was as low as<br />
54%. With the implementation of the nation policy of Universal<br />
Primary Education the enrolment rate rose to 103.5% in 1988 and<br />
then fell to 96.13 in 1998. The enrolment rates for the years<br />
1961, 1988, 1995 and 1998 are indicated by Tables XLIV-<br />
XLVI below.<br />
96
TABLE XLIV:<br />
EXPANSION OF PRIMARY SCHOOLS AND ENROLMENT<br />
KILIMANJARO REGION 1967, 1988, 1995 AND 1998<br />
1967 1988 1995 1998<br />
No. of Primary Schools 35 696 701 707<br />
Enrolment Rate 54% 103.5% 91.6% 96.13<br />
Number of Pupils 9,450 224,159 243,049 253,551<br />
Source:<br />
Regional Education Office, <strong>Kilimanjaro</strong>.<br />
TABLE: XLV:<br />
District<br />
Moshi<br />
(U)<br />
Moshi<br />
(R)<br />
KILIMANJARO REGION BY DISTRICT PRIMARY SCHOOL<br />
ENROLMENT RATE AND TARGETS (1988)<br />
No. of Primary<br />
School<br />
Pupils STD. I-<br />
VII<br />
Enrolment<br />
target<br />
% of Enrolment<br />
target to No. Of<br />
Children<br />
20 12,780 13,401 95.4<br />
194 73,734 73,734 100.0<br />
Hai 139 46,610 38,200 122.0<br />
Rombo 123 34,100 35,133 97.1<br />
Mwanga 86 21,713 20,913 103.8<br />
Same 134 35,222 35,219 100.0<br />
Total 696 224,159 216,600 103.5<br />
Source:<br />
Regional Education Officer, <strong>Kilimanjaro</strong>.<br />
Student enrolment reached its peak in 1988, when the region<br />
registered an average enrolment rate of 103.5 Table XLV above<br />
indicates that Moshi Rural, Hai, Mwanga and Same districts in<br />
1988 managed to achieve the targets of 100% enrolment rate.<br />
98
TABLE: XLVI:<br />
STD. I ENROLMENT RATE BY SEX AND DISTRICT,<br />
KILIMANJARO REGION, 1998<br />
District Boys Girls Total % Enrolled<br />
Moshi Rural 6,057 5,921 11,978 108.49<br />
Hai 3,545 3,485 7,030 81.0<br />
Rombo 4,126 4,183 8,309 115.0<br />
Mwanga 2,118 1,983 4,101 75.0<br />
Moshi Urban 1,372 1,407 2,779 86.12<br />
Same 3,385 3,295 6,680 97.0<br />
Total 20,603 20,274 40,877 96.13<br />
Source: Regional Education Office <strong>Kilimanjaro</strong>, 1998<br />
It is observed in table XLVI above that Rombo and , Moshi<br />
Urban Districts tended to enroll more girls in STD.I in 1998 than<br />
Hai, Same, Mwanga and Moshi Rural Districts. Nobody is sure<br />
yet why this was so, but it could have been caused by either<br />
having more girls of school going age in 1998. It is also observed<br />
in the same table that the enrolment rate was good in 1998 in all<br />
districts except in Mwanga, where it was only 75 percent against<br />
115.0 percent recorded in Rombo or 108.5 percent registered in<br />
Moshi Rural district.<br />
99
TABLE XLVII:<br />
ENROLMENT (THOUSANDS) BY SEX IN PUBLIC PRIMARY<br />
SCHOOLS IN KILIMANJARO REGION 1987 - 1991<br />
Sex Year Class Total<br />
I II III IV V VI VII<br />
1987 19 16 15 16 13 14 12 105<br />
1988 18 18 16 16 14 12 12 106<br />
Boys 1989 19 17 16 15 14 14 11 106<br />
1990 19 18 18 17 14 14 11 111<br />
1991 21 18 18 18 15 13 12 116<br />
1987 19 16 16 16 13 13 13 106<br />
1988 18 18 17 16 14 14 13 107<br />
Girls 1989 18 18 17 16 14 14 13 110<br />
1990 18 18 17 17 14 14 14 112<br />
1991 20 18 17 17 15 14 14 115<br />
1987 38 32 31 32 26 27 25 211<br />
1988 36 36 31 31 29 25 25 213<br />
Total 1989 37 35 33 31 28 28 24 216<br />
1990 37 36 35 34 28 28 25 223<br />
1991 41 36 35 35 30 28 26 231<br />
Source: Education and Training Statistics, 1991.<br />
TABLE: XLVIII: ENROLMENT IN PUBLIC PRIMARY SCHOOLS IN<br />
KILIMANJARO REGION BY DISTRICT, SEX AND CLASS<br />
1991<br />
District Sex Class Total<br />
Rombo<br />
Mwanga<br />
Same<br />
Moshi (R)<br />
Hai<br />
Boys<br />
Girls<br />
Total<br />
Boys<br />
Girls<br />
Total<br />
Boys<br />
Girls<br />
Total<br />
Boys<br />
Girls<br />
Total<br />
Boys<br />
Girls<br />
Total<br />
I II III IV V VI VII<br />
6057 6157 5629 5076 5173 4390 4538<br />
5921 6044 5811 5407 5308 4627 4698<br />
11978 12201 1144 1048 1048 9017 9236<br />
0 3 1<br />
3545<br />
3485<br />
7030<br />
4126<br />
4183<br />
8309<br />
2118<br />
1983<br />
4101<br />
3178<br />
3069<br />
6247<br />
3394<br />
3273<br />
6667<br />
3870<br />
3914<br />
7784<br />
2111<br />
2022<br />
4133<br />
3520<br />
3402<br />
6922<br />
3288<br />
3195<br />
6483<br />
3556<br />
3717<br />
7273<br />
1983<br />
1918<br />
3901<br />
3192<br />
3023<br />
6215<br />
3074<br />
2894<br />
5968<br />
3181<br />
3362<br />
6543<br />
1984<br />
2017<br />
4001<br />
3141<br />
2943<br />
6084<br />
2916<br />
2745<br />
5661<br />
3013<br />
3165<br />
6178<br />
1810<br />
1805<br />
3615<br />
2676<br />
2592<br />
5268<br />
2216<br />
2416<br />
4677<br />
2747<br />
3002<br />
5749<br />
1534<br />
1586<br />
3120<br />
2484<br />
2463<br />
4947<br />
2493<br />
2589<br />
5082<br />
4044<br />
5111<br />
9155<br />
1661<br />
1648<br />
3309<br />
2644<br />
2637<br />
5281<br />
37020<br />
37816<br />
74836<br />
20926<br />
20642<br />
41568<br />
24537<br />
26454<br />
50991<br />
13201<br />
12979<br />
26180<br />
2835<br />
20129<br />
40964<br />
100
Moshi (U)<br />
Total<br />
Boys<br />
Girls<br />
Total<br />
Boys<br />
Girls<br />
Total<br />
1372<br />
1403<br />
2775<br />
20396<br />
20044<br />
40440<br />
1520<br />
1475<br />
2995<br />
20572<br />
20130<br />
40702<br />
1533<br />
1550<br />
3083<br />
1918<br />
1<br />
1921<br />
4<br />
3839<br />
5<br />
1361<br />
1431<br />
2792<br />
1781<br />
7<br />
1805<br />
4<br />
3587<br />
1<br />
1328<br />
1337<br />
2665<br />
1691<br />
6<br />
1695<br />
2<br />
3386<br />
8<br />
1144<br />
1270<br />
2414<br />
14515<br />
15409<br />
29924<br />
1160<br />
1178<br />
2338<br />
16540<br />
17861<br />
34401<br />
9418<br />
9644<br />
19062<br />
125937<br />
127664<br />
253601<br />
Source:<br />
Regional Commissioner's Office - <strong>Kilimanjaro</strong>.<br />
In most primary schools in almost all regions, the number of girls<br />
per class tend to decrease as they proceed to class VII. In most<br />
cases too, one finds that the decrease in the number of girls in<br />
schools begins in class V, but in <strong>Kilimanjaro</strong> this is not the case as<br />
evidenced by table XLVIII. It is observed that the number of<br />
boys enrolled exceeded the number of girls only in lower classes<br />
of I, II, III and IV. The trend changed from Class IV, where the<br />
number of boys dropped from 16,916 in Class V to 14,515 in<br />
Class VI, while the number of girls dropped from 16,952 in class<br />
V to only 15,409 in class VI. It has been a common phenomenon<br />
to find a large number of girls dropping out from higher classes of<br />
V, VI, and VII in many regions due to either pregnancy or forced<br />
into marriage by relatives or simply for truancy reasons.<br />
Surprisingly enough, these reasons seem not to apply very much in<br />
<strong>Kilimanjaro</strong> region as explained above. In this regard, some<br />
people may wish to find out why girls in primary schools in<br />
<strong>Kilimanjaro</strong> are more serious with schooling than those in other<br />
regions. However, the most striking thing about the enrolment in<br />
primary schools is that the number of girls has tended to exceed<br />
the number of boys in 1987, 1988 and in 1990, suggesting more<br />
stability in girls in school attendance than boys.<br />
101
Fig. 13: Total Enrolment in Public Primary Schools in <strong>Kilimanjaro</strong> Region<br />
1987/91<br />
80000<br />
70000<br />
60000<br />
50000<br />
40000<br />
30000<br />
20000<br />
10000<br />
0<br />
Rombo Mwanga Same Moshi<br />
(R)<br />
Hai<br />
Moshi<br />
(U)<br />
TABLE XX:<br />
PUPILS SELECTED FOR FORM I BY SEX AND DISTRICT,<br />
KILIMANJARO REGION, 1997<br />
District Number. of Candidates Number of Selected<br />
Boys Girls Total Boys Girls Total %<br />
S<br />
e<br />
l<br />
e<br />
c<br />
t<br />
e<br />
d<br />
Moshi Rural 4206 4496 8702 420 424 844 9.7<br />
Hai 2248 2478 4726 240 277 517 10.9<br />
Rombo 3704 3057 7661 301 295 596 7.8<br />
Mwanga 1565 1564 3129 334 323 657 20.9<br />
102
Same 2287 2294 4584 518 512 1030 22.5<br />
Moshi<br />
U<br />
r<br />
b<br />
a<br />
n<br />
1100 1143 2243 25 236 486 21.7<br />
Total 1511 15935 31045 2063 2067 4130 13.3<br />
Source: Regional Education Office, <strong>Kilimanjaro</strong><br />
103
Fig. 14: Pupils Selected For Form I by Sex and District, <strong>Kilimanjaro</strong> Region,<br />
1994<br />
250<br />
200<br />
150<br />
100<br />
50<br />
0<br />
Moshi<br />
Rural<br />
Hai Rombo Mwanga Same Moshi<br />
Urban<br />
Boys Girls<br />
The number of girls selected to join public secondary schools in<br />
the region in 1997 exceeded the number of boys by 4, this again<br />
reflects stability and seriousness with which education for girls is<br />
taken in the region.<br />
104
TABLE: L:<br />
NUMBER OF PUPILS WHO PASSED STANDARD VII EXAMS<br />
AND SELECTED FOR FORM I IN KILIMANJARO REGION<br />
1991/97<br />
Year Number of Candidate Number Selected Percent<br />
selecte<br />
d<br />
Boys Girls Total Boys Girls Total<br />
1991 12062 12842 24904 669 558 1227 4.9<br />
1992 12470 12995 25465 674 571 1245 4.9<br />
1993 13046 13995 27041 756 662 1418 5.22<br />
1994 13237 14155 27392 850 91 1751 6.4<br />
1995 13293 14407 27700 1536 1562 3098 11.1<br />
1996 13558 14593 28151 1729 1742 3471 12.3<br />
1997 15110 15935 31045 2063 2067 4130 13.3<br />
Source: <strong>Kilimanjaro</strong> Regional Education Office, 1998<br />
Fig. 15:<br />
Number of pupils who passed STD VII exams and selected for<br />
Form I in <strong>Kilimanjaro</strong> Region 1991/97<br />
105
2500<br />
2000<br />
1500<br />
1000<br />
500<br />
0<br />
1991 1992 1993 1994 1995 1996 1997<br />
Boys<br />
Girls<br />
106
4.1.3 Drop-outs:<br />
Drop-outs in primary schools are mainly caused by truancy,<br />
death, pregnancy or other causes not clearly defined. The most<br />
common reason sending many pupils out of school is truancy. For<br />
instance in 1997 (Table LI:) 96.2 percent of the drop-outs from<br />
schools was due to truancy, 2.5 percent by death and only 0.7<br />
percent due to pregnancy.<br />
TABLE LI: DROP-OUTS IN 1997, KILIMANJARO REGION<br />
Reasons<br />
STD. I - VII<br />
Boys Girls Total %<br />
1. Truancy 2,234 1,867 4,101 96.2<br />
2. Pregnancy - 33 33 0.7<br />
3. Death 66 39 105 2.5<br />
4. Other 14 12 26 0.6<br />
Total 2,314 1,951 4,265 100<br />
Source:<br />
Regional Education Office, <strong>Kilimanjaro</strong><br />
107
Fig. 16: Reason for Drop-Outs in 1997 by Sex , <strong>Kilimanjaro</strong> Region<br />
2500<br />
2000<br />
1500<br />
1000<br />
500<br />
0<br />
Truancy Pregnancy Death Other<br />
Boys<br />
Girls<br />
Table: LII<br />
It is observed in table LII below that boys have tended to dropout<br />
more from school in all districts except in Moshi Urban where<br />
bigger percentage of the drop-out is girls. Nonetheless, people of<br />
<strong>Kilimanjaro</strong> normally give high priorities to both education and<br />
income generating activities, it is not known if this could explain<br />
early drop-out of boys from school as having been motivated by<br />
the desire to engage in income generating activities.<br />
DROP - OUTS FROM SCHOOL BY SEX AND DISTRICT,<br />
KILIMANJARO REGION , 1991 - 1998<br />
District 1992 1993 1994 1995<br />
Boys<br />
Girls Total Boys Girl<br />
s<br />
Total Boys Girl<br />
s<br />
Total Boys Girl<br />
s<br />
Total<br />
Moshi (R) 393 319 712 407 388 795 536 452 988 974 860 1834<br />
Same 129 91 220 88 62 150 139 102 241 438 376 814<br />
Rombo 171 117 288 103 77 180 164 159 323 439 261 700<br />
Moshi (U) 36 91 197 74 90 164 60 74 134 20 22 42<br />
Mwanga 133 26 62 N.A N.A N.A 39 38 77 N.A N.A N.A<br />
Hai 133 423 556 374 271 645 498 388 886 663 443 1106<br />
108
Cont’d.<br />
District 1998<br />
Boys Girs Total<br />
Moshi (R) 910 712 1622<br />
Same n.a n.a n.a<br />
Rombo 226 197 423<br />
Moshi (U) 86 77 163<br />
Mwanga 90 87 177<br />
Hai 359 315 674<br />
Source: RDD's Office <strong>Kilimanjaro</strong> (R.E.O.) 1994<br />
Fig. 17: Causes of Drop - outs in percentage 1997<br />
100<br />
90<br />
80<br />
70<br />
60<br />
50<br />
40<br />
30<br />
20<br />
10<br />
0<br />
Truancy Pregnancy Death Other<br />
109
TABLE: LIII: DROP-OUTS FROM PRIMARY SCHOOLS IN TEN<br />
SELECTED REGIONS TANZANIA MAINLAND 1992<br />
Region<br />
CLASS<br />
I II III IV V VI VII Total<br />
K'njaro 139 209 306 410 315 390 316 2085<br />
Arusha 329 412 518 1038 471 524 740 4032<br />
D'Salaa 287 424 447 499 384 471 233 2745<br />
Kagera 256 482 673 1181 1035 1003 1119 5749<br />
Mara 144 150 149 247 1241 1440 874 4245<br />
Mbeya 278 220 366 528 443 420 546 2801<br />
Mwanza 345 440 583 768 612 610 793 4151<br />
Pwani 152 244 310 461 525 354 105 2151<br />
Sources: Planning Commission: Compiled data based on BEST 1992<br />
However compared with other regions, <strong>Kilimanjaro</strong> has relatively<br />
fewer drop out; in 1992 the region had only 2,085 drop outs<br />
while Arusha had 4,032, Kagera 5,749 and Mwanza reported<br />
4,151 drop outs.<br />
4.1.4 Primary School Facilities:<br />
Problems of primary school education in the country are almost<br />
similar, they may just differ in intensity and degree. Like other<br />
regions in the country, <strong>Kilimanjaro</strong> is experiencing shortage of<br />
class-rooms, teacher’s houses, desks, teaching materials as well<br />
as qualified teachers.<br />
110
Table LIV below shows higher levels of pupils per classroom in all<br />
districts. The national standard ratio of pupils per classroom is<br />
45:1. In effect, this means that more classrooms are needed in all<br />
districts to avoid congestion and provide a conducive learning<br />
environment for the pupils.<br />
TABLE LIV:<br />
CLASS -ROOM PUPIL POPULATION RATIO BY DISTRICT,<br />
KILIMANJARO REGION 1998<br />
District No of Pupils No of Classrooms Pupil per Classroom<br />
Rombo<br />
Moshi Rural<br />
Same<br />
Hai<br />
Moshi urban<br />
Mwanga<br />
50991<br />
74836<br />
40964<br />
41568<br />
19062<br />
26130<br />
733<br />
1418<br />
Total 253551 4628 55<br />
839<br />
806<br />
286<br />
546<br />
70<br />
53<br />
49<br />
52<br />
67<br />
48<br />
Source: <strong>Kilimanjaro</strong> Regional Education Office, Moshi, 1998<br />
TABLE LV:<br />
SITUATION OF BUILDINGS OF PRIMARY SCHOOLS BY<br />
DISTRICT, KILIMANJARO REGION, 1997<br />
Moshi Urban<br />
Buildings Required Actual Shortage %<br />
Classrooms<br />
Staff Houses<br />
409<br />
637<br />
286<br />
22<br />
Moshi Rural<br />
Buildings Required Actual Shortage %<br />
Classrooms<br />
Staff Houses<br />
1,649<br />
1925<br />
1,418<br />
137<br />
123<br />
615<br />
231<br />
1788<br />
30<br />
97<br />
14<br />
93<br />
111
Rombo<br />
Buildings Required Actual Shortage %<br />
Classrooms<br />
Staff Houses<br />
981<br />
1,337<br />
733<br />
130<br />
248<br />
1,207<br />
34<br />
90<br />
Same<br />
Buildings Required Actual Shortage %<br />
Classrooms<br />
Staff Houses<br />
1,063<br />
1,361<br />
839<br />
126<br />
224<br />
1,235<br />
21<br />
91<br />
Hai<br />
Buildings Required Actual Shortage %<br />
Classrooms<br />
Staff Houses<br />
1,139<br />
1,471<br />
806<br />
141<br />
333<br />
1,330<br />
29<br />
90<br />
Mwanga<br />
Buildings Required Actual Shortage %<br />
Classrooms<br />
Staff Houses<br />
623<br />
652<br />
546<br />
39<br />
77<br />
613<br />
12<br />
94<br />
Source: Regional Education Office, <strong>Kilimanjaro</strong>.<br />
Fig. 18a: Situation of Classrooms by District, 1997<br />
112
1800<br />
1600<br />
1400<br />
1200<br />
1000<br />
800<br />
600<br />
400<br />
200<br />
0<br />
Moshi<br />
Urban<br />
Moshi<br />
Rural<br />
Rombo Same Hai Mwanga<br />
Required<br />
Actual<br />
113
Fig. 18b: Situation of Staff houses by District, 1997<br />
2000<br />
1800<br />
1600<br />
1400<br />
1200<br />
1000<br />
800<br />
600<br />
400<br />
200<br />
0<br />
Moshi<br />
Urban<br />
Moshi<br />
Rural<br />
Rombo<br />
Same<br />
Hai<br />
Mwanga<br />
Required<br />
Actual<br />
TABLE LVI: SITUATION OF SCHOOL'S FUNITURE BY DISTRICT 1997<br />
Moshi Urban<br />
Furnitures Required Actual Shortage %<br />
Desks<br />
5,428<br />
6,190<br />
+762<br />
-<br />
Tables<br />
1,030<br />
369<br />
661<br />
64<br />
Chairs<br />
1,054<br />
443<br />
611<br />
58<br />
Cupboards<br />
548<br />
151<br />
397<br />
72<br />
Moshi Rural<br />
114
115<br />
Furnitures Required Actual<br />
S<br />
h<br />
o<br />
r<br />
t<br />
a<br />
g<br />
e<br />
%<br />
Desks<br />
Tables<br />
Chairs<br />
Cupboards<br />
31,697<br />
4,106<br />
4,106<br />
1,514<br />
27,331<br />
2,137<br />
2,347<br />
1,128<br />
4,366<br />
1,969<br />
1,759<br />
386<br />
14<br />
48<br />
43<br />
25<br />
Rombo<br />
Furnitures Required Actual<br />
S<br />
h<br />
o<br />
r<br />
t<br />
a<br />
g<br />
e<br />
%<br />
Desks<br />
Tables<br />
Chairs<br />
Cupboards<br />
21,288<br />
2,346<br />
2,432<br />
1,942<br />
18,906<br />
1,283<br />
1,563<br />
1,210<br />
2,382<br />
1,063<br />
869<br />
732<br />
11<br />
45<br />
36<br />
38<br />
Same
116<br />
Furnitures Required Actual<br />
S<br />
h<br />
o<br />
r<br />
t<br />
a<br />
g<br />
e<br />
%<br />
Desks<br />
Tables<br />
Chairs<br />
Cupboards<br />
17,011<br />
2,478<br />
2,615<br />
1,504<br />
17,313<br />
876<br />
891<br />
301<br />
+302<br />
1,602<br />
1,724<br />
1,203<br />
-<br />
65<br />
66<br />
80<br />
Hai<br />
Furnitures Required Actual<br />
S<br />
h<br />
o<br />
r<br />
t<br />
a<br />
g<br />
e<br />
%<br />
Desks<br />
Tables<br />
Chairs<br />
Cupboards<br />
20,784<br />
2,422<br />
2,619<br />
1,842<br />
13,475<br />
1,286<br />
1,284<br />
729<br />
7,309<br />
1,136<br />
1,335<br />
1,113<br />
35<br />
47<br />
51<br />
60<br />
Mwanga
Furnitures Required Actual<br />
S<br />
h<br />
o<br />
r<br />
t<br />
a<br />
g<br />
e<br />
%<br />
Desks<br />
13,065<br />
9,745<br />
3,320<br />
25<br />
Tables<br />
1,533<br />
950<br />
583<br />
38<br />
Chairs<br />
1,533<br />
1,303<br />
230<br />
15<br />
Cupboards<br />
1,078<br />
770<br />
308<br />
29<br />
Source: Regional Education Office, <strong>Kilimanjaro</strong>.<br />
The region faces shortage of desks in four rural districts. The<br />
situation is worse in Hai district where the actual requirement of<br />
desks fall short by 35%. Rombo district is better off in this<br />
regard, since the shortage is only 11%.<br />
Fig. 21: Situation of Desks by District, 1994<br />
117
35000<br />
30000<br />
25000<br />
20000<br />
15000<br />
10000<br />
5000<br />
0<br />
Moshi<br />
Urban<br />
Moshi Rural<br />
Rombo<br />
Same<br />
Hai<br />
Mwanga<br />
Required<br />
Actual<br />
TABLE: LVII<br />
TEACHERS STAFF DISPOSITION BY GRADE, SEX AND<br />
DISTRICT , KILIMANJARO REGION, 1997<br />
No. of School Teachers (Primary)<br />
District GRADE A GRADE B TO TAL<br />
M F T M F T M F T<br />
Rombo 279 309 588 270 479 749 549 788 133<br />
7<br />
Moshi (R) 460 662 112<br />
2<br />
423 109<br />
5<br />
151<br />
8<br />
883 175<br />
7<br />
Same 360 243 603 340 418 758 700 661 136<br />
1<br />
Hai 255 458 713 210 553 763 465 101<br />
1<br />
Mwanga 211 219 430 156 272 428 361 491 858<br />
Moshi<br />
Urban<br />
264<br />
0<br />
147<br />
6<br />
55 286 341 21 275 296 76 561 637<br />
118
Total 162<br />
0<br />
217<br />
7<br />
379<br />
7<br />
142<br />
0<br />
309<br />
2<br />
451<br />
2<br />
304<br />
0<br />
526<br />
9<br />
830<br />
9<br />
Source: Regional Education Office, <strong>Kilimanjaro</strong><br />
Fig. 22: Total Staff Teachers Disposition By Sex and District <strong>Kilimanjaro</strong> Region,<br />
1997<br />
Moshi Urban<br />
Mwanga<br />
Hai<br />
Same<br />
Moshi (R)<br />
Female<br />
Male<br />
Rombo<br />
0 200 400 600 800 1000 1200 1400 1600 1800<br />
The Region in 1997 had a total number of 8309 Teachers. Out of<br />
this number, 5269 were females and only 3040 male teachers.<br />
Moshi rural had the highest proportion of teachers in the region,<br />
and had the best pupils per teacher ratio of 28 while Rombo was<br />
worse of at a ratio of 38 pupils/teacher Table LVII(b) Regionwise<br />
the ratio stands at 30. Comparison is made in this respect to<br />
some selected regions in <strong>Tanzania</strong> Mainland. <strong>Kilimanjaro</strong> had the<br />
best students per teacher ratio in 1995 (Table LVII(c)).<br />
119
TABLE LVII (a)<br />
District<br />
TEACHERS STAFF DISPOSITION BY SEX<br />
AND DISTRICT KILIMANJARO, 1997<br />
Number of Primary School Teachers<br />
Males Females Total<br />
Rombo 549 788 1337<br />
Moshi Rural 883 1757 2640<br />
Same 700 661 1361<br />
Hai 465 1011 1476<br />
Mwanga 361 491 858<br />
Moshi<br />
Urban<br />
76 561 637<br />
Total 3040 5269 8309<br />
Source:<br />
TABLE LVIII (b)<br />
Compilled data by Planning Commission<br />
STATUS OF PUPILS PER TEACHER RATIO BY DISTRICT<br />
KILIMANJARO REGION 1997<br />
District Number Pupils per<br />
Teacher<br />
Pupils<br />
Teachers<br />
Rombo 50991 1337 38<br />
Moshi Rural 74836 2640 28<br />
Hai 41568 1476 28<br />
Moshi Urban 19062 637 30<br />
Same 40964 1361 30<br />
Mwanga 26130 858 30<br />
Total 253351 8309 30<br />
Source: Compiled data provided by Regional Education Office, Moshi 1997<br />
TABLE LVII(c): STATUS OF PUPILS PER TEACHERSM RATIO FOR<br />
SELECTED REGIONS, TANZANIA 1995.<br />
Kagera Arusha Mwanza Shinyanga Tanga Mbeya <strong>Kilimanjaro</strong><br />
120
Students/<br />
Teacher Ratio<br />
33 41 45 56 36 32 30<br />
Source: Compilled data by Planning Commission<br />
4.1.5 Nursery Schools:<br />
The existence of many nursery schools is yet another feature<br />
distinguishing the region’s education system from many other<br />
regions. By the end of 1997 the region had a total of 410 nursery<br />
schools out of which 65 were public nursery schools and the<br />
remaining 345 privately owned. Table LVIII below shows<br />
distribution of Nursery schools in the region.<br />
TABLE: LVIII<br />
1997<br />
NURSERY SCHOOLS IN KILIMAJARO DISTRICTWISE, IN<br />
District No. of Schools No. of Pupils<br />
Public Private Total Boys Girls Total<br />
Moshi (R) 7 109 116 3552 3506 7058<br />
Hai 4 92 96 82 100 182<br />
Rombo - 105 105 5136 4996 10132<br />
Mwanga 24 15 39 95 88 183<br />
Same 24 18 42 578 663 1241<br />
Moshi<br />
(<br />
U<br />
)<br />
6 6 12 415 449 864<br />
Total 65 345 410 9858 9802 19660<br />
Source: <strong>Kilimanjaro</strong> Regional Education Office, Moshi, 1994<br />
Nursery Schools are major sources of recruiting class I pupils in<br />
the region. Poor registration of class I pupils noted in Mwanga<br />
121
district in 1997 may be attributed partly to the existence of<br />
relatively few nursery schools compared to other districts.<br />
4.1.6 Secondary Schools:<br />
At independence (1961) the region had only 7 secondary schools.<br />
By the end of 1994, she had the highest number of private<br />
secondary schools in the whole country and was among the three<br />
leading regions with the highest number of Public Secondary<br />
Schools. The region had 62 private secondary schools while<br />
Kagera and Iringa had 23 and 32 respectively. Public secondary<br />
schools in <strong>Kilimanjaro</strong> were 15 while in Kagera and Iringa they<br />
were 9 and 10 respectively. The regions with the lowest number<br />
of Public Secondary Schools were Singida, Kigoma and Mbeya.<br />
Those with the lowest number of private secondary schools were<br />
Coast, Lindi, Kigoma and Mtwara. Odd as it may sound,<br />
Mtwara by the end of 1992 had no private secondary school.<br />
Table LIX below indicates the place <strong>Kilimanjaro</strong> region occupies<br />
in terms of both the number of public and private secondary<br />
schools in <strong>Tanzania</strong> Mainland while table LX indicates distribution<br />
of secondary schools by district in the region.<br />
TABLE LIX<br />
Region<br />
SITUATION OF SECONDARY SCHOOLS IN KILIMANARO<br />
REGION COMPARED TO OTHER REGIONS IN TANZANIA, 1994.<br />
No of Public No of Private Total Rank<br />
Secondary Schools Secondary School<br />
122
1. <strong>Kilimanjaro</strong><br />
2. Arusha<br />
3. Iringa<br />
4. Mbeya<br />
5. Kagera<br />
6. Mwanza<br />
7. Tanga<br />
8. Dar es salaam<br />
9. Dodoma<br />
10. Kigoma<br />
11. Lindi<br />
12. Mara<br />
13. Morogoro<br />
14. Mtwara<br />
15. Pwani<br />
16. Rukwa<br />
17. Ruvuma<br />
18. Shinyanga<br />
19. Singida<br />
20. Tabora<br />
Source: Ministry of Education, 1994<br />
TABLE LX:<br />
15<br />
13<br />
10<br />
7<br />
9<br />
14<br />
10<br />
8<br />
13<br />
4<br />
12<br />
8<br />
12<br />
9<br />
8<br />
11<br />
10<br />
10<br />
5<br />
10<br />
DISTRIBUTION OF SECONDARY SCHOOLS BY DISTRICT,<br />
KILIMANJARO REGION, 1961- 1997<br />
District 1961 1985 1995 1997<br />
Public Public Private Total Public Private Total Public Private Total<br />
Hai 1 2 7 9 3 11 14 5 11 16<br />
Moshi (R) 3 - 26 26 1 32 33 10 24 34<br />
Moshi (U) 3 2 3 5 3 4 7 3 6 9<br />
Mwanga - - 3 3 2 15 17 7 13 20<br />
Rombo - 3 3 6 4 6 10 6 8 14<br />
Same - 1 6 7 2 8 10 12 7 19<br />
Total 7 8 48 56 15 76 91 43 69 112<br />
62<br />
23<br />
32<br />
17<br />
23<br />
20<br />
12<br />
15<br />
9<br />
3<br />
3<br />
10<br />
8<br />
3<br />
3<br />
9<br />
11<br />
10<br />
9<br />
9<br />
7<br />
36<br />
42<br />
24<br />
32<br />
34<br />
22<br />
23<br />
22<br />
7<br />
15<br />
18<br />
20<br />
12<br />
11<br />
20<br />
21<br />
20<br />
14<br />
19<br />
1<br />
3<br />
2<br />
6<br />
5<br />
4<br />
8<br />
7<br />
8<br />
17<br />
13<br />
12<br />
10<br />
15<br />
16<br />
10<br />
9<br />
10<br />
14<br />
11<br />
Source: <strong>Kilimanjaro</strong> Regional Education Office, Moshi 1997<br />
It is observed from table LX that about 48% of secondary<br />
schools in the region are located in two districts of Moshi Rural<br />
and Mwanga.<br />
123
TABLE LXI:<br />
ENROLMENT IN PUBLIC AND PRIVATE SECONDARY<br />
SCHOOLS BY SEX KILIMANJARO REGION, 1987 - 1992<br />
Year Public Schools Private Schools Total<br />
1987<br />
1988<br />
1989<br />
1990<br />
1991<br />
1992<br />
Boys Girls Total Boys Girls Total Boys Girls<br />
2946<br />
3077<br />
3287<br />
3882<br />
4068<br />
3713<br />
1856<br />
2030<br />
2171<br />
1878<br />
2777<br />
2992<br />
4802<br />
5107<br />
5458<br />
5760<br />
6845<br />
6705<br />
7473<br />
9094<br />
9309<br />
9495<br />
9032<br />
1005<br />
7584<br />
9829<br />
1039<br />
1069<br />
1058<br />
1142<br />
15057<br />
18923<br />
19702<br />
20185<br />
19613<br />
21483<br />
10419<br />
12171<br />
12596<br />
13377<br />
13100<br />
13767<br />
9440<br />
1185<br />
1256<br />
1256<br />
1335<br />
1442<br />
Source: <strong>Kilimanjaro</strong> Regional Statistical Abstract, 1993<br />
124
Fig. 22a: Total Enrolment in Secondary School by Sex 1987/92<br />
16000<br />
14000<br />
12000<br />
10000<br />
8000<br />
6000<br />
4000<br />
2000<br />
0<br />
Boys<br />
Girls<br />
1987 1988 1989 1990 1991 1992<br />
Fig. 22b: Total Enrolment in Public and Private Secondary Schools 1987/92<br />
7000<br />
6000<br />
5000<br />
Public<br />
Private<br />
4000<br />
3000<br />
2000<br />
1000<br />
0<br />
Note:-<br />
(i)<br />
(ii)<br />
1987 1988 1989 1990 1991 1992<br />
That enrolment rate of girls into public secondary schools in the<br />
region between 1987 and 1992 was lower compared to that of boys.<br />
This can be attributed to low pass rate of girls in the Standard VII<br />
examinations.<br />
Private Secondary school enrolled more or less equal numbers of<br />
both sex between the same period. The number of girls enrolled in<br />
private secondary schools in 1992 exceeded the number of boys by<br />
654.<br />
125
The region’s enrolment sex ratio in secondary schools favour of<br />
male students in 1987 to 1990 though it has been decliming<br />
gradually table LXI(a) by 1992 the ratio was reversed to favour<br />
girls to a sex ratio of 95. It is not known for sure the reason<br />
behind this trend.<br />
TABLE LXI(a): ENVOLMENT AND SEX RATIO IN SECONDARY SCHOOLS<br />
KILIMANJARO REGION, 1987, 1990 AND 1992<br />
Enroment<br />
year<br />
1987 1990 1992<br />
Enrolment Boys 10,419 13,337 13,767<br />
Enrolement Girls 9,440 12,568 14,421<br />
Total Enrolment 19,859 25,945 28,188<br />
Enrolment Sex ratio 110 106 95<br />
Source: Data from <strong>Kilimanjaro</strong> Regional Statistical Abstract, 1993<br />
4.1.7 Vocational Training Centres:<br />
The region also has 17 Vocational Training centres and 4 teachers<br />
training Colleges distributed as indicated below:-<br />
Vocational Training Schools (1997):<br />
District No. of Schools<br />
Moshi (Urban) 2<br />
Hai 3<br />
Rombo 3<br />
Same 3<br />
Moshi (Rural) 4<br />
Mwanga 2<br />
126
Total 17<br />
Teachers Training Colleges (1997)<br />
District<br />
No. of Colleges<br />
Moshi (Rural) 3<br />
Mwanga 1<br />
4.1.8 Literacy:<br />
Literacy level (simply defined as ability to read and write Kiswahili)<br />
is higher in <strong>Kilimanjaro</strong> region than all other regions in the<br />
country. Literacy rate in the region increased steadly over the<br />
years as indicate below.<br />
1960's 60%<br />
1970's 82%<br />
1980's 90%<br />
1994 95%<br />
It is observed in table LXII that the number of illiterate women in<br />
the region in 1995 exceeded the number of men by 11712.<br />
Rombo and Hai districts with illiteracy rate of 10% and 7%<br />
respectively seem to have lagged behind in the race of educating<br />
the adults in the region.<br />
127
TABLE LXII: ILLITERATE ADULT POPULATION BY SEX AND<br />
DISTRICTRICT KILIMANJARO REGION, (1994)<br />
District Total No. of Adults Illiterates<br />
Male Femal Total Male Femal Total %<br />
Hai 81509 86100 167609 4008 6738 10746 6<br />
Moshi<br />
Moshi<br />
(<br />
U<br />
)<br />
(<br />
R<br />
)<br />
30264 29534 59798 406 188 1194 2<br />
89842 104522 194364 1501 2876 4377 2<br />
Mwanga 33033 37615 70648 720 2260 2980 4<br />
Same 39237 45061 84298 456 914 1370 2<br />
Rombo 87933 96609 184542 4927 10154 15,081 8<br />
Region 361818 399441 761259 1201 23730 35748 5<br />
Source:<br />
Regional Education Officer - <strong>Kilimanjaro</strong>.<br />
At National level, the 1988 Census showed that <strong>Kilimanjaro</strong> had<br />
the highest literacy rate of 80.8 percent followed by Dar es<br />
salaam, 80.7 percent, while the lowest literacy rate was recorded<br />
in Shinyanga region (48.3 percent). Table LXIII below shows<br />
the percentage of literacy by region.<br />
Urban areas show a consistently higher literacy rate than rural<br />
areas. This is the national trend (Table XIV).<br />
128
TABLE LXIII:<br />
PERCENT LITERATE FOR POPULATION AGED 10 YEARS<br />
AND ABOVE BY REGION, TANZANIA MAINLAND, 1967,<br />
1978 AND 1988<br />
Region 1967 Census 1978 Census 1988 Census<br />
<strong>Kilimanjaro</strong><br />
Dar es Salaam<br />
Ruvuma<br />
Tanga<br />
Morogoro<br />
Mara<br />
Iringa<br />
Kagera<br />
Mtwara<br />
Dodoma<br />
Mbeya<br />
Rukwa<br />
Lindi<br />
Singida<br />
Mwanza<br />
Coast<br />
Kigoma<br />
Arusha<br />
Tabora<br />
Shinyanga<br />
56<br />
60<br />
41<br />
40<br />
37<br />
35<br />
31<br />
40<br />
28<br />
24<br />
29<br />
-<br />
-<br />
24<br />
25<br />
26<br />
19<br />
26<br />
27<br />
16<br />
74.1<br />
73.3<br />
66.3<br />
60.6<br />
58.6<br />
56.4<br />
54.0<br />
52.9<br />
51.4<br />
49.5<br />
49.2<br />
48.5<br />
48.4<br />
46.7<br />
44,3<br />
44.0<br />
43.7<br />
41.9<br />
40.5<br />
33.2<br />
80.8<br />
80.7<br />
70.5<br />
66.0<br />
62.8<br />
63.9<br />
68.3<br />
59.5<br />
57.1<br />
55.5<br />
61.9<br />
58.6<br />
53.8<br />
57.4<br />
57.3<br />
51.1<br />
55.1<br />
58.1<br />
50.5<br />
48.3<br />
Source: 1988 Population Census (National profile, Table 5.2)<br />
129
TABLE LXIV:<br />
LITERACY RATES BY SEX FOR RURAL AND URBAN<br />
POPULATION 10 YEARS TANZANIA MAINLAND<br />
REGION, 1988 (CENSUS)<br />
Regions Male Female<br />
Rural Urban Total Rural Urban Total<br />
Dodoma 61.5 85.4 64.3 45.1 73.7 48.2<br />
Arusha 61.5 91.8 65.6 46.4 82.8 50.9<br />
<strong>Kilimanjaro</strong> 84.5 90.3 85.5 75.7 83.6 76.9<br />
Tanga 72.8 88.6 75.9 53.2 75.6 57.3<br />
Morogoro 68.8 86.4 72.9 49.5 72.0 54.6<br />
Coast 60.1 72.2 64.0 40.1 51.8 44.9<br />
Dar es salaam 68.4 90.0 87.9 48.0 77.7 74.6<br />
Lindi 62.4 75.9 64.6 42.0 60.2 44.8<br />
Mtwara 65.5 77.9 67.3 46.3 61.6 48.5<br />
Ruvuma 77.7 87.6 78.7 61.4 75.7 63.3<br />
Iringa 80.1 87.4 84.9 57.2 70.4 58.5<br />
Mbeya 69.9 87.5 73.3 48.4 70.0 52.4<br />
Singida 65.0 85.5 66.8 47.2 70.8 49.3<br />
Tabora 50.1 85.2 60.5 36.7 67.8 41.6<br />
Rukwa 69.1 84.3 71.3 43.9 66.4 47.3<br />
Kigoma 65.1 83.1 67.4 43.1 62.7 45.5<br />
Shinyanga 57.9 85.9 59.9 36.2 67.7 39.3<br />
Kagera 68.0 84.4 69.0 49.7 72.4 50.9<br />
Mwanza 63.7 83.7 67.6 43.4 66.9 47.8<br />
130
Mara 73.7 88.0 75.3 53.7 71.5 55.6<br />
Source: 1988 Population census: National profile, table 5.4<br />
High literacy rate of 74.1 percent was also observed in<br />
<strong>Kilimanjaro</strong> region in the 1978 Census results and the lowest rate<br />
was recorded in Shinyanga (33.2 percent). In addition, the 1988<br />
census data (Table LXIV) show that Arusha had the highest urban<br />
male literacy rate of 91.8 percent followed by <strong>Kilimanjaro</strong> with<br />
90.3 percent and Dar es salaam with 90 percent among the urban<br />
population. For the rural population <strong>Kilimanjaro</strong> had the highest<br />
male literacy rate of 84.5 percent followed by Iringa with 80.1<br />
percent and Ruvuma with 77.7 percent for <strong>Tanzania</strong> mainland.<br />
With regard to women literacy, <strong>Kilimanjaro</strong> takes the lead again<br />
with 75.7% and 83.6% in rural and urban population respectively.<br />
The encouraging high literacy rate being observed in the region<br />
could be a result of seriousness attached to education by the<br />
people of <strong>Kilimanjaro</strong>.<br />
4.2 HEALTH SECTOR<br />
4.2.1 Introduction:<br />
In terms of quantity health facilities are fairly well established in the<br />
region with each district having an equitable share. The period<br />
between 1961-1997 witnessed tremendous expansion of health<br />
facilities in the region. During the period dispensaries grew from<br />
18 to 361. Health centers also increased significantly by 950%<br />
from 2 in 1961 to 18 by 1997. And six new hospitals were<br />
constructed and operationalised. Table LXV summarizes growth,<br />
status and distribution of health facilities in the region.<br />
131
132
TABLE LXV<br />
GROWTH STATUS AND DISTRIBUTION OF HEALTH<br />
FACILITIES BY DISTRICT. KILIMANJARO REGION, 1961-<br />
1997.<br />
District Dispensaries Health Centers Hospitals<br />
1961 1985 1997 1961 198 1997 1961 198 1997<br />
Hai 7 24 58 1 2 3 2 2 3<br />
Moshi - 30 69 - 3 2 1 1 4<br />
Moshi 4 35 85 - 4 4 4 4 4<br />
Mwanga 5 40 48 1 2 3 1 1 1<br />
Rombo 1 17 46 - 3 3 - - 2<br />
Same 1 30 55 - 3 3 2 2 2<br />
Total 18 176 361 2 17 18 10 12 16<br />
Source: Regional Medical Office, Moshi, 1997<br />
Despite fair distribution of health services depicted by the table<br />
above the region is faced with varying health problems. Death toll<br />
resulting from common preventable diseases such as malaria,<br />
respiratory infections, water borne and water related diseases<br />
such as typhoid, cholera and dysentery is still rampant. If AIDS<br />
which is now becoming endemic and claiming several deaths is<br />
discounted the top common killer diseases in the region are as<br />
listed in table LXVI below.<br />
133
TABLELXVI:<br />
COMMON DISEASES IN % IN KILIMANJARO REGION,<br />
1997<br />
Disease<br />
Occurrence/Percentage<br />
Malaria 29.01<br />
Upper Respiratory 21.51<br />
Accidnets /Injury 12.13<br />
Intestinal worms 9.42<br />
Pneumonia 6.82<br />
Diarrhoea 6.74<br />
Anaemia 4.82<br />
Skin diseases 4.32<br />
Veneral diseases 2.68<br />
Eye diseases 2.53<br />
Total 100<br />
Source: Regional Medical Office, Annual Health Report 1997.<br />
4.2.2 Organisational Structure<br />
Health delivery system in the region follows central local<br />
government structure.<br />
. Policy is formulated by the Ministry of Health<br />
. The region interprets national policies and supervises<br />
their implementation<br />
134
. In turn, the District Authorizes are responsible for<br />
overseeing health services delivered by dispensaries,<br />
health centers and hospitals in the district.<br />
4.2.3 Referral System<br />
The referral system in the region is comprised of three basic levels.<br />
(i)<br />
(ii)<br />
Dispensaries<br />
A dispensary is the first post in the district referral system.<br />
A dispensary in accordance with national standard is<br />
planned to serve between 5,000 and 10,000 persons. By<br />
the end of 1997, <strong>Kilimanjaro</strong> region had 361 dispensaries,<br />
out of which 131 dispensaries are owned by the<br />
government and 230 privately owned (Voluntary<br />
Agencies, Parastatal and Private).<br />
Health Centers<br />
A Rural Health Center (RHC) is the second level of<br />
referral at district level. A Health Center is supposed to<br />
cater for a population of 50,000 persons. The region by<br />
1997 had 18, Health centers with a total of 393 beds.<br />
Out of the 18 Health Centers, 15 are owned by the<br />
government and 3 are in the private hands.<br />
iii)<br />
Hospitals<br />
135
The regional hospital forms the apex of the regional<br />
referreral system. Whereas a district hospital is top referral<br />
organisation at district level.<br />
<strong>Kilimanjaro</strong> region has 16 hospitals with a total of 1848 beds. 8<br />
out of 16 hospitals are government owned and the remaining 8 are<br />
run by voluntary agencies. Out of 16 hospitals there are two<br />
referral hospitals. Kibong'oto Tuberculosis Referral Hospital in<br />
Hai district and <strong>Kilimanjaro</strong> Christian Medical Center (KCMC)<br />
located in Moshi Municipality.<br />
4.2.4 Adequacy and Accessibility:<br />
(a)<br />
Dispensaries.<br />
TABLE LXVII:<br />
District<br />
DISTRIBUTION OF DISPENSARIES BY DISTRICT AND<br />
OWNERSHIP, KILIMANJARO REGION, 1997.<br />
Governmen<br />
t<br />
Private Total MCH<br />
Cli<br />
nic<br />
s<br />
Population/Dis<br />
p<br />
Hai 22 36 58 42 3930<br />
Moshi (U) 8 61 69 9 2609<br />
Moshi (R) 30 55 85 59 4873<br />
Mwanga 25 23 48 35 3275<br />
Rombo 20 26 46 26 5551<br />
Same 26 29 55 42 3557<br />
Total 131 230 361 213 3962<br />
Source: Health Statistics Abstract 1997 (Govt Disp)<br />
Regional Commissioner's office, <strong>Kilimanjaro</strong> (Priv Disp)<br />
136
Table LXVII above indicates that population dispensary ratios for<br />
all rural districts are within the national target of a dispensary per<br />
5,000 to 10,000 people. The population dispensary ratios for<br />
Moshi Municipality, Hai, Moshi (R), Mwanga and Same districts<br />
are below the minimum target, whereas the population dispensary<br />
for Rombo district is above the minimum national requirement.<br />
Fig. 23: Ratio of Population per Dispensary by District 1997<br />
7000<br />
6000<br />
5000<br />
4000<br />
3000<br />
2000<br />
1000<br />
0<br />
Hai<br />
Moshi (U)<br />
Moshi (R)<br />
Mwanga<br />
Rombo<br />
Same<br />
TABLE LXVIII:<br />
District<br />
ACCESSIBILITY TO DISPENSARY IN KILIMANJARO<br />
REGION 1986 BY DISTRICT<br />
Estimated population within the<br />
Distance of less than 10 km from<br />
the nearest Dispensary<br />
0-5 km 6-10km<br />
Estimated<br />
population by 10<br />
km from the<br />
nearest Dispensary<br />
No % No % No %<br />
Same 150,40 90.2 16,300 9.8 - -<br />
Mwanga 94,500 97.0 1,800 1.9 1,100 1.1<br />
137
Rombo 198,50 99.3 1,300 0.7 - -<br />
Moshi Rural 362,70 99.2 2,900 0.8 - -<br />
Moshi<br />
u<br />
r<br />
b<br />
a<br />
n<br />
84,200 100.0 - - - =<br />
Hai 229,80 97.4 6,200 2.6 - -<br />
Total 1,120,1 97.4 28,500 2.5 1.100 0.1<br />
Source:<br />
Ministry of Lands, Housing and Urban Development 1990 Northern Zone Regional<br />
Physical Plan draft report and Plans.<br />
A survey carried out by a team of experts from the Ministry of<br />
Lands Housing and Urban Development in 1986 indicated that<br />
almost 97% of <strong>Kilimanjaro</strong> region population in 1986 resided<br />
within a reasonable distance of 0-5 km from nearby dispensaries.<br />
Other similar surveys revealed that in some regions like Kigoma,<br />
Singida, Rukwa and Mara about 60% of population still have to<br />
walk between 5-10 km to reach the nearest dispensary.<br />
(b)<br />
Rural Health Centres:<br />
TABLE LXIX DISTRIBUTION OF RURAL HEALTH CENTRES BY<br />
DISTRICT AND OWNERSHIP IN KILIMANJARO REGION,<br />
1997.<br />
District<br />
Govt<br />
Number of RHC POP/RHC Number of beds<br />
Private<br />
Total Govt Private Total<br />
138
Hai 3 - 3 75,974 49 - 49<br />
Moshi R 2 2 4 103,558 98 - 98<br />
Moshi U 2 2 2 90,007 - - 0<br />
Mwanga 3 - 3 52,405 40 - 40<br />
Rombo 3 - 3 85,114 93 - 93<br />
Same 2 1 3 65,203 64 45 109<br />
Total 17 1 18 79,463 344 49 389<br />
Source: Health Statistics Abstract, Ministry of Health, 1997 P. 96<br />
139
Fig. 24: The Ratio of Population per Rural health centre by District 1997<br />
Thousands<br />
120<br />
100<br />
80<br />
60<br />
40<br />
20<br />
0<br />
Hai<br />
Moshi (U)<br />
Moshi (R)<br />
Mwanga<br />
Rombo<br />
Same<br />
It is observed from the above table that the Regional<br />
Population/RHC ratio of 79,463 is above the national target of<br />
50,000 people per Rural health centre. Moshi Rural and Urban<br />
districts have the highest ratios 103,558:1 and 90,007:1 per RHC<br />
respectively.<br />
On average a Rural Health Centre in the region owned by the<br />
government supervises 14 dispensaries instead of recommended<br />
national target of 5 dispensaries per rural health centre.<br />
140
TABLE LXX: ACCESSIBILITY TO RURAL HEALTH CENTRE BY<br />
DISTRICT KILIMANJARO REGION, 1986<br />
District<br />
Estimated population within a Distance<br />
of 20km from the nearest<br />
health centre<br />
Estimated population<br />
by 20 km<br />
from the<br />
nearest<br />
Health centre<br />
0-10km. 11-20Km. 20Km+<br />
No % No % No %<br />
Same 106,90<br />
0<br />
64.1 38.500 23.1 21,300 12.8<br />
Mwanga 75,000 77.0 16,600 17.0 5,800 6.0<br />
Rombo 199,80<br />
0<br />
Moshi Rural 351.10<br />
0<br />
100.0 - - - -<br />
96.0 14,500 4.0 - -<br />
Moshi<br />
Urban<br />
- - - - - -<br />
Hai 190.80<br />
0<br />
Total 923,60<br />
0<br />
80.8 38,000 16.1 7,200 3.1<br />
89.3 107,600 10.4 34,300 3.0<br />
Source: Ministry of Lands, Housing and Urban Development 1990: Northern zone Regional<br />
Physical Plan draft Report and Plans.<br />
It is observed in table LXX above that 89.3% of the population<br />
live within a distance of 0-10 Km from the nearest RHC. This<br />
implies that in terms of distance dispensaries are more accessible<br />
than RHCs in the region.<br />
141
(c)<br />
Hospital Services:<br />
TABLE LXXI:<br />
1997 :<br />
District<br />
HOSPITALS AND DOCTORS IN KILIMANJARO REGION<br />
No. of Hospitals<br />
Number<br />
of Beds<br />
Populat<br />
ion per<br />
Hospita<br />
l<br />
% Pop/<br />
Doctor<br />
Public Private Total<br />
Same 1 1 2 148 97,804 8 24451<br />
Mwanga 1 0 1 100 157,215 5 31443<br />
Rombo 0 2 2 200 127,671 6 42557<br />
Moshi R 0 4 4 367 103,558 4 10355<br />
8<br />
Moshi U 2 3 4 587 45,004 18 10001<br />
Hai 2 1 3 498 75,974 4 56980<br />
Total 5 11 16 1900 89,396 45 31785<br />
Source: Health Statistics Abstract, Ministry of Health, 1997 p. 92<br />
Fig. 25a: The Ratio of Population per Hospital by District 1997<br />
Thousands<br />
160<br />
140<br />
Ratio of Population<br />
120<br />
100<br />
80<br />
60<br />
40<br />
20<br />
0<br />
Same<br />
Mwanga<br />
Rombo<br />
Moshi R<br />
Moshi U<br />
Hai<br />
Districts<br />
Notes:<br />
142
The regional population per physician 31,785 is slightly above the<br />
national average of 24,930. The population per hospital (89,396)<br />
is below the national target of 100,000 people.<br />
Fig. 25b: Ratio of Population per Doctor by District 1997<br />
Thousands<br />
120<br />
100<br />
Ratio of Population<br />
80<br />
60<br />
40<br />
20<br />
0<br />
Same<br />
Mwanga<br />
Rombo<br />
Moshi (R)<br />
Moshi (U)<br />
Hai<br />
Districts<br />
Notes:<br />
All hospitals in the region are accessible throughout the year,<br />
though distance covered to reach them varies from district to<br />
district.<br />
4.2.5 Health Indicators:<br />
(a)<br />
Life Expectancy At Birth:<br />
Table LXXII indicates that the region has relatively higher<br />
life expectancy at birth compared to other regions. This<br />
143
may be attributed to the regions somewhat advanced<br />
socio-economic development status.<br />
144
TABLE LXXII:<br />
LIFE EXPECTANCY AT BIRTH BY REGIONS AND SEX FOR<br />
THE YEAR: 1978 AND 1988, TANZANIA MAINLAND<br />
Regions 1978 1988<br />
Total Total Male Female<br />
Arusha 50 57 57 58<br />
Coast 47 48 46 51<br />
Dar<br />
es<br />
sal<br />
aa<br />
m<br />
50 50 50 50<br />
Dodoma 45 46 45 47<br />
Iringa 41 45 44 47<br />
Kagera 45 45 44 45<br />
Kigoma 40 48 47 49<br />
Kilimanjar<br />
o<br />
58 59 57 62<br />
Lindi 42 47 46 48<br />
Mara 44 47 46 48<br />
Mbeya 41 47 45 48<br />
Morogoro 44 46 45 48<br />
Mtwara 40 46 45 48<br />
Mwanza 44 48 46 50<br />
Rukwa 40 45 44 48<br />
Ruvuma 43 49 48 51<br />
Shinyanga 42 50 48 51<br />
Singida 44 55 54 55<br />
Tabora 44 53 53 54<br />
Tanga 49 49 48 51<br />
145
MAINLAN<br />
D<br />
44 50 49 51<br />
Source: Health Statistics Abstract 1994<br />
146
(b)<br />
Infant and Child Mortality Rates<br />
<strong>Kilimanjaro</strong> is classified as one of the low infant and child<br />
mortality regions. It is being observed from Table LXXIII (a)<br />
below that there has been a decline of both mortality rates,<br />
between the two census, 1978 and 1988. The rate of mortality<br />
decline for IMR and U5MR were 1.3 and 1.4 percent<br />
respectively. Consequently, the region's IMR and U5MR went<br />
down to 67 and 104 respectively. At national level IMR and<br />
U5MR also declined in the same period from 137 and 231<br />
recorded in 1978 to 115 and 192 estimated in 1988 respectively<br />
(Population Census, 1988).<br />
TABLE LXXIII (a):IMR AND U5MR TREND IN KILIMANJARO REGION 1978-1994<br />
Year Infant Mortality Child Mortality<br />
1978 76 119<br />
1988 67 104<br />
1994 60 92<br />
1995 59 90<br />
Source: Health Statistics Abstract 1994<br />
Despite the impressive low IMR and U5MR achieved by the<br />
region it is worth noting that the rates are still very high compared<br />
to those prevailing in the developed industrialized countries. Thus<br />
for the region to reach 50 for IMR and 70 for U5MR by the year<br />
2000, the current IMR and U5MR decline rates need to increase<br />
to 2.0 and 2.3 for IMR and U5MR respectively.<br />
147
(c)<br />
Maternal Mortality:<br />
Maternal Mortality defined as the death of a women while<br />
pregnant or within 42 days of the termination of pregnancy is one<br />
of the major health problems facing all regions in the Country. At<br />
independance maternal mortarity was estimated at 453 per<br />
100,000 births. In 1992 Maternal Mortality stood at 199 per<br />
100,000 births.<br />
The maternal mortality in <strong>Kilimanjaro</strong> Region was estimated to be<br />
46 per 100,000 births. in 1993 while in 1996 it was 72 per<br />
100,000 The main causes of maternal death in the region are<br />
direct Raptured uterus, Postpartum haemorrhage (PPH),<br />
septicaemia, malaria, anaemia, HIV, eclampsia, local herbs and<br />
cardriac complications.<br />
(d)<br />
Mal-nutrition:<br />
According to Regional MCH Report (1988) the incidence of<br />
malnutrition in <strong>Kilimanjaro</strong> region was estimated to be 26.3% of<br />
which 5.9 were severely malnouri-shed.<br />
148
TABLE LXXIII (b): MATERNAL MORTALITY RATE IN TANZANIA<br />
MAINLAND BY REGIONS FOR 1992 TO 1995<br />
Region 1992 1993 1994 1995 Ranking<br />
Mtwara 264 212 161 252 10<br />
Lindi 262 289 193 264 14<br />
Ruvuma 225 189 186 177 8<br />
Morogoro 289 172 190 153 6<br />
Coast 209 111 70 187 5<br />
Dar es Salaam 220 398 237 328 19<br />
Iringa 311 321 276 281 18<br />
Arusha 102 158 114 159 4<br />
Shinyanga 143 188 199 184 9<br />
Singida 242 171 238 207 13<br />
Dodoma 197 214 208 266 16<br />
Kagera 304 343 190 242 12<br />
Kigoma 144 155 105 87 2<br />
<strong>Kilimanjaro</strong> 126 46 107 63 1<br />
Mara 67 59 106 124 3<br />
Mbeya 67 361 436 264 20<br />
Mwanza 221 186 266 207 15<br />
Rukwa 172 294 243 267 17<br />
Tabora 151 185 130 216 7<br />
Tanga 255 172 220 195 11<br />
Total 199 211 197 208 -<br />
Source: Health Statistics Abstract, 1997<br />
149
One to reduce MMR is to ensure that all women of child bearing<br />
age immunised against Tetanus.<br />
150
TABLE LXXIV: VACCINATION COVERAGE 1997, KILIMANJARO REGION<br />
Vaccine Number Vaccinated % Coverage<br />
1978 1993 1997 1978 1993 1997<br />
BCG 44,533 37,192 46,96 88 90.93 89.1<br />
DPT 40,986 35,520 44,588 72.4 77.88 76.1<br />
POLIO 35,545 42,477 44,993 - 86.68 96.3<br />
Measles 40.252 33,907 44,143 79.7 82.9 71.7<br />
TT 25,292 32,899 25,640 - 16.37 60.0<br />
Source: 1. Regional MCH Report, 1988, Moshi,<br />
2. Health Statistic Abstract, 1994, primary health report <strong>Kilimanjaro</strong> region,<br />
1997<br />
Notes:<br />
(i)<br />
(ii)<br />
The number of children under and over one year<br />
vaccinated in 1993 decreased compare to those<br />
vaccinated in 1978. This may reflect the declining of<br />
population growth rate in the region observed above.<br />
Percentage coverage was higher 1997 than it was in<br />
1978 and 1993.<br />
(e)<br />
AIDS:<br />
HIV/AIDS disease is currently one of the leading causes of deaths<br />
in many regions in the country. According to NACP, Surveillance<br />
Report (1994) produced by the Ministry of Health shows that<br />
HIV is spreading very fast in the region. In 1985, the reported<br />
aids cases were only 8, whereas in 1993 the number of cases<br />
increased to 2,279.<br />
151
TABLE LXXVa: CUMMULATIVE AIDS CASES IN<br />
KILIMANJARO REGION<br />
Year<br />
Cases<br />
1985 8<br />
1987 207<br />
1989 570<br />
1991 1,523<br />
1993 2,279<br />
Source: Health Statistics Abstract 1994.<br />
Fig. 26: Cummulative AIDS Cases in <strong>Kilimanjaro</strong> Region, 1985-1993<br />
2500<br />
AIDS Cases<br />
2000<br />
1500<br />
1000<br />
500<br />
0<br />
1985 1987 1989 1991 1993<br />
Years<br />
The rate of aids per 100,000 population in the region was<br />
estimated at 147.5 and 185.1 in the years 1992 and 1993<br />
respectively. With these rates the region was ranked in 6th and<br />
5th positions in 1992 and 1993 respectively. Thus <strong>Kilimanjaro</strong> is<br />
one of the severely affected region by HIV/AIDS in the country.<br />
As observed in Table LXXV (b) the rate of infection was 3.8 by<br />
the year 1997.<br />
152
TABLE LXXV (b): HIV/AIDS INFECTION BY DISTRICT, 1997<br />
District No. of blood donor HIV +ve Percentage (%)<br />
Moshi (U) 2037 108 5.3<br />
Moshi (R) 302 10 3.3<br />
Rombo 1770 10 0.6<br />
Hai 337 19 5.6<br />
Same 1219 70 5.7<br />
Mwanga 338 13 3.8<br />
Total 6003 230 3.8<br />
Source: Regional Medical Office,: Annual health report, 1997<br />
Currently, districts mostly affected are Same, Hai and the<br />
municipal. This bears the concern of the township being stop overs<br />
for the highway traffic.<br />
4.3 WATER SECTOR<br />
4.3.1 Introduction<br />
<strong>Kilimanjaro</strong> is one of the regions in the country which is fairly<br />
endowed with plenty of surface and ground water sources (Table<br />
LXXVI). About 90% of all water schemes in the region obtain<br />
their waters from surface sources mainly from rivers, springs and<br />
surface dams and almost all water intakes in the region originate<br />
from major streams around mount <strong>Kilimanjaro</strong> and Pare<br />
mountains. Rombo , Moshi rural and Hai districts get their water<br />
153
TABLE LXXVI:<br />
from these sources. Some parts of Same and Mwanga districts<br />
obtain their water supply from the Pare mountains.<br />
The region has several dams which are in use in different districts.<br />
The larger ones being Nyumba ya Mungu, Kalimawe, Ndungu<br />
and Jipe. Water from these dams is used for domestic purposes,<br />
fishing, industries, irrigation, and generation of electricity. About<br />
10% of all water supply in the region is obtained from ground<br />
water sources, that is, from Bore-holes and shallow-wells mainly<br />
in the lower areas of Same and Mwanga districts.<br />
POPUATION WITH ACCESS TO CLEAN WATER IN FIVE<br />
SELECTED REGIONS 1994/95 (COMPARISON)<br />
Region Population (‘000) Urban Population (‘000) Rural Population (‘000)<br />
Total Numbe<br />
r served<br />
%<br />
Served<br />
Total Numbe<br />
r<br />
Served<br />
%<br />
Ser<br />
ved<br />
Total Numbe<br />
r<br />
Served<br />
%<br />
Served<br />
K'njaro<br />
Mbeya<br />
Kagera<br />
M'goro<br />
Tanga<br />
1308.3<br />
1708.0<br />
1554.8<br />
1572.0<br />
1425.2<br />
676.187<br />
848.098<br />
441.636<br />
754.000<br />
909.932<br />
51.7<br />
49.7<br />
28.4<br />
48.0<br />
63.9<br />
145.366<br />
244.2<br />
154.8<br />
240.2<br />
226.3<br />
80.125<br />
164,200<br />
49,636<br />
155,00<br />
194,091<br />
55.<br />
0<br />
67.<br />
3<br />
32.<br />
1<br />
64.<br />
5<br />
85.<br />
8<br />
1234.5<br />
1453.7<br />
1400.0<br />
1331.7<br />
1198.8<br />
696,890<br />
683,654<br />
392,000<br />
600,000<br />
715,831<br />
56.0<br />
46.7<br />
28.0<br />
45.1<br />
59.7<br />
Source: Ministry of Water Energy and Minerals<br />
4.3.2 Rural Water Supply<br />
The region is among few regions in <strong>Tanzania</strong> whereby a large<br />
proportion of the rural population relatively get their water supply<br />
with ease, both physically and financially,because of the simplicity<br />
which exist in tapping clean water from streams or springs and<br />
conveying the same by gravity and other pumping energy.<br />
154
There is a total of 111 water sources which exist in the region (96<br />
surface water sources and 74 ground water sources). Table<br />
LXXVII highlights distribution of water schemes in the region.<br />
TABLE LXXVII:<br />
WATER SUPPLY SOURCES/SCHEMES<br />
IN KILIMANJARO REGION.<br />
District Number of Schemes Water Sources Pumping Energy<br />
Moshi(U)<br />
Moshi(R)<br />
Rombo<br />
Mwanga<br />
Hai<br />
Same<br />
Piped<br />
4<br />
29<br />
16<br />
21<br />
16<br />
25<br />
Shallow<br />
Wells<br />
-<br />
1<br />
-<br />
56<br />
-<br />
2<br />
Surfa<br />
ce<br />
2<br />
29<br />
14<br />
18<br />
13<br />
20<br />
Ground<br />
Water<br />
Grav<br />
ity<br />
Diesel<br />
Elect<br />
ric<br />
Hand<br />
Pumps<br />
Total 111 59 96 15 2 7 5 61 1<br />
Source: Ministry of Water Energy and Minerals/Region Water Engineer, <strong>Kilimanjaro</strong>, Moshi<br />
4.3.3 Coverage of Rural Water Supply:<br />
1<br />
2<br />
2<br />
3<br />
2<br />
5<br />
<strong>Kilimanjaro</strong> Region has a total of 402 villages out of which 249<br />
are served with clean water from water schemes. The remaining<br />
153 villages get their water supply by traditional methods, that is<br />
either from rivers, natural springs, ponds and water reservoirs or<br />
dams. The average population with access to clean water is<br />
estimated at 45% Table LXXVIII.<br />
1<br />
-<br />
-<br />
-<br />
1<br />
-<br />
-<br />
-<br />
2<br />
-<br />
1<br />
4<br />
2<br />
-<br />
-<br />
2<br />
2<br />
1<br />
-<br />
3<br />
-<br />
6<br />
-<br />
2<br />
Solar<br />
-<br />
-<br />
-<br />
1<br />
-<br />
-<br />
TABLE XLIX:<br />
POPULATION SERVED WITH CLEAN WATER BY DISTRICT.<br />
District Population 1988 Population 1997<br />
Total<br />
No<br />
Served<br />
Total<br />
No<br />
Served<br />
%<br />
Served<br />
155
Moshi Urban<br />
Moshi Rural<br />
Rombo<br />
Mwanga<br />
Hai<br />
Same<br />
96,838<br />
342,553<br />
200,859<br />
98,260<br />
197,449<br />
170,053<br />
Total 1,099,79<br />
7<br />
52,000<br />
188,405<br />
121,000<br />
63,817<br />
70,000<br />
69,700<br />
53.7<br />
55<br />
60<br />
69<br />
35<br />
41<br />
115,386<br />
409,430<br />
235,847<br />
202,652<br />
239,899<br />
115,827<br />
564,922 51.4 1,319,04<br />
1<br />
41,540<br />
237,469<br />
96,690<br />
77,010<br />
93,561<br />
50,964<br />
36<br />
58<br />
41.0<br />
38<br />
39<br />
44<br />
597,234 45<br />
Source: Regional Water Engineer, Moshi, 1997<br />
Moshi Rural district has the highest percentage of its population<br />
getting clean water, 58% of the population served, followed by<br />
Same 44%, Rombo 41%. Hai, Mwanga and Moshi Urban<br />
districts have the least percentages with only 39, 38 and 36<br />
respectively.<br />
4.3.4 Water Schemes Management<br />
Management of water schemes in each district in the region is<br />
under the district councils, the villagers themselves through Village<br />
Water committees (VWC) and Board of water users and<br />
companies. To facilitate water management most of the villages<br />
have established Village Water Funds. The district engineer is a<br />
technical member both to the district councils and village water<br />
committees. For water schemes that serve more than one village,<br />
a ward water committee exist instead. By 1997 more than 70% of<br />
the villages had established village water committee (VWC) and<br />
more than a third of them had established village water funds<br />
(VWF), table LXXiX indicates.<br />
TABLE LXXiX:<br />
ESTABLISHED VILLAGE WATER COMMUNITTEES AND<br />
VILLAGE WATER FUNDS 1997.<br />
156
District<br />
Number of<br />
villages<br />
Villages<br />
with<br />
VWC<br />
%with<br />
VWC<br />
Villages<br />
with<br />
VWF<br />
%with<br />
VWF<br />
Moshi<br />
U<br />
rb<br />
a<br />
n<br />
Moshi Rural<br />
Rombo<br />
Mwanga<br />
Hai<br />
Same<br />
-<br />
150<br />
57<br />
58<br />
65<br />
72<br />
-<br />
57<br />
58<br />
54<br />
46<br />
72<br />
-<br />
38<br />
100<br />
84<br />
75<br />
100<br />
-<br />
45<br />
58<br />
29<br />
12<br />
18<br />
-<br />
30<br />
100<br />
45<br />
20<br />
25<br />
Total 402 287 71 162 40<br />
Source: Ministry of Watrer Energy and Minerals<br />
Response to cost sharing is yet to be described as satisfactory.<br />
Despite the concept being accepted in principle by most people,<br />
they are still unwilling to contribute voluntarily when they are<br />
required to do so. However, it has been observed that in the<br />
needy areas particulary in the lower zone where water is always<br />
scarce participation and contribution made by people is higher<br />
compared to the highlands where water is abundant.<br />
4.3.5 Rural Water Supply Scheme Inventory<br />
Base-line data survey on water supply schemes in <strong>Tanzania</strong> done<br />
in may 1993 and a recent revisit of schemes done in 1995 by the<br />
Ministry of Water Energy and Minerals indicates that there were<br />
1,853 functioning water points and 111 water supply schemes in<br />
<strong>Kilimanjaro</strong> region. The region has a total of 2197 water supply<br />
points/schemes. About 344 water points and water scheme were<br />
157
TABLE LXXX:<br />
not functioning. Tables LXXX and LXXXI below give summary<br />
of water points/schemes situation in the region in 1995.<br />
A RURA L WATER SUPPLY SCHEMES INVENTORY BY<br />
DISTRICT 1995<br />
Districts/type Moshi Urban Moshi Rural Rombo Mwanga Hai Same<br />
Status T NF % NF T NF %<br />
NF<br />
T NF %<br />
NF<br />
T NF %<br />
NF<br />
T NF %<br />
NF<br />
T NF %<br />
NF<br />
Gravity 2 - 0 29 - 0 14 - 0 8 - 0 13 - 0 20 - 0<br />
Shallow wells and pumps - - - 3 - - - - - 56 7 13 - - - 2 - 0<br />
Pumping 2 - - - - - 2 - - 3 - - 3 3 100 5 2 20<br />
Diesel - - - - - - 2 - 0 1 - 0 2 = 0 4 1 -<br />
Electric 2 - 0 - - - - - - 1 - 0 - - - 1 - -<br />
Solar - - - - - - - - - 1 - 0 - - - - - -<br />
Total (public taps) 7 3 60 883 21 2 616 193 31 79 20 25 493 90 18 121 17 14<br />
Source: Ministry of Water Energy and Minerals/Regional Water Engineer <strong>Kilimanjaro</strong>, Moshi,<br />
1995<br />
TABLE LXXXI: SUMMARY OF RURAL WATER SUPPLY 1995<br />
District<br />
Status<br />
Total<br />
(T)<br />
Funci<br />
tioni<br />
ng (F)<br />
Regional Total<br />
Non-<br />
Functioni<br />
ng (%F)<br />
% Non-<br />
Functioni<br />
ng<br />
% NF<br />
Gravity 96 96 - 100 -<br />
Shallow wells and<br />
Pumps<br />
61 54 7 89 11<br />
Pumping 15 14 1 93 7<br />
Diesel 8 7 1 88 12<br />
Electric 6 6 - 100 -<br />
Solar 1 1 - 100 -<br />
Total (public taps) 2197 1853 344 84 16<br />
Source: Regional water Engineer <strong>Kilimanjaro</strong>, Moshi, 1995<br />
4.3.6 Problems Facing Rural Water Supply:<br />
158
There are a number of problems facing rural water supply in the<br />
region. The major ones are:-<br />
i) Inadequate supply level of schemes<br />
Many water schemes are operating under capacity or<br />
yield inadequate water due to changes in the hydrological<br />
cycle brought by human activities mainly deforestation<br />
and cultivation of water sources. These activities cause<br />
inadequate rainfall and drought and thus disturbing ground<br />
water recharge processes.<br />
ii)<br />
iii)<br />
iv)<br />
Poor maintenance<br />
Quite a number of water schemes in the region were<br />
constructed over 30 years thus due to old age and poor<br />
maintenance, their carrying capacity are greatly reduced.<br />
Most affected schemes in this case are water pipes, bore<br />
holes and pumps which were drilled and installed in the<br />
1960s and 1970s.<br />
Contamination<br />
Pollution associated with surface water is another major<br />
water problem in the region as the water mainly from<br />
streams and rivers need expensive treatment to make it<br />
safe for human consumption. But as surface water source<br />
get reduced due to deforestation it is expected that after<br />
sometime the problem will be minimized as ground water<br />
shall be a big source of water than is the case now.<br />
Lack of Manpower and Equipments<br />
159
The region has shortage of working equipments and<br />
qualified manpower particularly Engineers, Thus hindering<br />
progress of project implementation. More Engineers and<br />
replacement of tools and equipments is required.<br />
v) Communication<br />
It is difficult to reach some schemes due to transport<br />
problems.<br />
vi)<br />
Inflation<br />
Price increases of construction materials, renders planning<br />
as well as implementation of schemes difficult.<br />
160
vii)<br />
Cost Sharing:<br />
Most people are still ignorant of cost sharing this fact<br />
makes it difficult to involve them in project implementation.<br />
Nevertheless, sensitization seminars are conducted aimed<br />
at relaying the cost sharing message. Those in the urban<br />
area are required to meet the cost of running and<br />
maintenance.<br />
Viii)<br />
Water rights<br />
In the region there exists a problem of water right. The<br />
conflict is between domestic and irrigation water demands.<br />
Much water is being abstracted from rivers by traditional<br />
irrigation furrows without considering other water users<br />
such as for domestic and electricity generation.<br />
4.3.7 Technology:<br />
Gravity schemes are dominant in the region because of the<br />
topography of the area. A few existing pumping schemes are used<br />
mainly in lower areas. Hand pump equiped shallow wells are<br />
used in areas where water table is high. Solar energy is a recent<br />
technology and there are very few schemes of this type in the<br />
region. Table LXXXI(c) shows various types of water supply<br />
technology in common use in the region.<br />
161
TABLE LIII: TECHNOLOGICAL MIX ADOPTED IN KILIMANJARO<br />
REGION, 1995<br />
Type of<br />
Technology<br />
No.<br />
%<br />
Remark.<br />
Gravity 96 56 In- expensive Manageable and Sustainable<br />
Hand Pumps 61 36 Manageable Sustainable and Inexpensive<br />
Diesel 7 5 Relatively expensive<br />
Electric 3 3 Expensive<br />
Solar 1 0 Easily manageable and Sustainable<br />
Total 168 100 -<br />
Source:<br />
Ministry of Water, Energy and<br />
Minerals/Regional water engineer- <strong>Kilimanjaro</strong>.<br />
4.3.8 Future Strategy:<br />
The region continues to survey and design new water projects<br />
under the regional vote for survey and investigations. Design on<br />
these schemes are spearheaded normally by Disrict Engineer.<br />
Nevertheless it is now becoming difficult for both the region and<br />
district councils to finance water schemes because of costs<br />
involved, as such, efforts are being made to design small<br />
project/water schemes covering one or several villages whose<br />
costs the community could afford through cost sharing. Since<br />
most schemes are old and worn out, rehabilitation/Extension of the<br />
schemes should be done when funds are available.<br />
4.3.9 Urban Water Supply:<br />
162
Water supply in urban Moshi and Same are well developed<br />
compared to other towns while in towns like Hai, Rombo, Moshi<br />
rural and Mwanga obtain water from supply schemes which serve<br />
both rural and urban communities. Table LXXXII shows the<br />
position of water requirement and supply for the district urban<br />
centres in the region.<br />
TABLE LXXXII:<br />
TOWN<br />
Moshi(<br />
U)<br />
URBAN WATER DEMAND AND SUPPLY KILIMANJARO<br />
REGION, 1992 .<br />
Populatio<br />
n<br />
Demand<br />
M3/Day<br />
Supply<br />
M3/Day<br />
%<br />
Supply<br />
115,386 28,000 7,002 25<br />
Hai 6,200 837 153 18<br />
Rombo 4,700 635 320 50<br />
Mwang<br />
a<br />
7,750 1,046 363 35<br />
Same 11,330 1,530 846 55<br />
Source: Regional Water Engineer- <strong>Kilimanjaro</strong>, Moshi<br />
4.3.10 Urban Water Supply Coverage:<br />
The level of service (coverage) for all the towns including Moshi<br />
Municipality is inadequate due to insufficiant water discharges<br />
from water sources. Water situations in terms of coverage in<br />
urban centres in the region and demand of water sectorwise are<br />
shown in tables LXXXII, LXXXIII(a) and LXXXIII(b).<br />
163
TABLE LXXXIII(a):<br />
Urban<br />
Centres<br />
STATUS OF WATER SUPPLY IN DISTRICT TOWNS IN<br />
KILIMANJARO REGION 1997.<br />
Ward Village Estimated<br />
Population<br />
Population.<br />
Served<br />
%<br />
Served<br />
Moshi Urban 16 - 115,386 41,450 36<br />
Hai 11 65 235,847 96,690 41<br />
Rombo 20 57 239,899 93,561 39<br />
Mwanga 16 58 115,827 50,964 44<br />
Same 24 72 202,652 77,010 38<br />
Moshi (R) 27 150 409,430 237,469 58<br />
Total 114 402 1,319,041 597,234<br />
Source: Regional water Engineer - <strong>Kilimanjaro</strong>, 1995<br />
TABLE LXXXIII(b): SECTOR WATER DEMAND FOR URBAN<br />
KILIMANJARO REGION, 1992<br />
Urban Centres Population Sector water Demand<br />
CENTRES,<br />
Domestic Industry<br />
Public<br />
Institution<br />
Commercial Education Hospital Other<br />
Institution<br />
Total<br />
Moshi Urban 145,609 20,586 3,660 1,160 1.2 730 450 400 28,186<br />
Hai 6,200 558 137 42 43 26 17 14 837<br />
Mwanga 4,700 700 172 53 55 30 20 16 1,046<br />
Rombo 7,750 423 12 32 34 20 104 10 635<br />
Same 11,330 1,020 250 76 80 49 30 25 1,530<br />
Source:<br />
<strong>Kilimanjaro</strong> Regional Water Engineer, Moshi.<br />
4.3.11 Sanitation:<br />
Compared to other regions sanitation conditions in <strong>Kilimanjaro</strong><br />
region could be said to be satisfactory. This could be attributed to<br />
the efforts, made by the Ministry of Water and Energy in funding a<br />
low cost sanitation programme in the region. UNICEF also<br />
164
supported sanitation in Hai district as a vital component of Child<br />
Survival and Development Project. In Rombo district GTZ is also<br />
funding Health Programme aiming at improving sanitation in the<br />
area.<br />
TABLE LXXXIV:<br />
DISTRIBUTION OF LATRINES IN THE REGION BY<br />
DISTRICT:<br />
District<br />
Total No. of<br />
H/holds<br />
H/holds with<br />
latrines<br />
H/holds<br />
without<br />
latrines<br />
Coverage<br />
(%)<br />
Hai<br />
Moshi (R)<br />
Rombo<br />
Mwanga<br />
Same<br />
Moshi (U)<br />
35,004<br />
62,677<br />
40,000<br />
79,487<br />
42,251<br />
12,000<br />
29,630<br />
56,310<br />
36,076<br />
59,476<br />
32,018<br />
12,000<br />
237<br />
2,831<br />
1,860<br />
219<br />
1,765<br />
n.a.<br />
84.6<br />
89.8<br />
90.2<br />
74.8<br />
75.8<br />
100.0<br />
Total 209,419 181,510 6,912 86.7<br />
Source:<br />
Regional Health Officer - <strong>Kilimanjaro</strong>.<br />
165
SECTION V<br />
5.0 OTHER DEVELOPMENT ISSUES:<br />
5.1 Gender Development:<br />
5.1.1 Introducation:<br />
The 1988 Census Report indicated that there<br />
were more women in all rural districts in <strong>Kilimanjaro</strong><br />
Region than men. However, the report further observed<br />
that in Moshi Municipality there were fewer women than<br />
men. For the region as a whole there are 103 women for<br />
every 100 men. The Table LXXXV below indicates a<br />
breakdown in the difference of gender distribution<br />
between rural and urban areas according to family size<br />
and number of household in the region.<br />
TABLE LXXXV: GENDER DISTRIBUTION AND FAMILY SIZE DISTRICT IN<br />
THE KILIMANJARO REGION 1988<br />
District<br />
Status<br />
More men<br />
than<br />
Women<br />
More<br />
Women<br />
than Men<br />
Gender %<br />
Increase<br />
Number of<br />
Household<br />
Hai - 5,439 5.7 more 37,318 5.3<br />
women<br />
Moshi (U) - - - 22,643 4.3<br />
Moshi (R) - 22,635 14.1 more 63,540 5.4<br />
women<br />
Rombo - 12,729 135 more 35,648 5.6<br />
women<br />
Mwanga - 4,009 9.1 more<br />
women<br />
16,486 5.6<br />
Avera<br />
ge<br />
166
Same - 5,719 7 more<br />
women<br />
30,337 5.6<br />
Regional - 50,535 205,972 5.4<br />
Source: Population Census of <strong>Tanzania</strong> 1988<br />
5.1.2 Women Time Schedule:<br />
Like in many other regions in the country, there is heavy workload<br />
placed on women in Kilimanjro region. The heavy workload of<br />
women is reportedly intensified by lack of transport facilities.<br />
Women are said to be carrying heavy load of their produce, grass,<br />
firewood and water on their heads “......... save for those who can<br />
afford and tolerate the overcrowded pick-ups and trucks”.....<br />
Table LXXXXVI below shows typical daily work schedule for<br />
the region’s rural women.<br />
TABLE LXXXVI: DAILY TIME-BUDGET OF RURAL WOMEN IN<br />
KILIMANJARO REGION<br />
Activity Time Hours<br />
Waking up, washing, preparing breakfast and feeding<br />
cattle<br />
5.00 a.m 1.0<br />
Eat breakfast then walk to the fields (2-3 km) 6.00-9.45 0.75<br />
Cut and chop bananas stems and leaves cut grass, feed<br />
cattle, clean the cow-she<br />
6.45-9.00 3.45<br />
Collecting firewood and grass for cattle 9.00-10.15 1.55<br />
Return home, pounding, milking, feeding cattle 10.15-11.45 1.35<br />
Fetching water (1 to 2km) from water sources, Lunch 11.45-2.45 3.0<br />
Work on the plot where legumes are planted, back<br />
home, feed cattles<br />
2.45-4.45 2.0<br />
Go and collect grass again for cattle feeding 4.45-5.45 1.0<br />
Back home take some rest, milking and preparaton of<br />
dinner<br />
5.45-9.45 1.0<br />
167
Source:<br />
<strong>Kilimanjaro</strong> Regional Community Development Office 1994, Moshi<br />
5.1.3 Economic Groups:<br />
In response to recommendations by a Team of experts who<br />
undertook an indepth research on the “Situation of Women in<br />
<strong>Kilimanjaro</strong> Region in 1990", the region leadership vigorously<br />
embarked on the mobilization and creation of awareness amongst<br />
the women in the region so as enable them establish economic<br />
ventures. Thus by April, 1994 the region had 716 active women<br />
economic groups with 14,089 members, Table LXXXVII shows<br />
their distribution by district.<br />
TABLE LXXXVII:<br />
District Groups Members<br />
Hai 573 N.A<br />
Moshi (R) 55 5166<br />
Moshi (U) 23 2004<br />
Mwanga 22 1291<br />
Same 30 3907<br />
Rombo 13 1721<br />
Total 716 14,089<br />
WOMENT ECONOMIC GROUPS DISTRIBUTION BY<br />
DISTRICT KILIMANJARO REGION, 1994<br />
Source: Women Affairs Unit - <strong>Kilimanjaro</strong> Moshi, 1994<br />
168
5.1.4 Economic Activities Undertaken:<br />
Women economic groups in each district are engaged in various<br />
and varied economic activities as indicated by Table LXXVIII<br />
(a,b,c,e and f) below. Analysis of 1978 and 1988 Census<br />
Reports indicates that the proportion of women in the<br />
economically active regional population increased significantly<br />
between the year 1978 and 1988. On account of their active<br />
involmvement in income geneating activites, it may be rightly<br />
assumed that women in the rural areas of <strong>Kilimanjaro</strong> region<br />
roughly earn about 30% of their family income. However, a study<br />
is needed to confirm this assumption.<br />
TABLE LXXXVIII:<br />
ACTIVITIES UNDERTAKEN BY WOMEN GROUP BY<br />
DISTRICT KILIMANJARO REGION (A) MOSHI<br />
RURAL DISTRICT<br />
Project/Activity Number of Groups Members<br />
Shops 16 2,569<br />
Grinding Machines 10 432<br />
Transportation 3 300<br />
Sewing 6 211<br />
Hotel/restaurants 3 150<br />
Gardening 8 840<br />
Livestock keeping 1 40<br />
Local Bars 8 624<br />
Total 55 5166<br />
169
(b)<br />
Moshi urban District<br />
Project/Activity Number of Groups Members<br />
Shops 13 2,569<br />
Sewing 3 432<br />
Hotel/Restaturant 2 300<br />
Weaving 1 211<br />
Farming 2 150<br />
Tye and Dye 1 840<br />
Local bars 1 40<br />
Total 23 624<br />
(d)<br />
Hai District<br />
Project/Activity Number of Groups Members<br />
Shops 564 N.A<br />
Grinding Milling N.A 69<br />
Transportation 1 N.A.<br />
Hotel/Restaurants 2 N.A.<br />
Farming 1 25<br />
Milk Collection - -<br />
Local Bars 4 N.A<br />
Bakery 1 N.A.<br />
Total 573 N.A<br />
170
(e)<br />
Rombo District<br />
Project/Activity Number of Groups Members<br />
Shops 8 1,312<br />
Grinding Milling - -<br />
Machines 2 87<br />
Sawmills 1 150<br />
Sewing 2 172<br />
Total 13 1721<br />
(f)<br />
Same District<br />
Project/Activity Number of Groups Members<br />
Shops 5 405<br />
Grinding/Milling 2 306<br />
Sewing 10 323<br />
Farming 2 95<br />
Pottery 2 122<br />
Bakery 1 40<br />
Total 22 1,291<br />
Source: Regional Community Development Office, 1988<br />
5.1.5 Day Care Centres<br />
Since there is heavy workload on women in <strong>Kilimanjaro</strong> region,<br />
the need for child care system is quite big. By the end of 1994 the<br />
region had 325 Day Care Centers (Nurseries) with a total of<br />
171
15,387 under 7 years children. The average number of children<br />
per centre is 47. The Day Care Centres are principally run by<br />
voluntary agencies, parent organisations and churches. Not a<br />
single Day Care Centre is run by the government. In 1989 it was<br />
estimated by the Regional Community Development Office that<br />
only about 6% of the total number of pre-school Children enjoyed<br />
Day Care Centres services in the region. This is a small portion<br />
compared to the estimated, pre-school children, totalling 206,450<br />
in that year.<br />
5.2 Cooperative Societies.<br />
The region has a number of 266 cooperatives, most being<br />
agricultural coops. followed by savings and credit societies as<br />
observed in the table below (LXXXIX).<br />
TABLE LXXXIX: COOPERATIVE SOCIETIES BY TYPE AND DISTRICT,<br />
KILIMANJARO REGION, 1998<br />
Type of Society<br />
District<br />
Hai Rombo Moshi<br />
(R)<br />
Mwanga Same Moshi (U) Total<br />
Agricultural 41 16 40 10 15 - 122<br />
Saving & Credit<br />
(SACCOS)<br />
Consumer<br />
Coops.<br />
10 11 31 6 1 19 78<br />
2 2 2 1 2 16 33<br />
Industrial - 3 - 1 - 4 10<br />
Tranposrt - - - - - + +<br />
Fishinmg - - - - - 1 1<br />
Livestock - 1 1 - - - 2<br />
172
Others 6 1 3 1 1 8 2<br />
Total 69 34 77 19 19 48 266<br />
Source: Regional Commissioner’s Office, <strong>Kilimanjaro</strong><br />
173
5.3 Programmes and Various Activities Supported By NGO’s in<br />
<strong>Kilimanjaro</strong> Region 1995<br />
Name of Organisation<br />
1. Community<br />
Development<br />
Fund (CDTF)<br />
Trust<br />
2. <strong>Kilimanjaro</strong><br />
Environmental<br />
Development<br />
Association (KEDA)<br />
Activities<br />
Provision of funds, material and equipment to<br />
rural development programmes like:<br />
(i)<br />
(ii)<br />
Afforestration<br />
Agricultural Activities<br />
(iii) Water and other Environmental<br />
conservation related issues<br />
(iv)<br />
Provides Aids to organised groups<br />
institution and individuals for specific<br />
projects<br />
Supports and gives Aids to Environmental<br />
Conservation Activities especially Tree-planting<br />
in the region<br />
3. Diocese of Same Tree-planting Activities and water conservation<br />
projects<br />
4. Diocese of Moshi Funds and provides support to Environmental<br />
conservation projects<br />
5. KKKKT Northern<br />
Diocese<br />
6. Roman Catholic<br />
Mission Diocese of<br />
Same<br />
7. Evangelical Lutheran<br />
Church of <strong>Tanzania</strong><br />
Northern Diocese<br />
Supports and Aids in Tree-planting projects on<br />
Community self-help basic<br />
Provide funds for water supply projects in<br />
Ngulu, Mgagao and Pangaro villages in<br />
Mwanga District<br />
Funds for supply of water to about 90,000<br />
people in Shari, Mamba, uswaa, Roo,<br />
Kwasadala, Kambi ya Nyuki and Boma ya<br />
Ng’ombe villages in Hai District<br />
174
8. Dambo Development<br />
Association for<br />
Mbokome<br />
9. MACDA Marangu<br />
Community<br />
Development<br />
Association<br />
10. Red Cross of<br />
<strong>Tanzania</strong><br />
11. Same Agricultural<br />
Improvement Project<br />
12. Traditional Irrigation<br />
Improvement<br />
Programme (TIP)<br />
Supply water to 8171 people in Kimambo, Natiro<br />
and Mwika Villages<br />
Supply water to 300 resident of Marangu West<br />
in Moshi Rural District<br />
Support lower Moshi Villagers, in construction<br />
of VIP latrines provision of other social services<br />
such as construction of shallow wells and<br />
health-care<br />
(i)<br />
(ii)<br />
(iii)<br />
(i)<br />
(ii)<br />
Organize farmer into farming groups<br />
Offer training, funds, and supportive<br />
service in agriculture and Livestock<br />
husbandry<br />
Train farmers on improved irrigation<br />
methods and the use of draught<br />
animals in cultivation<br />
Aid rehabilitation of traditional Cannals<br />
in Chome, Mamba, Vunta, and Gonja<br />
Villages<br />
Water source (intake) Conservation<br />
projects in Same District<br />
(iii) Offers funding and support for<br />
“Hingilili Valley” project in Mwanga<br />
and Same district respectively<br />
175
13. UNDP Household<br />
Grain Storage<br />
Development<br />
(i)<br />
UNDP Funds and offers training on<br />
improved grain storage methods to<br />
Makanya Hedaru, Mabirion Kisiwani,<br />
Njoro, Ngonja and Mkonga Villages in<br />
Same District<br />
(ii) Construction of Grain Storage<br />
Demonstration Structures throughout<br />
the Region<br />
(iii)<br />
Provide supportive logistics to the<br />
project e.g. vehicles, motorcycle etc.<br />
14. DANIDA Mission (i) Support, construction and<br />
rehabilitation of Mpirani Bombo road<br />
15. EDF MICRO<br />
PROJECT<br />
(ii)<br />
(iii)<br />
(iv)<br />
(v)<br />
Strengthening Women and Children<br />
Health services in Same and Gonja<br />
Hospitals<br />
Strengthening Water supply services<br />
in Same Urban<br />
Support women social and economic<br />
projects such as Fish-pond<br />
Construction in Chome and Rombo<br />
villages and Beekeeping in other parts<br />
of Same District<br />
Supports community based self-help<br />
development projects like school<br />
construction. Water supply and health<br />
Provide; Milling machines to individuals or<br />
goups in Same District.<br />
176
16. World Vision<br />
<strong>Tanzania</strong> Northern<br />
Zone<br />
17. International Labour<br />
Organisation (ILO)<br />
18. Kanisa la Kiinjili la<br />
Kilutheri <strong>Tanzania</strong><br />
19. Kanisa Katoliki<br />
Dayosisi <strong>Tanzania</strong><br />
Provides support in the following sectors:-<br />
(i)<br />
(ii)<br />
(iii)<br />
Water<br />
(a) Enhancing the level of water<br />
supply services by providing items like<br />
construction materials pipes and<br />
cement<br />
(b) Construction of water canals<br />
for irrigation purposes.<br />
Education:<br />
Support the construction of<br />
classrooms and provision of desks<br />
Health<br />
Construction of clinics and provision<br />
of public health education<br />
Provides support to youth and Women group<br />
projects by giving Loans for project such as:-<br />
(i)<br />
(ii)<br />
(iii)<br />
(iv)<br />
Toiloring<br />
Restaurant (Migahawa)<br />
Shoe Making<br />
Cattle keeping<br />
Provides support in the following sectors:<br />
Health: Construction of Gonja Hospital and<br />
Manka Dispensary<br />
Education: Construction of Manka<br />
Secondary School Construction of Hostels at<br />
Same and Hedaru<br />
(i)<br />
(ii)<br />
(iii)<br />
Support to Water Supply Project at<br />
Vudee Village<br />
Supports Diary farming in the District<br />
Rehabilitation of health Centres<br />
177
20. Water Aid Construction of water pipes in New-Keni and<br />
Old-Keni mengeni Water Project in Rombo<br />
District.<br />
21. German GTZ (i) Support to water supply project<br />
serving Marua Fughatie, Nanjara,<br />
Makindi, ushiri and E.K.T.M. In<br />
Rombo District<br />
22. Sasakawa Global<br />
2,000<br />
(ii)<br />
Provides technical support, funds and<br />
material to promote Artisan, crafts,<br />
Trade and small scale industries in the<br />
district.<br />
Provides loans to buy farm inputs to Ibukoni,<br />
Alemi Ikwini and Shimbi Mashariki villages in<br />
Rombo District.<br />
23. ILO RYTHE Project Support youth economic activities in the<br />
Districts such as poultry farming.<br />
178
SECTION VI<br />
6.0 POTENTIAL INVESTIMENT AREAS<br />
6.1 Agriculture:<br />
Agriculture is the main economic activity contributing over 75<br />
percent employment to the rural population and contributing<br />
greatly about 60% to the region’s GDP. The Highland and<br />
Intermediate zones are the most agricultural potential areas in the<br />
regions. They are fertile, with good reliable rains and moderate<br />
temperatures. With these much agricultural advantages their zones<br />
are capable of producing a variety of food and cash crops both<br />
tropical and temperate ones and are much suited for dairly<br />
farming. However, these two zones are highly populated with<br />
densities ranging from 250 persons/sqkm in the intermediate zone<br />
to 650 people in the highland zone. The lowland zone is relatively<br />
dry with unrealiable rains. It is in this zone that population density<br />
is low less than 50 people/sq km. Irrigation farming is popular in<br />
this zone. River water is the main source for irrigation.<br />
Agricultural land occupied 6,433 sq km regionwise, out of this<br />
333,640 hekta is under cultivation. Important cash crops being<br />
coffee, cotton, sugar cane, sisal, sunflower, beans and wheat.<br />
Important food crops are bananas, bean and maize. In the<br />
highland areas average hectarage owned per family is 0.5 while in<br />
lowlands it is ajbout 1.5 hectares/family. The much scramble for<br />
land in the region has led much exodus to other regions the<br />
country.<br />
179
There are about 52,000 heactares of land under traditional<br />
irrigation in the region. Crops like coffee, bananas, vegetables<br />
and fruits are grown in these areas. Modern irrigation is at Arusha<br />
Chini area with 7,800 ha. Under sugar cane. Lower Moshi and<br />
Ndungu are among modern irrigation schemes with about 900-<br />
1100 ha. Problems facing irrigation activities are mainly<br />
inadequate water supply for irrigation mainly river water, and<br />
proper irrigation management systems. In order to curb this<br />
bottleneck the region needs to explone the possibility of getting<br />
underground water or attempts should be made to draw water<br />
from Miwaleni project/kikuletwa.<br />
6.2 Livestock:<br />
Dairy cattle farming has much potential in the highland and<br />
intermediate zones. Introduction of Heifer Project International<br />
has proved successful and of much benefit to peasant farmers in<br />
the region. Further expansion of this project will not only raise<br />
their incomes from more milk sales but will too positively affect<br />
development of coffee/bananas farms by increasing the level of<br />
soil fertility through more cattle manure application.<br />
Another area of potential investment in livestock lies in<br />
strengthening of Artificial insemination project. Timely service<br />
required by livestock keepers is very essential in the improvement<br />
of the local breed or in multiplication of better dairy cattle. The<br />
already existing A.1 centres, many of them are non functioning<br />
through different reasons. Currently only 8 centres out of the 24<br />
centres are rendering service. The district concils and NGO could<br />
180
e effective partners in the development or rehabilitation of this<br />
vital sectoral service.<br />
6.3 Forestry:<br />
Forest resources are being depleted through encroachment by<br />
human activities including search for fuelwood and expansion of<br />
agricultural land. Establishment of new forest reserves or<br />
expansion of the existing ones are the most effecting ways to curb<br />
enviromental degradation in the threatened areas. Sensitisation of<br />
local communitites and institutions into more and effective<br />
participation in establishment of both private and public<br />
afforestation plantations should be encouraged. More free<br />
seedlings should be raised by participants themselves rather than<br />
the government which seems to be less effective. Further more,<br />
promotion of fuel saving stoves and fuel saving cooking techniques<br />
should also be invested in.<br />
6.4 Tourism<br />
The region has abundant tourist attraction potentials. It is believed<br />
that if the potential sites were developed and properly managed<br />
the region would be ranked second to Arusha. Some of these<br />
attratctions are:-<br />
• Mt. <strong>Kilimanjaro</strong>; the highest mountain in Africa, famous for<br />
tough mountaineering expeditions and the only one with snow<br />
in the tropics.<br />
• <strong>Kilimanjaro</strong> National Park; it covers 756 Sq. Km, famous for<br />
having variety of wild animals.<br />
181
• The Rare Forest in <strong>Kilimanjaro</strong>; conserves the rare species of<br />
trees i.e. Stigma ‘Msoo’. The species is only found in this<br />
forest in the whole world.<br />
• The Mwariko Art Gallery; famous for displays of cultural<br />
activities such as carvings and traditional dances.<br />
• Lake Challa; attractive potential site for developing tourist<br />
resort.<br />
6.5 Industrial Sector:<br />
Establishment of small scale industries is possibly the most<br />
appropriate approach of solving the problem of unemployment in<br />
the region what has been achieved so far in this sector is well<br />
appreciated, however, the problem of much unemployment in<br />
both rural and urban areas is still glearingly big almost in all the<br />
region’s districts. Further investment in appropirate agrobased<br />
and service oriented small scale industries is greatly encouraged<br />
for job creation opportunities in the region. The existence of a<br />
network of electricity power supply in the rural areas (30.3% of<br />
all villages in the region are supplied with this farm of energy )<br />
encourages the idea of further investment into appropriate<br />
industries in the region.<br />
6.6 Women Development:<br />
Women economic contributions to family incomes is very<br />
significantly appreciated. Women in <strong>Kilimanjaro</strong> region have<br />
excelled in this. Women in rural areas in the region roughly earned<br />
about 30 percent of their family income. These contributions by<br />
182
women could be enhanced through provision of soft loans and<br />
other credit facilities through women groups.<br />
183
ANNEX A<br />
KILIMANJARO REGION IN A NUTSHELL<br />
1.0 GENERAL:<br />
1.1 (a) Location:<br />
<strong>Kilimanjaro</strong> region is located in the north eastern part of<br />
<strong>Tanzania</strong> Mainland, between latitudes 2 0 25 1 and 4 0 15 1<br />
and longitudes 36 0 25 1 3 11 and 38 0 10 1 45 11 East of<br />
Greenwich.<br />
(b)<br />
Borders:<br />
North - Republic of Kenya<br />
West - Arusha Region<br />
South - Arusha Region<br />
South East - Tanga Region<br />
1.2 Area:<br />
Land Area - 13,209 sq.k.m or about 1.4% of<br />
<strong>Tanzania</strong> Mainland area.<br />
1.3 Administrative Units:<br />
Districts - 6<br />
Division - 26<br />
Wards - 114<br />
Villages - 402<br />
1.4 Population:<br />
1988 Census - 1,108,699 people<br />
184
Population annual growth rate - 2.1% perannum<br />
Population Projection the year 2000 - 1,509,750<br />
Population density (1988) - 84 people/sq.k.m<br />
Average household size (1988) - 5.3 people<br />
1.4 Climate:<br />
Rainfall - There are two rainy seasons, April-May (major<br />
one) and September-November (minor one) mean annual rainfall<br />
500mm in lowlands and 2,000 mm in the Highland zone.<br />
2.0 ECONOMIC ACTIVITIES:<br />
The greater part of the region’s populaiton heavily dependent on<br />
agriculture and livestock keeping for their livelihood.<br />
Agriculture:<br />
Food crops raised are: Beans, bananas, fruits, maize, sorghum,<br />
cassava, paddy and sweet potatoes<br />
Cash crops include:<br />
Coffee, wheat, barley, cotton, cardamon,<br />
sisal,<br />
Arable land - 6,433 sq.k.m.<br />
Cultivated land - 333,640 ha.<br />
Livestock Keeping:<br />
Including dairy cattle in the highland and intermediate zones,<br />
indigenous cattle in the lowland zone; sheep and goats, piggery<br />
and poultry.<br />
-Livestock Facilties:<br />
Artificial Insemination Centres<br />
Total - 24<br />
185
Operating Centres - 8<br />
Dips - 56<br />
Abattoirs - 31<br />
Crushes - 29<br />
Veterinary Health Centres - 26<br />
Hides and skin sheds - 4<br />
-Livestock Population (1993/94):<br />
Cattle - 485,448<br />
Goats - 490,338<br />
Sheep - 206,904<br />
Donkeys - 202,378<br />
Pigs - 14,873<br />
Forestry:<br />
Area under forests - 139,832 Ha.<br />
Area under forest reserves - 134,377 Ha.<br />
Number of forest reserves - 15<br />
2.1 Regional Economy:<br />
Regional GDP at Current Prices:<br />
Year Tshs(Millions) USA<br />
Dollars(Million)<br />
1980 1,950 237<br />
1985 2,991 181<br />
1990 29,215 148<br />
1994 74,898 132<br />
186
187
Regional GDP Per Capita at Curretnt Prices:<br />
Year Tshs(Millions) USA<br />
Dollars(Million)<br />
1980 2,073/= 252<br />
1985 2,865/= 174<br />
1990 24,975/= 127<br />
1994 55,716 101<br />
Average Regional GDP Contribution to National GDP<br />
Year<br />
% Contribution<br />
1980 5<br />
1985 3<br />
1990 4<br />
1994 4<br />
3.0 SOCIAL SERVICES:<br />
3.1 Education:<br />
(a) Primary School Facilities (1998)<br />
- Number of Schools - 707<br />
- Number of Pupils - 253,551<br />
- Classrooms - 4,628<br />
- Shortage of Classrooms - 1,236<br />
- Teachers houses - 595<br />
- Shortage of Teachers houses - 6,788<br />
- Desks - 92,960<br />
188
- Shortage of desks - 16,313<br />
- Chairs - 7,831<br />
- Shortage of chairs - 6,528<br />
(b) Teachers Status (1997)<br />
III A - 3,797<br />
III B - 4,512<br />
Total - 8,309<br />
(c) Nursery Schools (1997):<br />
Government - 65<br />
Private - 345<br />
Total - 410<br />
Pupils - 19,660<br />
(d) Secondary Schools (1997):<br />
Government - 43<br />
Private - 69<br />
Total - 112<br />
3.2 Water:<br />
- Rural population coverage with safe drinking water<br />
(1997)-45%<br />
- Urban population served with safe drinking water (1997)<br />
- 55%<br />
- Types of water schemes/sources (1997)<br />
(a) Pumping (powered) - 13<br />
(b) Gravity - 96<br />
(c) Hand pumps - 61<br />
- Sanitation coverage - 86.7%<br />
3.3 Health Facilities (1997)<br />
Private<br />
Total<br />
Gov’t<br />
189
Hospitals 16 5 11<br />
Health Centres 18 17 1<br />
Dispensaries 361 131 230<br />
MCH - Clinics 213<br />
190
4.0 ECONOMIC INFRASTRUCTURES:<br />
4.1 (a) Roads:<br />
Trunk roads - 640km<br />
Regional roads - 807km<br />
District and Feed roads- 2272 km<br />
Total kilometers - 3,719 km.<br />
(b)<br />
(c)<br />
Railways:<br />
Moshi - Voi (Republic of Kenya)<br />
Moshi - Tanga - Dar es Salaam<br />
Moshi - Arusha<br />
Air Transport:<br />
Minor Airport: Charter air planes in Moshi Town.<br />
4.2 Energy:<br />
144 villages supplied with electricity out of 402 villages which is<br />
about 36%.<br />
5.0 OTHER DEVELOPMENT ISSUES:<br />
Women Economic Groups (1994)<br />
Groups - 716<br />
Members - 14,089<br />
5.1 Cooperative Societies<br />
District Number<br />
Hai 69<br />
Rombo 34<br />
Moshi ® 77<br />
Mwanga 19<br />
Same 19<br />
Moshi (Urban) 48<br />
191
Total 266<br />
ANNEX B<br />
HAI DISTRICT<br />
1.0 GENERAL:<br />
1.1 Location/borders:<br />
East<br />
-Moshi Rural District<br />
South<br />
-Simanjiro District of Arusha Region<br />
West and North East -Arusha Region<br />
North and North East -Republic of Kenya and Rombo district<br />
respectively<br />
1.2 Area:<br />
Land area - 2,112 sq.k.m<br />
1.3 Administrative Units:<br />
Divisions - 4<br />
Wards - 11<br />
Villages - 65<br />
1.4 Population:<br />
1988 Census - 196,901<br />
Population annual growth rate - 1.3% people<br />
Prejection year 2000 - 233,924 people<br />
Population density (1988) - 96 people/sq.km.<br />
Average household size (1988)- 5.3 people<br />
1.5 Climate:<br />
192
Rainfall - 700-2000mm per annum<br />
Temperature - 15 0 C - 30 0 C<br />
2.0 ECONOMIC ACTIVITIES:<br />
- Agriculture being main activity<br />
Food Crops: Maize, beans, potatoes and bananas<br />
Cash Crops: Coffee, wheat and barley<br />
- Livestock Facilties:<br />
Verterinary Health Centres - 9<br />
A.I. Centres - 6 (2 operating)<br />
Drips - 12<br />
Crushes - 9<br />
Livestock Markets - 3<br />
Large Livestock farms - 18<br />
Annual Milk production - 30 million Liters.<br />
- Livestock Population (1993/94) - Estimates<br />
Cattle - 94,753<br />
Goats - 88,454<br />
Sheep - 33,237<br />
Donkeys - 3,976<br />
3.0 SOCIAL SERVICES<br />
3.1 Education:<br />
(a) Primary School Facilities (1998)<br />
- Number of Schools - 140<br />
- Pupils - 41,568<br />
193
- Classrooms - 806<br />
- Shortage of classrooms - 333<br />
- Teachers houses - 141<br />
- Shortage of Teachers houses - 1,330<br />
- Desks - 13,475<br />
- Shortage of desks - 7,309<br />
- Chairs - 1,284<br />
- Shortage of chairs - 1,355<br />
(b) Teachers Status (1995)<br />
III A - 713<br />
Male - 255<br />
Female - 458<br />
III B - 763<br />
Male - 210<br />
Female - 553<br />
(c) Nursery Schools (1997)<br />
Government - 4<br />
Private - 92<br />
Pupils - 182<br />
(d) Secondary Schools (1997):<br />
Government - 5<br />
Private - 11<br />
3.2 Health (1997)<br />
Hospitals - 3<br />
Rural Health Centres - 3<br />
Dispensaries - 58<br />
194
3.3 Water:<br />
- Rural population coverage with safe drinking water<br />
(1997) - 39%<br />
- Urban population coverage - 18%<br />
- Types of schemes/sources<br />
(a) Pumping - 6<br />
(b) Gravity - 13<br />
(c) Springs - 16<br />
(d) Rivers - 10<br />
4.0 ECONOMIC INFRASTRUCTURES:<br />
4.1 Roads:<br />
Trunk roads - 27 km<br />
Regional roads - 109.0 km<br />
District roads - 206 km<br />
Feeder roads - 184 km.<br />
Total: - 526.0 km<br />
4.2 Energy:<br />
26 villages with electricity out of 65 villages.<br />
195
ANNEX C<br />
MWANGA DISTRICT<br />
1.0 GENERAL:<br />
1.1 Location/Borders:<br />
Sourth - Same District<br />
West - Moshi Rural District and Arusha<br />
Region<br />
North/East - Republic of Kenya<br />
1.2 Area:<br />
Land Area - 2,698 sq.km.<br />
1.3 Administrative Units:<br />
Divisions - 5<br />
Wards - 16<br />
Villages - 58<br />
1.4 Population:<br />
1988 Census - 98,260 people<br />
Population annual growth rate - 4.7%<br />
Population Projection the year 200- 172,711 people<br />
Population density - 45 people/sq.km.<br />
Average household size (1988)- 5.6 people<br />
1.5 Climate:<br />
Rainfall - 700-1000mm per annum<br />
Temperature - 20 0 C - 30 0 C<br />
196
197
2.0 ECONOMIC ACTIVITIES:<br />
- Agriculture being the main economic activity, producing:<br />
Food crops: Maize, beans, paddy, sorghum, cassava,<br />
sweet potatoes, bananas<br />
Cash crops: Coffee and Cotton<br />
- Livestock:<br />
Diary cattle in highlands indigenous cattle, goats, and<br />
sheep<br />
- Livestok Facilities<br />
A.I. Centre - 3 (Operating)<br />
Abattoirs - 16<br />
Crushes - 5<br />
Veterinary Health Centres - 8<br />
Hides/skin sheds - 2<br />
Dips - 13<br />
- Livestock Population (1993/94) - Estimates<br />
Cattle - 82,915<br />
Goats - 98,515<br />
Sheep - 28,629<br />
Donkeys - 2,104<br />
Pigs - 724<br />
198
3.0 SOCIAL SERVICES:<br />
3.1 Education:<br />
(a) Primary School Facilities (1998)<br />
- Number of Schools - 89<br />
- Pupils - 26,130<br />
- Classrooms - 546<br />
- Shortage of classrooms - 77<br />
- Teachers houses - 39<br />
- Shortage of Teachers houses - 613<br />
- Desks - 9,745<br />
- Shortage of Desks - 3,320<br />
- Chairs - 1,303<br />
- Shortage of Chairs - 230<br />
(b) Teachers Status (1997)<br />
III A - 430<br />
Male - 211<br />
Female - 219<br />
III B - 428<br />
Male - 156<br />
Female - 272<br />
(c) Narsery Schools (1997):<br />
Government - 24<br />
Private - 15<br />
Pupils - 183<br />
(d) Secondary Schools (1997):<br />
199
Government - 7<br />
Private - 13<br />
3.2 Health (1997)<br />
Hospitals - 1<br />
Rural Health Centres - 3<br />
Dispensaries - 48<br />
3.3 Water:<br />
- Rural population coverage with safe drinking water<br />
(1997) - 38%<br />
- Urban population coverage<br />
- 35%<br />
- Types of Schemes/Sources:<br />
(a) Pumping - 3<br />
(b) Gravity - 8<br />
(c) Shallow wells - 56<br />
(d) Pumping Machine- 3<br />
4.0 ECONOMIC INFRASTRUCTURES:<br />
4.1 Roads:<br />
Trunk roads - 50 kms<br />
Regional roads - 193 kms<br />
District roads - 141 kms<br />
Feeder roads - 122 kms<br />
Total - 506 kms<br />
4.2 Energy:<br />
22 villages supplied with electricity out of 58 villages<br />
200
ANNEX D<br />
SAME DISTRICT<br />
1.0 GENERAL:<br />
1.1 Location/Borders<br />
North-West - Mwanga District<br />
South-East - Tanga Region<br />
South-West - Arusha Region<br />
North-East - Republic of Kenya<br />
1.2 Area:<br />
Land Area - 5,186 sq.kms.<br />
1.3 Administrative Unites:<br />
Divisions - 6<br />
Wards - 24<br />
Villages - 72<br />
1.4 Population:<br />
1988 Census - 170,053 people<br />
Population growth rate - 1.4%<br />
Population Projection the year 2000 - 101,162<br />
Population density (1998) - 5.6 people<br />
1.5 Climate:<br />
Rainfall - 500-2000mm/annum<br />
Temperature - 15 0 C - 30 0 C<br />
201
2.0 ECONOMIC ACTIVITIES<br />
- Majority of the people engaged in agricultural activities<br />
and livestock farming.<br />
Main food crops grown: Maize, beans, sorghum, cassava,<br />
sweet potatoes, paddy, irish potatoes, bananas<br />
Cash crops: Coffee, cotton, cardamon, sunflower and<br />
sisal<br />
- Livestock<br />
Keeping of indigenous cattle, goats and sheep<br />
- Livestock Facilities:<br />
A.I. Centres - 2(Non Operating)<br />
Abattoirs - 4<br />
Crushes - 6<br />
Veterinary Health Centres - 9<br />
Hides and skin sheds - 2<br />
Dips - 9<br />
- Livestock Population (1993/94) - Estimates<br />
Cattle - 123,259<br />
Goats - 110,893<br />
Sheep - 37,345<br />
Donkeys - 5,918<br />
3.0 SOCIAL SERVICES:<br />
3.1 Education:<br />
(a) Primary School Facilities (1998)<br />
- Number of Schools - 141<br />
202
- Number of pupils - 40,964<br />
- Classrooms - 839<br />
- Shortage of Classrooms - 224<br />
- Teachers houses - 126<br />
- Shortage of Teachers houses - 1,235<br />
- Desks - 17,313<br />
- Shortage of desks - -<br />
(surplus 302)<br />
- Chairs - 891<br />
- Shortage of Chairs - 1,724<br />
(b) Teachers Status (1997)<br />
III A - 603<br />
Male - 360<br />
Female - 243<br />
III B - 758<br />
Male - 340<br />
Female - 418<br />
(c) Nursery Schools (1997)<br />
Government - 24<br />
Private - 18<br />
Pupils - 1,241<br />
(d) Secondary Schools (1997):<br />
Government - 12<br />
Private - 7<br />
3.2 Health (1997)<br />
Hospitals - 2<br />
203
Rural Health Centres - 3<br />
Dispensaries - 55<br />
MCH Clinics - 42<br />
204
3.3 Water:<br />
- Rural population coverage with safe drinking water<br />
(1997) - 44%<br />
- Urban population coverage 38%<br />
- Types of Schemes/Sources<br />
(a) Pumping - 5<br />
(b) Gravity - 20<br />
(c) Pumping Engine - 5<br />
(d) Shallow wells - 2<br />
4.0 ECONOMIC INFRASTRUCTURES:<br />
4.1 Roads:<br />
Trunk roads - 191 kms<br />
Regional roads - 163 kms<br />
District roads & Feeder roads - 414 kms.<br />
Total - 768 kms<br />
4.2 Energy:<br />
16 villages supplied with electricity out of 72 villages<br />
205
ANNEX E<br />
ROMBO DISTRICT<br />
1.0 GENERAL:<br />
1.1 Location/Borders:<br />
West - Hai District<br />
North - Republic of Kenya<br />
East - Republic of Kenya<br />
South - Moshi Rural District<br />
1.2 Area:<br />
Land Area - 1,442 sq.km.<br />
1.3 Administrative Units:<br />
Divisions - 5<br />
Wards - 20<br />
Villages - 57<br />
1.4 Population:<br />
1988 Census - 200,859 people<br />
Population annual growth rate - 2.4%<br />
Population Projection the year 200 - 267,897 people<br />
Population density (1988) - 136<br />
people/sq.km.<br />
Average household size (1988) - 5.6 people<br />
1.5 Climate:<br />
Rainfall - 700-1600mm per annum<br />
206
Temperature - 14 0 C - 25 0 C<br />
2.0 ECONOMIC ACTIVITIES:<br />
- The major economic activity is agriculture and dairy<br />
farming (zero grazing).<br />
Main food crops grown: Bananas, finger millet, maize,<br />
beans, groundnuts, round potatoes<br />
Cash Crops: Coffee<br />
- Livestok Facilities<br />
A.I. Centre - 3(2 operating)<br />
Dips - 12<br />
Abattoirs - 6<br />
Crushes - 9<br />
Veterinary Health Centres - Nil<br />
Hides/skin sheds - Nil<br />
- Livestock Population (1993/94) - Estimates<br />
Cattle - 59,102<br />
Goats - 150,978<br />
Sheep - 55,622<br />
Pigs - 10,618<br />
3.0 SOCIAL SERVICES:<br />
3.1 Education:<br />
(a) Primary School Facilities (1998)<br />
207
- Number of Schools - 122<br />
- Number of Pupils - 50,991<br />
- Classrooms - 733<br />
- Shortage of classrooms - 248<br />
- Teachers houses - 130<br />
- Shortage of Teachers houses - 1,207<br />
- Desks - 18,906<br />
- Shortage of Desks - 2,382<br />
- Chairs - 1,563<br />
- Shortage of Chairs - 869<br />
(b) Teachers Status (1997)<br />
III A - 588<br />
Male - 279<br />
Female - 309<br />
III B - 749<br />
Male - 270<br />
Female - 479<br />
(c) Narsery Schools (1997):<br />
Government - Nil<br />
Private - 105<br />
Pupils - 10,132<br />
(d) Secondary Schools (1997):<br />
Government - 6<br />
Private - 8<br />
3.2 Health (1997)<br />
Hospitals - 2<br />
208
Rural Health Centres - 3<br />
Dispensaries - 46<br />
MCH Clinics - 26<br />
209
3.3 Water:<br />
- Population (Rural) coverage with safe drinking water<br />
(1997) - 41%<br />
- Urban population coverage - 39%<br />
- Types of Water Schemes/Sources (1995):<br />
(a) Pumping - 2<br />
(b) Gravity - 14<br />
(c) Pumping Eng. - 2<br />
4.0 ECONOMIC INFRASTRUCTURES:<br />
4.1 Roads:<br />
Trunk roads - 44 kms<br />
Regional roads - 108 kms<br />
District roads - 55.5 kms<br />
Feeder roads - 562.5 kms<br />
Total - 770 kms<br />
4.2 Energy:<br />
24 villages supplied with electricity out of 57 villages<br />
210
MOSHI RURAL DISTRICT<br />
1.0 GENERAL:<br />
ANNEX F<br />
1.1 Location/Borders:<br />
West - Hai District<br />
North - Rombo District<br />
East - Rombo District<br />
South-East - Mwanga Region<br />
South-West - Arusha Region<br />
1.2 Area:<br />
Land Area - 1,713 sq.km.<br />
1.3 Administrative Units:<br />
Divisions - 4<br />
Wards - 27<br />
Villages - 150<br />
1.4 Population:<br />
1988 Census - 342,553 people<br />
Population annual growth rate - 1.9%<br />
Population Projection the year 2000 - 430,276 people<br />
Population density (1988) - 224 people/sq.km.<br />
Average household size (1988)- 5.4 people<br />
1.5 Climate:<br />
Rainfall - 700-2000mm per annum<br />
211
Temperature - 15 0 C - 25 0 C<br />
2.0 ECONOMIC ACTIVITIES:<br />
- Agriculture and livestock keeping are the major<br />
economic activities in the district.<br />
Food crops grown: Bananas, maize and beans.<br />
Cash crops grown: Coffee and Sunflower<br />
- Livestock<br />
Keeping mainly of dairy type under zero grazing in the<br />
upland areas. Range livestock keeping is carried out in<br />
the howland zone.<br />
- Livestock Facilities<br />
A.I. Centre - 10(3 operating)<br />
Dips - 10<br />
Abattoirs - 5<br />
Crushes - Nil<br />
Veterinary Health Centres - Nil<br />
Hides/skin sheds - Nil<br />
- Livestock Population (1993/94) - Estimates<br />
Cattle - 125,419<br />
Goats - 41,498<br />
Sheep - 52,071<br />
Donkeys - 190,380<br />
Pigs - 3,531<br />
3.0 SOCIAL SERVICES:<br />
3.1 Education:<br />
212
(a) Primary School Facilities (1998)<br />
- Number of Schools - 191<br />
- Number of Pupils - 74,836<br />
- Classrooms - 1,418<br />
- Shortage of classrooms - 231<br />
- Teachers houses - 137<br />
- Shortage of Teachers houses - 1788<br />
- Desks - 27,331<br />
- Shortage of Desks - 4,366<br />
- Chairs - 2,347<br />
- Shortage of Chairs - 1,759<br />
(b) Teachers Status (1995)<br />
III A - 1,122<br />
Male - 460<br />
Female - 662<br />
III B - 1518<br />
Male - 423<br />
Female - 1,095<br />
(c) Narsery Schools (1997):<br />
Government - 7<br />
Private - 109<br />
Pupils - 7,058<br />
(d) Secondary Schools (1997):<br />
Government - 10<br />
Private - 24<br />
3.2 Health (1997)<br />
213
Hospitals - 4<br />
Rural Health Centres - 4<br />
Dispensaries - 85<br />
MCH Clinics - 59<br />
214
3.3 Water:<br />
- Population (Rural) coverage with safe drinking water<br />
(1997) - 58%<br />
- Types of Water Schemes/Sources (1995):<br />
(a) Pumping - -<br />
(b) Gravity - 29<br />
(c) Shallow wells - 3<br />
(d) Pumping Eng. - Nil<br />
4.0 ECONOMIC INFRASTRUCTURES:<br />
4.1 Roads:<br />
Trunk roads - 68 kms<br />
Regional roads - 234 kms<br />
District roads and Feeder roads - 587 kms<br />
Total - 889 kms<br />
4.2 Energy:<br />
26 villages supplied with electricity out of 150 villages<br />
215
MOSHI URBAN DISTRICT<br />
1.0 GENERAL:<br />
ANNEX G<br />
1.1 Location/Borders:<br />
West - Hai District<br />
North - Moshi Rural District<br />
East - Moshi Rural District<br />
South - Moshi Rural District<br />
1.2 Area:<br />
Land Area - 58 sq.km.<br />
1.3 Administrative Units:<br />
Divisions - 2<br />
Wards - 16<br />
Villages - Nil<br />
1.4 Population:<br />
1988 Census - 96,838 people<br />
Population annual growth rate - 6.2%<br />
Population Projection the year 200- 203,780 people<br />
Population density (1988) - 3,339 people/sq.km.<br />
Average household size (1988)- 4.3 people<br />
1.5 Climate:<br />
Rainfall - 800-1000mm per annum<br />
Temperature - 25 0 C - 30 0 C<br />
216
217
2.0 ECONOMIC ACTIVITIES:<br />
- Wage employment in government, public service and<br />
private enterprises.<br />
- Agriculture and livestock a very limited scale, producing<br />
crops like maize, beans, sweet potatoes, bananas and<br />
vegetables.<br />
- Livestock<br />
Keeping of dairy cattle in stalls, piggery, sheep and goats.<br />
3.0 SOCIAL SERVICES:<br />
3.1 Education:<br />
(a) Primary School Facilities (1998)<br />
- Number of Schools - 24<br />
- Number of Pupils - 19,062<br />
- Classrooms - 286<br />
- Shortage of classrooms - 123<br />
- Teachers houses - 22<br />
- Shortage of Teachers houses - 615<br />
- Desks - 6,190<br />
- Shortage of Desks - -(surplus<br />
762)<br />
- Chairs - 443<br />
- Shortage of Chairs - 611<br />
(b) Teachers Status (1997)<br />
III A - 341<br />
Male - 55<br />
Female - 286<br />
III B - 296<br />
218
Male - 21<br />
Female - 275<br />
(c) Narsery Schools (1997):<br />
Government - 6<br />
Private - 6<br />
Pupils - 864<br />
(d) Secondary Schools (1997):<br />
Government - 3<br />
Private - 6<br />
3.2 Health (1997)<br />
Hospitals - 4<br />
Rural Health Centres - 2<br />
Dispensaries - 69<br />
MCH Clinics - 9<br />
3.3 Water:<br />
- Urban population served with clean water (1997) -<br />
36%<br />
- Types of Water Schemes/Sources (1995):<br />
(a) Pumping - 2<br />
(b) Gravity - 2<br />
(c) Pumping Eng. - 2<br />
4.0 ECONOMIC INFRASTRUCTURES:<br />
4.1 Roads:<br />
219
Tarmac roads - 60 kms<br />
Earth roads - 200 kms<br />
ANNEX H<br />
INFORMATION ABOUT TANZANIA<br />
1.1 GENERAL<br />
Location: (29 0 E-41 0 ; 1 0 S - 12 0 S)<br />
Land Frontiers:<br />
To the North:<br />
To West:<br />
To South:<br />
To East:<br />
Kenya and Uganda<br />
Burundi, Rwanda and Zaire<br />
Zambia, Malawi and Mozambique<br />
Indian Ocean<br />
AREA OF MAINLAND<br />
Land area<br />
Water area (Inland)<br />
<strong>Tanzania</strong> area<br />
881,289 Sq.Km.<br />
61,495 Sq.Km.<br />
942,784 Sq.Km.<br />
TANZANIA MAINLAND AREA BY REGIONS (SQ KM)<br />
Total 942,784<br />
Arusha 82,428 Morogoro 70,799<br />
Coast 32,407 Mwanza 35,248<br />
Dodoma 41,311 Lindi 66,046<br />
Iringa 58,936 D'Salaam 1,393<br />
Kigoma 45,066 Rukwa 75,240<br />
Kagera 39,627 Ruvuma 66,477<br />
220
<strong>Kilimanjaro</strong> 13,309 Shinyanga 50,781<br />
Mara 30,150 Singida 49,341<br />
Mbeya 62,420 Tabora 76,151<br />
Mtwara 16,707 Tanga 26,808<br />
221
Population<br />
TOTAL POPULATION AND LIFE EXPECTANCY FOR TANZANIA - BY<br />
REGIONS, 1967, 1978, 1988, 1996:<br />
REGION<br />
Dodoma<br />
Arusha<br />
<strong>Kilimanjaro</strong><br />
Tanga<br />
Morogoro<br />
Coast<br />
Dar es Salaam<br />
Lindi<br />
Mtwara<br />
Ruvuma<br />
Iringa<br />
Mbeya<br />
Singida<br />
Tabora<br />
Rukwa<br />
Kigoma<br />
Shinyanga<br />
Kagera<br />
Mwanza<br />
Mara<br />
TOTAL POPULATION LIFE EXP. 1988<br />
1967 (No.) 1978 (No.) 1988<br />
('000)<br />
709,380<br />
610,474<br />
652,722<br />
771,060<br />
682,700<br />
428,041<br />
356,286<br />
419,853<br />
621,293<br />
395,447<br />
689,905<br />
753,765<br />
457,938<br />
502,068<br />
276,091<br />
473,443<br />
899,468<br />
658,712<br />
1,055,883<br />
544,125<br />
972,005<br />
926,223<br />
902,437<br />
1,037,767<br />
939,264<br />
516,586<br />
843,090<br />
527,624<br />
771,818<br />
561,575<br />
925,044<br />
1,079,864<br />
613,949<br />
817,907<br />
451,897<br />
648,941<br />
1,323,535<br />
1,009,767<br />
1,443,379<br />
723,827<br />
1,234.9<br />
1,348.4<br />
1,106.0<br />
1,307.3<br />
1,254.0<br />
636.5<br />
1,357.6<br />
645.0<br />
887.4<br />
781.4<br />
1,206.0<br />
1,472.7<br />
789.9<br />
1,033.8<br />
693.3<br />
857.8<br />
1,768.6<br />
1,358.8<br />
1,874.4<br />
968.6<br />
1996**<br />
('000)<br />
1,472.5<br />
1,784.0<br />
1,703.5<br />
1,521.8<br />
1,519.4<br />
740.9<br />
1,945.7<br />
744.8<br />
976.7<br />
1,001.3<br />
1,472.9<br />
1,857.0<br />
949.4<br />
1,232.6<br />
954.7<br />
1,047.6<br />
2,194.83<br />
1,659.5<br />
2,270.9<br />
1,202.0<br />
<strong>Tanzania</strong> Mainland 11,958,654 17,036,499 22,582.4 28,252.2 49 51<br />
Zanzibar North<br />
Zanzibar South<br />
Zanzibar Urban<br />
Pemba<br />
Pemba<br />
56,360<br />
39,087<br />
95,047<br />
72,015<br />
92,306<br />
77,017<br />
51,749<br />
142,041<br />
106,290<br />
99,014<br />
97.1<br />
70.2<br />
208.4<br />
137.4<br />
127.7<br />
119.0<br />
91.8<br />
290.4<br />
172.6<br />
160.4<br />
Zanzibal Is. 354,815 476,111 640.7 834.2 46 49<br />
<strong>Tanzania</strong> United Rep. 12,313,469 17,512,610 23,223.1 29,086.4 47 50<br />
M<br />
Yrs<br />
57<br />
46<br />
50<br />
45<br />
44<br />
44<br />
47<br />
57<br />
46<br />
46<br />
45<br />
45<br />
44<br />
46<br />
44<br />
48<br />
48<br />
54<br />
53<br />
48<br />
46<br />
45<br />
46<br />
46<br />
45<br />
W Yrs<br />
Note: The projections are based on the national Population Census of 1988, and the<br />
calculated growth rates since the 1978 census.<br />
Source: Bureau of Statistics.<br />
58<br />
51<br />
50<br />
47<br />
47<br />
45<br />
49<br />
62<br />
48<br />
48<br />
48<br />
48<br />
48<br />
50<br />
47<br />
50<br />
51<br />
55<br />
54<br />
51<br />
47<br />
50<br />
52<br />
48<br />
50<br />
222
Land Use<br />
(Ha (millions) Proportion (Percentage)<br />
Small holder cultivation 4.1 5<br />
Large scale agriculture 1.1 1<br />
Grazing Land 35.0 39<br />
Forest and Wood Lands 44.0 50<br />
Other Lands 4.4 5<br />
Total 88.6 100<br />
Arable Land:<br />
Arable Land (Ha) 3,634,000<br />
Lakes<br />
Victoria<br />
Tanganyika<br />
Nyasa<br />
Rukwa<br />
Eyasi<br />
Natron<br />
Manyara<br />
34,850 sq km<br />
13,350 sq km<br />
5,600 sq km<br />
2,850 sq km<br />
1,050 sq km<br />
900 sq km<br />
320 sq km<br />
Mountain summits (metres above sea level)<br />
<strong>Kilimanjaro</strong> 5,895<br />
Meru 4,566<br />
223
Climate<br />
(a)<br />
Rainfall<br />
Main rain season on the coast is between March and May and<br />
the second season is between October and December. Rainfall is<br />
well distributed throughout the year but there is a peak during<br />
March and May.<br />
Average maximum temperature (degrees centigrade)<br />
Jan. Apr. July October<br />
Dar es Salaam 31.6 30.1 28.6 31.3<br />
Arusha 28.9 25.3 21.1 27.3<br />
Dodoma 31.4 28.4 26.0 30.2<br />
Average manimum tempereture (degrees centigrade)<br />
Jan. Apr. July October<br />
Dar es Salaam 23.3 22.9 18.3 31.3<br />
Arusha 12.2 16.9 12.6 27.3<br />
Dodoma 19.2 13.5 16.2 30.2<br />
Gross Domestic Product at factor cost (billion Shs.) 1992.<br />
At current price 688.0<br />
At constant prices 32.2<br />
GDP growth rate at 1976 prices 1985-92 3.69%<br />
Per capita 27,355<br />
At current price 27,355<br />
At constant price 1,280<br />
224
1.2 SOCIAL SERVICES<br />
HEALTH FACILITIES<br />
YEAR HOSPITALS RHC DISPENSARIES<br />
1960 98 22 975<br />
1980 149 239 2,600<br />
1990 173 276 3,014<br />
Education: Enrolment rates 1995 compared with<br />
other East Africa countries<br />
COUNTRY<br />
GROSS ENROLLMENT<br />
PRIMARY<br />
SECONDARY<br />
KENYA<br />
UGANDA<br />
TANZANIA<br />
94<br />
76<br />
67<br />
28<br />
20<br />
13<br />
225
1.3 NATIONAL PARKS<br />
National Parks (area in sq km)<br />
PARK<br />
(i) SERENGETI<br />
NATIONAL PARK<br />
LOCATION AND PARTICULARS<br />
LOCATION: At the border of Arusha & Mara Region,<br />
about 32 km from Arusha town<br />
AREA SIZE: 14,763 square km. It is the largest and oldest<br />
Park in <strong>Tanzania</strong> having been established under the British<br />
Colony in 195l. It contains the greatest and most<br />
spectacular concentration of plain animals left any where in<br />
Africa.<br />
MAJOR ATTRACTIONS: Wildebeest about 1.7 million,<br />
Lions 3,000. About 35 species of animals and 500 species<br />
of birds, Buffalos, Chetah, Leopards etc.<br />
(ii) LAKE<br />
MANYARA<br />
NATIONAL PARK<br />
LOCATION: Some 125 Kilometres South West of Arusha<br />
town. It was officially established and gazzetted as a<br />
National Park in 1960.<br />
AREA: Lake Manyara National Park covers a total area of<br />
320 square kilometres, 230 kilometres constituting Lake<br />
Manyara itself.<br />
MAJOR ATTRACTIONS: The Rift Valley edge on the<br />
West with the vast lake underneath. Natural forest with<br />
many natural rivers and springs.<br />
Tree-climbing lions, various species of animals plus about<br />
360 species of birds, Elephants, Hippos, Leopards, Baboons<br />
etc.<br />
226
(iii) TARANGIRE<br />
NATIONAL PARK<br />
LOCATION: South of Arusha town along the Dodoma<br />
Highway. It was established in l970.<br />
AREA: Tarangire National Park covers some 2,600 Square<br />
kilometres.<br />
MAJOR ATTRACTIONS: Tree climbing pythons, zebra,<br />
kongoni, elephant, buffalo, waterbuck, gazettes and oryx.<br />
(iv)ARUSHA<br />
NATIONAL PARK<br />
(MOMELA)<br />
LOCATION: The Park is located between Mount Meru and<br />
Mount <strong>Kilimanjaro</strong>. Formally Ngudoto National Park until<br />
1967. Was commissioned as National Park in 1960.<br />
AREA: The park covers some 137 square Kilometres.<br />
MAJOR ATTRACTIONS: Ngurdoto Crater, Lake<br />
Momella, Mount Meru and the Natural Momela Forests.<br />
There are many species of Animals and birds. The most<br />
common being African elephant, colobus and velvet<br />
monkey, hippo, duicker and a number of bird species.<br />
(v)KILIMANJARO<br />
NATIONAL PARK<br />
LOCATION: The <strong>Kilimanjaro</strong> National Park which derived<br />
its name from Mount <strong>Kilimanjaro</strong> is part and parcel of the<br />
Mountain. It was established in 1973.<br />
AREA: The bounderies of the Park include the natural<br />
forest under and around the Mountain. It covers some 760<br />
square Kilometres.<br />
MAJOR ATTRACTIONS: Mount <strong>Kilimanjaro</strong> with its<br />
three peaks Shira (3,962 metres) Mawenzi and Kibo (5,149<br />
and 5,895 metres respectively) above sea level form the<br />
largest part of the Park's attraction. There are also various<br />
species of Animals, plants and birds.<br />
227
(vi)MIKUMI<br />
NATIONAL PARK<br />
LOCATION: It is situated some 216 km along the Dar -<br />
Zambia Highway. It was established in 1964.<br />
AREA: Mikumi National Park which borders with Africa's<br />
largest Game reserve, the Selous is the third biggest National<br />
Park after Serengeti and Ruaha National Park and covers<br />
3230 sq km.<br />
MAJOR ATTRACTIONS: The plains sorrounding River<br />
Mkata which are rich in flora and fauna are by themselves a<br />
wonderful scenarial. The common animals found in the park<br />
include zebra, buffalos, elephants, Hippos, lions and the<br />
Impalas.<br />
(vii)UDZUNGWA<br />
NATIONAL PARK<br />
LOCATION: This Park is located South of Mikumi<br />
National Park along the Mikumi-Ifakara Highway. The<br />
Park was established in 1992.<br />
AREA: The Park which derives its identity from the famous<br />
Udzungwa mountain has an area of 1990 square kilometres.<br />
MAJOR ATTRACTIONS: Its unique species of Fauna and<br />
Flora which called for its declaration as a National Park.<br />
The Udzungwa Mountains and Forests are a good source of<br />
Rivers and springs, one of them being the famous Kilombero<br />
River, which constitutes the essential part of the multihactoral<br />
its total Kilombero Sugar Plantations. Additional<br />
attractions: Lions, Buffalos, Giraffes etc.<br />
228
(viii)RUAHA<br />
NATIONAL PARK<br />
LOCATION: The name Ruaha, is derived from the Hehe<br />
word "Luvaha" meaning a river.<br />
AREA: Park covers an area of 12,950 square kilometres,<br />
the second largest in the country. Ruaha National Park<br />
which was established in 1964 is situated some 130 km west<br />
of Iringa town.<br />
MAJOR ATTRACTIONS: The Ruaha River by itself is an<br />
attraction, leave alone some hundreds of species of Flora<br />
which sorround it. Besides there are a lot of Crocodiles,<br />
Hippos, Elephants etc.<br />
(ix) KATAVI<br />
NATIONAL PARK *<br />
LOCATION: It is located in Mpanda District, Rukwa<br />
Region. It was established in 1974.<br />
AREA: The Katavi National Park which is about 40<br />
kilometres South -East of Mpanda town covers an area of<br />
2,253 square kilometres.<br />
MAJOR ATTRACTION: Lakes Chala and Chada plus<br />
other springs and rivers whose waters feed into lake Rukwa<br />
constitute a unique environment. Animals in the park<br />
include zebra, sable, eland, leopard, buffalo, lion, antelops<br />
etc. Animals like, Buffalos, Elephants, Zebras and<br />
BushBucks are a good attraction to visitors.<br />
(x)MAHALE<br />
NATIONAL PARK<br />
LOCATION Located some 120 south of Kigoma town<br />
along the shores of lake Tanganyika, Mahale National Park<br />
is yet another attraction in <strong>Tanzania</strong>'s Natural Heritages.<br />
AREA: Mahale nation Park has about 1,613 square<br />
kilometres and was gazzetted in 1948.<br />
MAJOR ATTRACTIONS:Chimpanzees are a major<br />
attraction. Also there is a good number of monkey species<br />
including red colobus monkeys. It is estimated that there<br />
are 700 Chimpanzees in Mahale and 15 species of monkeys<br />
whose habits tally with those of the Chimps.<br />
229
(xi) GOMBE<br />
NATIONAL PARK<br />
LOCATION: Gombe National Park is situated 16 km north<br />
of Kigoma town in western <strong>Tanzania</strong>. It is a narrow strip of<br />
mountainous country bounded in the east by the eastern rift<br />
valley escarpment and by lake Tanganyika in the west<br />
AREA: Covering some 52 square kilometres. National park,<br />
was commssioned in 1968.<br />
MAJOR ATTRACTIONS:Ever green forests and primates.<br />
These include Chimpanzees, Baboons, blue monkey red tails<br />
and red colobus.<br />
(xii) RUBONDO<br />
NATIONAL PARK<br />
LOCATION: The Park which form park of a number of<br />
archipelagos in Lake Victoria covers some 240 square<br />
Kilometres. it was established in 1977<br />
MAJOR ATTRACTIONS: The Chimpanzees. But other<br />
attractions include, Hippos, Giraffes, and Elephants. the<br />
absence of man-eaters such as Lions & Leopards ensures a<br />
safe walk in Rubondo Park even some fishing activities with<br />
boats under Park wardens are carried out.<br />
(xiii)<br />
NGORONGORO<br />
LOCATION: It is situated west of Arusha town some 230<br />
kms.<br />
AREA: The park covers 8320 sq km<br />
MAJOR ATTRACTION: Wildebeest, Lions, Buffalos,<br />
Leopards, Variety of birds species, Giraffes, elephans etc<br />
230