Preliminary World Airport Traffic 2010 - ACI
Preliminary World Airport Traffic 2010 - ACI
Preliminary World Airport Traffic 2010 - ACI

You also want an ePaper? Increase the reach of your titles
YUMPU automatically turns print PDFs into web optimized ePapers that Google loves.
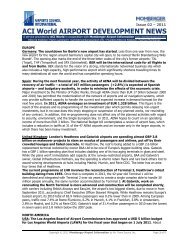
<strong>Preliminary</strong> <strong>World</strong> <strong>Airport</strong> <strong>Traffic</strong> <strong>2010</strong><br />
Passenger traffic up 6.3%; Cargo up 15.2%<br />
Montreal, 15 March 2011 – <strong>ACI</strong> preliminary traffic results, based on reports from over 900 airports<br />
worldwide, indicate that global passenger traffic grew at a better than expected rate of 6.3 percent and<br />
cargo rose strongly by 15.2 percent, as compared to 2009. Aircraft movements remained stable at just<br />
under 1 percent.<br />
<strong>ACI</strong> <strong>World</strong> Director General Angela Gittens comments, “<strong>2010</strong> underscored the resilience of the air<br />
transport business and resulted in over 5 billion annual passengers for the first time ever. <strong>2010</strong> also<br />
pronounced the shift and divergence in growth across the regions. While North America and Europe<br />
have struggled to reach pre-crisis passenger volumes, Asia-Pacific, Latin America-Caribbean and<br />
Middle East sustained a strong momentum and gained market share through double digit growth.”<br />
Monthly passenger growth worldwide in <strong>2010</strong> was consistently high between 5 percent and 10 percent<br />
with the exception of a significant setback in April due to the volcanic ash cloud that hit Europe<br />
particularly hard. Another anomaly impacting traffic mainly in Europe was the unusually harsh winter<br />
weather in December. Despite these setbacks Europe still registered growth of 4.3 percent in <strong>2010</strong><br />
thanks to strong international summer and fall traffic.<br />
A slow economic recovery and restraint of air carriers in adding domestic capacity has led to modest<br />
growth in North America of 2.4 percent keeping passenger numbers below pre-crisis levels in that<br />
region.<br />
Asia-Pacific has benefited from a 14.2 percent rise of international passengers resulting in a total<br />
increase of 11.5 percent. Latin America-Caribbean enjoyed strong domestic traffic growth particularly in<br />
Brazil and other Latin American countries as national economies and low cost carriers expand quickly.<br />
International traffic was also important in Africa which registered 8.8 percent more passengers in total<br />
while 11.5 percent more passengers arrived and departed in the Middle East.<br />
The recovery was more coherent and comprehensive in the freight sector where all regions showed a<br />
robust double digit increase led by Asia-Pacific (+18.6%) and Europe (+17%). International freight was<br />
the driver of the air freight recovery as total tonnage jumped by 20.5 percent compared to 2009.<br />
<strong>ACI</strong> <strong>World</strong> Headquarters | PO Box 302 | 800 Rue du Square Victoria | Montreal, Quebec H4Z 1G8 | Canada<br />
aci@aci.aero | www.aci.aero | Tel: +1 514 373 1200<br />
1
Aircraft movements increased the most in Latin America-Caribbean (+6.2%), Middle East (+6.1%) and<br />
Asia-Pacific (+5%) while movements continued to decline in Europe (-0.4%) and North America (-1.2%).<br />
Gittens concludes,”Passenger and freight growth clearly surpassed global GDP growth in <strong>2010</strong>. GDP<br />
growth projections for this and the coming years are high creating a positive outlook for demand for air<br />
transport. This underpins the need to continue to expand and modernize airport infrastructure to<br />
maintain high standards of efficiency and customer service. More than ever, airports will be asked to<br />
finance these projects autonomously without public funds requiring private and public airports to be<br />
empowered to generate necessary returns on their investment.”<br />
<strong>Airport</strong> ranking<br />
Among the largest airports in the world Beijing (+13%) leaped to the second rank eyeing Atlanta<br />
(+1.5%) which continues to be the world’s largest airport. London Heathrow dropped to the fourth rank<br />
overtaken by Beijing and Chicago O’Hare (+3.3%). Only two airports in the top 30 did not grow in <strong>2010</strong>,<br />
Las Vegas (-2.6%) and London Heathrow (-0.2%). Charlotte (+10.4%) was the only large airport<br />
outside Asia-Pacific and Middle East growing by more than 10 percent. See tables 1, 2, 3.<br />
SUMMARY: PRELIMINARY RESULTS FOR <strong>2010</strong>, compared to 2009<br />
Total Passengers: +6.3%<br />
Total International Passengers: +7.5%<br />
Total Cargo (includes mail): +15.2%<br />
Total International Freight: +20.5%<br />
Total Aircraft Movements: +0.8%<br />
* Please note that all figures and percentages are based on submissions by 906 airports. The final confirmed<br />
report will be published in July 2011 and will include 1300+ airports; therefore figures are subject to variation.<br />
Notes for Editors<br />
1. <strong>ACI</strong>, the only worldwide association of airports, is a non-profit organization whose prime purpose is to represent<br />
the interests of airports and to promote professional excellence in airport management and operations. <strong>ACI</strong> has 580<br />
members who operate over 1650 airports in 179 countries and territories.<br />
2. For queries concerning the statistics, please contact Nancy Gautier, Director Communications at <strong>ACI</strong> <strong>World</strong><br />
ngautier@aci.aero or Jenny Waddell, Communications Manager <strong>ACI</strong> <strong>World</strong> jwaddell@aci.aero<br />
3. Please note that preliminary results are based on the submissions of over 900 reporting entities, representing 93<br />
percent of global traffic. The final confirmed report, which will be published in July 2011, will include any outstanding<br />
airport reports (total will be over 1300 airports), and therefore figures are subject to slight variation.<br />
<strong>ACI</strong> <strong>World</strong> Headquarters | PO Box 302 | 800 Rue du Square Victoria | Montreal, Quebec H4Z 1G8 | Canada<br />
aci@aci.aero | www.aci.aero | Tel: +1 514 373 1200<br />
2
Charts and tables<br />
25<br />
TOTAL PASSENGER<br />
REGIONAL TRENDS<br />
<strong>2010</strong><br />
20<br />
% CHANGE FROM PREVIOUS YEAR<br />
15<br />
10<br />
5<br />
0<br />
-5<br />
-10<br />
AFR ASP EUR LAC MEA NAM<br />
-15<br />
JAN FEB MAR APR MAY JUN JUL AUG SEP OCT NOV DEC<br />
30<br />
INTERNATIONAL PASSENGER<br />
REGIONAL TRENDS<br />
<strong>2010</strong><br />
25<br />
% CHANGE FROM PREVIOUS YEAR<br />
20<br />
15<br />
10<br />
5<br />
0<br />
-5<br />
-10<br />
-15<br />
AFR ASP EUR LAC MEA NAM<br />
-20<br />
JAN FEB MAR APR MAY JUN JUL AUG SEP OCT NOV DEC<br />
- more -<br />
<strong>ACI</strong> <strong>World</strong> Headquarters | PO Box 302 | 800 Rue du Square Victoria | Montreal, Quebec H4Z 1G8 | Canada<br />
aci@aci.aero | www.aci.aero | Tel: +1 514 373 1200<br />
3
% CHANGE FROM PREVIOUS YEAR<br />
45<br />
40<br />
35<br />
30<br />
25<br />
20<br />
15<br />
10<br />
5<br />
0<br />
-5<br />
-10<br />
TOTAL CARGO<br />
REGIONAL TRENDS<br />
<strong>2010</strong><br />
AFR ASP EUR LAC MEA NAM<br />
JAN FEB MAR APR MAY JUN JUL AUG SEP OCT NOV DEC<br />
50<br />
INTERNATIONAL FREIGHT<br />
REGIONAL TRENDS<br />
<strong>2010</strong><br />
AFR ASP EUR LAC MEA NAM<br />
% CHANGE FROM PREVIOUS YEAR<br />
40<br />
30<br />
20<br />
10<br />
0<br />
-10<br />
JAN FEB MAR APR MAY JUN JUL AUG SEP OCT NOV DEC<br />
- more -<br />
<strong>ACI</strong> <strong>World</strong> Headquarters | PO Box 302 | 800 Rue du Square Victoria | Montreal, Quebec H4Z 1G8 | Canada<br />
aci@aci.aero | www.aci.aero | Tel: +1 514 373 1200<br />
4
15<br />
TOTAL MOVEMENTS<br />
REGIONAL TRENDS<br />
<strong>2010</strong><br />
% CHANGE FROM PREVIOUS YEAR<br />
10<br />
5<br />
0<br />
-5<br />
-10<br />
-15<br />
AFR ASP EUR LAC MEA NAM<br />
JAN FEB MAR APR MAY JUN JUL AUG SEP OCT NOV DEC<br />
30<br />
25<br />
EVOLUTION OF AIRPORT TRAFFIC WORLDWIDE<br />
<strong>2010</strong><br />
Passengers Cargo Movements<br />
% CHANGE FROM PREVIOUS YEAR<br />
20<br />
15<br />
10<br />
5<br />
0<br />
-5<br />
JAN FEB MAR APR MAY JUN JUL AUG SEP OCT NOV DEC<br />
- more -<br />
<strong>ACI</strong> <strong>World</strong> Headquarters | PO Box 302 | 800 Rue du Square Victoria | Montreal, Quebec H4Z 1G8 | Canada<br />
aci@aci.aero | www.aci.aero | Tel: +1 514 373 1200<br />
5
WORLDWIDE AIRPORT TRAFFIC REPORT SUMMARY<br />
<strong>Preliminary</strong> Results <strong>2010</strong><br />
STATS<br />
REGIONS<br />
PASSENGERS<br />
percent<br />
change<br />
CARGO<br />
percent<br />
change<br />
MOVEMENTS<br />
percent<br />
change<br />
AFR 126 950 421 8.8 1 107 764 9.4 1 998 532 3.7<br />
ASP 1 171 232 331 11.5 30 568 352 18.6 10 048 632 5.0<br />
EUR 1 409 464 291 4.3 17 337 248 17.0 17 596 411 (0.4)<br />
LAC 360 994 685 12.1 4 335 375 14.1 5 631 185 6.2<br />
MEA 125 775 339 11.5 4 500 502 11.8 1 144 824 6.1<br />
NAM 1 457 930 721 2.4 25 021 564 11.2 27 999 158 (1.2)<br />
<strong>ACI</strong> 4 652 347 788 6.3 82 870 804 15.2 64 418 742 0.8<br />
Passengers<br />
Cargo<br />
Movements<br />
total passengers enplaned and deplaned; passengers in transit counted once.<br />
loaded and unloaded freight and mail in metric tonnes.<br />
landing or take-off of an aircraft.<br />
Number of participating airports by region included in this summary in <strong>2010</strong>: 905<br />
AFR: 104; ASP: 1230; EUR: 306; LAC: 180; MEA: 14; NAM: 178<br />
INTERNATIONAL PASSENGER & FREIGHT SUMMARY<br />
<strong>Preliminary</strong> Results <strong>2010</strong><br />
STATS<br />
REGIONS<br />
INTERNATIONAL<br />
PASSENGERS<br />
percent<br />
change<br />
INTERNATIONAL<br />
FREIGHT<br />
percent<br />
change<br />
AFR 84 780 969 10.4 973 123 9.1<br />
ASP 429 453 267 14.2 21 544 108 22.5<br />
EUR 1 006 497 914 4.5 13 083 517 19.2<br />
LAC 107 718 215 8.3 2 930 542 20.6<br />
MEA 111 039 901 12.1 4 335 251 12.0<br />
NAM 197 066 924 5.7 7 514 962 24.2<br />
<strong>ACI</strong> 1 936 557 190 7.5 50 381 503 20.5<br />
International (Passengers/Freight) traffic (passengers and freight) performed between the designated<br />
airport and an airport in another country/territory<br />
Freight comprises goods, newspapers, diplomatic bags, parcel post and express parcel; does not include<br />
passenger baggage and trucked freight; loaded and unloaded in metric tonnes.<br />
Number of participating airports by region included in the international summary in 2009: 599<br />
AFR: 80 ASP: 82 EUR: 246 LAC: 105 MEA: 14 NAM: 72<br />
- more -<br />
<strong>ACI</strong> <strong>World</strong> Headquarters | PO Box 302 | 800 Rue du Square Victoria | Montreal, Quebec H4Z 1G8 | Canada<br />
aci@aci.aero | www.aci.aero | Tel: +1 514 373 1200<br />
6
WORLD’S BUSIEST AIRPORTS – <strong>Preliminary</strong> Ranking<br />
Table 1 – AIRCRAFT MOVEMENTS <strong>2010</strong><br />
MOVEMENTS<br />
RANK AIRPORT Take-off and<br />
Landings<br />
Percent<br />
change<br />
1 ATLANTA GA, US (ATL) 950 119 (2.1)<br />
2 CHICAGO IL, US (ORD) 882 614 6.4<br />
3 DALLAS/FORT WORTH TX, US (DFW) 652 261 2.1<br />
4 DENVER CO, US (DEN) 630 089 3.8<br />
5 LOS ANGELES CA, US (LAX) 575 835 5.3<br />
6 HOUSTON TX, US (IAH) 531 347 (1.3)<br />
7 CHARLOTTE NC, US (CLT) 529 101 3.9<br />
8 BEIJING, CN (PEK) 517 582 6.0<br />
9 LAS VEGAS NV, US (LAS) 505 591 (1.1)<br />
10 PARIS, FR (CDG) 499 997 (4.8)<br />
11 FRANKFURT, DE (FRA) 464 432 0.3<br />
12 PHILADELPHIA PA, US (PHL) 460 779 (2.5)<br />
13 LONDON, GB (LHR) 454 883 (2.5)<br />
14 DETROIT MI, US (DTW) 452 616 4.6<br />
15 PHOENIX AZ, US (PHX) 450 293 (1.5)<br />
16 MINNEAPOLIS MN, US (MSP) 434 120 0.4<br />
17 MADRID, ES (MAD) 433 683 (0.3)<br />
18 TORONTO ON, CA (YYZ) 418 051 2.6<br />
19 AMSTERDAM, NL (AMS) 402 374 (1.1)<br />
20 NEWARK NJ, US (EWR) 401 930 (2.2)<br />
21 NEW YORK NY, US (JFK) 397 419 (4.1)<br />
22 MUNICH, DE (MUC) 389 939 (1.7)<br />
23 SAN FRANCISCO CA, US (SFO) 387 248 2.0<br />
24 MIAMI FL, US (MIA) 376 208 7.1<br />
25 PHOENIX AZ, US (DVT) 367 651 (8.6)<br />
26 SALT LAKE CITY UT, US (SLC) 361 954 (2.6)<br />
27 NEW YORK NY, US (LGA) 360 544 1.9<br />
28 BOSTON MA, US (BOS) 352 641 2.1<br />
29 TOKYO, JP (HND) 342 804 2.1<br />
30 MEXICO CITY, MX (MEX) 339 898 (2.3)<br />
- more -<br />
<strong>ACI</strong> <strong>World</strong> Headquarters | PO Box 302 | 800 Rue du Square Victoria | Montreal, Quebec H4Z 1G8 | Canada<br />
aci@aci.aero | www.aci.aero | Tel: +1 514 373 1200<br />
7
RANK<br />
WORLD’S BUSIEST AIRPORTS – <strong>Preliminary</strong> Ranking<br />
Table 2 – TOTAL PASSENGER TRAFFIC <strong>2010</strong><br />
AIRPORT CITY / COUNTRY/CODE<br />
PASSENGERS<br />
(Enplaning<br />
and<br />
deplaning)<br />
Percent<br />
change<br />
1 ATLANTA GA, US (ATL) 89 331 622 1.5<br />
2 BEIJING, CN (PEK) 73 891 801 13.0<br />
3 CHICAGO IL, US (ORD) 66 665 390 3.3<br />
4 LONDON, GB (LHR) 65 884 143 (0.2)<br />
5 TOKYO, JP (HND) 64 069 098 3.4<br />
6 LOS ANGELES CA, US (LAX) 58 915 100 4.2<br />
7 PARIS, FR (CDG) 58 167 062 0.4<br />
8 DALLAS/FORT WORTH TX, US (DFW) 56 905 066 1.6<br />
9 FRANKFURT, DE (FRA) 53 009 221 4.1<br />
10 DENVER CO, US (DEN) 52 211 242 4.1<br />
11 HONG KONG, HK (HKG) 50 410 819 10.6<br />
12 MADRID, ES (MAD) 49 786 202 2.8<br />
13 DUBAI, AE (DXB) 47 180 628 15.4<br />
14 NEW YORK NY, US (JFK) 46 495 876 1.4<br />
15 AMSTERDAM, NL (AMS) 45 211 749 3.8<br />
16 JAKARTA, ID (CGK) 43 981 022 18.4<br />
17 BANGKOK, TH (BKK) 42 784 967 5.6<br />
18 SINGAPORE, SG (SIN) 42 038 777 13.0<br />
19 GUANGZHOU, CN (CAN) 40 975 253 10.6<br />
20 SHANGHAI, CN (PVG) 40 582 356 27.2<br />
21 HOUSTON TX, US (IAH) 40 475 058 1.2<br />
22 LAS VEGAS NV, US (LAS) 39 397 359 (2.6)<br />
23 SAN FRANCISCO CA, US (SFO) 39 254 634 5.1<br />
24 PHOENIX AZ, US (PHX) 38 552 409 1.9<br />
25 CHARLOTTE NC, US (CLT) 38 143 078 10.4<br />
26 ROME, IT (FCO) 36 228 490 7.4<br />
27 SYDNEY, AU (SYD) 35 992 164 7.6<br />
28 MIAMI FL, US (MIA) 35 698 025 5.3<br />
29 ORLANDO FL, US (MCO) 34 877 507 3.5<br />
30 MUNICH, DE (MUC) 34 721 605 6.2<br />
.<br />
- more -<br />
<strong>ACI</strong> <strong>World</strong> Headquarters | PO Box 302 | 800 Rue du Square Victoria | Montreal, Quebec H4Z 1G8 | Canada<br />
aci@aci.aero | www.aci.aero | Tel: +1 514 373 1200<br />
8
WORLD’S BUSIEST AIRPORTS – <strong>Preliminary</strong> Ranking<br />
Table 3 – TOTAL CARGO TRAFFIC <strong>2010</strong><br />
CARGO (Metric tonnes)<br />
RANK AIRPORT Loaded and<br />
unloaded<br />
Percent<br />
change<br />
1 HONG KONG, HK (HKG) 4 168 394 23.2<br />
2 MEMPHIS TN, US (MEM) 3 916 937 5.9<br />
3 SHANGHAI, CN (PVG) 3 227 914 27.1<br />
4 INCHEON, KR (ICN) 2 684 500 16.1<br />
5 ANCHORAGE AK, US (ANC)* 2 578 396 33.1<br />
6 PARIS, FR (CDG) 2 399 067 16.8<br />
7 FRANKFURT, DE (FRA) 2 275 106 20.5<br />
8 DUBAI, AE (DXB) 2 270 498 17.8<br />
9 TOKYO, JP (NRT) 2 167 843 17.1<br />
10 LOUISVILLE KY, US (SDF) 2 166 226 11.1<br />
11 SINGAPORE, SG (SIN) 1 841 004 10.9<br />
12 MIAMI FL, US (MIA) 1 835 793 17.9<br />
13 LOS ANGELES CA, US (LAX) 1 810 345 15.5<br />
14 TAIPEI, TW (TPE) 1 767 075 30.1<br />
15 LONDON, GB (LHR) 1 551 405 15.0<br />
16 BEIJING, CN (PEK) 1 549 126 5.0<br />
17 AMSTERDAM, NL (AMS) 1 538 135 16.8<br />
18 CHICAGO IL, US (ORD) 1 424 077 30.0<br />
19 NEW YORK NY, US (JFK) 1 343 114 17.4<br />
20 BANGKOK, TH (BKK) 1 310 146 25.3<br />
21 GUANGZHOU, CN (CAN) 1 144 458 19.8<br />
22 INDIANAPOLIS IN, US (IND) 947 279 5.2<br />
23 NEWARK NJ, US (EWR) 854 750 9.6<br />
24 SHENZHEN, CN (SZX) 809 363 33.6<br />
25 TOKYO, JP (HND) 804 995 1.9<br />
26 OSAKA, JP (KIX) 759 278 24.7<br />
27 LUXEMBOURG, LU (LUX) 705 370 12.2<br />
28 KUALA LUMPUR, MY (KUL) 697 015 15.6<br />
29 MUMBAI, IN (BOM) 671 238 18.5<br />
30 ATLANTA GA, US (ATL) 659 129 17.0<br />
.<br />
- END -<br />
<strong>ACI</strong> <strong>World</strong> Headquarters | PO Box 302 | 800 Rue du Square Victoria | Montreal, Quebec H4Z 1G8 | Canada<br />
aci@aci.aero | www.aci.aero | Tel: +1 514 373 1200<br />
9