Aberdeen UK OEIC Fund Range - Aberdeen Asset Management
Aberdeen UK OEIC Fund Range - Aberdeen Asset Management
Aberdeen UK OEIC Fund Range - Aberdeen Asset Management

Create successful ePaper yourself
Turn your PDF publications into a flip-book with our unique Google optimized e-Paper software.
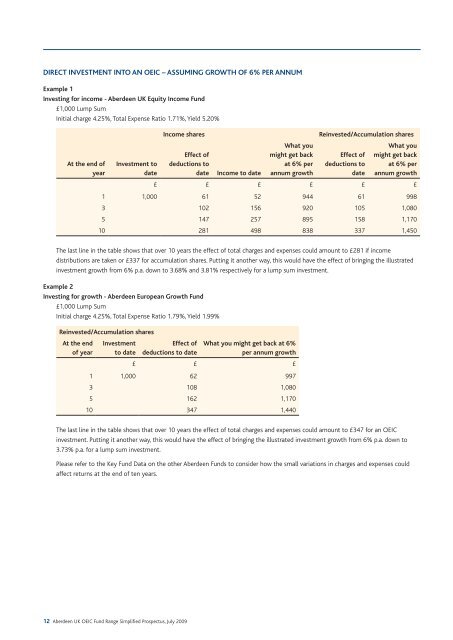
DIRECT INVESTMENT INTO AN <strong>OEIC</strong> – ASSUMING GROWTH OF 6% PER ANNUM<br />
Example 1<br />
Investing for income - <strong>Aberdeen</strong> <strong>UK</strong> Equity Income <strong>Fund</strong><br />
£1,000 Lump Sum<br />
Initial charge 4.25%, Total Expense Ratio 1.71%, Yield 5.20%<br />
At the end of<br />
year<br />
Investment to<br />
date<br />
Income shares<br />
Effect of<br />
deductions to<br />
date<br />
Income to date<br />
What you<br />
might get back<br />
at 6% per<br />
annum growth<br />
Reinvested/Accumulation shares<br />
Effect of<br />
deductions to<br />
date<br />
What you<br />
might get back<br />
at 6% per<br />
annum growth<br />
£ £ £ £ £ £<br />
1 1,000 61 52 944 61 998<br />
3 102 156 920 105 1,080<br />
5 147 257 895 158 1,170<br />
10 281 498 838 337 1,450<br />
The last line in the table shows that over 10 years the effect of total charges and expenses could amount to £281 if income<br />
distributions are taken or £337 for accumulation shares. Putting it another way, this would have the effect of bringing the illustrated<br />
investment growth from 6% p.a. down to 3.68% and 3.81% respectively for a lump sum investment.<br />
Example 2<br />
Investing for growth - <strong>Aberdeen</strong> European Growth <strong>Fund</strong><br />
£1,000 Lump Sum<br />
Initial charge 4.25%, Total Expense Ratio 1.79%, Yield 1.99%<br />
Reinvested/Accumulation shares<br />
At the end<br />
of year<br />
Investment<br />
to date<br />
Effect of<br />
deductions to date<br />
What you might get back at 6%<br />
per annum growth<br />
£ £ £<br />
1 1,000 62 997<br />
3 108 1,080<br />
5 162 1,170<br />
10 347 1,440<br />
The last line in the table shows that over 10 years the effect of total charges and expenses could amount to £347 for an <strong>OEIC</strong><br />
investment. Putting it another way, this would have the effect of bringing the illustrated investment growth from 6% p.a. down to<br />
3.73% p.a. for a lump sum investment.<br />
Please refer to the Key <strong>Fund</strong> Data on the other <strong>Aberdeen</strong> <strong>Fund</strong>s to consider how the small variations in charges and expenses could<br />
affect returns at the end of ten years.<br />
12 <strong>Aberdeen</strong> <strong>UK</strong> <strong>OEIC</strong> <strong>Fund</strong> <strong>Range</strong> Simplified Prospectus, July 2009