Integration of measurements and model simulations to ... - NILU
Integration of measurements and model simulations to ... - NILU
Integration of measurements and model simulations to ... - NILU

Create successful ePaper yourself
Turn your PDF publications into a flip-book with our unique Google optimized e-Paper software.
10008 M. R. Perrone et al.: April 2010 Eyjafjallajökull volcanic aerosols over south-eastern Italy<br />
dV(r)/dln r (µm 3 /µm 2 )<br />
0.05<br />
0.04<br />
0.03<br />
0.02<br />
0.01<br />
20/04<br />
14:15 UTC<br />
15:43 UTC<br />
(a)<br />
dM/dLog(r) ( 10 5 µg/m 2 )<br />
1.0<br />
0.8<br />
0.6<br />
0.4<br />
0.2<br />
FLEXPART<br />
11:30 UTC<br />
14:30 UTC<br />
dM A-B /dLog(r)<br />
14:49 UTC<br />
0.00<br />
5 6 7 8 9<br />
0.1<br />
2 3 4 5 6 7 8 9<br />
1<br />
2 3 4 5 6 7 8 9<br />
10<br />
0.0<br />
5 6 7 8 9<br />
0.1<br />
2 3 4 5 6 7 8 9<br />
1<br />
2 3 4 5 6 7 8 9<br />
10<br />
dV(r)/dln r (µm 3 /µm 2 )<br />
0.05<br />
0.04<br />
0.03<br />
0.02<br />
0.01<br />
21/04<br />
06:46 UTC<br />
14:49 UTC<br />
16:11 UTC<br />
(b)<br />
Radius (µm)<br />
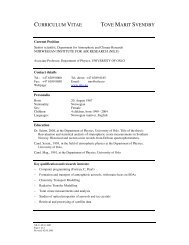
Figure 8 (M. R. Perrone et al.)<br />
Fig. 8. Columnar mass size distribution <strong>of</strong> volcanic particles inferred<br />
from the AERONET volume size distribution retrieved at<br />
14:49 UTC on 21 April, by setting the particle mass density for<br />
volcanic particles ρ = 3.0 g cm −3 (solid line). Columnar mass<br />
size distribution <strong>of</strong> volcanic ash from FLEXPART <strong>simulations</strong> at<br />
11:30 UTC (dotted line) <strong>and</strong> 14:30 UTC (dashed line) on 21 April<br />
2010.<br />
dV(r)/dln r (µm 3 /cm 3 )<br />
0.00<br />
14<br />
12<br />
10<br />
8<br />
6<br />
4<br />
2<br />
0<br />
5 6 7 8 9<br />
0.1<br />
2 3 4 5 6 7 8 9<br />
1<br />
2 3 4 5 6 7 8 9<br />
10<br />
Radius ( µm)<br />
5 6 7 8 9<br />
0.1<br />
2 3 4 5 6 7 8 9<br />
1<br />
2 3 4 5 6 7 8 9<br />
10<br />
Radius ( µm)<br />
21/04<br />
16:11 UTC<br />
14:49 UTC<br />
Fig. 7. Volume size distributions retrieved from AERONET sun/sky<br />
pho<strong>to</strong>meter <strong>measurements</strong> performed at different daytime hours <strong>of</strong><br />
(a) 20 <strong>and</strong> (b) 21 April 2010. (c) Volume size distributions retrieved<br />
at the ground level from Aerodynamic Particle Sizer (APS 3321,<br />
TSI) <strong>measurements</strong> performed on 21 April 2010 at different daytime<br />
hours.<br />
r > 1 µm revealed by Fig. 7c was likely due <strong>to</strong> the impact <strong>of</strong><br />
volcanic aerosol at ground. In situ <strong>measurements</strong> performed<br />
by Lettino et al. (2012) over southern Italy <strong>and</strong> by Rossini<br />
et al. (2012) over central Italy have also revealed the surface<br />
impact <strong>of</strong> volcanic particles with radius r > 1 µm.<br />
PM 1 (particles with an aerodynamic diameter ≤ 1 µm) <strong>and</strong><br />
PM 2.5 (particles with an aerodynamic diameter ≤ 2.5 µm)<br />
samples were also collected at the lidar site from 21 <strong>to</strong> 24<br />
April. Mass concentrations <strong>of</strong> daily PM 1 <strong>and</strong> PM 2.5 samples<br />
revealed that the PM 1 /PM 2.5 mass ratios were 0.69, 0.66, <strong>and</strong><br />
0.60 on 20, 21, <strong>and</strong> 22 April, respectively, indicating that the<br />
contribution <strong>of</strong> particles with radius > 1 µm increased from<br />
21 <strong>to</strong> 22 April, in accordance with the daily evolution <strong>of</strong> the<br />
AERONET fine mode fraction.<br />
(c)<br />
Surface in situ SO 2 <strong>and</strong> PM 10 <strong>measurements</strong> performed by<br />
the Regional Air Quality Agency (http://www.arpa.puglia.it/<br />
web/guest/qariainq) have been analyzed <strong>to</strong> infer the volcanic<br />
aerosol effects on regional scale. Enhanced PM 10 <strong>and</strong> SO 2<br />
concentrations were moni<strong>to</strong>red all over south-eastern Italy<br />
from 20 <strong>to</strong> 22 April 2010. Table 2 reports the daily PM 10<br />
mass concentrations moni<strong>to</strong>red from 19 <strong>to</strong> 23 April 2010, at<br />
10 sites <strong>of</strong> the 400 km long Apulia Region (Fig. 9), in addition<br />
<strong>to</strong> the average value (avg) over all sites. Uncertainties <strong>of</strong><br />
PM 10 values are smaller than 5 %. Yearly mean (Y-M) mass<br />
Figure 7 (M. R. concentrations Perrone et al.) ± 1 st<strong>and</strong>ard deviation (SD) <strong>and</strong> site type definition<br />
are also provided in the last two columns <strong>of</strong> Table 2.<br />
The largest PM 10 mass concentrations were moni<strong>to</strong>red on 21<br />
April at all sites (within experimental uncertainties), with the<br />
30<br />
exception <strong>of</strong> site A, the site furthest in the north, where the<br />
largest PM 10 level was reached on 20 April. These results<br />
suggest that the PM 10 enhancement was very likely due <strong>to</strong><br />
a large-scale pollution event, consistent with the arrival <strong>of</strong><br />
volcanic particles (Sect. 3.1). PM 10 levels larger than corresponding<br />
yearly-means were reached at most <strong>of</strong> the sites<br />
on 20 or 21 April. The inhomogeneous structure <strong>of</strong> the volcanic<br />
particle cloud was likely responsible for the variability<br />
<strong>of</strong> the PM 10 enhancement found at different sites. Enhanced<br />
PM 10 mass concentrations were found all over Europe when<br />
the volcanic ash cloud was present (e.g. Schäfer et al., 2011;<br />
Emeis et al., 2011). PM 10 averaged values reported in Table<br />
2 show that the mean PM 10 mass concentrations in the<br />
Apulia region increased by 4, 9, <strong>and</strong> 5 µg m −3 (or by 22, 50,<br />
31<br />
Atmos. Chem. Phys., 12, 10001–10013, 2012<br />
www.atmos-chem-phys.net/12/10001/2012/