
You also want an ePaper? Increase the reach of your titles
YUMPU automatically turns print PDFs into web optimized ePapers that Google loves.
BUSINESS DIGEST: AUGUST STATISTICS<br />
Airline Codes<br />
BI Royal Brunei Airlines MH Malaysia Airlines<br />
BR EVA Airlines<br />
NH All Nippon Airways<br />
CI China Airlines OZ Asiana Airlines<br />
CX Cathay Pacific PR Philippine Airlines<br />
GA Garuda<br />
SQ Singapore Airlines<br />
JL Japan Airlines TG Thai Airways Int’l<br />
KE Korean Airlines VN Vietnam Airlines<br />
KA Dragonair<br />
Percentage<br />
Percentage Points Change<br />
(Aug 05 vs Aug 04)<br />
(Aug 05 vs Aug 04)<br />
Percentage<br />
Percentage Points Change<br />
(Sep 04-Aug 05 vs Sep 03-Aug 04) (Sep 04-Aug 05 vs Sep 03-Aug 04)<br />
30%<br />
25%<br />
20%<br />
15%<br />
10%<br />
5%<br />
0%<br />
-5%<br />
-10%<br />
-15%<br />
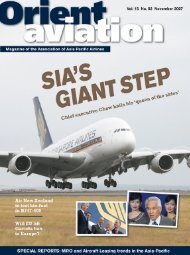
RPK Growth by Carrier<br />
-20%<br />
BI BR CI CX GA JL KA KE MH NH OZ PR SQ TG VN<br />
6<br />
5<br />
4<br />
3<br />
2<br />
1<br />
0<br />
-1<br />
-2<br />
-3<br />
-4<br />
-5<br />
-6<br />
Passenger Load Factor<br />
Growth by Carrier<br />
BI BR CI CX GA JL KA KE MH NH OZ PR SQ TG VN<br />
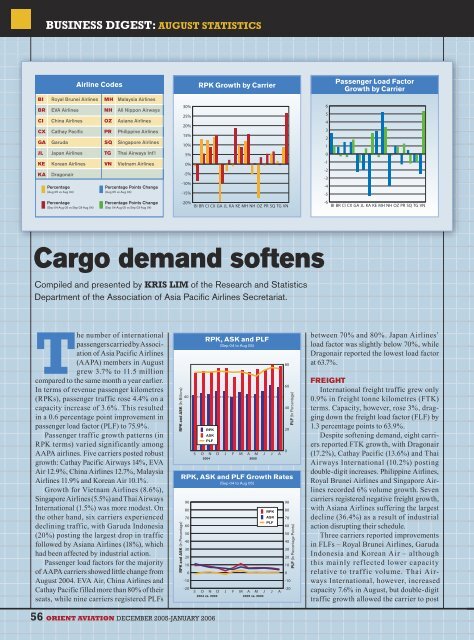
Cargo demand softens<br />
Compiled and presented by KRIS LIM of the Research and Statistics<br />
Department of the Association of Asia Pacific Airlines Secretariat.<br />
The number of international<br />
passengers carried by Association<br />
of Asia Pacific Airlines<br />
(AAPA) members in August<br />
grew 3.7% to 11.5 million<br />
compared to the same month a year earlier.<br />
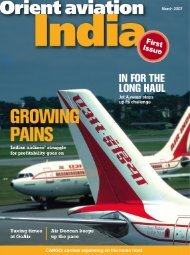
In terms of revenue passenger kilometres<br />
(RPKs), passenger traffic rose 4.4% on a<br />
capacity increase of 3.6%. This resulted<br />
in a 0.6 percentage point improvement in<br />
passenger load factor (PLF) to 75.9%.<br />
Passenger traffic growth patterns (in<br />
RPK terms) varied significantly among<br />
AAPA airlines. Five carriers posted robust<br />
growth: Cathay Pacific Airways 14%, EVA<br />
Air 12.9%, China Airlines 12.7%, Malaysia<br />
Airlines 11.9% and Korean Air 10.1%.<br />
Growth for Vietnam Airlines (8.6%),<br />
Singapore Airlines (5.5%) and Thai Airways<br />
International (1.5%) was more modest. On<br />
the other hand, six carriers experienced<br />
declining traffic, with Garuda Indonesia<br />
(20%) posting the largest drop in traffic<br />
followed by Asiana Airlines (18%), which<br />
had been affected by industrial action.<br />
Passenger load factors for the majority<br />
of AAPA carriers showed little change from<br />
August 2004. EVA Air, China Airlines and<br />
Cathay Pacific filled more than 80% of their<br />
seats, while nine carriers registered PLFs<br />
RPK and ASK (In Billions)<br />
RPK and ASK (In Percentage)<br />
40<br />
RPK, ASK and PLF Growth Rates<br />
(Sep 04 to Aug 05)<br />
90<br />
80<br />
70<br />
60<br />
50<br />
40<br />
30<br />
20<br />
10<br />
0<br />
-10<br />
-20<br />
S<br />
RPK, ASK and PLF<br />
(Sep 04 to Aug 05)<br />
RPK<br />
ASK<br />
PLF<br />
O N<br />
2004<br />
D<br />
J<br />
A M<br />
2005<br />
S O N D J F M A M J<br />
2004 vs. 2003 2005 vs. 2004<br />
F<br />
M<br />
J<br />
J<br />
RPK<br />
ASK<br />
PLF<br />
J<br />
A<br />
A<br />
80<br />
60<br />
40<br />
20<br />
0<br />
90<br />
80<br />
70<br />
60<br />
50<br />
40<br />
30<br />
20<br />
10<br />
0<br />
-10<br />
-20<br />
PLF (In Percentage)<br />
PLF (In Percentage Points)<br />
between 70% and 80%. Japan Airlines’<br />
load factor was slightly below 70%, while<br />
Dragonair reported the lowest load factor<br />
at 63.7%.<br />
FREIGHT<br />
International freight traffic grew only<br />
0.9% in freight tonne kilometres (FTK)<br />
terms. Capacity, however, rose 3%, dragging<br />
down the freight load factor (FLF) by<br />
1.3 percentage points to 63.9%.<br />
Despite softening demand, eight carriers<br />
reported FTK growth, with Dragonair<br />
(17.2%), Cathay Pacific (13.6%) and Thai<br />
Airways International (10.2%) posting<br />
double-digit increases. Philippine Airlines,<br />
Royal Brunei Airlines and Singapore Airlines<br />
recorded 6% volume growth. Seven<br />
carriers registered negative freight growth,<br />
with Asiana Airlines suffering the largest<br />
decline (36.4%) as a result of industrial<br />
action disrupting their schedule.<br />
Three carriers reported improvements<br />
in FLFs – Royal Brunei Airlines, Garuda<br />
Indonesia and Korean Air – although<br />
this mainly ref lected lower capacity<br />
relative to traffic volume. Thai Airways<br />
International, however, increased<br />
capacity 7.6% in August, but double-digit<br />
traffic growth allowed the carrier to post<br />
56 ORIENT AVIATION DECEMBER 2005-JANUARY 2006


![OAMag-V7N4-Cover [Converted] - Orient Aviation](https://img.yumpu.com/48598575/1/190x255/oamag-v7n4-cover-converted-orient-aviation.jpg?quality=85)