sSWoo
sSWoo
sSWoo

Create successful ePaper yourself
Turn your PDF publications into a flip-book with our unique Google optimized e-Paper software.
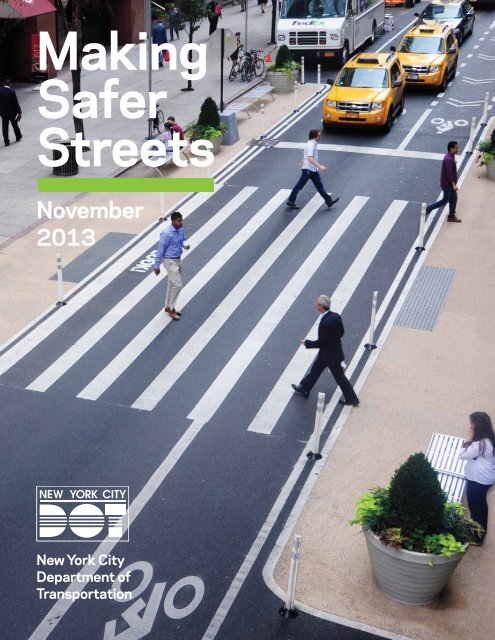
Making<br />
Safer<br />
Streets<br />
November<br />
2013<br />
New York City<br />
Department of<br />
Transportation<br />
A
Contents<br />
i<br />
Introduction<br />
ii<br />
Street Design and Traffic Safety<br />
1<br />
Make the Street Easy to Use<br />
Accommodate desire lines<br />
Minimize complexity for each user<br />
2<br />
Create Safety in Numbers<br />
Draw users together<br />
Create platoons of vehicles<br />
3<br />
Make the Invisible Visible<br />
Put people where they can see each other<br />
4<br />
Choose Quality Over Quantity<br />
Substitute two good lanes for three poor lanes<br />
Simplify complex intersections<br />
5<br />
Look Beyond the (Immediate) Problem<br />
Expand the focus area<br />
B<br />
New York City Department of Transportation
Introduction<br />
Over the past decade, New York City has seen a 30%<br />
decline in traffic fatalities, the lowest level since<br />
records were first kept in 1910, making New York<br />
City’s streets the safest of any big city in the United<br />
States.<br />
NYCDOT is committed to continuing to improve the<br />
safety of our streets, with a goal of cutting traffic<br />
fatalities in half by 2030.<br />
Making streets safer requires more than the tradit ional<br />
“3 Es” of engineering, education, and enforcement.<br />
It also requires working closely with local communities<br />
to collaboratively plan changes in how streets are<br />
designed and operated. And it requires learning from<br />
our successes to identify and implement the most<br />
effective approaches to street design.<br />
This report focuses on how smart and innovative street<br />
design can dramatically improve the safety of our<br />
streets. The results reported here are based on “before<br />
and after” comparisons of crash data for projects<br />
implemented in the last seven years. This analysis<br />
is the largest examination of the safety effects<br />
of innovative roadway engineering conducted in a<br />
major American city, or perhaps any city globally.<br />
This detailed quantitative analysis is possible only<br />
because of the breadth of innovation that NYCDOT<br />
has brought to NYC streets, and the community<br />
support these changes have garnered. The City and<br />
its residents can use these results to continue to work<br />
collaboratively to make safer streets throughout the<br />
five boroughs.<br />
This report<br />
• Focuses on how street redesigns<br />
can dramatically improve safety for<br />
all users.<br />
• Presents quantitative assessment<br />
of projects based on before and<br />
after comparisons of crash data of<br />
projects implemented by the agency<br />
in the last seven years.<br />
• Contains results that, for the first<br />
time, are based on a large number<br />
of projects involving a range of<br />
street redesigns, in a NYC-specific<br />
context.<br />
• Highlights how signals, street<br />
geometry, markings, and signs can be<br />
used to make streets function better<br />
and more safely, and improve not only<br />
safety but also the attractiveness and<br />
usability of the street for pedestrians,<br />
drivers, and cyclists.<br />
• Illustrates benefits of NYCDOT’s<br />
innovative approach to street reengineering<br />
using protected bicycle<br />
paths, dedicated lanes for buses,<br />
through traffic and turns, signal timing<br />
changes, network redesigns, and<br />
other treatments.<br />
2 New York City Department of Transportation<br />
3
4817 4694<br />
4362 4311<br />
Making Safer Streets<br />
Street Design & Traffic Safety<br />
Street Design & Traffic Safety<br />
In large part due to new street designs, the last decade<br />
has witnessed steady declines in the number of people<br />
killed or seriously injured in traffic crashes in NYC:<br />
• 30% decline in fatalities since 2001. (See Figure 1)<br />
• 29% decline in people killed or severely injured since<br />
2001. (See Figure 2)<br />
• 1,000 NYC lives have been saved by the decrease in<br />
traffic fatalities since 2001—including pedestrians,<br />
bicyclists, motorcyclists, drivers, and passengers<br />
As NYCDOT projects were completed, agency planners<br />
were able to evaluate the effectiveness of each project<br />
on a broad range of metrics, including traffic safety.<br />
The agency thus began to build a base of experience<br />
with quantitative results specific to NYC. These<br />
results are shared with the public through NYCDOT’s<br />
Sustainable Streets Index report, which each year<br />
since 2009 has profiled a dozen major projects on a<br />
range of evaluation metrics including before and after<br />
crash histories.<br />
The fundamental characteristic of the successful<br />
projects is that they create the opportunity for drivers,<br />
pedestrians, and cyclists to move through the street<br />
network simply and easily, minimizing the unexpected,<br />
the confusing, and the potential for surprises.<br />
In 2010, NYCDOT released a comprehensive<br />
Pedestrian Safety Study & Action Plan. The plan<br />
identified the need to concentrate efforts along major<br />
corridors and at complex intersections where serious<br />
crashes are most prevalent.<br />
Until NYCDOT began to systematically evaluate<br />
its re-engineering efforts, there was relatively little<br />
data available, locally or nationally, showing the<br />
effectiveness of projects that combined traffic<br />
engineering and the newer traffic calming techniques,<br />
particularly in large, dense urban street networks like<br />
that of NYC.<br />
This report builds on the approach of the Sustainable<br />
Streets Index, but with a broader set of projects, and<br />
focusing specifically on projects that have shown<br />
significant reductions in crashes that involve personal<br />
injuries. The resulting set of projects is quite diverse,<br />
ranging from complete street corridor and intersection<br />
redesigns to installation of targeted treatments.<br />
Table 1 (p. 6) shows reductions in injury crashes for a<br />
large sample of NYCDOT projects. Crash reductions<br />
vary widely — from 12% to 88%, based on comparing<br />
crash levels for three years prior to implementation<br />
with two to three years of “after” data. The broad<br />
FIGURE 1<br />
Traffic fatalities in<br />
New York City<br />
Please note that the 2013 data<br />
is year to date (through Sept). The<br />
2012 data in light green indicates<br />
the number of fatalities last year<br />
at the same time.<br />
Full Year<br />
Partial Year<br />
400<br />
350<br />
300<br />
250<br />
200<br />
150<br />
100<br />
50<br />
393<br />
386<br />
362<br />
297<br />
321 324<br />
274<br />
291<br />
258<br />
271<br />
246<br />
277<br />
218<br />
209<br />
0<br />
2001<br />
2002<br />
2003<br />
2004<br />
2005<br />
2006<br />
2007<br />
2008<br />
2009<br />
2010<br />
2011<br />
2012 2013<br />
Source: NYPD / NYCDOT Fatality Database<br />
FIGURE 2<br />
People Killed or<br />
Severely Injured<br />
7000<br />
6000<br />
5000<br />
5897<br />
6268<br />
5831<br />
5162<br />
4947<br />
5202<br />
4000<br />
4044 4203<br />
3000<br />
2000<br />
1000<br />
0<br />
2001<br />
2002<br />
2003<br />
2004<br />
2005<br />
2006<br />
2007<br />
2008<br />
2009<br />
2010<br />
2011 2012<br />
Source: NYPD/NYCDOT Fatality Database and NYSDOT/ALIS Crash Database as of mid-October 2013<br />
4 New York City Department of Transportation<br />
5
Making Safer Streets<br />
Street Design & Traffic Safety<br />
TABLE 1<br />
Reductions in crashes with injuries and/or fatalities<br />
Comparison of annualized crash rates for three years prior to project implementation and two to three years after.<br />
Year Borough Project Reduction in<br />
crashes w/<br />
injuries<br />
2007 Bk 9th St, Prospect Park West to Hamilton Ave: 4-to-3 conversion with bike lanes -19%<br />
2007 Bx Southern Blvd, Boston Rd to Bronx Park South: bike lanes -28%<br />
2007 Mn 9th Ave, W 14th to W 16th: pedestrian plaza, network redesign -46%<br />
2007 Mn 9th Ave, W 16th St to W 23rd St: bike path -52%<br />
2007 Qn Jewel Ave, 164th St to Main St: 4-to-2 conversion with bike lanes and median -37%<br />
2008 Bk Vanderbilt Ave, Atlantic Ave to Grand Army Plaza: bike lanes and pedestrian safety islands -15%<br />
2008 Bx Bronx Hub, Intersection of 3rd Ave, Willis Ave, Melrose Ave, and E 149th St: pedestrian plaza, network<br />
redesign with pedestrian safety islands<br />
2008 Bx Lafayette Ave, Underhill Ave to Newman Ave: 4-to-3 conversion with pedestrian safety islands -24%<br />
2008 Mn 8th Ave, Bank St to W 23rd St: bike path -20%<br />
2008 Mn 9th Ave, W 31st St to W 23rd St: bike path -44%<br />
2008 Mn Broadway, W 42nd St to W 35th St: bike path, pedestrian plazas -32%<br />
2008 Mn Madison Square, Intersection of Broadway, 5th Ave and 23rd St: pedestrian plazas, network redesign -34%<br />
2008 Mn Park Ave & E 33rd St: network redesign with pedestrian safety islands -88%<br />
2008 Mn Park Ave & E 40th St: network redesign with pedestrian safety islands -57%<br />
2008 Qn Bowne St, Northern Blvd to Sanford Ave: 3-to-2 conversion with pedestrian safety islands -23%<br />
2009 Bk Gerritsen Ave, Whitney Ave to Nostrand Ave: 4-to-3 conversion, wide parking lanes & pedestrian safety islands -40%<br />
2009 Bk Park Circle: network redesign with pedestrian safety islands -27%<br />
2009 Bx Allerton Ave, Boston Rd to E. Gun Hill Rd: 4-to-3 conversion with bike lanes and pedestrian safety islands -28%<br />
2009 Mn Allen & Pike Sts: bike path, pedestrian plazas, network redesign -18%<br />
2009 Mn Green Light for Midtown, Broadway from W 59th St to W 26th St: pedestrian plazas and network redesign -24%<br />
2009 Qn Jackson Ave & Pulaski Br: network redesign with pedestrian safety islands -63%<br />
2010 Bk West 6th St, 65th St to 86th St: 4-to-3 conversion with wide parking lanes and islands -31%<br />
-17%<br />
range reflects the diversity of both street conditions<br />
and project attributes. The largest reductions in<br />
crashes are generally achieved in projects where<br />
the redesigns were most extensive, where causes<br />
of crashes were most susceptible to safety reengineering,<br />
and often where the problems were<br />
worse — i.e., higher crash areas.<br />
Designing streets to accommodate cycling has also had<br />
a notable effect on safety (see Figure 3). Since 2000,<br />
there has been a 72% decrease in the average risk of<br />
serious injury experienced by cyclists in NYC, while the<br />
number of trips by bike has nearly tripled. During this<br />
period, over 470 lane miles of bicycle routes were added<br />
to NYC streets, many using advanced bicycle facility<br />
design including parking protected paths, mixing zones,<br />
and bicycle signals. These designs along with simply<br />
providing an interconnected network along popular<br />
routes have led to reduced risk. The increased presence<br />
of cyclists on the streets also enhances safety. Since the<br />
launch of Citi Bike in May, cycling within the area served<br />
by Citi Bike has spiked by 25% with over 5 million Citi<br />
Bike rides to date. Meanwhile, the number of cyclist<br />
fatalities in NYC, year to date, is lower in 2013 than<br />
any year since record keeping began in 1983.<br />
By looking across this diverse set of projects, it is<br />
possible to start to draw conclusions about what<br />
approaches are most successful in improving traffic<br />
safety. The fundamental characteristic of the<br />
successful projects, whether large or small, is that<br />
they create the opportunity for all users — drivers,<br />
pedestrians, and cyclists — to move through the<br />
street network simply and easily, providing clear<br />
paths that get them where they want to go, minimizing<br />
the unexpected, the confusing, and the potential<br />
for surprises. By addressing issues of complexity,<br />
confusion, lack of visibility of vulnerable street users,<br />
and excessive vehicular speeds which are most<br />
likely to cause death or severe injury, the projects<br />
highlighted in the study reduce the risk of crashes.<br />
In tackling these issues, safety projects also make<br />
streets into attractive places where people are<br />
comfortable and want to be. Safety measures thus<br />
also fundamentally serve the mobility, quality of life,<br />
and economic well-being of everyone, as well as the<br />
specific goal of traffic safety.<br />
2010* Bx Crames Square, Intersection of 163rd St, Southern Blvd and Hunts Point Ave: network redesign with<br />
pedestrian plaza and islands<br />
2010 Bx Randall Ave/Leggett Ave/Tiffany St: 4-to-3 conversion with bike lanes -23%<br />
2010* Bx Southern Blvd., Westchester Ave to 142nd St: 4-to-3 conversion with wide parking lanes and pedestrian<br />
safety islands<br />
2010* Mn 1st Ave, E 1st St to E 33rd St: bike path and select bus service -12%<br />
-24%<br />
-20%<br />
FIGURE 3<br />
New York City Cycling<br />
Risk<br />
400<br />
350<br />
369<br />
388<br />
2010* Mn Broadway, E 23rd St to E 17th St & Park Ave, E 17th St to E 14th St: network redesign with plaza -24%<br />
2010* Mn Central Park West and W 81st St: leading pedestrian interval -18%<br />
2010 Mn Water & Whitehall Sts: network redesign with pedestrian plaza -20%<br />
2010* Qn Hoyt Ave at RFK Bridge: network redesign and pedestrian enhancements -33%<br />
Index of risk of serious injury to<br />
cyclists, taking into account bike<br />
volumes and number of crashes<br />
involving serious injury to cyclists<br />
300<br />
250<br />
2010* Qn Hoyt Ave South and 29th St: new signal and crosswalks -42%<br />
2011* Bk Myrtle Ave, Flatbush Ave to Wyckoff Ave: off-peak signal timing -32%<br />
2011* Bx Grand Concourse, E 140th St to Mosholu Parkway: off-peak signal timing -14%<br />
2011* Bx Macombs Rd, University Ave to Jerome Ave: 4-to-3 conversion with wide parking lanes, islands and intersection<br />
redesigns<br />
2011* Mn 7th Ave and W 23rd St: intersection redesign -63%<br />
2011* Mn Columbus Ave, W 96th St to W 77th St: bike path -25%<br />
2011* Mn Madison Ave and E 135th St: intersection redesign -18%<br />
2011* Qn Vernon Blvd and 36th Ave: pedestrian island and median extension -19%<br />
*only two years of after data available<br />
-41%<br />
Source: NYPD AIS/TAMS Crash Database<br />
NYC In-Season Cycling Indicator:<br />
Based on weekday 12-hour counts<br />
taken between April and October<br />
at 6 key cycling locations, indexed<br />
to the year 2000 count: http://<br />
www.nyc.gov/html/dot/downloads/<br />
pdf/2013-nyc-cycling-in-the-city.pdf<br />
Cycling Risk Indicator<br />
In-Season Cycling Indicator<br />
200<br />
150<br />
100<br />
0<br />
100<br />
2000 2001 2002 2003 2004 2005 2006 2007 2008 2009 2010 2011 2012<br />
SOURCE: Bicyclist Fatalities: NYCDOT-NYPD Traffic Fatality Database as of mid-October 2013<br />
Bicyclist Severe Injuries: NYSDOT SIMS/ALIS Crash Database (Type A injuries reported in crashes involving bicycles.)<br />
102<br />
6 New York City Department of Transportation<br />
7
Making Safer Streets<br />
Making safer streets always requires traffic<br />
engineering expertise and judgment, and some<br />
aspects such as turning radii and traffic signal timing<br />
are quite technical in nature. However, key concepts<br />
to designing safer streets are actually quite simple<br />
and common-sense driven. The remaining sections<br />
of this report highlight five key ways to design<br />
safer streets. Each section includes a drawing that<br />
highlights the effect on street operations, provides<br />
examples of projects and crash reduction results<br />
where the approach was a key part of the design,<br />
and identifies traffic engineering and traffic calming<br />
treatments that are often used to put the concept<br />
into reality on the streets of the city.<br />
These concepts, summarized below, represent a<br />
distillation of NYCDOT’s experience with street<br />
design projects that have proven most effective in<br />
reducing crashes:<br />
• Make the street easy to use by accommodating<br />
desire lines and minimizing the complexity of driving,<br />
walking, and biking, thus reducing crash risk by<br />
providing a direct, simple way to move through the<br />
street network.<br />
• Create safety in numbers, which makes vulnerable<br />
street users such as pedestrians and cyclists more<br />
visible. The same design principle, applied to arterial<br />
streets when traffic is light, reduces the opportunity<br />
for excessive speeds.<br />
• Make the invisible visible by putting users where<br />
they can see each other.<br />
• Choose quality over quantity so that roadway and<br />
intersection geometries serve the first three design<br />
principles.<br />
• Look beyond the (immediate) problem by<br />
expanding the focus area if solutions at a particular<br />
location can’t be addressed in isolation.<br />
8 New York City Department of Transportation<br />
9
Making Safer Streets<br />
Make the Street Easy to Use: Results<br />
Make the Street Easy to Use<br />
Difficulty and complexity increase risks on busy city<br />
streets. Streets that are easy to use reduce that risk<br />
and make for a safer, more attractive experience.<br />
Accommodate Desire Lines<br />
Making a street easy to use starts with understanding<br />
what people want to do. A street should accommodate<br />
desire lines—how people actually want to move through<br />
a space. Users should be provided with a simple and<br />
clear path, with minimized complexity and without<br />
needing to go out of their way. Pathways for each<br />
movement and user can be clearly marked. Conflicting<br />
movements such as between pedestrians and vehicles<br />
can be separated, each given its own space and/or time<br />
for movement.<br />
MANHATTAN:<br />
7th Ave & W 23rd St<br />
Injury crashes down<br />
by 63%<br />
Treatments: 1, 2, 5,<br />
BEFORE<br />
AFTER<br />
BEFORE<br />
• Long indirect crosswalks<br />
• Undefined lanes for<br />
drivers<br />
• Long waits for green or<br />
walk because multiple<br />
legs of traffic each have a<br />
signal phase<br />
QUEENS:<br />
Jackson Ave &<br />
Pulaski Br<br />
Injury crashes down<br />
by 63%<br />
Treatments: 1, 3, 4, 5, 7<br />
MANHATTAN:<br />
Madison Ave &<br />
E 135th St<br />
Injury crashes down<br />
by 18%<br />
Treatments: 1, 2, 3, 4, 5,<br />
6, 7<br />
AFTER<br />
• Shorter pedestrian<br />
crossings<br />
• Lane designations show<br />
clear path for drivers<br />
• Shorter waits with low<br />
volume legs removed from<br />
main intersection<br />
Street Treatments<br />
often used with this<br />
strategy:<br />
1 Delayed Turning<br />
Allows through vehicles<br />
to move while holding<br />
turning vehicles, giving<br />
pedestrians a head start<br />
or a conflict free crossing<br />
4 Eliminate Movements<br />
Reduce number of<br />
movements entering a<br />
complicated intersection<br />
7 Crosswalks<br />
Add crosswalks where<br />
pedestrians want to<br />
cross<br />
2 Restrict Turns<br />
Remove difficult turns<br />
that cause conflicts and<br />
create opportunities for<br />
additional improvements<br />
5 Lane Designation<br />
Clarifies who belongs<br />
where<br />
3 Extend Medians<br />
Lengthen/widen existing<br />
medians to tighten up<br />
intersection<br />
6 Create Right Angle<br />
Intersections<br />
Slows vehicles turning<br />
into pedestrian crossings<br />
and shortens crossing<br />
distances<br />
10 New York City Department of Transportation<br />
11
Making Safer Streets<br />
Make the Street Easy to Use: Results<br />
Make the Street Easy to Use<br />
Minimize Complexity for Each User<br />
Complex intersections create difficulty for users<br />
and have a greater risk of crashes. Through design,<br />
complexity and the potential for conflict can be reduced.<br />
Well designed merges and transitions, signalized<br />
intersections, medians, clear lane assignments, and<br />
designated facilities for bicyclists all reduce complexity.<br />
QUEENS:<br />
Hoyt Ave South &<br />
29th St<br />
Injury crashes down<br />
by 42%<br />
Treatments: 1, 2, 4, 6<br />
BEFORE<br />
AFTER<br />
BEFORE<br />
• No defined lanes<br />
• Long unbroken crossings<br />
• No facilities for cyclists<br />
• Sidewalks end before<br />
reaching crosswalk<br />
BROOKLYN:<br />
Park Circle<br />
Injury crashes down<br />
by 27%<br />
Treatments: 1,2,3,4,5, 6<br />
QUEENS:<br />
Vernon Blvd &<br />
36th Ave<br />
Injury crashes down<br />
by 19%<br />
Treatments: 2, 3, 4, 5, 6<br />
AFTER<br />
• Median or pedestrian<br />
islands allow safer<br />
crossing and connection<br />
to crosswalk<br />
• Lane designation<br />
markings and signage<br />
directs users<br />
• Bike facility designates<br />
space for cyclists<br />
Street Treatments<br />
often used with this<br />
strategy:<br />
1 Clear Merges and<br />
Transitions<br />
By improving alignments<br />
and clearly marking merges<br />
driving is simplified<br />
4 Signals and Controls<br />
Adding control to an<br />
intersection for all users<br />
eliminates confusion<br />
2 Lane Designation<br />
Clarifies who belongs<br />
where<br />
5 Pedestrian Safety<br />
Islands<br />
Pedestrians wait midway<br />
through crossing the<br />
street. Shortens distance<br />
to cross at one time. Adds<br />
visual cues to presence<br />
of pedestrians. Beautifies<br />
corridor<br />
3 Bicycle paths and lanes<br />
Clearly designates the<br />
bicycle right of way<br />
6 Crosswalks<br />
Add crosswalks where<br />
pedestrians want to cross<br />
12 New York City Department of Transportation<br />
13
Making Safer Streets<br />
Create Safety in Numbers: Results<br />
Create Safety in Numbers<br />
Draw Users Together<br />
Perhaps the simplest way to improve safety for more<br />
vulnerable users is to increase their presence on the<br />
street. Encouraging these users toward a specific<br />
location makes their presence more predictable to<br />
drivers. Creating facilities that draws users is key to<br />
increasing these volumes.<br />
MANHATTAN:<br />
Columbus Ave, W<br />
96th St to W 77th St<br />
Injury crashes down<br />
by 25%<br />
Treatments:2, 4<br />
BEFORE<br />
AFTER<br />
BEFORE<br />
• Long indirect crosswalks<br />
lead to jaywalking<br />
• No defined spaces for<br />
cyclists<br />
• Undefined lane<br />
destination for drivers<br />
increases unpredictably<br />
MANHATTAN:<br />
Water St & Whitehall St<br />
Injury crashes down<br />
by 20%<br />
Treatments 3<br />
BROOKLYN:<br />
Vanderbilt Ave,<br />
Atlantic Ave to<br />
Grand Army Plaza<br />
Injury crashes down<br />
by 15%<br />
Treatment: 2, 4<br />
AFTER<br />
• Direct crosswalks reduce<br />
jaywalking<br />
• Hi-visibility crosswalks<br />
protect pedestrians at<br />
intersection<br />
• Bike lane attracts and<br />
organizes cyclists<br />
• Safety islands draw<br />
pedestrians to safe<br />
crossings<br />
• Clear lane designation for<br />
all users<br />
• New pedestrian amenities<br />
MANHATTAN:<br />
6 1/2 Ave<br />
Pedestrian/vehicle<br />
conflicts have been<br />
reduced to 5% vs. 95% in<br />
the before condition<br />
Treatments: 1, 2, 3, 4<br />
Street Treatments<br />
often used with<br />
this strategy:<br />
1 Midblock Crosswalks<br />
Provide midblock crossing<br />
close to desire lines<br />
4 Bicycle Facilities<br />
Makes cyclists feel<br />
comfortable and<br />
increases awareness and<br />
predictability<br />
2 Pedestrian Ramps and<br />
Safety Islands<br />
Provide access and waiting<br />
areas for pedestrians<br />
3 Pedestrian Plazas<br />
Draws pedestrians to<br />
specific zones and alerts<br />
drivers that pedestrians<br />
are present<br />
14 New York City Department of Transportation<br />
15
Making Safer Streets<br />
Create Safety in Numbers: Results<br />
Create Safety in Numbers<br />
Create platoons of vehicles<br />
Signal timing and phasing can be used in conjunction<br />
with street design to further this concept of increasing<br />
numbers to create a safer street. Timing can be used<br />
to create platoons that not only encourage vehicles<br />
to behave as a group but also creates clear gaps for<br />
pedestrians to cross the street and bicyclists to travel.<br />
Phasing can be used to platoon left turners, buses,<br />
and pedestrians to clarify movements and to give a<br />
head start or a separate phase.<br />
BROOKLYN:<br />
Myrtle Ave, Flatbush<br />
Ave to Wycoff Ave<br />
Injury crashes down<br />
by 32%<br />
Treatments: 1, 3<br />
BEFORE<br />
• Vehicles are randomly<br />
spaced<br />
• Speeding and weaving<br />
occurs as vehicles are<br />
more free to move about<br />
• Pedestrians and left<br />
turners conflict<br />
• Bikers and buses<br />
among unevenly spaced<br />
vehicles<br />
• Street feels chaotic and<br />
unpredictable<br />
MANHATTAN:<br />
Central Park West<br />
and W 81st St<br />
Injury crashes down<br />
by 18%<br />
Treatment: 2<br />
AFTER<br />
• Groups of cars with gaps<br />
in between<br />
• Turning vehicles wait as<br />
platoon of pedestrians<br />
get head start<br />
• Traffic is orderly and<br />
grouped<br />
• Signal queue jump<br />
allows bus to get ahead<br />
of platoon<br />
Street Treatments<br />
often used with this<br />
strategy:<br />
BRONX:<br />
Grand Concourse,<br />
E 140th St to<br />
Mosholu Pkwy<br />
Injury crashes down<br />
by 14%<br />
Treatments: 1, 3, 5<br />
1 Green Waves<br />
Keep drivers travelling<br />
in a platoon at a<br />
consistent speed of<br />
travel<br />
2 Leading Pedestrian<br />
Intervals<br />
Gives platoon of<br />
pedestrians a head<br />
start<br />
3 Off-Peak Signal<br />
Timing<br />
Reduces opportunity to<br />
speed<br />
4 Leading Bus Interval<br />
Gives buses a chance<br />
to get to ahead of the<br />
platoon<br />
5 Left Turn Phases<br />
Separate turning traffic<br />
from oncoming traffic<br />
and pedestrians<br />
16 New York City Department of Transportation<br />
17
Making Safer Streets<br />
Make the Invisible Visible: Results<br />
Make the Invisible Visible<br />
What you can’t see can, in fact, hurt you. The mutual<br />
visibility of pedestrian, drivers, and cyclists is key to<br />
ensuring safe passage through an intersection where<br />
their paths cross.<br />
Put people where they can see each other<br />
Street design can greatly enhance visibility of all<br />
users. People should be moved into positions where<br />
they can see one another. Visual cues can call<br />
attention to the potential presence of user, or to slow<br />
drivers as they navigate a non-typical streetscape.<br />
When all else fails the invisible movement can be<br />
investigated for elimination.<br />
MANHATTAN:<br />
Park Ave & E 33rd St<br />
Injury crashes down<br />
by 88%<br />
Treatments: 2, 3, 4, 6<br />
BEFORE<br />
AFTER<br />
BEFORE<br />
• Sight lines for turning<br />
vehicles is impeded by<br />
parked cars<br />
• Bicyclists and<br />
pedestrians who have<br />
right of way are not fully<br />
visible<br />
• Not predictable<br />
whether traffic will turn<br />
or continue straight<br />
• Street can feel<br />
overwhelming<br />
MANHATTAN:<br />
Allen and Pike Sts,<br />
Houston St to South St<br />
Injury crashes down<br />
by 18%<br />
Treatments: 3, 4, 5, 6<br />
MANHATTAN:<br />
1st Ave, E 1st St to E<br />
33rd St<br />
Injury crashes down<br />
by 12%<br />
Treatments: 1, 2, 3, 4, 5<br />
AFTER<br />
• Bikers and turning<br />
vehicles share<br />
curbside lanes to<br />
increase visibility and<br />
predictability<br />
• Daylighting with<br />
extensions increases<br />
visibility for pedestrians<br />
• Street feels manageable<br />
and predictable<br />
Street Treatments<br />
often used with<br />
this strategy:<br />
1 Mixing Zones<br />
Increases visibility<br />
between drivers, cyclists,<br />
and pedestrians<br />
4 Pedestrian Safety<br />
Islands<br />
Pedestrians wait midway<br />
through crossing the<br />
street. Shortens distance<br />
to cross at one time.<br />
Adds visual cues to<br />
presence of pedestrians.<br />
Beautifies corridor<br />
2 Daylighting<br />
Improves visibility<br />
between drivers and<br />
pedestrians in the<br />
crosswalk<br />
5 Leading Pedestrian<br />
Interval<br />
Pedestrian walk signal<br />
proceeds green for<br />
turning movement to give<br />
peds a head start<br />
3 Curb Extensions<br />
Brings pedestrians into<br />
sightline of drivers,<br />
shortens crossing<br />
distances<br />
6 Eliminate Unsafe<br />
Movements<br />
When it is clear that a<br />
specific action is causing<br />
a majority of accidents,<br />
efforts should be made to<br />
eliminate the movement.<br />
18 New York City Department of Transportation<br />
19
Making Safer Streets<br />
Choose Quality Over Quantity: Results<br />
Choose Quality Over Quantity<br />
New York City streets have many demands placed on<br />
them. These demands evolve over time. If the street<br />
is not updated to serve current needs, chaotic<br />
conditions can prevail. By clearly marking what part of<br />
the street should serve each use, and prioritizing the<br />
most important uses, streets can work better and<br />
be safer.<br />
Substitute two good lanes for three poor lanes<br />
Travel lanes are only truly effective when they can<br />
function without disruption. In many cases, a road with<br />
numerous undesignated lanes can get congested due<br />
to double parking and/or turning occurring in what is<br />
supposed to be a through lane. By designating space<br />
for other roadway actions, the through lanes, while<br />
reduced, can function more efficiently.<br />
BROOKLYN:<br />
Gerritsen Ave,<br />
Whitney Ave to<br />
Nostrand Ave<br />
Injury crashes down<br />
by 40%<br />
Treatments: 1, 2, 3<br />
BEFORE<br />
AFTER<br />
BEFORE<br />
• Drivers constantly<br />
change lanes to get<br />
around left turns and<br />
double-parked cars<br />
• Difficult to drive<br />
• Congested and<br />
unpredictable<br />
• Leads to rear-end and<br />
left turn crashes<br />
BRONX:<br />
Randall Ave/<br />
Leggett Ave/<br />
Tiffany St<br />
Injury crashes down<br />
by 23%<br />
Treatments: 1, 4<br />
BRONX:<br />
Southern Blvd,<br />
Westchester Ave to E<br />
142nd St<br />
Injury crashes down<br />
by 20%<br />
Treatments: 1, 2, 3<br />
AFTER<br />
• Through lanes are clear<br />
of turning and stopped<br />
vehicles<br />
• Easier to drive<br />
• Better traffic flow<br />
• Easier to anticipate<br />
drivers’ movements<br />
• Safer<br />
Street Treatments<br />
often used with<br />
this strategy:<br />
1 Dedicated left turn<br />
lanes<br />
Relieves pressure<br />
drivers may feel to make<br />
the turn too quickly or<br />
too soon<br />
4 Bike lanes<br />
Designates space for<br />
cyclists<br />
2 Wide parking lane<br />
Keeps double-parked<br />
cars from blocking the<br />
adjacent lane as well as<br />
allowing bike riders to<br />
travel outside traffic flow<br />
3 Pedestrian<br />
Safety Islands<br />
Pedestrians wait midway<br />
through crossing<br />
the street. Shortens<br />
distance to cross at one<br />
time. Adds visual cues to<br />
presence of pedestrians.<br />
Beautifies corridor<br />
20 New York City Department of Transportation<br />
21
Making Safer Streets<br />
Choose Quality Over Quantity: Results<br />
Choose Quality Over Quantity<br />
Simplify complex intersections<br />
There are many complex intersections throughout the<br />
city where streets meet at odd angles, particularly<br />
in the outer boroughs where neighborhood grids<br />
converge. These intersections often have approaches<br />
that can be diverted or completely removed, thus<br />
creating standard right-angle geometry and adding<br />
time for remaining movements.<br />
MANHATTAN:<br />
Madison Square<br />
Injury crashes down<br />
by 34%<br />
Treatments: 1, 4, 5<br />
BEFORE<br />
AFTER<br />
BEFORE<br />
• Large, multi leg<br />
intersection competes<br />
for signal time<br />
• Long indirect crosswalks<br />
• Pedestrians crossing<br />
along unprotected desire<br />
lines<br />
• No separation between<br />
vehicle movements<br />
MANHATTAN:<br />
Herald Square<br />
Injury crashes down<br />
by 25%<br />
Treatments: 1, 2, 3, 4, 5<br />
MANHATTAN:<br />
Times Square<br />
Injury crashes down<br />
by 20%<br />
Treatments: 1, 2, 3, 4, 5<br />
AFTER<br />
• Restricted turns<br />
• Some traffic approaches<br />
removed from main<br />
intersection with<br />
dividers or islands<br />
• Simplified signal timing<br />
• New shorter crossings<br />
that accommodate<br />
desire lines<br />
• New plaza space for<br />
pedestrians to enjoy<br />
and to enhance the<br />
local district.<br />
Bronx:<br />
Bronx Hub<br />
Injury crashes down<br />
by 17%<br />
Treatments: 1, 2, 3, 4, 5<br />
Street Treatments<br />
often used with<br />
this strategy:<br />
1 Network Change<br />
Redirect an approach of<br />
traffic to other parts of<br />
the local street network<br />
or forced turns at main<br />
intersection<br />
2 Turn Bans<br />
Relocate high conflict<br />
turns to lower demand<br />
intersections<br />
3 Removal of Low<br />
Volume Approach<br />
Completely remove<br />
approach from<br />
intersection<br />
4 Square Off<br />
Intersection<br />
Sharpen radii, reshape<br />
approaches to enter on<br />
better angle<br />
5 Public Space Creation<br />
Turn underutilized<br />
roadbed into public<br />
amenity<br />
22 New York City Department of Transportation<br />
23
Making Safer Streets<br />
Look Beyond the Problem: Results<br />
Look Beyond the Problem<br />
Expand the focus area<br />
Sometimes, even with careful analysis, it can be<br />
difficult to identify any solution to a particular problem<br />
location. Expanding a project area to include its local<br />
street network can unlock new possibilities. Looking<br />
beyond the intersection or corridor can help further<br />
improve the main project area. Intersection problems<br />
can often be addressed with corridor redesigns that<br />
reassess which movements need to be accommodated<br />
at which intersection.<br />
MANHATTAN:<br />
9th Ave, W 15th to<br />
W 14th St<br />
Injury crashes down<br />
by 46%<br />
Treatments: 1, 2, 3, 5<br />
BEFORE<br />
AFTER<br />
BEFORE<br />
• Large, complex<br />
intersection is difficult to<br />
navigate<br />
• Long waits because<br />
each traffic leg needs a<br />
signal phase<br />
• Poor connectivity along<br />
corridors leading to main<br />
intersection<br />
QUEENS:<br />
Hoyt Ave/Astoria<br />
Blvd/33rd St/31st St<br />
Injury crashes down<br />
by 33%<br />
Treatments: 2, 5<br />
MANHATTAN:<br />
Broadway, E 23rd to<br />
E 17th St & Park Ave,<br />
E 17th to E 14th St<br />
Injury crashes down<br />
by 24%<br />
Treatments: 1, 2, 4<br />
AFTER<br />
• Minimize presence of<br />
legs with lower volumes<br />
• Corridors leading into<br />
intersection are matched<br />
to volume they carry<br />
• Turn bans at intersection<br />
accommodated<br />
elsewhere in local<br />
network<br />
BRONX:<br />
Southern Blvd/<br />
Hunts Point<br />
Ave/163rd Street<br />
Injury crashes down<br />
by 24%<br />
Treatments: 1, 2 , 4, 5<br />
Street Treatments<br />
often used with<br />
this strategy:<br />
1 Network Change<br />
Redirect a leg of traffic<br />
to other parts of the<br />
local street network<br />
2 Turn Bans<br />
Relocate high conflict<br />
turns to lower demand<br />
intersections<br />
3 Signal Progression<br />
Changes<br />
Modify progression of<br />
signals on corridors<br />
heading into intersection<br />
to meter flow<br />
4 Road Diet<br />
Examine roadways<br />
leading to project<br />
area to ensure they<br />
are to scale with local<br />
neighborhood network<br />
5 Lane Designations and<br />
Signal Phasing<br />
Clarifies who belongs<br />
where and when each<br />
movement can operate<br />
24 New York City Department of Transportation<br />
25
Making Safer Streets<br />
New York City<br />
Department of<br />
Transportation<br />
Janette Sadik-Khan<br />
Commissioner<br />
Bruce Schaller<br />
Deputy Commissioner<br />
Traffic and Planning<br />
This report was developed by the New York City Department<br />
of Transportation’s Division of Traffic and Planning. Deputy<br />
Commissioner Bruce Schaller directed the report team which<br />
consisted of Assistant Commissioner Ryan Russo, Joshua Benson,<br />
Sean Quinn, Matthew Roe, and Seth Hostetter. Graphic design and<br />
production by Pure+Applied.<br />
Projects listed in this report were developed, designed, and<br />
implemented by various individuals and divisions across the DOT<br />
as well as in collaboration with other city and state agencies.<br />
Additionally, each project had the input and support of citizens,<br />
elected officials, and community boards. The final results can be<br />
considered a true team effort.<br />
Photography Credits: All images property of New York City Department of Transportation<br />
i
55 Water Street, 9th Floor<br />
New York, NY 10041<br />
nyc.gov/dot<br />
ii<br />
New York City Department of Transportation