Management of Salmon Fisheries in Iceland - The North Atlantic ...
Management of Salmon Fisheries in Iceland - The North Atlantic ...
Management of Salmon Fisheries in Iceland - The North Atlantic ...

Create successful ePaper yourself
Turn your PDF publications into a flip-book with our unique Google optimized e-Paper software.
IP(08)10<br />
<strong>Fisheries</strong> <strong>Management</strong> Focus Area Report<br />
<strong>Iceland</strong>
ICELAND<br />
<strong>Management</strong> <strong>of</strong> <strong>Salmon</strong> <strong>Fisheries</strong><br />
Focus Area Report<br />
(Draft)<br />
April 2008
Introduction<br />
<strong>The</strong> Council has asked each Party or jurisdiction to prepare a fisheries management focus<br />
area report to provide a more <strong>in</strong>-depth assessment <strong>of</strong>:<br />
- the measures already <strong>in</strong> place that address the NASCO agreements relat<strong>in</strong>g<br />
to fisheries management;<br />
- further actions proposed with<strong>in</strong> their Implementation Plans to meet these<br />
agreements;<br />
- progress with implement<strong>in</strong>g these actions.<br />
This report is a step <strong>in</strong> order to follow the NASCO agreement. For ease <strong>of</strong> review and<br />
standardization we decided to follow the guidel<strong>in</strong>es <strong>of</strong> the Ad Hoc review Group<br />
(CNL40.517) listed under headl<strong>in</strong>es 1-10 <strong>in</strong> this report. This report is <strong>in</strong>evitably<br />
considerably condensed but further details on various issues can be obta<strong>in</strong>ed from the<br />
<strong>Iceland</strong>ic Implementation Plan IP(07)8 with subsequent amendments.<br />
<strong>Salmon</strong>id management is the responsibility <strong>of</strong> the <strong>Salmon</strong>id <strong>Management</strong><br />
Division <strong>of</strong> the Directorate <strong>of</strong> <strong>Fisheries</strong>, which <strong>in</strong> subsequent text will be referred to as<br />
the “Competent <strong>Management</strong> Authority”.<br />
1. A brief description <strong>of</strong> the fisheries, <strong>in</strong>clud<strong>in</strong>g an overview <strong>of</strong> the stocks exploited,<br />
gear types, fishery location, magnitude <strong>of</strong> the fishery, current management<br />
restrictions and others planned.<br />
<strong>The</strong> pr<strong>in</strong>ciples <strong>of</strong> the <strong>Iceland</strong>ic <strong>Salmon</strong> <strong>Management</strong> system are shown <strong>in</strong> brief form <strong>in</strong><br />
table 1. It is important to note that s<strong>in</strong>ce 1932 coastal fisheries for salmon have been<br />
prohibitted by law although some 12 nett<strong>in</strong>g location with heritable rights were<br />
exempted. <strong>The</strong>se were gradually phased out and from 1997 onwards all harvest <strong>of</strong> salmon<br />
<strong>in</strong> <strong>Iceland</strong> has been <strong>in</strong> fresh water after a permanent buy-out agreement between the<br />
owners <strong>of</strong> the fish<strong>in</strong>g rights and the <strong>Iceland</strong>ic Government was enacted.<br />
Table 1. Pr<strong>in</strong>ciples <strong>of</strong> the <strong>Iceland</strong>ic <strong>Salmon</strong> <strong>Management</strong> System<br />
Ocean fishery:<br />
Fish<strong>in</strong>g rights:<br />
Local <strong>Management</strong> Authority:<br />
Fish<strong>in</strong>g gear allowed:<br />
Number <strong>of</strong> rods and nets:<br />
Annual fish<strong>in</strong>g time:<br />
Daily fish<strong>in</strong>g hours <strong>in</strong> rod fishery:<br />
Weekly nett<strong>in</strong>g closure:<br />
Report<strong>in</strong>g <strong>of</strong> catch:<br />
Forbidden<br />
Go with the adjo<strong>in</strong><strong>in</strong>g land<br />
River (<strong>Fisheries</strong>) Associations mandatory<br />
Rod and gillnets<br />
Restricted<br />
Max 105 days from 20 April – 30 September (90 days most<br />
common)<br />
12 hours 7AM - 10PM<br />
Half week , Friday 10 PM - Tuesday 10 AM<br />
Mandatory <strong>in</strong> log-books <strong>in</strong> rod fisheries, daily record<strong>in</strong>gs <strong>in</strong><br />
net fisheries<br />
<strong>Management</strong> responsibility: <strong>Fisheries</strong> associations are responsible for the local management under the<br />
auspices <strong>of</strong> the <strong>Salmon</strong> <strong>Management</strong> Division <strong>of</strong> the Directorate <strong>of</strong> <strong>Fisheries</strong>. <strong>Fisheries</strong> Associations for<br />
each jurisdiction have to make an “Effort Plan” for their salmon stock that specify the maximum number <strong>of</strong><br />
angl<strong>in</strong>g rods for a m<strong>in</strong>imum period <strong>of</strong> 8 years (from 2006). <strong>The</strong> “Effort Plan” can otherwise be a fairly<br />
flexible document but needs to be approved by the “Competent <strong>Management</strong> Authority”.<br />
2
1.1. By-catch <strong>of</strong> salmon <strong>in</strong> oceanic fisheries<br />
In 2004 and 2005 the by-catch <strong>of</strong> salmon <strong>in</strong> the fisheries <strong>of</strong> the <strong>Iceland</strong>ic Fish<strong>in</strong>g fleet<br />
was estimated (Guðbergsson and Sigþórsson 2006, ICES 2006). <strong>The</strong> estimate was<br />
conducted through a questionaire which reached half <strong>of</strong> the fishermen that were<br />
registered on a ship dur<strong>in</strong>g this period. <strong>The</strong> outcome <strong>of</strong> the surveys shows approximately<br />
the same results for both years giv<strong>in</strong>g a figure <strong>of</strong> 5.110 (3.165-7.055) salmon taken as bycatch<br />
<strong>in</strong> mar<strong>in</strong>e fisheries per annum. <strong>The</strong> fish were ma<strong>in</strong>ly caught by large ships <strong>in</strong><br />
pelagic fisheries. Over 80 % were regarded as medium or large salmon and 84,5% were<br />
caught dur<strong>in</strong>g the summer months (April-September). Of the observed by-catch <strong>of</strong><br />
salmon 38 % were taken outside the <strong>Iceland</strong>ic EEZ. No <strong>in</strong>formation on the orig<strong>in</strong> <strong>of</strong> the<br />
fish is available. See also CNL(03)27 on by-catches <strong>of</strong> salmon <strong>in</strong> pelagic herr<strong>in</strong>g<br />
fisheries.<br />
1.2. Enhancement programs<br />
Enhancement programs have been used <strong>in</strong> <strong>Iceland</strong>ic rivers for decades. Enhancement<br />
programs can be build<strong>in</strong>g <strong>of</strong> fish ladders, release <strong>of</strong> hatchery reared fry, parr or smolts.<br />
An <strong>in</strong>creas<strong>in</strong>g trend has been <strong>in</strong> the release <strong>of</strong> hatchery reared smolts to enhance the<br />
salmon run. <strong>The</strong> aim is to improve the rod catch <strong>in</strong> rivers or river parts where nursery<br />
areas are poor. Releases <strong>in</strong>to established salmon rivers need to be the progeny <strong>of</strong> the<br />
native stock. If enhancement programs are conducted each <strong>Fisheries</strong> Association needs to<br />
make an enhancement plan, which must be renewed every 5 years. <strong>The</strong> enhancement plan<br />
must be approved by the Competent <strong>Management</strong> Authority after receiv<strong>in</strong>g a comment<br />
from the Institute <strong>of</strong> Freshwater <strong>Fisheries</strong>.<br />
1.3. <strong>Salmon</strong> rivers<br />
Accord<strong>in</strong>g to NASCO def<strong>in</strong>ition salmon rivers should be listed by estuaries. However,<br />
when it comes to salmon management, tributaries are considered management units for<br />
most <strong>Iceland</strong>ic salmon rivers. <strong>Salmon</strong> rivers <strong>in</strong> <strong>Iceland</strong> are listed <strong>in</strong> Annex 1 with<br />
<strong>in</strong>formation on rivers by order. Annex 1 also <strong>in</strong>cludes <strong>in</strong>formation on stream type,<br />
conductivity, pH, length <strong>of</strong> accessible natural salmon habitat, length <strong>of</strong> salmon habitat<br />
opened up with fish ladders, dra<strong>in</strong>age area and glacier coverage. Information on wetted<br />
area if available based on <strong>in</strong> river assessments as well as estimates on production units.<br />
Average catch (max, m<strong>in</strong>) <strong>in</strong> the period 1974-2007, the number <strong>of</strong> approved rods and the<br />
existence <strong>of</strong> a net fishery are also shown.<br />
1.4. Estimation <strong>of</strong> the salmon run<br />
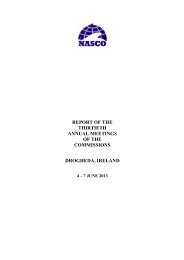
Fluctuations <strong>in</strong> salmon catches are known to occur with<strong>in</strong> areas <strong>in</strong> <strong>Iceland</strong> with higher<br />
amplitudes <strong>in</strong> northern and eastern <strong>Iceland</strong> than <strong>in</strong> southern and western <strong>Iceland</strong> (Figure<br />
1). Where available salmon runs estimated with fish counters show that abundance is<br />
significantly reflected by the rod catch. This can be seen for 1SW and 2SW fish.<br />
Exploitation rate is on the average close to 50% and 70% for 1SW and 2SW salmon<br />
respectively. A 65 year study <strong>in</strong> the river Elliðaár shows that exploitation rate is slightly<br />
lower when the run is high than when it is low. <strong>The</strong> study also shows that the exploitation<br />
rate is not affected by five fold changes <strong>in</strong> effort (rod days) <strong>in</strong> that period (Gudbergsson<br />
and Antonsson 2008).<br />
<strong>The</strong> observed connections between salmon run and catch show that salmon catch<br />
statistics can to a high degree be regarded to reflect the status <strong>of</strong> salmon stocks.<br />
3
Rod catch<br />
Rod catch<br />
Rod catch<br />
1974<br />
1974<br />
1974<br />
1976<br />
1976<br />
1976<br />
1978<br />
1978<br />
1978<br />
1980<br />
1980<br />
1980<br />
1982<br />
1982<br />
1982<br />
1984<br />
1984<br />
1984<br />
1986<br />
1986<br />
1986<br />
1988<br />
1988<br />
1988<br />
1990<br />
1990<br />
1990<br />
1992<br />
1992<br />
1992<br />
1994<br />
1994<br />
1994<br />
1996<br />
1996<br />
1996<br />
1998<br />
1998<br />
1998<br />
2000<br />
2000<br />
2000<br />
2002<br />
2002<br />
2002<br />
2004<br />
2004<br />
2004<br />
2006<br />
2006<br />
2006<br />
4500<br />
4000<br />
3500<br />
3000<br />
2500<br />
2000<br />
1500<br />
1000<br />
500<br />
0<br />
Laxá í Leirársveit<br />
Grímsá og Tunguá<br />
Þverá og Kjarrá<br />
Norðurá<br />
Langá<br />
Year<br />
3000<br />
2500<br />
2000<br />
1500<br />
1000<br />
Miðfjarðará<br />
Víðidalsá og Fitjá<br />
Vatnsdalsá<br />
Laxá á Ásum<br />
500<br />
0<br />
Year<br />
3500<br />
3000<br />
2500<br />
2000<br />
1500<br />
1000<br />
Laxá í Aðaldal<br />
Selá í Vopnafirði<br />
H<strong>of</strong>sá og Sunnudalsá<br />
500<br />
0<br />
Year<br />
Figur 1. <strong>Salmon</strong> rod catch <strong>in</strong> <strong>Iceland</strong>ic salmon rivers shown for different areas.<br />
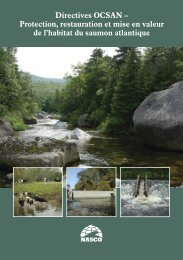
1.5. <strong>Salmon</strong> production <strong>in</strong> <strong>Iceland</strong>ic rivers<br />
<strong>Iceland</strong>ic rivers are <strong>of</strong> different orig<strong>in</strong> although direct run<strong>of</strong>f rivers are most common<br />
(Annex 1). Spr<strong>in</strong>gfed rivers and rivers dra<strong>in</strong><strong>in</strong>g lakes have much higher production per ha<br />
than direct run<strong>of</strong>f rivers (Figure 2). This needs to be taken <strong>in</strong>to account for the estimate <strong>of</strong><br />
reference po<strong>in</strong>t due to different levels <strong>of</strong> replacement values. If the freshwater and ocean<br />
4
Elliðaár<br />
Laxá á Ásum<br />
Úlfarsá<br />
Laxá í Leir<br />
Laxá í Kjós<br />
Langá<br />
Selá<br />
Mýrarkvísl<br />
Krossá<br />
Straumfjarðará<br />
Þverá Kjarrá<br />
Reykjadalsá<br />
Laxá í Aðaldal<br />
H<strong>of</strong>sá<br />
Vatnsdalsá<br />
Grímsá<br />
Miðfjarðará<br />
Vesturdalsá<br />
Norðurá<br />
Sog<br />
Svartá<br />
Hafralónsá<br />
<strong>Salmon</strong> catch/ha<br />
mortality is similar for the rivers shown <strong>in</strong> figure 2 River Elliðaár needs 27 times higher<br />
number <strong>of</strong> eggs per unit area than River Hafralónsá.<br />
70,0<br />
60,0<br />
57,7<br />
50,0<br />
40,0<br />
30,0<br />
38,6<br />
32,1<br />
24,7<br />
20,0<br />
14,6 13,5<br />
10,2 10,0 9,1 8,7 8,0 7,3 7,0 6,0 6,0 5,6 5,1 4,4 4,1 3,0 2,5 2,1<br />
10,0<br />
0,0<br />
River<br />
Figure 2. Average salmon catch per ha <strong>in</strong> <strong>Iceland</strong>ic salmon rivers.<br />
<strong>The</strong> productivity <strong>of</strong> <strong>Iceland</strong>ic salmon rivers is also affected by the fact, that only 3 species<br />
<strong>of</strong> salmonids, i.e. salmon, brown trout and char have historically been found <strong>in</strong> <strong>Iceland</strong>ic<br />
rivers, <strong>in</strong>clud<strong>in</strong>g the sea-run varieties <strong>of</strong> these species. Most salmon fisheries are thus<br />
mono-species or with very limited quantities <strong>of</strong> other salmonids <strong>in</strong> specific river sections.<br />
2. Identification <strong>of</strong> exploited stocks and the reference po<strong>in</strong>ts (conservation limit and/or<br />
management target) or alternative measures used to def<strong>in</strong>e adequate abundance <strong>of</strong><br />
the stock.<br />
All <strong>Iceland</strong>ic salmon rivers (stocks), except the few harvested with gillnets, are exploited<br />
through the lease <strong>of</strong> fish<strong>in</strong>g rights to anglers or angl<strong>in</strong>g clubs. <strong>The</strong> revenue, for the<br />
average salmon caught <strong>in</strong> rod fisheries is 20 – 30 times higher than the revenue for<br />
salmon sold <strong>in</strong> a fish market. <strong>The</strong> average price <strong>of</strong> a fish<strong>in</strong>g license is thus strongly<br />
related to the average catch per rod. A reduction <strong>in</strong> catch will lead to lower <strong>in</strong>come for<br />
the river owners, angl<strong>in</strong>g companies and angl<strong>in</strong>g clubs.<br />
S<strong>in</strong>ce the fish<strong>in</strong>g rights are leased <strong>in</strong> an open market system, supply and demand decide<br />
the market price. This system stimulates enhancement programs and open<strong>in</strong>g up <strong>of</strong><br />
impassible river areas, as <strong>in</strong>creased <strong>in</strong>come is used to pay for the <strong>in</strong>vestment <strong>in</strong> fish<br />
passages and hatchery reared parr and smolts.<br />
As there is no <strong>in</strong>terannual change <strong>in</strong> effort and good record<strong>in</strong>g <strong>of</strong> the catch <strong>in</strong> log-books,<br />
the catch reflects the approximate state <strong>of</strong> the stock and a poor stock status should be<br />
detected.<br />
5
No <strong>in</strong>formation is available on the distribution <strong>of</strong> salmon, by river <strong>of</strong> orig<strong>in</strong>, with<strong>in</strong> the<br />
<strong>Iceland</strong>ic EEZ as sea-fisheries for salmon are prohibitted <strong>in</strong> those areas. Recoveries <strong>of</strong><br />
Carl<strong>in</strong>-tagged as well as coded-wire tagged <strong>Iceland</strong>ic salmon from the Faroes fishery and<br />
the West Greenland fishery are available from 1967 through 1995 <strong>in</strong>dicat<strong>in</strong>g that<br />
<strong>Iceland</strong>ic 2SW salmon are found <strong>in</strong> those areas (Árni Ísaksson et al, 2002). <strong>Salmon</strong> from<br />
<strong>North</strong> and East <strong>Iceland</strong> were recovered to a greater extent <strong>in</strong> the Faroese long-l<strong>in</strong>e<br />
fishery while salmon from South and West <strong>Iceland</strong> were recovered <strong>in</strong> the West Greenland<br />
salmon fishery. Based on theses tag recoveries salmon stocks form <strong>North</strong> and East<br />
<strong>Iceland</strong> are grouped with <strong>North</strong>ern NEAC stock complex and South and West <strong>Iceland</strong><br />
with Southern NEAC stock complex. <strong>The</strong> PFA estimates are therefore calculated<br />
separately for these two areas. <strong>The</strong> PFA estimates, as calculated by the <strong>North</strong> <strong>Atlantic</strong><br />
<strong>Salmon</strong> Work<strong>in</strong>g Group, show that the number <strong>of</strong> spawners has been above the<br />
“Conservation limit” <strong>in</strong> both areas for the past 4 years (ICES 2008). <strong>The</strong> estimated<br />
exploitation rates on the other hand have been decreas<strong>in</strong>g <strong>in</strong> <strong>Iceland</strong> due to an <strong>in</strong>crease <strong>in</strong><br />
“catch and release” <strong>in</strong> the salmon fisheries.<br />
<strong>The</strong> production <strong>of</strong> salmon as catch per ha, shows a wide range for <strong>Iceland</strong>ic rivers (figure<br />
2). This will obviously lead to a wide range <strong>of</strong> conservation limits. Information on size <strong>of</strong><br />
the estimated spawn<strong>in</strong>g stock <strong>in</strong> numbers <strong>of</strong> eggs, wetted area and recruitment is<br />
available for 11 <strong>Iceland</strong>ic rivers show<strong>in</strong>g that the number <strong>of</strong> eggs giv<strong>in</strong>g MSY is from 1,8<br />
eggs/m 2 to 83,3 eggs/m 2 (table 2).<br />
Table 2. Size <strong>of</strong> production area for <strong>Atlantic</strong> salmon, conservation limit based on the number <strong>of</strong> eggs<br />
spawned and densities <strong>of</strong> 1 and 2 year parr <strong>in</strong> electorfish<strong>in</strong>g surveys. <strong>The</strong> atta<strong>in</strong>ment <strong>of</strong> CL is<br />
calculated.<br />
River Wettet area Average Catch/ Conservation limit Spawn<strong>in</strong>g requierment Average no eggs % <strong>of</strong><br />
name m 2 Hectar catch ha MSY eggs/m2 Number <strong>of</strong> eggs past 5 year average CL<br />
Elliðaár 199.711 19,97 1.152 57,68 59,30 11.842.862 2.312.540 19,53<br />
Laxá á Ásum 274.189 27,42 1.057 38,55 20,40 5.593.456 1.101.538 19,69<br />
Selá 962.800 96,28 980 10,18 1,40 1.347.920 4.138.897 307,06<br />
Krossá 114.270 11,43 104 9,10 1,80 205.686 440.850 214,33<br />
Laxá í Aðaldal 2.369.370 236,94 1.651 6,97 4,30 10.188.291 4.067.776 39,93<br />
H<strong>of</strong>sá 1.792.090 179,21 1.082 6,04 1,00 1.792.090 3.765.653 210,13<br />
Vatnsdalsá 1.486.643 148,66 887 5,97 1,70 2.527.293 2.167.261 85,75<br />
Grímsá 2.395.118 239,51 1.345 5,62 3,00 7.185.354 2.447.041 34,06<br />
Miðfjarðará 2.453.913 245,39 1.243 5,07 1,20 2.944.696 1.980.848 67,27<br />
Vesturdalsá 495.900 49,59 216 4,36 1,40 694.260 246.925 35,57<br />
Sog 1.293.500 129,35 390 3,02 7,60 9.830.600 733.290 7,46<br />
<strong>The</strong> results <strong>in</strong>dicate that there is high variation for conservation limits for these rivers.<br />
Most <strong>of</strong> the rivers <strong>in</strong> table 2 are based on direct run-<strong>of</strong>f flow, but the rivers Elliðaár, Laxá<br />
á Ásum, Laxá í Aðaldal and Sog are all spr<strong>in</strong>gfed rivers dra<strong>in</strong><strong>in</strong>g lakes. For the run-<strong>of</strong>f<br />
rivers MSY is from 1-3, 0 eggs/m 2 with 1,6 eggs/m 2 on the average. <strong>The</strong> knowledge <strong>of</strong><br />
wetted area, catch/ha and the orig<strong>in</strong> <strong>of</strong> the rivers can be used to group <strong>Iceland</strong>ic rivers<br />
<strong>in</strong>to categories <strong>of</strong> CL. This table should, however, be looked at as prelim<strong>in</strong>ary results and<br />
the actual values for CL as <strong>in</strong>complete. It should , however, be po<strong>in</strong>ted out that the above<br />
rivers represent well over 10 % <strong>of</strong> all <strong>Iceland</strong>ic salmon rivers and could possibly be used<br />
as <strong>in</strong>dexes for certa<strong>in</strong> areas. <strong>The</strong> work on sett<strong>in</strong>g conservation limits for <strong>Iceland</strong>ic salmon<br />
stocks will cont<strong>in</strong>ue <strong>in</strong> the years to come.<br />
3. <strong>The</strong> status <strong>of</strong> the stock relative to the abundance criteria specified<br />
6
As presented <strong>in</strong> table 2, the estimated average number <strong>of</strong> eggs spawned for the past 5<br />
years are from as low as 8 % <strong>of</strong> the spawn<strong>in</strong>g requirement to a high <strong>of</strong> 307 %. This<br />
<strong>in</strong>dicates that river owners and the “Competent <strong>Management</strong> Authority” need to ref<strong>in</strong>e<br />
these techniques and <strong>in</strong>crease their effort <strong>in</strong> evaluat<strong>in</strong>g conservation limits for more<br />
salmon rivers.<br />
<strong>The</strong> value <strong>of</strong> salmon fisheries is to large extent based on catch. <strong>The</strong>re is thus a heavy<br />
competition between rivers for anglers. Sett<strong>in</strong>g CLs for <strong>Iceland</strong>ic salmon rivers and us<strong>in</strong>g<br />
them thus needs to be based on scientifically acknowledged methods as <strong>in</strong>correct<br />
estimates and result<strong>in</strong>g regulatory measures can be quite costly for the fishery<br />
associations <strong>in</strong> question.<br />
<strong>The</strong> salmon catch <strong>in</strong> <strong>Iceland</strong>ic rivers is faithfully recorded <strong>in</strong> log-books that the owners<br />
are, by law, obliged to keep. This log-book system, which has been under development<br />
s<strong>in</strong>ce 1946, provides record<strong>in</strong>g <strong>of</strong> almost all salmon caught with related <strong>in</strong>formation on<br />
catch date, length, weight, sex, beat and bait. As mentioned previously the catch figures<br />
can to a large extent be regarded to reflect the status <strong>of</strong> stocks (Table 3).<br />
From exist<strong>in</strong>g data there is no concrete evidence show<strong>in</strong>g that any <strong>Iceland</strong>ic salmon<br />
stocks are suffer<strong>in</strong>g from <strong>in</strong>adequate recruitment but certa<strong>in</strong> rivers seem to be close to<br />
unacceptable CL levels and need to be watched carefully. <strong>The</strong> observed problems can<br />
almost exclusively be traced to a major decl<strong>in</strong>e <strong>in</strong> the 2-SW component, which is<br />
discussed <strong>in</strong> section 4.<br />
4. <strong>The</strong> extent to which the stock is meet<strong>in</strong>g other diversity criteria (e.g. age<br />
groups, size groups, populations), if such <strong>in</strong>formation is available.<br />
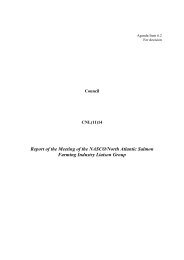
In general <strong>Iceland</strong>ic salmon stocks spend 1 or 2 w<strong>in</strong>ters at sea. <strong>The</strong> sea-age groups can be<br />
separated by weight where 2-SW females are bigger than 3,5kg and 2-SW males bigger<br />
than 4,0 kg. Ag<strong>in</strong>g <strong>of</strong> salmon from scales supports this and shows little overlap between<br />
sea-age groups. In the 1970s the number <strong>of</strong> 1SW and 2SW salmon <strong>in</strong> the salmon catch<br />
reflected the natural composition <strong>of</strong> the stocks (Figure 3). In the early 1980s there was a<br />
decl<strong>in</strong>e for both stock components. After 1985 the catch <strong>of</strong> 1SW salmon improved aga<strong>in</strong><br />
but the 2-SW stock component is still decl<strong>in</strong><strong>in</strong>g. Changes <strong>in</strong> sea-age composition for<br />
<strong>Iceland</strong>ic salmon stocks has earlier been detected but not for such a long period<br />
(Gudjonsson et al. 1995).<br />
Before 1980 there was a strong relationship between the catch <strong>of</strong> 1SW fish and 2SW fish<br />
<strong>in</strong> the subsequent year (Scarnecchia 1983). After 1985 the abundance <strong>of</strong> 2SW salmon has<br />
been decl<strong>in</strong><strong>in</strong>g <strong>in</strong> all <strong>Iceland</strong>ic salmon rivers (Figure 4). This has led to a general request<br />
to salmon anglers from the Institute <strong>of</strong> Freshwater <strong>Fisheries</strong>, the Federation <strong>of</strong> River<br />
Owners and the Federation <strong>of</strong> <strong>Iceland</strong>ic Angl<strong>in</strong>g Clubs to release all MSW salmon. In<br />
2006 19 % <strong>of</strong> the 1SW catch were released and 32 % <strong>of</strong> the MSW salmon.<br />
7
Number<br />
Number<br />
120<br />
100<br />
1SW<br />
Males<br />
80<br />
60<br />
2SW<br />
40<br />
20<br />
0<br />
0 1,0 2,0 3,0 4,0 5,0 6,0 7,0 8,0 9,0 10,0 11,0 12,0 13,0 14,0 15,0 16,0<br />
Weight (kg)<br />
100<br />
90<br />
80<br />
70<br />
60<br />
50<br />
40<br />
30<br />
20<br />
10<br />
0<br />
2SW<br />
1SW<br />
Females<br />
0 1,0 2,0 3,0 4,0 5,0 6,0 7,0 8,0 9,0 10,0 11,0 12,0 13,0 14,0 15,0 16,0<br />
Weight (kg)<br />
Figure 3. An example <strong>of</strong> the weight distribution <strong>of</strong> the salmon catch<br />
<strong>in</strong> River Laxá, <strong>North</strong>-East <strong>Iceland</strong>.<br />
8
1970<br />
1973<br />
1976<br />
1979<br />
1982<br />
1985<br />
1988<br />
1991<br />
1994<br />
1997<br />
2000<br />
2003<br />
2006<br />
<strong>Salmon</strong> catch (number)<br />
35000<br />
30000<br />
25000<br />
20000<br />
15000<br />
10000<br />
5000<br />
0<br />
1SW<br />
Year<br />
2SW<br />
Figure 4. <strong>The</strong> catch <strong>of</strong> 1SW and MSW salmon <strong>in</strong> <strong>Iceland</strong>ic salmon rivers from<br />
1970 – 2006 <strong>in</strong>clud<strong>in</strong>g 88% <strong>of</strong> the total salmon catch <strong>in</strong> <strong>Iceland</strong>.<br />
9
Table 3. <strong>Salmon</strong> rod catch <strong>in</strong> <strong>Iceland</strong>ic rivers 1974-2007.<br />
River Y E A R Average Max M<strong>in</strong><br />
1974 1975 1976 1977 1978 1979 1980 1981 1982 1983 1984 1985 1986 1987 1988 1989 1990 1991 1992 1993 1994 1995 1996 1997 1998 1999 2000 2001 2002 2003 2004 2005 2006 2007 catch catch catch<br />
Elliðaár 2033 2071 1692 1328 1383 1336 938 1074 1219 1508 1331 1157 1083 1175 2006 1773 1384 1127 1393 1390 1132 1088 1211 568 492 424 592 414 478 472 645 954 900 936 1152 2071 414<br />
Úlfarsá (Korpa) 357 438 406 361 327 215 110 166 158 450 225 303 376 245 709 440 306 238 517 457 338 316 339 217 248 162 223 185 215 273 244 207 206 210 305 709 110<br />
Leirvogsá 332 739 544 474 463 386 136 213 322 514 320 438 324 291 1057 458 489 435 556 428 490 520 552 411 540 467 487 434 529 558 812 744 299 379 483 1057 136<br />
Laxá í Kjós 1270 1901 1973 1677 1648 1508 950 1290 927 1545 1273 871 1043 933 3422 1819 1370 1328 1053 1103 683 866 629 985 1192 1171 940 916 1483 1457 1305 1312 844 623 1308 3422 629<br />
Bugða 158 269 410 263 136 125 212 260 232 450 461 283 201 230 389 314 226 265 191 163 100 154 143 162 173 126 132 90 156 200 204 276 174 180 224 461 90<br />
Brynjudalsá 205 271 185 173 98 100 11 24 120 177 68 29 44 59 287 118 385 235 154 118 88 597 186 76 102 120 136 95 109 77 171 163 152 164 149 597 11<br />
Botnsá 247 194 158 146 171 242 121 77 92 100 70 54 117 33 209 80 105 148 97 61 58 127 65 20 92 73 124 94 139 123 120 116 102 74 114 247 20<br />
Laxá í Leirársveit 1116 1654 1288 1154 1252 899 707 670 545 708 742 860 1610 914 1887 1186 1052 850 652 747 853 1425 1368 697 816 1065 925 948 1102 1133 972 1294 675 820 1034 1887 545<br />
Andakílsá 235 331 262 187 237 138 69 104 89 108 106 101 145 136 203 122 97 134 85 109 125 118 154 184 63 177 79 95 94 245 129 233 268 246 147 331 63<br />
Hvítá 393 521 388 401 788 573 555 364 348 213 326 597 469 514 439 301 263 572 520 622 560 407 502 213 692 504 425 571 560 918 509 631 554 1238 491 918 213<br />
Grímsá og Tunguá 1419 2116 1439 1103 1952 1527 869 845 717 1382 1061 1463 1836 825 1963 1200 756 1294 1864 1228 1485 1123 1484 1613 1705 1872 1048 1005 1116 1156 1085 1486 1114 1110 1345 2116 717<br />
Flókadalsá 411 613 432 263 547 377 266 181 234 281 303 351 384 282 293 182 241 350 322 387 341 288 233 319 360 347 380 362 473 334 523 410 437 438 346 613 181<br />
Reykjadalsá 156 275 185 112 120 105 56 80 100 91 58 42 69 42 33 75 77 157 107 40 25 97 36 94 95 73 72 33 80 156 183 205 107 196 101 275 25<br />
Þverá og Kjarrá 1748 2690 2330 2368 3132 3558 1938 1245 1616 1901 1082 1550 2127 1703 1567 1327 1485 1979 2314 1554 1605 1638 1381 1633 2181 2136 1281 1210 1444 1872 1373 4165 2156 2404 1910 4165 1082<br />
Norðurá 1428 2132 1675 1470 2089 1995 1583 1185 1455 1643 856 1121 1523 1034 1359 867 1070 1267 1965 2117 1625 1697 1964 1899 2001 1676 1650 1337 2217 1444 1382 3138 2242 1447 1621 3138 856<br />
Gljúfurá 150 522 356 400 461 286 130 101 184 225 110 138 280 73 181 133 97 171 286 192 150 356 209 240 152 134 104 99 167 88 166 255 185 220 206 522 73<br />
Langá 1379 2131 1568 1720 2405 1893 1049 735 1090 960 610 1155 1765 1023 1409 748 1000 951 1290 777 978 1400 1517 1366 1560 1641 1011 1407 1605 2263 2232 1912 1831 1456 1392 2405 610<br />
Urriðaá 84 112 202 102 65 151 162 142 103 55 16 105 63 34 13 19 54 15 37 47 29 42 62 22 24 40 80 53 115 101 45 71 202 13<br />
Álftá 154 341 204 300 386 255 265 267 396 485 268 333 399 202 443 283 245 274 333 242 247 263 283 266 191 275 132 187 228 278 299 343 195 210 283 485 132<br />
Hítará 383 525 351 346 649 314 167 252 202 201 151 203 506 273 428 225 257 393 255 279 206 424 355 217 311 443 404 418 493 448 611 706 543 563 356 706 151<br />
Haffjarðará 613 559 595 624 950 701 494 465 562 625 549 562 1131 521 875 661 599 711 818 617 672 735 602 560 752 793 672 532 943 1007 1133 1290 1077 1079 716 1290 465<br />
Straumfjarðará 451 755 433 466 648 391 320 437 350 360 215 327 378 161 334 300 267 308 233 260 253 315 269 226 297 260 198 191 342 379 475 671 502 451 352 755 161<br />
Vatnsholtsós og vötn 290 325 112 175 140 171 135 200 143 183 126 101 88 107 105 98 119 108 68 63 69 88 25 97 59 105 208 17 126 325 17<br />
Fróðá 182 199 254 225 234 130 94 75 100 58 61 71 51 50 51 52 105 29 26 13 13 29 23 23 15 23 41 63 114 82 254 13<br />
Grísholtsá og Bakká 60 55 75 70 125 61 24 48 37 64 60 27 38 5 28 54 11 20 52 125 5<br />
Setbergsá 244 167 81 192 170 173 147 215 233 100 296 134 203 117 120 76 40 0 80 44 63 44 39 7 16 47 34 32 21 20 111 296 0<br />
Laxá á Skógarströnd 99 167 114 190 179 177 109 183 121 201 189 277 218 117 242 103 106 101 72 68 33 41 94 46 121 98 75 81 63 169 84 170 92 70 128 277 33<br />
Dunká 83 76 142 58 138 85 129 52 135 124 68 126 71 96 104 125 103 50 76 150 62 39 47 45 96 88 169 103 162 109 106 97 169 39<br />
Skrauma 6 10 22 23 18 10 32 16 16 23 0 3 6 10 4 0 16 0 0 11 32 0<br />
Hörðudalsá 74 55 55 51 51 55 27 87 50 79 43 18 116 78 62 77 68 17 17 23 17 13 5 17 1 7 14 45 116 1<br />
Miðá og Tunguá 117 245 121 146 135 203 85 182 132 161 128 46 101 35 200 118 90 88 214 112 42 58 48 31 103 93 40 80 60 159 76 258 218 134 119 258 31<br />
Haukadalsá 810 914 904 862 926 643 408 814 598 886 633 499 817 650 1232 511 540 703 776 632 407 394 626 331 916 646 348 577 426 640 455 710 522 640 664 1232 331<br />
Laxá í Dölum 341 547 488 419 533 630 324 671 650 947 903 1600 1907 1408 2385 1006 1049 1227 1124 929 625 764 1032 764 1432 938 607 877 879 1394 1533 1881 1076 1145 994 2385 324<br />
Fáskrúð 202 298 136 242 226 261 140 190 154 214 165 257 449 381 464 203 226 183 330 212 96 157 187 144 265 145 143 221 170 182 194 283 178 322 223 464 96<br />
Flekkudalsá 300 462 343 342 467 509 293 255 237 249 189 133 244 129 360 140 145 241 262 247 100 109 192 148 226 131 108 131 229 284 227 290 217 174 241 509 100<br />
Krossá á Skarðsströnd 106 120 109 81 106 156 115 157 126 203 93 27 117 51 208 99 30 100 125 114 44 100 72 28 50 71 33 52 134 95 208 187 196 106 104 208 27<br />
Búðardalsá 35 100 120 131 71 54 71 32 51 55 56 111 81 106 146 131 56 41 31 45 59 42 43 45 105 158 245 335 341 300 322 100 341 31<br />
Hvolsá og Staðarhólsá 126 136 185 163 180 90 18 140 111 100 144 137 323 101 768 163 331 327 306 274 243 313 83 25 61 18 26 46 27 41 78 73 128 161 768 18<br />
Fjarðarhornsá 8 0 38 8 18 34 60 31 29 12 16 4 8 33 24 12 4 2 2 2 0 1 18 33 18 74 115 111 22 115 0<br />
Laugardalsá í Ísafj.djúpi 309 601 245 681 703 596 276 288 250 181 125 421 386 190 501 280 161 284 220 265 157 223 111 135 343 149 156 257 309 324 591 390 299 229 316 703 111<br />
Ísafjarðará 10 27 52 29 25 12 12 9 5 6 14 3 23 16 14 55 15 12 3 8 5 4 13 4 4 7 8 14 22 35 30 26 16 55 3<br />
Langadalsá 78 172 170 189 203 277 206 111 101 98 31 54 112 67 95 130 88 217 292 241 72 251 192 133 186 82 76 94 106 150 341 444 329 226 158 444 31<br />
Hvannadalsá 57 56 120 101 47 30 45 27 24 71 110 23 42 304 71 51 41 164 145 136 77 304 23<br />
Selá í Ste<strong>in</strong>grímsfirði 34 22 27 17 17 23 6 7 0 7 44 22 18 60 66 95 81 8 64 20 49 4 11 0 19 12 19 38 29 34 78 28 95 0<br />
Staðará í Ste<strong>in</strong>grímsf. 44 100 108 124 101 95 72 46 41 26 25 28 64 40 71 62 118 82 169 43 26 101 57 45 29 6 14 41 11 64 169 6<br />
Víðidalsá í Ste<strong>in</strong>grímsf 182 49 54 61 93 104 98 34 54 12 16 56 29 29 8 59 23 32 47 39 20 0 8 45 69 62 147 49 182 0<br />
Hrófá 20 22 56 74 48 41 29 14 21 54 62 23 85 41 32 94 93 64 23 57 61 25 93 23 25 17 70 29 63 75 54 61 48 94 14<br />
Krossá í Bitru 49 140 125 151 153 109 90 41 109 180 121 88 79 39 19 63 65 52 61 37 45 85 114 76 47 68 29 98 88 111 76 83 180 19<br />
Víkurá 5 38 92 68 121 219 125 174 61 75 45 70 100 40 89 40 38 28 77 70 20 98 43 54 119 90 81 78 95 39 151 116 98 83 80 219 5<br />
Prestbakkaá 44 66 93 105 21 40 57 39 85 115 43 123 51 73 45 12 38 33 33 13 37 17 19 30 8 44 36 42 28 49 123 8<br />
Laxá í Hrútafirði 9 32 18 23 17 39 43 61 45 126 165 133 98 69 69 11 47 96 84 47 12 33 16 51 75 48 14 17 3 2 13 18 12 14 48 165 2<br />
10
Table 3. Cont<strong>in</strong>ued.<br />
River Y E A R Average Max M<strong>in</strong><br />
1974 1975 1976 1977 1978 1979 1980 1981 1982 1983 1984 1985 1986 1987 1988 1989 1990 1991 1992 1993 1994 1995 1996 1997 1998 1999 2000 2001 2002 2003 2004 2005 2006 2007 catch catch catch<br />
Hrútafjarðará og Síká 194 291 228 262 346 312 253 288 220 287 195 345 536 259 532 252 200 359 459 411 176 288 205 201 243 218 141 126 168 164 631 514 339 431 291 631 126<br />
Miðfjarðará 837 1414 1601 2581 2337 2132 1714 1213 926 882 583 1059 1719 1073 2081 1175 774 1112 1401 1023 668 1032 714 602 1772 1203 612 433 749 577 2228 1561 1198 1150 1243 2581 433<br />
Tjarnará á Vatnsnesi 34 112 82 53 56 36 53 23 55 25 0 40 18 51 23 40 9 30 0 37 61 32 10 6 39 36 53 52 50 37 38 112 0<br />
Víðidalsá og Fitjá 1051 1140 1238 1792 1851 1948 1423 1392 1132 1082 625 713 1541 1563 2023 924 604 667 1473 1342 580 981 783 691 1081 1089 644 581 887 588 1745 1732 682 728 1153 2023 580<br />
Vatnsdalsá 706 832 571 1203 1466 1413 1033 985 721 879 699 856 1582 1496 1243 660 604 683 998 853 516 601 723 769 1149 629 323 584 850 547 964 1252 1020 848 887 1582 323<br />
Laxá á Ásum 1439 1881 1270 1439 1854 1650 956 1413 1036 1050 625 1440 1857 1157 1617 749 651 833 861 1458 805 1549 627 715 1136 430 770 562 559 308 462 679 365 536 1057 1881 308<br />
Blanda 1173 2363 1485 1367 2147 906 778 1412 861 511 495 766 1814 1243 1217 375 607 568 432 404 357 519 600 877 1984 1191 706 1086 833 504 1386 1591 1199 1107 1017 2363 357<br />
Svartá 420 232 96 46 295 469 444 125 73 147 132 330 391 462 275 118 105 108 363 495 400 547 244 532 619 213 170 283 260 276 398 221 303 301 290 619 46<br />
Laxá á Refasveit 79 58 41 71 94 146 153 71 39 57 70 111 144 132 140 96 156 117 297 227 144 143 104 139 179 105 69 88 169 82 154 254 242 208 126 297 39<br />
Hallá 171 185 197 138 96 57 111 86 109 55 62 62 50 30 45 56 53 28 48 57 38 38 31 8 22 0 53 91 71 197 0<br />
Fossá á Skaga 5 6 34 62 98 94 26 14 25 8 22 32 20 22 24 12 22 20 25 10 16 14 17 17 13 15 16 32 12 29 21 28 30 25 98 5<br />
Laxá á Skaga 120 134 73 140 200 220 245 161 113 93 74 134 138 176 137 70 103 70 144 106 26 30 38 41 79 10 0 0 0 0 0 0 24 88 245 0<br />
Sæmundará 115 116 160 212 303 112 70 52 29 75 139 94 62 25 54 103 43 25 59 78 18 66 137 216 141 93 303 18<br />
Húseyjarkvísl 112 118 141 158 194 84 107 52 54 90 77 105 104 101 73 113 89 103 245 160 80 73 71 70 94 39 32 47 52 63 162 110 150 161 101 245 32<br />
H<strong>of</strong>sá í Vesturdal 23 2 15 12 16 10 23 0 13 23 0<br />
Kolka 12 12 11 7 24 58 5 10 27 17 28 52 15 21 58 5<br />
Hrolleifsdalsá 20 24 28 41 41 65 17 4 4 7 4 25 15 24 10 18 16 18 16 55 7 4 1 13 1 4 11 6 3 8 12 16 8 17 65 1<br />
Flókadalsá í Fljótum 71 40 22 54 2 10 22 68 38 64 119 135 44 164 136 15 2 21 15 40 30 12 22 37 24 36 23 18 11 47 164 2<br />
Fljótaá 204 189 173 269 316 199 165 125 71 60 68 83 150 112 93 323 388 135 282 203 78 102 73 119 284 51 49 114 152 49 256 259 86 90 160 388 49<br />
Eyjafjarðará 27 71 21 14 7 11 11 13 13 10 6 40 22 54 33 15 17 10 15 27 8 3 10 3 12 16 10 5 2 18 71 3<br />
Fnjóská 386 268 250 273 554 446 527 257 323 98 107 120 144 93 124 112 121 135 554 411 128 60 95 156 286 157 197 146 311 166 444 460 383 346 247 554 60<br />
Skjálfandafljót 92 67 412 288 336 317 426 108 169 100 165 679 721 503 379 431 493 318 862 907 379 273 353 277 263 520 379 208 472 346 932 556 675 747 406 932 67<br />
Laxá í Aðaldal 1817 2326 1777 2699 3063 2372 2324 1455 1304 1109 1256 1911 2730 2422 2255 1619 1543 1439 2295 1983 1226 1116 1047 1227 1928 845 916 1042 1189 624 947 1025 825 1055 1651 3063 624<br />
Reykjadalsá og Eyv<strong>in</strong>darl.337 264 133 593 657 492 321 271 114 210 155 344 373 241 435 241 272 191 280 249 110 119 132 109 65 64 39 87 25 90 89 138 102 43 222 657 25<br />
Mýrarkvísl 210 201 121 181 221 197 169 242 179 248 215 388 490 252 287 239 188 243 390 266 139 234 160 270 212 122 49 83 258 103 357 385 306 49 230 490 49<br />
Ormarsá 123 117 147 275 286 119 124 54 45 87 73 203 350 275 278 264 187 156 335 366 169 163 181 141 134 108 163 143 199 233 295 216 187 182 188 366 45<br />
Deildará 158 189 168 224 357 164 111 93 27 55 69 234 253 178 173 145 142 88 281 391 173 206 82 141 192 65 144 122 194 93 273 177 135 257 167 391 27<br />
Svalbarðsá 234 172 155 240 257 158 167 51 36 41 29 161 171 176 198 238 135 136 289 384 145 215 177 98 159 124 92 143 236 291 231 292 283 302 176 384 29<br />
Sandá 288 238 315 474 418 411 380 138 53 47 35 257 340 403 290 182 81 100 354 434 204 209 152 91 177 190 143 128 212 151 197 260 268 268 230 474 35<br />
Hölkná 135 118 92 219 130 66 73 26 26 25 11 109 121 131 144 105 91 55 150 130 45 78 44 36 53 47 59 77 84 105 84 140 135 101 88 219 11<br />
Hafralónsá 343 302 227 312 276 264 180 36 60 52 25 132 223 296 361 313 223 123 266 402 147 234 222 221 260 254 315 303 294 237 206 365 424 481 234 402 25<br />
Miðjarðará við Bakkafj. 147 144 183 248 242 135 80 39 15 39 32 116 168 206 186 235 136 101 192 172 60 170 96 101 145 116 108 98 165 152 141 195 155 198 136 248 15<br />
Selá í Vopnafirði 589 711 845 1463 1394 767 637 192 168 229 123 627 1258 1523 1102 895 634 772 1318 1092 631 1160 737 685 1140 991 1360 1108 1653 1558 1670 2316 2726 2227 980 2316 123<br />
Vesturdalsá 391 329 326 513 498 268 141 42 34 61 47 280 197 380 231 226 163 116 264 321 218 329 201 216 159 71 129 124 269 175 88 102 104 158 216 513 34<br />
H<strong>of</strong>sá og Sunnudalsá 1277 1117 1253 1273 1336 599 615 145 141 258 185 1219 1631 1710 1210 809 552 642 2238 2028 1012 1028 826 607 1008 1020 804 906 1877 1483 1864 1965 2058 1423 1082 2238 141<br />
Selfljót og Gilsá 77 32 19 7 6 15 16 65 70 32 12 5 26 42 90 98 16 32 8 18 25 20 22 41 26 31 47 60 45 103 35 98 5<br />
Fjarðará í Borgarf.eystri 44 27 13 5 1 6 12 5 8 10 9 38 20 43 63 17 44 1<br />
Breiðdalsá 126 123 76 248 412 248 153 41 20 21 4 78 158 257 185 104 91 116 226 130 72 180 92 63 85 128 171 233 325 202 700 815 937 873 184 815 4<br />
Laxá í Nesjum 32 8 21 18 41 81 135 88 202 103 92 75 202 8<br />
Geirlandsá í V-Skaft. 56 162 59 99 91 88 65 59 42 51 46 49 26 32 62 47 74 93 66 27 20 38 52 47 30 12 14 31 41 36 19 13 23 35 50 162 12<br />
Eldvatn í Meðallandi 24 51 13 43 33 45 12 17 11 17 3 9 11 11 37 14 15 13 24 18 5 17 8 11 6 3 2 1 3 3 17 10 7 21 16 51 1<br />
Tungufljót 14 34 43 74 46 16 20 36 28 23 36 20 25 9 11 21 49 63 35 22 28 10 30 8 7 11 22 25 31 21 8 42 27 74 7<br />
Kerl<strong>in</strong>gardalsá og Vatnsá 28 33 16 57 48 90 49 47 144 78 107 107 169 130 95 73 75 80 98 65 41 32 60 38 42 42 446 71 169 16<br />
Rangárnar 29 57 95 46 82 98 65 80 65 22 10 17 78 32 53 80 1622 453 521 1041 1576 1523 1298 2960 3848 2536 3744 5466 1791 3443 6285 7413 6930 7525 1791 7525 10<br />
Stóra-Laxá í Hreppum 157 340 293 266 571 272 76 242 218 481 707 183 166 113 115 188 200 286 420 384 278 440 456 359 336 194 183 282 229 423 299 432 709 238 300 707 76<br />
Brúará 88 84 57 49 64 49 19 57 32 63 92 48 58 76 37 34 44 72 43 80 49 54 44 42 76 14 20 15 22 46 35 14 27 40 49 92 14<br />
Sog 593 589 537 620 439 223 329 343 248 361 424 497 490 714 325 397 396 341 429 283 300 254 252 413 491 249 317 289 370 257 307 345 669 390 714 223<br />
Hvítá í Árnessýslu 1175 1159 1169 1028 299 762 634 846 941 550 990 965 788 680 486 456 687 938 723 580 596 405 418 190 204 250 262 244 228 298 361 306 623 1175 190<br />
Ölfusá 298 549 825 503 6 102 368 237 381 254 405 393 535 616 315 249 293 515 375 366 192 185 224 155 258 172 186 118 159 204 138 324 309 825 6<br />
Kálfá í Gnúpverjahr. 69 42 4 4 8 10 19 11 15 66 104 87 37 2 14 40 30 54 39 60 87 56 61 26 31 130 118 93 72 45 130 2<br />
Vatnas. Baugstaðaós 59 20 20 9 14 11 21 8 16 36 20 23 16 16 21 26 23 8 14 16 38 28 27 27 34 39 22 59 8<br />
11
5. For mixed stock fisheries, the <strong>in</strong>formation <strong>in</strong> numbers 3 and 4 should be<br />
presented for each contribut<strong>in</strong>g stock.<br />
At present, legal mixed stock fisheries can only operate <strong>in</strong> two glacier rivers with salmon<br />
production to some extent <strong>in</strong> the ma<strong>in</strong> stem but mostly <strong>in</strong> clear water tributaries. <strong>The</strong>re<br />
are traditional rights <strong>of</strong> gillnet fisheries <strong>in</strong> these glacier rivers, which have been severely<br />
regulated by laws and regulations for decades.<br />
A mixed stock net fishery only takes place <strong>in</strong> two glacial rivers on <strong>Iceland</strong>´s south coast,<br />
the Ölfusá and Þjórsá, where the salmon spawn partly <strong>in</strong> clear water tributaries and partly<br />
<strong>in</strong> the glacial streams. <strong>The</strong> average catch dur<strong>in</strong>g the past 5 years has been 5.700 salmon<br />
which represents approximately 90 % <strong>of</strong> the <strong>Iceland</strong>ic net catch. In 2007 about half <strong>of</strong><br />
the number <strong>of</strong> gillnets <strong>in</strong> the Ölfusá were leased by angl<strong>in</strong>g <strong>in</strong>terests. This development is<br />
likely to cont<strong>in</strong>ue, which will further protect any small stock components <strong>in</strong> these mixed<br />
stock net fisheries <strong>in</strong> the near future.<br />
As stated earlier there is no legal coastal fishery for salmon <strong>in</strong> <strong>Iceland</strong>ic waters after a<br />
buy-out <strong>of</strong> the few rema<strong>in</strong><strong>in</strong>g costal fisheries <strong>in</strong> 1996. Gillnet fisheries <strong>in</strong> lower reaches <strong>of</strong><br />
Hvítá <strong>in</strong> Borgarfjörður, where the ma<strong>in</strong> salmon production is <strong>in</strong> clear water tributaries,<br />
have s<strong>in</strong>ce 1991 been leased annually by the river associations <strong>in</strong> the tributaries . This is<br />
economical because <strong>of</strong> the price difference between salmon caught <strong>in</strong> net fishery and the<br />
much higher price paid for the rod fishery. An assessment <strong>of</strong> the effect <strong>of</strong> the nett<strong>in</strong>g<br />
lease gives that this has <strong>in</strong>creased the catch <strong>in</strong> the tributaries between 28-32% (E<strong>in</strong>arsson<br />
and Gudbergsson 2003).<br />
6. <strong>The</strong> management actions that will be employed to control harvest, <strong>in</strong>clud<strong>in</strong>g<br />
measures that will be used to address any failure or trend <strong>in</strong> abundance or diversity.<br />
In 2006 a new Act on freshwater fisheries was passed by the <strong>Iceland</strong>ic Parliament. This<br />
new Act <strong>in</strong>creases the responsibility <strong>of</strong> Fishery Associations with respect to the<br />
management <strong>of</strong> salmon stock with<strong>in</strong> their jurisdiction under the supervision <strong>of</strong> the<br />
Competent <strong>Management</strong> Authority. Every Fishery Association needs to make an “Effort<br />
Plan” for their fish stock, specify<strong>in</strong>g number <strong>of</strong> rods, bait or bag limitations or any other<br />
measures <strong>of</strong> salmon conservation. <strong>The</strong> “Effort Plan” must be approved by the Freshwater<br />
<strong>Management</strong> Division <strong>of</strong> the Directorate <strong>of</strong> <strong>Fisheries</strong> after receiv<strong>in</strong>g a comment from the<br />
Institute <strong>of</strong> Freshwater <strong>Fisheries</strong>. <strong>The</strong> purpose is to <strong>in</strong>crease the responsibilities <strong>of</strong> the<br />
Fish<strong>in</strong>g Associations as well as to <strong>in</strong>crease their obligations to gather <strong>in</strong>formation <strong>of</strong> the<br />
status <strong>of</strong> stock. Through this process the precautionary pr<strong>in</strong>ciple can be <strong>in</strong>troduced and<br />
applied by the “Competent <strong>Management</strong> Authority”. This is also likely to facilitate the<br />
process <strong>of</strong> gather<strong>in</strong>g the basic <strong>in</strong>formation needed to determ<strong>in</strong>e Conservation Limits. At<br />
least <strong>in</strong> the long run keep<strong>in</strong>g the salmon stock level above CL that is based on maximum<br />
susta<strong>in</strong>able yield (MSY) will be highly beneficial for the fish<strong>in</strong>g right owners.<br />
<strong>The</strong> “Competent <strong>Management</strong> Authority” can thus request a modification <strong>of</strong> an Effort<br />
Plan” <strong>in</strong> a river where CLs <strong>in</strong>dicate that a stock is threatened. If the <strong>Fisheries</strong> Association<br />
fails to react there are emergency measures embedded <strong>in</strong> the new Act which can be<br />
enacted unilaterally by the “Competent <strong>Management</strong> Authority”.<br />
12
7. <strong>The</strong> extent to which the follow<strong>in</strong>g issues are taken <strong>in</strong>to account:<br />
7.1. Uncerta<strong>in</strong>ty <strong>in</strong> the assessments.<br />
As mentioned previously the CLs which are currently available for selected rivers<br />
probably have high confidence limits. <strong>The</strong> confidence <strong>in</strong> those values will probably<br />
<strong>in</strong>crease with more experience <strong>in</strong> estimat<strong>in</strong>g CL´s. It must, however, always be the<br />
primary objective to conserve the salmon stocks <strong>in</strong> l<strong>in</strong>e with the “Precautionary<br />
Approach” where lack <strong>of</strong> sufficient <strong>in</strong>formation does not lead to non-action, if other<br />
evidence suggests that there is a problem.<br />
7.2. Abundance <strong>of</strong> the stock/diversity <strong>of</strong> the stock.<br />
<strong>The</strong> abundance and diversity <strong>of</strong> the salmon stocks are clearly key issues <strong>in</strong> any<br />
management plan. Catch and release has been practiced <strong>in</strong> many <strong>Iceland</strong>ic rivers for a<br />
number <strong>of</strong> years and anglers have been encouraged to release all 2-SW salmon for the last<br />
4 years. All angled salmon are released <strong>in</strong> one river and most rivers have specific limits <strong>in</strong><br />
the number <strong>of</strong> salmon reta<strong>in</strong>ed per day. Bait limitation is also quite common and fly<br />
fish<strong>in</strong>g is gett<strong>in</strong>g to be the primary angl<strong>in</strong>g method. All the above issues are quite<br />
important elements <strong>of</strong> the mandatory “Effort Plan”.<br />
7.3. Selectivity <strong>of</strong> the fisheries.<br />
<strong>The</strong> only selective fisheries <strong>in</strong> <strong>Iceland</strong> would be the rema<strong>in</strong><strong>in</strong>g <strong>in</strong>-river net fisheries,<br />
which partly are harvest<strong>in</strong>g salmon, which would not be harvested by any other means.<br />
<strong>The</strong>re is anecdotal evidence that different forms <strong>of</strong> bait would be harvest<strong>in</strong>g different age<br />
classes <strong>of</strong> salmon but this needs to be confirmed.<br />
7.4. Any non-fishery factors affect<strong>in</strong>g the stock.<br />
<strong>The</strong>re are a number <strong>of</strong> factors e.g. <strong>of</strong> environmental orig<strong>in</strong> which may affect the stocks <strong>in</strong><br />
<strong>Iceland</strong>ic rivers. <strong>Salmon</strong> fish<strong>in</strong>g is highly dependent on good water flow and favourable<br />
conditions dur<strong>in</strong>g the fish<strong>in</strong>g season. Low water and high temperatures may decrease<br />
wetted areas and reduce the salmon habitat and <strong>in</strong>crease the danger <strong>of</strong> disease outbreaks.<br />
Man-made threats are easier to avert due to the high value <strong>of</strong> the salmon fish<strong>in</strong>g and<br />
fishery associations are eager to protect the rivers from pollution, gravel m<strong>in</strong><strong>in</strong>g activity<br />
as well as hydropower development, which has been m<strong>in</strong>imal on salmon rivers.<br />
7.5. Other fisheries exploit<strong>in</strong>g the stock.<br />
<strong>The</strong> <strong>in</strong>formation about other fisheries e.g. for mar<strong>in</strong>e species harvest<strong>in</strong>g <strong>Iceland</strong>ic salmon<br />
are anecdotal <strong>in</strong> nature and this <strong>in</strong>formation can not be quantified. Same is true for coastal<br />
net fisheries for char. As there are no coastal sea-fisheries target<strong>in</strong>g salmon the overall<br />
effects on the salmon stocks just prior to freshwater entry are probably m<strong>in</strong>imal.<br />
13
8. <strong>The</strong> expected extent and timescale <strong>of</strong> effects.<br />
A successful development <strong>of</strong> CLs for all <strong>Iceland</strong>ic rivers will take some time s<strong>in</strong>ce this is<br />
based on several actions <strong>in</strong>clud<strong>in</strong>g legal actions and costly surveys <strong>of</strong> salmon rivers,<br />
which mostly will be f<strong>in</strong>anced by the respective Fishery Associations. This gather<strong>in</strong>g <strong>of</strong><br />
physical and basic biological datasets also takes time. It is thus probably realistic to aim<br />
for a timeframe <strong>of</strong> 5-10 years before the proper management tools for the most valuable<br />
salmon rivers have been developed. It seems likely that the progress <strong>in</strong> m<strong>in</strong>or salmon<br />
rivers will be considerably slower.<br />
9. An explanation <strong>of</strong> how socio-economic factors are applied <strong>in</strong> the development <strong>of</strong><br />
fisheries management actions and how this affects the atta<strong>in</strong>ment <strong>of</strong> NASCO’s goals.<br />
<strong>The</strong> <strong>Iceland</strong>ic angl<strong>in</strong>g fisheries are driven by economical factors. In many cases an<br />
angl<strong>in</strong>g club or outfitter pays a fixed annual price for the river for a period up to 5-10<br />
years. This contract assumes that the river is entitled to a certa<strong>in</strong> number <strong>of</strong> rods for<br />
angl<strong>in</strong>g, which are marketed up to a year or two <strong>in</strong> advance <strong>of</strong> the fish<strong>in</strong>g season. This<br />
system clearly puts considerable stra<strong>in</strong> on any day to day management and is probably<br />
the best example <strong>of</strong> the <strong>in</strong>fluence <strong>of</strong> socioeconomic factors on salmon management <strong>in</strong><br />
<strong>Iceland</strong>.<br />
Another example <strong>of</strong> socio-economic factors is the lease <strong>of</strong> nett<strong>in</strong>g rights to anglers and<br />
environmental groups <strong>in</strong> order to enhance angl<strong>in</strong>g <strong>in</strong> upstream tributaries. This <strong>of</strong> course<br />
is facilitated by the great value difference between angled and net-caught salmon. This<br />
trend is likely to cont<strong>in</strong>ue.<br />
S<strong>in</strong>ce the angl<strong>in</strong>g fisheries are <strong>in</strong> fact limited entry fisheries and the fisheries associations<br />
and angl<strong>in</strong>g clubs can manipulate the effort through “catch and release” as well as bait<br />
and bag limitations it does not seem likely that these factors are affect<strong>in</strong>g the atta<strong>in</strong>ment<br />
<strong>of</strong> NASCO´goals with respect to salmon conservation.<br />
10. Programs that will be used to monitor the effect <strong>of</strong> the management measures<br />
and identify <strong>in</strong>formation deficiencies and timeframe resolution.<br />
<strong>The</strong> efficient collection <strong>of</strong> angl<strong>in</strong>g statistics throughout the salmon season provides an<br />
excellent platform for estimat<strong>in</strong>g run sizes <strong>in</strong>to <strong>in</strong>dividual rivers, as the salmon statistics<br />
have been shown to reflect the run size to a great extent. <strong>The</strong>re are plans to record<br />
statistics on-l<strong>in</strong>e <strong>in</strong> certa<strong>in</strong> selected rivers, which will speed up the gather<strong>in</strong>g <strong>of</strong> the<br />
statistics. If runs seem to be dangerously low the “Competent <strong>Management</strong> Authority” is<br />
enabled to <strong>in</strong>struct the <strong>Fisheries</strong> Association on the river to enact some conservation<br />
measures, probably through a change <strong>in</strong> the “Effort plan”. In extremely serious<br />
circumstances emergency measures could be <strong>in</strong>troduced for the follow<strong>in</strong>g year or years <strong>in</strong><br />
close cooperation with the River (<strong>Fisheries</strong>) Association on the relevant river.<br />
14
Conclusion<br />
It can be concluded that the <strong>Iceland</strong>ic <strong>Salmon</strong> <strong>Management</strong> System, which has its roots <strong>in</strong><br />
a <strong>Salmon</strong>id <strong>Fisheries</strong> Act set <strong>in</strong> 1932 has been relatively efficient <strong>in</strong> preserv<strong>in</strong>g the<br />
salmon stocks. <strong>The</strong> major pillars <strong>of</strong> this development are the follow<strong>in</strong>g:<br />
1. A total ban on any coastal fisheries for salmon.<br />
2. Severely restricted term<strong>in</strong>al fisheries <strong>in</strong> freshwater (rod + nets).<br />
3. Fixed maximum number <strong>of</strong> rods on all salmon rivers.<br />
4. Very accurate catch statistics for all angl<strong>in</strong>g and most nett<strong>in</strong>g fisheries.<br />
5. Fixed number <strong>of</strong> nett<strong>in</strong>g eng<strong>in</strong>es on some glacial rivers with restricted fish<strong>in</strong>g<br />
effort.<br />
6. Lease <strong>of</strong> nett<strong>in</strong>g eng<strong>in</strong>es <strong>in</strong> freshwater <strong>in</strong> areas where such an act can benefit<br />
angl<strong>in</strong>g.<br />
7. Considerable limitation <strong>in</strong> the use <strong>of</strong> bait and the number <strong>of</strong> reta<strong>in</strong>ed salmon.<br />
8. Voluntary “catch and release”<br />
Despite this the <strong>Iceland</strong>ic salmon fisheries have been subject to a decl<strong>in</strong><strong>in</strong>g mar<strong>in</strong>e<br />
survival <strong>of</strong> 2-SW salmon <strong>in</strong> many areas, which poses great challenges for <strong>Fisheries</strong><br />
Associations as well as the <strong>Salmon</strong> <strong>Management</strong> Authorities.<br />
References<br />
Árni Ísaksson, Sumarlidi Óskarsson and Thor Gudjónsson. 2002. Occurrence <strong>of</strong> tagged<br />
<strong>Iceland</strong>ic salmon <strong>in</strong> the salmon fisheries at West Greenland and with<strong>in</strong> the Faroese<br />
fish<strong>in</strong>g zone 1967 through 1995 and its <strong>in</strong>ference regard<strong>in</strong>g the oceanic migration <strong>of</strong><br />
salmon from different areas <strong>of</strong> <strong>Iceland</strong>. Directorate <strong>of</strong> Freshwater <strong>Fisheries</strong> Publication.<br />
E<strong>in</strong>arsson, S.M. and Gudbergsson, G. 2003. <strong>The</strong> effects <strong>of</strong> the net fishery closure on<br />
angl<strong>in</strong>g catch <strong>in</strong> the River Hvita, <strong>Iceland</strong>. <strong>Fisheries</strong> <strong>Management</strong> and Ecology, 10:73-78.<br />
Gudbergsson, G. and Antonsson, Th, 2008. Tengsl st<strong>of</strong>nstærðar, sóknar og veiðihlutfalls<br />
hjá laxi í Elliðaánum. Fræðaþ<strong>in</strong>g landbúnaðar<strong>in</strong>s 5. 2008. p. 242-249. (In <strong>Iceland</strong>ic).<br />
Gudbergsson G., and Sigthorsson O. 2006. Potential bycatch <strong>of</strong> salmon <strong>in</strong> <strong>Iceland</strong>ic<br />
ocean fisheries. Work<strong>in</strong>g paper 2006/22.<br />
Gudjonsson, S. E<strong>in</strong>arsson, S.M. Antonsson, Th. and Gudbergsson, G. 1995. Relation <strong>of</strong><br />
Grilse salmon ratio to environmental changes <strong>in</strong> several wild stocks <strong>of</strong> <strong>Atlantic</strong> salmon<br />
(Salmo salar) <strong>in</strong> <strong>Iceland</strong>. Can. J. Fish Aquat. Sci. 52. 1385-1398.<br />
ICES 2006. Report <strong>of</strong> the work<strong>in</strong>g group on north <strong>Atlantic</strong> salmon (WGNAS). ICES CM<br />
2006/ACFM:23. 294 p.<br />
ICES 2008. Report <strong>of</strong> the Work<strong>in</strong>g Group on <strong>North</strong> <strong>Atlantic</strong> <strong>Salmon</strong> (WGNAS). Galway,<br />
Ireland, 1 – 10 April. ICES CM 2008/ACFM:XX XXX p.<br />
15
Scarnecchia, D.L. 1983. Age <strong>of</strong> sexual maturity <strong>in</strong> <strong>Iceland</strong>ic stocks <strong>of</strong> <strong>Atlantic</strong> salmon<br />
(Salmo salar). Can. J. Fish. Aquat. Sci. 40:1456-1468.<br />
16
Annex 1. Some key <strong>in</strong>formation regard<strong>in</strong>g <strong>Iceland</strong>ic salmon rivers.<br />
17
Cond- Lentht Catchement Glacier Wetted Average Fish<strong>in</strong>g Number Fish<strong>in</strong>g Record<strong>in</strong>g Exploi-<br />
River 1st Order 2end order 3rd order River ductivity Length opend area area Production Average Max M<strong>in</strong> catch method <strong>of</strong> method log- Counter Count<strong>in</strong>g tation<br />
Tributary Tributary Tributary Type µS/cm pH km km km2 km2 m2 units catch catch catch ha Rod rods nets book <strong>in</strong>stalled period %<br />
1 Elliðaár L+S+D 83 6 280 199711 5832 1152 2071 414 57,7 1 6 1 1 1935 42<br />
Hólmsá D+S 84 11 + 1 1<br />
Suðurá L 85 + 1 1<br />
1 Úlfarsá (Korpa) S+D+L 84 3 4 54 95111 1715 305 709 110 32,1 1 2 1<br />
1 Leirvogsá D 73 8,1 10 85 483 1057 136 1 3 1 1 2000 40<br />
1 Kiðafellsá D 86 4 + 1 1 1<br />
1 Laxá í Kjós D+S 50 1 19,2 211 894266 17619 1308 3422 629 14,6 1 12 1<br />
Bugða D+S 57 4 64 224 461 90 1 1<br />
Meðalfellsvatn S 20 1 1<br />
Dælisá D 46 21 + 1<br />
1 Brynjudalsá D 33 0,5 9,5 42 149 597 11 1 2 1<br />
1 Botnsá D+S 64 3 8 79 114 247 20 1 4 1<br />
1 Laxá í Leirársveit D+S 13 9,1 142 418683 11524 1034 1887 545 24,7 1 7 1 1 2000<br />
Selós S 0,5 + 1 1<br />
Þverá S 1 + 1 1<br />
Vötn í Svínadal S + 1 1<br />
1 Leirá í Leirársveit D 66 7 44 20 1 1 1<br />
1 Hvítá í Borgarfirði D+L+J 66 56 3880 461 788 213 1 12 1 1<br />
Andakílsá D+S 57 8 214 147 331 63 1 2 1<br />
Grímsá D+S 77 31 313 2395118 28254 1345 2116 717 5,6 1 12 1<br />
Tunguá D 83 11 67 + 1 1<br />
Flókadalsá D 79 5 14 160 346 613 181 1 4 1<br />
Reykjadalsá D+L 133 25 210 994824 14588 98 275 25 1,0 1 2 1<br />
Þverá D 93 8,0 18 482 2380544 54630 1910 4165 1082 8,0 1 12 1<br />
Kjarrá D 96 8,2 31 200 827001 + 1 1<br />
Litla-Þverá D 113 14 122 346908 + 1 1<br />
Norðurá D 48 8,4 15 67 3919304 53289 1621 3138 856 4,1 1 16 1 1 2002<br />
Norðl<strong>in</strong>gafljót D+L+J 70 8,5 66 920 200 + 1 1<br />
Gljúfurá D 54 5 8 50 206 522 73 1 3 1<br />
Gufuá D 113 17 40 + 1 1 1<br />
1 Langá D+S 44 8,5 0,5 22 206 1028518 22736 1392 2405 610 13,5 1 13 1 1 2000<br />
Urriðaá 156 20 56 71 202 13 1 1 1<br />
1 Álftá L+D 74 7,8 10 15 118 283 485 132 1 3 1<br />
1 Hítará S+D 70 7,9 16 13 318 356 706 151 1 6 1<br />
1 Haffjarðará L+D+S 13 300 716 1290 465 1 7 1<br />
1 Núpá í Eyjahreppi D 59 9 + 1 1<br />
1 Laxá í Miklaholtshr. D 10 + 1 1<br />
1 Straumfjarðará D+S 68 7,7 8 1,5 221 402320 10677 352 755 161 8,7 1 4 1<br />
1 Vatnasvæði Lýsu D 74 3,3 126 325 17 1 2 1<br />
1 Staðará 73 8 + 1 2 1<br />
1 Gríshólsá D 5 52 125 5 1 1 1<br />
Bakkaá D + 1<br />
1 Fróðá D+L 4 4 82 254 13 1 2 1<br />
1 Setbergsá D 62 7,6 1,5 11 37 111 296 0 1 2 1<br />
1 Laxá á Skógarströnd D 68 2 46 128 277 33 1 2 1<br />
1 Svínafossá í Heydal D 74 7,8 0,7 41 43 43 43 1 1<br />
1 Dunká D 57 4,5 44 97 169 39 1 1 1<br />
1 Hörðudalsá D 48 7,7 18 94 45 116 1 1 2 1<br />
1 Skrauma D 70 2,5 59 11 32 0 1 2 1<br />
1 Miðá D 7,8 22 220 119 258 31 1 2 1<br />
Tunguá D 3 32 + 1 1<br />
1 Haukadalsá neðri D+S 54 6 239 664 1232 331 1 6 1<br />
Haukaldalsvatn S + 1<br />
Haukadalsá efri D 10 34 19 27 9 1 2 1<br />
1 Laxá í Dölum D 88 24 256 994 2385 324 1 8 1<br />
1 Fáskrúð D 51 8 133 223 464 96 1 3 1<br />
1 Glerá D 1,5 61 + 1 1<br />
1 Ljá D 128 8 35 + 1 1<br />
1 Laxá í Hvammssveit D 67 3,5 97 + 1 1<br />
1 Flekkudalsá D 44 2 18 147 241 509 100 1 3 1<br />
1 Krossá D 59 2 10 47 114270 3072 104 208 27 9,1 1 2 1 1 1999<br />
1 Búðardalsá D 34 7,5 0,3 11,9 66 100 341 31 1 2 1<br />
1 Staðarhólsá D 80 6 55 161 768 18 1 4 1<br />
Hvolsá D 78 9 68 + 1 1<br />
1 Gufudalsá D 36 6 53 + 1 1<br />
1 Þorskafjarðará D 38 5 + 1 1<br />
1 Fjarðarhornsá D 40 6 + 1 1 1<br />
1 Mórudalsá D + 1 1<br />
1 Suðurfossá D 3 37 + 1<br />
1 Langadalsá D 32 20 334 158 444 31 1 4 1<br />
1 Ísafjarðará D 29 7,5 4 68 16 55 3 1 0,5 1<br />
1 Laugardalsá D+S 0,3 10 56 316 703 111 1 4 1<br />
1 Hvannadalsá D 44 7,6 5 90 77 304 23 1 1 1<br />
1 Selá í Skjaldfannardal D+J 8 210 25 + 1 1<br />
1 Bjarnarfjarðará D 9 152 + 1<br />
1 Selá í Ste<strong>in</strong>grímsf. D 8 218 28 95 0 1 1 1<br />
1 Staðará í Ste<strong>in</strong>g. D 30 12,5 170 64 169 6 1 0,5 1<br />
1 Víðidalsá í Ste<strong>in</strong>gr. D 1 72 49 182 0 1 2 1<br />
1 Hrófá D 7 74 48 94 14 1 1 1<br />
1 Prestbakkaá D 140 8 40 49 123 8 1 0,5 1<br />
1 Krossá D 53 6 55 83 180 19 1 1 1<br />
1 Víkurá D 76 11 57 80 219 5 1 1 1<br />
1 Laxá í Hrútafirði D 128 5 57 48 165 2 1 1 1<br />
1 Hrútafjarðará D 57 9 367 18<br />
291 631 126 1 3 1<br />
Síká D 82 3,2 107 + 1
Annex 1. (cont<strong>in</strong>ued)<br />
Cond- Lentht Catchement Glacier Wetted Average Fish<strong>in</strong>g Number Fish<strong>in</strong>g Record<strong>in</strong>g Exploi-<br />
River 1st Order 2end order 3rd order River ductivity Length opend area area Production Average Max M<strong>in</strong> catch method <strong>of</strong> method log- Counter Count<strong>in</strong>g tation<br />
Tributary Tributary Tributary Type µS/cm pH km km km2 km2 m2 units catch catch catch ha Rod rods nets book <strong>in</strong>stalled period %<br />
1 Tjarnará D 2,5 6 72 38 112 0 1 0,5 1<br />
1 Hamarsá D 78 8,2 9 54 10 1 1 1<br />
1 Miðfjarðará D 90 33 790 1 11 1<br />
Vesturá D 139 16 21 286 1 1<br />
Austurá D 11 12 213 1 1 1 2000<br />
Núpsá D 139 33 107 1 1<br />
1 Víðidalsá D+S 106 23 914 2453913 75618 1153 2023 580 4,7 1 8 1<br />
Fitjá D 91 12 18 283 + 1<br />
1 Vatnsdalsá D+S 81 32 2 1170 1486643 887 1582 323 6,0 1 6 1<br />
Álka D 2 291 + 1<br />
1 Giljá D 80 2 94 10 1 1 1<br />
1 Gljúfurá D 63 1,1 25,9 107 50 1<br />
1 Laxá á Ásum S+D 92 13 294 274189 9468 1057 1881 308 38,6 1 2 1<br />
Fremri Laxá á Ásum S+D 6 19 241 10 1 2 1<br />
1 Blanda D+J 71 8,4 77 2370 183 1017 2363 357 1 13 1 1982<br />
Svartá D 80 480 1147259 11932 290 619 46 2,5 1 3 1 1 1982-1985<br />
Hlíðará D 57 59 + 1 1<br />
Auðólfsstaðaá D 59 + 1<br />
Gilsá D+S 69 0,1 ext<strong>in</strong>ct<br />
Galtará D 126 3 0,024 ext<strong>in</strong>ct<br />
Haugakvísl D 125 15 0,17 ext<strong>in</strong>ct<br />
Herjólfslækur D 109 8 0,03 ext<strong>in</strong>ct<br />
Sandá D 99 1 0,002 ext<strong>in</strong>ct<br />
Kúlukvísl D+L 95 3 0,02 ext<strong>in</strong>ct<br />
Seyðisá L 70 15 330 + ext<strong>in</strong>ct<br />
1 Laxá á Refasveit D 64 2 8,2 168 126 297 39 1 2 1<br />
Norðurá D 55 + 1<br />
1 Hallá D 94 14 57 71 197 0 1 1 1<br />
1 Laxá í Nesjum S+D 2 10 1 1 1<br />
1 Fossá á Skaga D+S 1,5 68 25 98 5 1 0,5 1<br />
1 Laxá á Skaga D 71 23 150 88 245 0 1 2 1<br />
1 Héraðsvötn D+J 3650 239 20 1 8 1 1<br />
Húseyjarkvísl D 106 30 481 101 245 32 1 3 1<br />
Sæmundará D 95 24 172 93 303 18 1 2 1<br />
Norðurá í Skagafirði D 15 400 + 1 1<br />
H<strong>of</strong>sá D+(J) 72 482 29 10 1 1<br />
1 Kolka D+J 3 483 17,5 21 58 5 1 1<br />
Hjaltadalsá D+J 29 22 306 8 + 1<br />
Kolbe<strong>in</strong>sdalsá D+J 33 15 160 9,5 + 1<br />
1 Hrollleifsdalsá D 87 7 83 17 65 1 1 2 1<br />
1 Flókadalsá D+S 54 9 95 47 164 2 1 2 1<br />
1 Fljótaá S+D 58 7,5 144 160 388 49 1 3 1<br />
Brúnastaðaá D 1 34 +<br />
1 Ólafsfjarðará S+D 9 157 + 1 1<br />
1 Svarfaðardalsá D+J 41 25 450 20 + 1 1<br />
1 Þorvaldsdalsá D 36 2 118 + 1 2 1<br />
1 Hörgá D+J 26 28 710 10 + 1 1<br />
Öxnadalsá D 27 292 + 1<br />
1 Eyjafjarðará D 30 45 1300 18 71 3 1 0,5 1<br />
1 Fnjóská D 36 3 30 1310 247 554 60 1 7 1<br />
1 Skjálfandafljót D+L+J 74 21 52 3860 140 406 932 67 1 2 1<br />
Djúpá S+D 40 7 112 44 85 10 1 1<br />
1 Laxá í Aðaldal L+S 157 9,2 26 2150 2369370 16650 1651 3063 624 7,0 1 18 1<br />
Reykjadalsá L+D+S 80 30 234 306000 222 657 25 7,3 1 4 1 1<br />
Mýrarkvísl L+D+S 89 7 20 263 230515 230 490 49 10,0 1 3 1<br />
Þverá D+L 70 7 +<br />
1 Litluárvötn L 145 + 1 1<br />
Skjálftavatn S + 1<br />
1 Jökulsá á Fjöllum J+L+D 118 8,2 7750 1400 +<br />
Brunná L+D 94 265 + 1 1<br />
1 Deildará D+S 100 12 46 167 391 27 1 2 1<br />
1 Ormarsá L+D 89 30 232 188 366 45 1 5 1<br />
1 Svalbarðsá D 93 4 350 176 384 29 1 2 1<br />
1 Sandá D 68 8,0 10 257 230 474 35 1 2 1<br />
1 Hafralónsá D 68 28 562 1097050 30952 234 402 25 2,1 1 9 1<br />
Kverká D 157 + 1 1<br />
1 Kverká 68 + 1 1 1<br />
1 Hölkná D 73 11 70 88 219 11 1 2 1<br />
1 Miðfjarðá D 90 3,2 300 136 248 15 1 2 1<br />
Kverká D + 1 1<br />
1 Selá í Vopnafirði D 76 7,5 20 750 962800 23788 980 2316 123 10,2 1 7,3 1 1 2004<br />
1 Vesturdalsá D 127 28 190 495900 13774 216 513 34 4,4 1 3 1 1 1996<br />
1 H<strong>of</strong>sá D 79 20 20 110 1792090 32913 1082 2238 141 6,0 1 7 1<br />
Sunnudalsá D 62 200 + 1<br />
1 Selfljót D 22 42 458 35 98 5 1 8 1<br />
Gilsá D 20 + 1<br />
1 Lagarfljót D+S+J 54 22 111 2900 140 + 1 1 1 1 2004<br />
Kelduá D+J 445 5 + 1<br />
Eyv<strong>in</strong>dará D+L 32 7,8 230 + 1<br />
Rangá D 75 6,8 130 + 1<br />
Grímsá D 44 585 + 1<br />
1 Fjarðará, Borgarf. D 128 17 44 1 1 1<br />
1 Fjarðará, Seyðisfirði. D 71 + 1 1<br />
Norðfjarðará D + 1 1<br />
1 Fjarðará, Loðmundarf. D + 1 1<br />
Fjarðará Hellisfirði D 31 + 1 1<br />
Reyðarfjarðará D 21 + 1 1<br />
19
Annex 1. (cont<strong>in</strong>ued)<br />
Cond- Lentht Catchement Glacier Wetted Average Fish<strong>in</strong>g Number Fish<strong>in</strong>g Record<strong>in</strong>g Exploi-<br />
River 1st Order 2end order 3rd order River ductivity Length opend area area Production Average Max M<strong>in</strong> catch method <strong>of</strong> method log- Counter Count<strong>in</strong>g tation<br />
Tributary Tributary Tributary Type µS/cm pH km km km2 km2 m2 units catch catch catch ha Rod rods nets book <strong>in</strong>stalled period %<br />
1 Breiðdalsá D 57 10 23 370 1 1 8 1 1 2004<br />
T<strong>in</strong>nudalsá D 26 151 184 815 4 1<br />
1 Geithellnaá D 28 184 + 1<br />
1 Laxá í Nesjum D 80 55 75 202 8 1 1<br />
1 Skaftá J+L+D 69 52 3000 5 13 0 1 1 1<br />
Fossálar D 55 15 + 1 1<br />
Geirlandsá D 53 22 51 162 12 1 2 1<br />
Stjórn D 72 1 36 + 1<br />
Þverá L+S 59 1 + 1<br />
Hörgsá á Síðu D 50 10 40 12 20 9 1<br />
Fjaðrá D 75 2 35 + 1<br />
1 Grenlækur L 112 30 5 20 0 1 1 1 1998<br />
1 Eldvatn í Meðallandi L 113 26 16 51 3 1 1<br />
1 Kúðafljót D 33 182 + 1 1 1<br />
Tungufljót D 76 9 27 74 8 1 6 1<br />
1 Kerl<strong>in</strong>gardalsá J+D+L 103 12 93 22 71 169 16 1 1<br />
Vatnsá S+D+L 103 2 20 + 1 1<br />
Heiðarvatn S + 1 1<br />
1 Skógaá D+L 56 78 3 + 1 1<br />
1 Markarfljót J+D+L 105 1200 240 + 1<br />
Seljalandsá L 11 +<br />
1 Affall, A-Landeyjum L + 1 1<br />
1 Hólsá L 1860 + 1 1<br />
Ytri-Rangá L 177 17 51 1000 + 1 10 1 1 2000<br />
Þverá L 178 784 8 + 1 14 1<br />
Eystri-Rangá L 101 8,5 28 562 8 + 1 13 1<br />
1 Þjórsá D+J+L 83 48 57 7530 1010 N1950 5532 784 1 1 1 1997<br />
M<strong>in</strong>nivallarlækur L 99 + 1 1<br />
Kálfá D 95 11 85 45 130 2 1 2 1<br />
Fossá D+L 223 + 1 1<br />
Þverá D + 1<br />
1 Ölfusá L+D+J+S 75 6100 620 N3458 7415 1186 1 14 1 1<br />
S350 825 6 1<br />
Þorleifslækur D+L 208 13 115 + 1 8<br />
Sog L+S 75 8 1200 1293500 11849 390 714 223 3,02 1 6 1<br />
Ásgarðslækur 95 20 1 1 1<br />
Tunguá D+L + 1<br />
Hvítá L+D+J 62 69 4500 620 N2761 8480 1215 1 22 1 1<br />
S708 1169 190 1<br />
Brúará L 56 19 225 49 92 14 1 1<br />
Hagaós L+S 278 + 1 2 1<br />
Hólaá L+S 81 + 1<br />
Fullsæll D+L + 1<br />
Tungufljót L+J 51 11 770 250 + 1 2 1 1 2007<br />
Höskuldslækur + 1<br />
Litla-Laxá D 83 105 20 1 2 1 1 2007<br />
Stóra-Laxá D 53 37 512 300 707 76 1 10 1<br />
Dalsá D 31 + 1 1 1<br />
Fossá D 30 + 1 1 1<br />
1 Hróarsholtslækur L 15 16,5 22 59 8 1 1<br />
20