

Mathematica Basics
Mathematica Basics
Mathematica Basics

You also want an ePaper? Increase the reach of your titles
YUMPU automatically turns print PDFs into web optimized ePapers that Google loves.
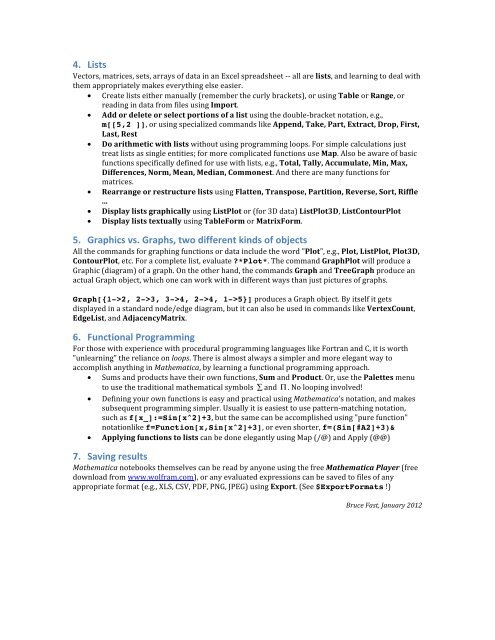
4. Lists <br />
Vectors, matrices, sets, arrays of data in an Excel spreadsheet -‐-‐ all are lists, and learning to deal with <br />
them appropriately makes everything else easier. <br />
• Create lists either manually (remember the curly brackets), or using Table or Range, or <br />
reading in data from files using Import. <br />
• Add or delete or select portions of a list using the double-‐bracket notation, e.g., <br />
m[[5,2 ]], or using specialized commands like Append, Take, Part, Extract, Drop, First, <br />
Last, Rest <br />
• Do arithmetic with lists without using programming loops. For simple calculations just <br />
treat lists as single entities; for more complicated functions use Map. Also be aware of basic <br />
functions specifically defined for use with lists, e.g., Total, Tally, Accumulate, Min, Max, <br />
Differences, Norm, Mean, Median, Commonest. And there are many functions for <br />
matrices. <br />
• Rearrange or restructure lists using Flatten, Transpose, Partition, Reverse, Sort, Riffle <br />
... <br />
• Display lists graphically using ListPlot or (for 3D data) ListPlot3D, ListContourPlot <br />
• Display lists textually using TableForm or MatrixForm. <br />
5. Graphics vs. Graphs, two different kinds of objects <br />
All the commands for graphing functions or data include the word "Plot", e.g., Plot, ListPlot, Plot3D, <br />
ContourPlot, etc. For a complete list, evaluate *Plot*. The command GraphPlot will produce a <br />
Graphic (diagram) of a graph. On the other hand, the commands Graph and TreeGraph produce an <br />
actual Graph object, which one can work with in different ways than just pictures of graphs. <br />
Graph[{1->2, 2->3, 3->4, 2->4, 1->5}] produces a Graph object. By itself it gets <br />
displayed in a standard node/edge diagram, but it can also be used in commands like VertexCount, <br />
EdgeList, and AdjacencyMatrix. <br />
6. Functional Programming <br />
For those with experience with procedural programming languages like Fortran and C, it is worth <br />
"unlearning" the reliance on loops. There is almost always a simpler and more elegant way to <br />
accomplish anything in <strong>Mathematica</strong>, by learning a functional programming approach. <br />
• Sums and products have their own functions, Sum and Product. Or, use the Palettes menu <br />
to use the traditional mathematical symbols ∑ and Π . No looping involved! <br />
• Defining your own functions is easy and practical using <strong>Mathematica</strong>'s notation, and makes <br />
subsequent programming simpler. Usually it is easiest to use pattern-‐matching notation, <br />
such as f[x_]:=Sin[x^2]+3, but the same can be accomplished using "pure function" <br />
notationlike f=Function[x,Sin[x^2]+3], or even shorter, f=(Sin[#A2]+3)& <br />
• Applying functions to lists can be done elegantly using Map (/@) and Apply (@@) <br />
7. Saving results <br />
<strong>Mathematica</strong> notebooks themselves can be read by anyone using the free <strong>Mathematica</strong> Player (free <br />
download from www.wolfram.com), or any evaluated expressions can be saved to files of any <br />
appropriate format (e.g., XLS, CSV, PDF, PNG, JPEG) using Export. (See $ExportFormats !) <br />
Bruce Fast, January 2012

![[PDF] The Thickness and Chromatic Number of r - Gammeter.com](https://img.yumpu.com/3978766/1/190x245/pdf-the-thickness-and-chromatic-number-of-r-gammetercom.jpg?quality=85)