calculating global energy sector jobs - Institute for Sustainable Futures
calculating global energy sector jobs - Institute for Sustainable Futures
calculating global energy sector jobs - Institute for Sustainable Futures

You also want an ePaper? Increase the reach of your titles
YUMPU automatically turns print PDFs into web optimized ePapers that Google loves.
<strong>Institute</strong> <strong>for</strong> <strong>Sustainable</strong> <strong>Futures</strong>, UTS June 2012<br />
Production<br />
2009<br />
Domestic<br />
production<br />
Employment<br />
Productivity<br />
Average<br />
<strong>energy</strong><br />
content<br />
Employment<br />
per primary<br />
<strong>energy</strong><br />
Million<br />
tons<br />
% ‘000s<br />
Tons/<br />
person/<br />
year<br />
GJ/ ton<br />
Person<br />
years/ PJ<br />
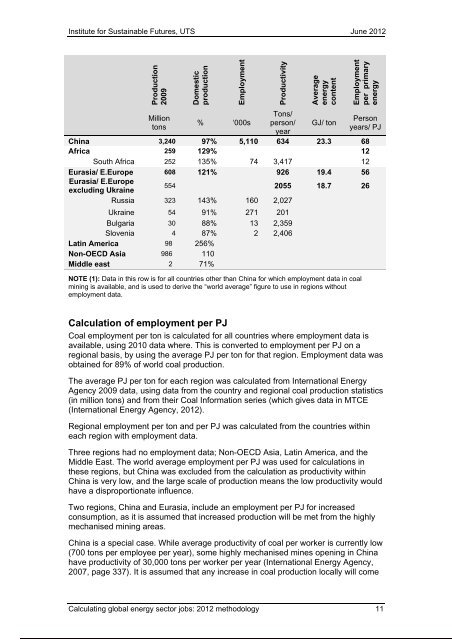
China 3,240 97% 5,110 634 23.3 68<br />
Africa 259 129% 12<br />
South Africa 252 135% 74 3,417 12<br />
Eurasia/ E.Europe 608 121% 926 19.4 56<br />
Eurasia/ E.Europe<br />
excluding Ukraine<br />
554 2055 18.7 26<br />
Russia 323 143% 160 2,027<br />
Ukraine 54 91% 271 201<br />
Bulgaria 30 88% 13 2,359<br />
Slovenia 4 87% 2 2,406<br />
Latin America 98 256%<br />
Non-OECD Asia 986 110<br />
Middle east 2 71%<br />
NOTE (1): Data in this row is <strong>for</strong> all countries other than China <strong>for</strong> which employment data in coal<br />
mining is available, and is used to derive the “world average” figure to use in regions without<br />
employment data.<br />
Calculation of employment per PJ<br />
Coal employment per ton is calculated <strong>for</strong> all countries where employment data is<br />
available, using 2010 data where. This is converted to employment per PJ on a<br />
regional basis, by using the average PJ per ton <strong>for</strong> that region. Employment data was<br />
obtained <strong>for</strong> 89% of world coal production.<br />
The average PJ per ton <strong>for</strong> each region was calculated from International Energy<br />
Agency 2009 data, using data from the country and regional coal production statistics<br />
(in million tons) and from their Coal In<strong>for</strong>mation series (which gives data in MTCE<br />
(International Energy Agency, 2012).<br />
Regional employment per ton and per PJ was calculated from the countries within<br />
each region with employment data.<br />
Three regions had no employment data; Non-OECD Asia, Latin America, and the<br />
Middle East. The world average employment per PJ was used <strong>for</strong> calculations in<br />
these regions, but China was excluded from the calculation as productivity within<br />
China is very low, and the large scale of production means the low productivity would<br />
have a disproportionate influence.<br />
Two regions, China and Eurasia, include an employment per PJ <strong>for</strong> increased<br />
consumption, as it is assumed that increased production will be met from the highly<br />
mechanised mining areas.<br />
China is a special case. While average productivity of coal per worker is currently low<br />
(700 tons per employee per year), some highly mechanised mines opening in China<br />
have productivity of 30,000 tons per worker per year (International Energy Agency,<br />
2007, page 337). It is assumed that any increase in coal production locally will come<br />
Calculating <strong>global</strong> <strong>energy</strong> <strong>sector</strong> <strong>jobs</strong>: 2012 methodology 11
![Energy [R]evolution - European Commission](https://img.yumpu.com/49109324/1/184x260/energy-revolution-european-commission.jpg?quality=85)
![5905 gp [eu rev]csfr4.qxd - Energy [R]evolution](https://img.yumpu.com/42305023/1/184x260/5905-gp-eu-revcsfr4qxd-energy-revolution.jpg?quality=85)

![5905 gp [eu rev]csfr4.qxd - Energy [R]evolution](https://img.yumpu.com/28729264/1/184x260/5905-gp-eu-revcsfr4qxd-energy-revolution.jpg?quality=85)