presentation - TSYS
presentation - TSYS
presentation - TSYS

Create successful ePaper yourself
Turn your PDF publications into a flip-book with our unique Google optimized e-Paper software.
<strong>TSYS</strong> to Acquire NetSpend<br />
February 19, 2013<br />
© 2013 Total System Services, Inc. ® All rights reserved worldwide.
Disclosure<br />
Cautionary Statement Regarding Forward‐Looking Statements<br />
This <strong>presentation</strong> contains statements that constitute "forward‐looking statements" within the meaning of the federal securities laws. These forward‐looking<br />
statements include, among others, statements about the benefits of the proposed acquisition, including the expected impact on <strong>TSYS</strong>' revenue and earnings, the<br />
expected growth rate of the prepaid card industry, including payroll cards, and the expected timing for closing the acquisition. These statements are based on the<br />
current beliefs and expectations of <strong>TSYS</strong>' and NetSpend's management, as applicable, and are subject to known and unknown risks and uncertainties. Actual results<br />
may differ materially from those contemplated by the forward‐looking statements. A number of important factors could cause actual results to differ materially from<br />
those contemplated by the forward‐looking statements, including, but not limited to our ability to achieve expected synergies and successfully complete the<br />
integration of NetSpend, events that could give rise to a termination of the merger agreement or failure to receive necessary approvals or financing for the<br />
acquisition, the outcome of any litigation related to the transaction, and the level of expenses and other charges related to the acquisition and related financing<br />
transactions. For further information regarding the risks associated with <strong>TSYS</strong>' and NetSpend's businesses, please refer to the respective filings with the SEC and the<br />
proxy statement and other materials that will be filed with the SEC by NetSpend in connection with the transaction. There can be no assurance that the transaction<br />
will be completed, or if it is completed, that it will close within the anticipated time period or that the expected benefits of the transaction will be realized. We believe<br />
these forward‐looking statements are reasonable; however, undue reliance should not be placed on any forward‐looking statements, which are based on current<br />
expectations. We do not assume any obligation to update any forward‐looking statements as a result of new information, future developments or otherwise.<br />
Additional Information and Where to Find It<br />
In connection with the transaction, NetSpend will file a proxy statement and other materials with the SEC. INVESTORS AND SECURITY HOLDERS ARE ADVISED TO READ<br />
THE PROXY STATEMENT AND OTHER RELEVANT MATERIALS WHEN THEY BECOME AVAILABLE BECAUSE THEY WILL CONTAIN IMPORTANT INFORMATION ABOUT<br />
NETSPEND AND THE TRANSACTION. Investors and security holders may obtain free copies of these documents (when they are available) and other documents filed<br />
with the SEC at the SEC’s web site at www.sec.gov. In addition, the documents filed by NetSpend with the SEC may be obtained free of charge by contacting<br />
NetSpend at Chief Financial Officer, Attn: Investor Relations, NetSpend Corporation, 701 Brazos Street, Austin, TX 78701. NetSpend’s filings with the SEC are also<br />
available on its website at www.netspend.com.<br />
Participants in the Solicitation<br />
NetSpend and its officers and directors and <strong>TSYS</strong> and its officers and directors may be deemed to be participants in the solicitation of proxies from NetSpend<br />
stockholders with respect to the transaction. Information about NetSpend’s officers and directors and their ownership of NetSpend common shares is set forth in the<br />
proxy statement for NetSpend’s 2012 Annual Meeting of Stockholders, which was filed with the SEC on March 30, 2012. Information about <strong>TSYS</strong>’ officers and<br />
directors is set forth in the proxy statement for <strong>TSYS</strong>’ 2012 Annual Meeting of Shareholders, which was filed with the SEC on March 15, 2012. Investors and security<br />
holders may obtain more detailed information regarding the direct and indirect interests of the participants in the solicitation of proxies in connection with the<br />
transaction by reading the preliminary and definitive proxy statements regarding the transaction, which will be filed by NetSpend with the SEC.<br />
Non‐GAAP Financial Measures<br />
Throughout this <strong>presentation</strong>, we reference certain non‐GAAP financial measures, including revenues before reimbursable items, EBITDA, Adjusted EBITDA, and<br />
combined EBITDA. Please refer to the Appendix to this <strong>presentation</strong> for a discussion of these non‐GAAP financial measures as well as a reconciliation of those<br />
measures to the most directly comparable financial measure required by or presented in accordance with U.S. GAAP. This <strong>presentation</strong> also references certain<br />
combined financial measures which do not reflect any adjustments resulting from the proposed transaction and do not represent a “pro forma” amount determined<br />
in accordance with the SEC’s rules and regulations, including Article 11 of Regulation S‐X.<br />
2 © 2013 Total System Services, Inc. ® All rights reserved worldwide.
Agenda<br />
Introduction<br />
– Philip W. Tomlinson, Chairman of the Board and<br />
Chief Executive Officer, <strong>TSYS</strong><br />
Transaction Overview and Strategic Rationale<br />
– M. Troy Woods, President and Chief Operating Officer, <strong>TSYS</strong><br />
NetSpend Overview<br />
– Dan Henry, Chief Executive Officer, NetSpend<br />
3 © 2013 Total System Services, Inc. ® All rights reserved worldwide.
Transaction Overview<br />
Structure<br />
• $16.00 per share; $1.4 billion enterprise value<br />
Financing<br />
• Cash on hand and $1.3 billion in debt<br />
Pro Forma<br />
• Expected to be accretive to GAAP EPS for the first 12 month period<br />
following closing (excluding one-time acquisition related fees and expenses)<br />
Management<br />
• CEO, Dan Henry and President, Chuck Harris to manage the company<br />
• NetSpend will operate as a standalone business, and will be branded<br />
as "NetSpend, a <strong>TSYS</strong> Company" post-closing<br />
Closing<br />
• Transaction expected to close in mid-2013<br />
• Completion subject to NetSpend shareholder approval, regulatory<br />
approvals and other customary closing conditions<br />
4 © 2013 Total System Services, Inc. ® All rights reserved worldwide.
Strategic Rationale<br />
Huge Market<br />
Opportunity<br />
Entry into large, fast-growing prepaid market; projected to double over next 4-5 years<br />
Prepaid category is still expanding with a large number of verticals and emerging<br />
applications<br />
Differentiation<br />
Opportunity to create new partnerships with <strong>TSYS</strong>’ bank customers<br />
Provide retailers and small businesses a comprehensive set of payment solutions<br />
Expansion<br />
Expands <strong>TSYS</strong>’ customer base beyond banks and merchants direct to consumers<br />
Potential to expand into new segments such as Corporates and Government<br />
Agencies<br />
Opportunity<br />
to Acquire<br />
Industry Leader<br />
Proven track record of growth in GPR and Paycard<br />
Broad distribution and reload network, innovative products, excellent management<br />
Superior strategy focused on creating long-term customer relationships<br />
Diversification<br />
& Compelling<br />
Financials<br />
Diversifies <strong>TSYS</strong>’ offerings and revenue-generating potential<br />
Accretive transaction accelerates <strong>TSYS</strong>’ long-term growth rate<br />
5<br />
© 2013 Total System Services, Inc. ® All rights reserved worldwide.
Huge Market Opportunity<br />
<br />
Expands <strong>TSYS</strong>’ Addressable Market Exponentially<br />
Large Addressable Market (U.S.)*<br />
$4 billion annual revenue opportunity for<br />
Prepaid Program Managers/Issuers<br />
Industry spend<br />
on processing<br />
$0.4B to<br />
$0.5B<br />
$4 Billion<br />
(total pie)<br />
<br />
Provides Access to a Large, High-Growth Market Opportunity<br />
Spending on Open-Loop Prepaid*<br />
GDV projected to grow at 20% CAGR<br />
from 2012 to 2016 ($ billions)<br />
$201<br />
$248<br />
20%<br />
$302<br />
$357<br />
$411<br />
*Source: First Annapolis Consulting<br />
2012E 2013F 2014F 2015F 2016F<br />
6<br />
© 2013 Total System Services, Inc. ® All rights reserved worldwide.
Differentiation and Expansion<br />
Enhances Growth Prospects<br />
Financial<br />
Institutions<br />
•GPR<br />
• Paycard<br />
• Processing and program management<br />
Retail & Small<br />
Business<br />
• Payment acceptance<br />
• Private label<br />
• Marketing offers<br />
•GPR<br />
• Paycard<br />
• Financial Services Center<br />
Innovation,<br />
Markets &<br />
Geographies<br />
• Consumer product capabilities<br />
• New products and segments<br />
• International<br />
7<br />
© 2013 Total System Services, Inc. ® All rights reserved worldwide.
Industry Leader<br />
Growth and Scale<br />
Excellent<br />
Management<br />
Superior, Diversified,<br />
Distribution Network<br />
Focus on Customers<br />
for Life<br />
Extensive Reload<br />
Network<br />
Innovative Products<br />
8<br />
© 2013 Total System Services, Inc. ® All rights reserved worldwide.
Diversification and Compelling Financials<br />
<strong>TSYS</strong> Mix by Segment - Revenue before Reimbursables<br />
2012 Actual ($M) 2012 Pro Forma ($M)<br />
Diversification<br />
North<br />
America<br />
$813<br />
International<br />
$393<br />
Merchant<br />
$412<br />
20% International<br />
$393<br />
NetSpend<br />
North<br />
America<br />
$351<br />
$813<br />
18% Merchant<br />
$412<br />
21%<br />
41%<br />
Immediately<br />
Accretive<br />
• Expected to be accretive to GAAP EPS for the first 12 month period<br />
following closing (excluding one-time acquisition related fees and expenses)<br />
• Increases pro forma expected revenue 1 growth rate from 6-8% to<br />
8-10% in 2013<br />
Strong Financials<br />
• Combined 2012 EBITDA 2 of $613 million – an increase of 16.0%<br />
• Combined entity expected to generate significant free cash flow<br />
Notes: (1) Refers to Revenue before Reimbursables.<br />
(2) NetSpend’s 2012 EBITDA adjusted for one-time Other Losses of $36.99M. See Appendix for non-GAAP to GAAP reconciliation.<br />
9<br />
© 2013 Total System Services, Inc. ® All rights reserved worldwide.
NetSpend Overview<br />
Core Products<br />
• GPR<br />
• Paycard<br />
Value Proposition<br />
• Cardholders – Freedom to be self-banked at a significantly lower cost<br />
• Partners – Ongoing revenue share and reload income<br />
Target Market<br />
• Estimated 68M underbanked and unbanked consumers in the U.S.<br />
Key Metrics<br />
(as of or for LTM 12/31/12)<br />
• 2.4M Active Debit Cards; 1,082K Direct Deposit Accounts<br />
• 500+ Retail Distributors<br />
• 62K+ Distributing Merchant Locations<br />
• 130K+ Reload Locations<br />
• 1,400+ Employer Relationships<br />
• $13.2B Gross Dollar Volume<br />
10 © 2013 Total System Services, Inc. ® All rights reserved worldwide.
Strategy and Differentiators<br />
Underserved Market<br />
Innovative Products<br />
Mission:<br />
To empower consumers with the convenience,<br />
security and freedom to be self-banked<br />
Technology<br />
Distribution Network<br />
11<br />
© 2013 Total System Services, Inc. ® All rights reserved worldwide.
Product Capabilities<br />
NetSpend’s Value Proposition<br />
Additional Features<br />
• Online Load Options<br />
• Online Financial Planners<br />
• Budgeting Tools<br />
• Free Online Banking<br />
• Comprehensive Bill Pay Options<br />
• Online Checks and Money<br />
Orders<br />
• Companion Cards<br />
• Custom Cards<br />
• Refer a Friend Incentives<br />
• Marketplace Discounts<br />
• Financial Literacy<br />
• Merchant Rewards<br />
12<br />
© 2013 Total System Services, Inc. ® All rights reserved worldwide.
Distribution Network<br />
Channel Retail Partner Direct Paycard<br />
Description<br />
Emerging leader in<br />
prepaid cards sold<br />
through traditional<br />
retail merchants<br />
A leader in prepaid<br />
cards sold through<br />
alternative financial<br />
solutions<br />
A leader in prepaid<br />
cards sold through<br />
online and direct<br />
channels<br />
Leading corporate<br />
payroll card<br />
provider<br />
% Revenue<br />
Contribution<br />
(QTD Dec-12)<br />
8% 49% 25% 18%<br />
Key Partners<br />
13<br />
© 2013 Total System Services, Inc. ® All rights reserved worldwide.
Track Record of Growth<br />
Revenue<br />
Adjusted EBITDA*<br />
(in millions)<br />
(in millions)<br />
351.3<br />
96.2<br />
275.4<br />
306.3<br />
84.2<br />
225.0<br />
65.6<br />
183.2<br />
128.6<br />
31.3<br />
37.3<br />
40.4<br />
2007 2008 2009 2010 2011 2012<br />
2007 2008 2009 2010 2011 2012<br />
* EBITDA plus stock-based compensation expense and adjusted for non-recurring gains and losses<br />
14<br />
© 2013 Total System Services, Inc. ® All rights reserved worldwide.
Winning Combination<br />
• An industry leader in processing<br />
and acquiring<br />
• Blue chip bank and merchant<br />
relationships<br />
• Global brand and reputation<br />
• People-Centered Payments<br />
• Proven M&A execution<br />
People-Centered<br />
Payments<br />
• An industry leader in prepaid<br />
• Strong mix of distribution<br />
channels<br />
• Innovative products<br />
• Successful strategy focused<br />
on customer longevity<br />
• Excellent management team<br />
15<br />
© 2013 Total System Services, Inc. ® All rights reserved worldwide.
Appendix<br />
16<br />
© 2013 Total System Services, Inc. ® All rights reserved worldwide.
Appendix Non-GAAP Reconciliation –<br />
Description of Non-GAAP Financial Measures<br />
<strong>TSYS</strong> Revenues Before Reimbursable Items – <strong>TSYS</strong> computes revenues before reimbursable items by adjusting<br />
revenues to remove the effect of revenue it receives for out-of-pocket expenses that are reimbursed by its clients. These<br />
expenses consist primarily of postage, access fees and third party software.<br />
NetSpend’s EBITDA and Adjusted EBITDA – NetSpend’s Adjusted EBITDA is based on the definition of NetSpend’s<br />
Adjusted EBITDA as used in its press releases, investor <strong>presentation</strong>s and filings with the SEC. NetSpend computes<br />
Adjusted EBITDA by adjusting net income or net loss to remove the effect of income and expenses related to interest,<br />
taxes, depreciation and amortization (“NetSpend’s EBITDA") and then adjusting for stock-based compensation and nonrecurring<br />
gains and losses.<br />
<strong>TSYS</strong> EBITDA – <strong>TSYS</strong> computes EBITDA by adjusting net income to remove the effect of income and expenses related to<br />
equity in income of equity investments, income taxes, nonoperating expense, depreciation and amortization.<br />
Combined EBITDA – Combined EBITDA reflects the arithmetic sum of NetSpend’s EBITDA and <strong>TSYS</strong>’ EBITDA. This<br />
<strong>presentation</strong> also includes Combined EBITDA excluding NetSpend’s one-time Other Losses. These financial metrics do<br />
not reflect any adjustments resulting from the proposed transaction (including any potential synergies) and do not<br />
represent a “pro forma” amount determined in accordance with the SEC’s rules and regulations, including Article 11 of<br />
Regulation S-X.<br />
17<br />
© 2013 Total System Services, Inc. ® All rights reserved worldwide.
Appendix Non-GAAP Reconciliation –<br />
Description of Non-GAAP Financial Measures (continued)<br />
NetSpend and <strong>TSYS</strong> each use non-GAAP financial measures to evaluate and assess their financial performance against<br />
budgets, as well as to evaluate financial performance for executive and management compensation purposes.<br />
NetSpend and <strong>TSYS</strong> each believe that their non-GAAP financial measures provide meaningful additional information about<br />
their companies to assist investors in evaluating their operating results. Accordingly, NetSpend and <strong>TSYS</strong> each include<br />
non-GAAP financial measures when reporting their financial results to their shareholders and investors in order to provide<br />
them with an additional tool to evaluate their ongoing business operations.<br />
Although NetSpend and <strong>TSYS</strong> each use non-GAAP financial measures to measure their operating results and assess<br />
their financial performance, these measures are not necessarily comparable to similarly titled captions of other companies,<br />
including each other, due to potential inconsistencies in the method of calculation.<br />
NetSpend and <strong>TSYS</strong> each believe that their use of non-GAAP financial measures provide investors with the same key<br />
financial performance indicators that are utilized by their management teams to assess their operating results, evaluate the<br />
business and make operational decisions on a prospective, going-forward basis. Hence, their management teams provide<br />
disclosure of non-GAAP financial measures to give shareholders and potential investors an opportunity to see their<br />
companies as viewed by management, to assess their companies with some of the same tools that management utilizes<br />
internally and to be able to compare such information with prior periods. NetSpend and <strong>TSYS</strong> each believe that the<br />
<strong>presentation</strong> of GAAP financial measures alone would not provide their shareholders and potential investors with the ability<br />
to appropriately analyze their ongoing operational results, and therefore expected future results. Therefore, NetSpend and<br />
<strong>TSYS</strong> each believe that inclusion of non-GAAP financial measures provides investors with additional information to help<br />
them better understand their financial statements just as their management teams utilize these non-GAAP financial<br />
measures to better understand the their business, manage budgets and allocate resources.<br />
18<br />
© 2013 Total System Services, Inc. ® All rights reserved worldwide.
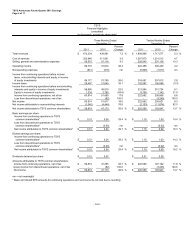
Appendix Non-GAAP Reconciliation –<br />
Revenues Before Reimbursable Items<br />
(in thousands)<br />
2012<br />
Total Revenues $ 1,870,972<br />
Reimbursable Items 252,481<br />
Revenues Before Reimbursable Items $ 1,618,491<br />
Revenues Before Reimbursable Items<br />
By Segment (External Revenues)<br />
2012<br />
North America Services $ 813,462<br />
International Services 392,790<br />
Merchant Services 412,239<br />
$ 1,618,491<br />
19<br />
© 2013 Total System Services, Inc. ® All rights reserved worldwide.
Appendix Non-GAAP Reconciliation –<br />
NetSpend Adjusted EBITDA<br />
(in thousands)<br />
Years Ended December 31,<br />
2007<br />
2008 2009 2010 2011 2012<br />
Net Income (loss) $ 14,726 $ (11,645) $ 18,174 $ 22,732 $ 33,246 $ 18,867<br />
Adjusted for:<br />
Add: Income Taxes 9,368 7,307 12,503 14,368 21,814 12,603<br />
Add: Nonoperating Expense 1,189 4,024 5,138 3,441 2,349 2,459<br />
Add: Depreciation and<br />
Amortization 5,251 8,899 10,297 12,725 15,031 13,778<br />
EBITDA $ 30,534 $ 8,585 $ 46,112 $ 53,266 $ 72,440 $ 47,707<br />
Add: Share-based compensation 754 2,473 4,484 7,268 11,242 11,464<br />
Add: Goodwill and acquired<br />
intangible asset impairment - 26,285 - - - -<br />
Add: One-time Other (Gains)<br />
Losses - - (10,229) 4,374 515 36,988<br />
Adjusted EBITDA $ 31,288 $ 37,343 $ 40,367 $ 65,568 $ 84,197 $ 96,159<br />
20<br />
© 2013 Total System Services, Inc. ® All rights reserved worldwide.
Appendix Non-GAAP Reconciliation –<br />
Combined EBITDA<br />
(in thousands)<br />
<strong>TSYS</strong><br />
Twelve Months<br />
Ended<br />
12/31/2012<br />
NetSpend<br />
Twelve Months<br />
Ended<br />
12/31/2012<br />
Combined<br />
Twelve Months<br />
Ended<br />
12/31/2012<br />
Net Income $ 249,922 $ 18,867 $ 268,789<br />
Adjusted for:<br />
Deduct: Equity in Income of Equity<br />
Investments (10,171) - (10,171)<br />
Add: Income Taxes 115,103 12,603 127,706<br />
Add: Nonoperating Expense 2,798 2,459 5,257<br />
Add: Depreciation and Amortization 170,610 13,778 184,388<br />
EBITDA $ 528,262 $ 47,707 $ 575,969<br />
Add: One-time Other Losses - 36,988 36,988<br />
EBITDA Excluding NetSpend’s One-time<br />
Other Losses $ 528,262 $ 84,695 $ 612,957<br />
NOTE: Excludes NetSpend’s one-time Other Losses of $36,988<br />
21<br />
© 2013 Total System Services, Inc. ® All rights reserved worldwide.