Understanding Nutrient Management Plans
Understanding Nutrient Management Plans
Understanding Nutrient Management Plans

You also want an ePaper? Increase the reach of your titles
YUMPU automatically turns print PDFs into web optimized ePapers that Google loves.
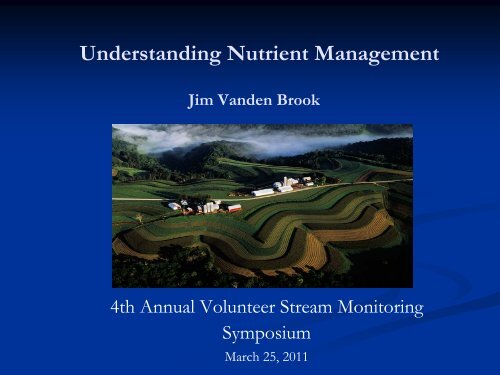
<strong>Understanding</strong> <strong>Nutrient</strong> <strong>Management</strong><br />
Jim Vanden Brook<br />
4th Annual Volunteer Stream Monitoring<br />
Symposium<br />
March 25, 2011
Why Should Water Quality Advocates Care about<br />
<strong>Nutrient</strong> <strong>Management</strong>
Because <strong>Nutrient</strong> <strong>Management</strong> practices affect<br />
much of our water:<br />
Photos courtesy of USDA-NRCS
• In the Lake Mendota<br />
Watershed, agricultural<br />
lands produce 75% of<br />
the phosphorus to Lake<br />
Mendota<br />
• Wisconsin has many<br />
other primarily<br />
agricultural watersheds<br />
that show similar<br />
impacts<br />
• St. Croix Watershed<br />
• Big Eau Pleine<br />
• Can we change this<br />
situation
Some Tentative Conclusions on Phosphorus<br />
Load Reductions to Lake Mendota:<br />
• Lake Mendota’s s water quality will improve relatively soon after<br />
major reductions in P loads delivered to the lake<br />
• P load reductions to Lake Mendota will produce measurable<br />
water quality improvements in downstream lakes<br />
• P load reductions will take a long time to occur without<br />
large, drastic control measures because of high P conc. in<br />
watershed soils. *<br />
R.C. Lathrop & S.R. Carpenter, UW Environmental Forum, 23 Feb. 20102<br />
* Targeted nutrient management on farms could reduce P<br />
loading much more quickly and cheaply than “drastic” measures
<strong>Nutrient</strong> <strong>Management</strong> Planning:<br />
Not Just How to Grow Crops<br />
NRCS 590 standard defines<br />
nutrient management<br />
requirements to minimize<br />
water quality impacts while<br />
maximizing economic<br />
return (Not(<br />
Yield!!!)<br />
Addresses chronic and<br />
acute risks for delivery of<br />
nutrients and sediment<br />
SNAP Plus software<br />
calculates risk of<br />
phosphorus delivery<br />
(P Index)
590 manure spreading restrictions<br />
Frozen and snow covered<br />
ground<br />
• No spreading near lakes and<br />
streams<br />
• No spreading in high risk areas<br />
• Limit liquid manure<br />
applications<br />
Fields close to surface water<br />
• Limit liquid manure<br />
applications
590 Restriction Map<br />
• Available on-line<br />
• Soil Map Units<br />
• 2008 air photo<br />
• Stream/Lake setbacks<br />
• N restricted soils<br />
• Winter restricted soils<br />
• Improved markup<br />
capability
Predicting Phosphorus Runoff:<br />
THE WISCONSIN P INDEX<br />
L. G. Bundy, L. Ward Good, and W.M. Jarrell<br />
Dept. of Soil Science - University of Wisconsin-Madison<br />
http://wpindex.soils.wisc.edu
P Index and Total Annual Runoff P<br />
A tool for targeting and management<br />
Total measured runoff P (lb/a/yr)<br />
36<br />
30<br />
24<br />
18<br />
12<br />
6<br />
0<br />
0 6 12 18 24 30<br />
P Index value<br />
Dr. Laura Ward Good UW Soil<br />
Science
NM standard can reduce P loads<br />
Soil Test P<br />
High Soil P, Low P Index<br />
P Index<br />
Low Soil P, High P Index
P Index Distribution<br />
In Pleasant Valley:<br />
16% of acres yield 60% of P load<br />
84%<br />
7% 9%
Status of <strong>Nutrient</strong> <strong>Management</strong> <strong>Plans</strong><br />
Reported to DATCP - 2010<br />
*<br />
17% of WI<br />
Crop acres<br />
under NM<br />
plan
Another Tool to Manage the<br />
Risk of Runoff<br />
Short term Runoff Prediction
Tools to assist <strong>Nutrient</strong> <strong>Management</strong><br />
Planning & Runoff Risk Prediction
Manure Advisory System – Part 2
March 17, 2011 Forecast
<strong>Nutrient</strong> <strong>Management</strong> practices can reduce risks<br />
and protect water quality:<br />
Photos courtesy of USDA-NRCS
AGRICULTURE, NUTRIENT MANAGEMENT, WATER QUALITY,<br />
VICTORY!