Understanding Nutrient Management Plans
Understanding Nutrient Management Plans
Understanding Nutrient Management Plans

Create successful ePaper yourself
Turn your PDF publications into a flip-book with our unique Google optimized e-Paper software.
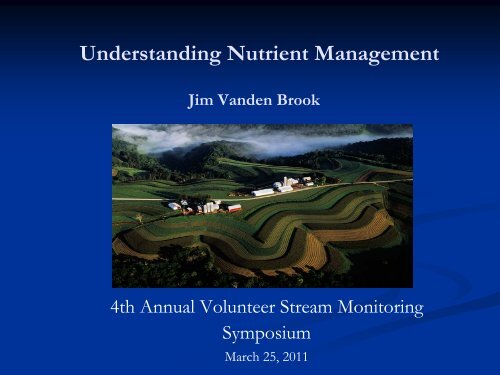
<strong>Understanding</strong> <strong>Nutrient</strong> <strong>Management</strong><br />
Jim Vanden Brook<br />
4th Annual Volunteer Stream Monitoring<br />
Symposium<br />
March 25, 2011
Why Should Water Quality Advocates Care about<br />
<strong>Nutrient</strong> <strong>Management</strong>
Because <strong>Nutrient</strong> <strong>Management</strong> practices affect<br />
much of our water:<br />
Photos courtesy of USDA-NRCS
• In the Lake Mendota<br />
Watershed, agricultural<br />
lands produce 75% of<br />
the phosphorus to Lake<br />
Mendota<br />
• Wisconsin has many<br />
other primarily<br />
agricultural watersheds<br />
that show similar<br />
impacts<br />
• St. Croix Watershed<br />
• Big Eau Pleine<br />
• Can we change this<br />
situation
Some Tentative Conclusions on Phosphorus<br />
Load Reductions to Lake Mendota:<br />
• Lake Mendota’s s water quality will improve relatively soon after<br />
major reductions in P loads delivered to the lake<br />
• P load reductions to Lake Mendota will produce measurable<br />
water quality improvements in downstream lakes<br />
• P load reductions will take a long time to occur without<br />
large, drastic control measures because of high P conc. in<br />
watershed soils. *<br />
R.C. Lathrop & S.R. Carpenter, UW Environmental Forum, 23 Feb. 20102<br />
* Targeted nutrient management on farms could reduce P<br />
loading much more quickly and cheaply than “drastic” measures
<strong>Nutrient</strong> <strong>Management</strong> Planning:<br />
Not Just How to Grow Crops<br />
NRCS 590 standard defines<br />
nutrient management<br />
requirements to minimize<br />
water quality impacts while<br />
maximizing economic<br />
return (Not(<br />
Yield!!!)<br />
Addresses chronic and<br />
acute risks for delivery of<br />
nutrients and sediment<br />
SNAP Plus software<br />
calculates risk of<br />
phosphorus delivery<br />
(P Index)
590 manure spreading restrictions<br />
Frozen and snow covered<br />
ground<br />
• No spreading near lakes and<br />
streams<br />
• No spreading in high risk areas<br />
• Limit liquid manure<br />
applications<br />
Fields close to surface water<br />
• Limit liquid manure<br />
applications
590 Restriction Map<br />
• Available on-line<br />
• Soil Map Units<br />
• 2008 air photo<br />
• Stream/Lake setbacks<br />
• N restricted soils<br />
• Winter restricted soils<br />
• Improved markup<br />
capability
Predicting Phosphorus Runoff:<br />
THE WISCONSIN P INDEX<br />
L. G. Bundy, L. Ward Good, and W.M. Jarrell<br />
Dept. of Soil Science - University of Wisconsin-Madison<br />
http://wpindex.soils.wisc.edu
P Index and Total Annual Runoff P<br />
A tool for targeting and management<br />
Total measured runoff P (lb/a/yr)<br />
36<br />
30<br />
24<br />
18<br />
12<br />
6<br />
0<br />
0 6 12 18 24 30<br />
P Index value<br />
Dr. Laura Ward Good UW Soil<br />
Science
NM standard can reduce P loads<br />
Soil Test P<br />
High Soil P, Low P Index<br />
P Index<br />
Low Soil P, High P Index
P Index Distribution<br />
In Pleasant Valley:<br />
16% of acres yield 60% of P load<br />
84%<br />
7% 9%
Status of <strong>Nutrient</strong> <strong>Management</strong> <strong>Plans</strong><br />
Reported to DATCP - 2010<br />
*<br />
17% of WI<br />
Crop acres<br />
under NM<br />
plan
Another Tool to Manage the<br />
Risk of Runoff<br />
Short term Runoff Prediction
Tools to assist <strong>Nutrient</strong> <strong>Management</strong><br />
Planning & Runoff Risk Prediction
Manure Advisory System – Part 2
March 17, 2011 Forecast
<strong>Nutrient</strong> <strong>Management</strong> practices can reduce risks<br />
and protect water quality:<br />
Photos courtesy of USDA-NRCS
AGRICULTURE, NUTRIENT MANAGEMENT, WATER QUALITY,<br />
VICTORY!