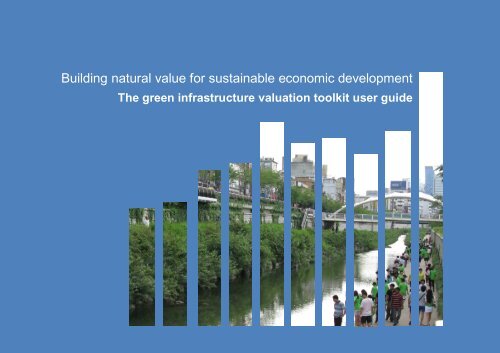
The green infrastructure valuation toolkit user guide
The green infrastructure valuation toolkit user guide
The green infrastructure valuation toolkit user guide

You also want an ePaper? Increase the reach of your titles
YUMPU automatically turns print PDFs into web optimized ePapers that Google loves.
Building natural value for sustainable economic development: <strong>The</strong> <strong>green</strong> <strong>infrastructure</strong> <strong>valuation</strong> <strong>toolkit</strong> <strong>user</strong> <strong>guide</strong><br />
Building natural value for sustainable economic development<br />
<strong>The</strong> <strong>green</strong> <strong>infrastructure</strong> <strong>valuation</strong> <strong>toolkit</strong> <strong>user</strong> <strong>guide</strong><br />
1
Building natural value for sustainable economic development: <strong>The</strong> <strong>green</strong> <strong>infrastructure</strong> <strong>valuation</strong> <strong>toolkit</strong> <strong>user</strong> <strong>guide</strong><br />
Contents<br />
Acknowledgements 2<br />
Overview 4<br />
Developing the <strong>toolkit</strong> 8<br />
Using the <strong>toolkit</strong> 14<br />
1 Climate change adaptation and mitigation 20<br />
2 Flood alleviation and water management 27<br />
3 Place and communities 31<br />
4 Health and wellbeing 35<br />
5 Land and property values 43<br />
6 Investment 44<br />
7 Labour productivity 49<br />
8 Tourism 52<br />
9 Recreation and leisure 56<br />
10 Biodiversity 60<br />
11 Land management 63<br />
Glossary 66<br />
Appendix 1: Case studies 68<br />
Appendix 2: Initial data requirements 74<br />
Appendix 3: Tool index 77<br />
Cover image: Cheonggyecheon, Seoul, Korea. © Nepal Asatthawasi.<br />
2
Building natural value for sustainable economic development: <strong>The</strong> <strong>green</strong> <strong>infrastructure</strong> <strong>valuation</strong> <strong>toolkit</strong> <strong>user</strong> <strong>guide</strong><br />
Acknowledgements<br />
Many people and organisations have been involved in the development of<br />
this <strong>green</strong> <strong>infrastructure</strong> <strong>valuation</strong> <strong>toolkit</strong>.<br />
<strong>The</strong> project was initiated in December 2008 by a consortium of<br />
organisations with remits for economic development, place-making and<br />
protection of the natural environment in England. <strong>The</strong> consortium steering<br />
group was chaired by Natural Economy Northwest, managed by Tees<br />
Valley Unlimited and comprised representatives from <strong>The</strong> Northern Way,<br />
Natural England, Design for London and the Commission for Architecture<br />
and the Built Environment (CABE), with support from the Department for<br />
Environment, Food and Rural Affairs (Defra) and five economic<br />
development agencies: One North East, Yorkshire Forward Advantage<br />
West Midlands, the Northwest Development Agency, and the London<br />
Development Agency.<br />
<strong>The</strong> <strong>green</strong> <strong>infrastructure</strong> <strong>valuation</strong> <strong>toolkit</strong> was predominantly prepared by<br />
Genecon LLP, the consultant appointed for this work. <strong>The</strong> present User<br />
Guide and associated Calculator were brought to their current prototype<br />
form by CABE and Natural England between September and December<br />
2010 in consultation with the consortium steering group.<br />
This project wouldn’t have come to fruition without the hard work,<br />
dedication and good will of a much wider range of individuals. <strong>The</strong><br />
consortium would like to thank all those who have contributed their time<br />
and expertise to the project in different ways: including by enabling a<br />
workshop, providing expert input and feedback on draft materials,<br />
approving funding or by providing data from real-life project examples that<br />
could be used as case studies to test the <strong>toolkit</strong>.<br />
<strong>The</strong> consortium has established the Green Infrastructure Valuation<br />
Network (GIVaN) to facilitate further collaboration. See<br />
www.bit.ly/gi<strong>valuation</strong><strong>toolkit</strong><br />
This work is licensed under a Creative Commons Attribution-<br />
NonCommercial 3.0 Unported License.<br />
Consortium steering group<br />
Ruth Ashton, Yorkshire Forward<br />
Richard Baker, <strong>The</strong> Northern Way<br />
Jamie Dean, Design for London<br />
Giles Golshetti, Defra<br />
Anne Jaluzot, CABE<br />
Nerys Jones, CABE enabler<br />
Martin Moss, Natural England<br />
Malcolm Steele, Tees Valley Unlimited<br />
Will Williams, Natural Economy Northwest<br />
Peter Wilmers, Natural Economy Northwest<br />
Allan Ainslie, Valuation Office Agency<br />
Alexandra Allen, Sustrans<br />
Malcolm Barton, IBIS Environmental and Design<br />
Consultants<br />
Helen Beck, CABE<br />
Dr William Bird, GP<br />
Daniel Boden, Advantage West Midlands<br />
Thomas Bolton, CABE<br />
Graham Clingan, Stockton-on-Tees Borough<br />
Council<br />
Richard Copas, Environment Agency<br />
Ray Flynn, Advantage West Midlands<br />
Dr Susannah Gill, Manchester University<br />
Richard Hall, Natural England<br />
Prof John Handley, Manchester University<br />
Alastair Howarth, One North East<br />
Angela Kennedy, Sustrans<br />
Simon Kytes, Greater London Authority<br />
Consultants<br />
Research and development:<br />
Bruce Bendell, Pleasington Consulting Ltd<br />
Graeme Collinge, Genecon LLP<br />
Kram Sadiq, Genecon LLP<br />
Howard Walker, Genecon LLP<br />
Peer review:<br />
Andrew McNab, Scott Wilson<br />
Petrina Rowcroft, Scott Wilson<br />
Editing:<br />
Rach Colling<br />
<strong>The</strong> consortium wishes to thank the following individuals for their<br />
input and comments<br />
Jon Lovell, Drivers Jonas LLP<br />
Eleanor Lucas, Environment Agency<br />
Edward Maltby, Liverpool University<br />
Peter Massini, Greater London Authority<br />
Ruth Metclaff, Natural England<br />
Andy Mowlah, North West Development<br />
Agency<br />
Paul Nolan, <strong>The</strong> Mersey Forest<br />
Lisa Oakes, Defra<br />
Paul Shaffer, CIRIA<br />
Jonathan Spruce, Tees Valley Unlimited<br />
Melanie Taylor, Leeds City Region<br />
Guy Thompson, White Rose Forest<br />
Nick Thompson, Valuation Office Agency<br />
Gregory Valatin, Forestry Research<br />
Tom Warburton, Homes and Communities<br />
Agency<br />
3
Building natural value for sustainable economic development: <strong>The</strong> <strong>green</strong> <strong>infrastructure</strong> <strong>valuation</strong> <strong>toolkit</strong> <strong>user</strong> <strong>guide</strong><br />
Overview<br />
This work is being published at a time of concern for England’s economy,<br />
environment and society, as the country faces up to a series of profound and<br />
interlinked long term challenges.<br />
In the immediate future, economic austerity means that the rationale for every<br />
investment is being examined as never before and localism is the defining scale<br />
for policy delivery. Every penny spent has to count. Local organisations, local<br />
people and local leaderships will be in the driving seat to address global<br />
challenges in their own area. <strong>The</strong>re is a thirst for practical approaches that can<br />
foster economic growth and improve the places in which we live.<br />
Well designed, planned and managed <strong>green</strong> <strong>infrastructure</strong> can bring a wide range<br />
of benefits to local communities and places – and can underpin sustainable<br />
economic growth. But those who want to make the most of this untapped<br />
potential face a number of challenges. Identifying the key benefits associated with<br />
a <strong>green</strong> asset, demonstrating how a <strong>green</strong> <strong>infrastructure</strong> proposal can add value<br />
to a broader developmental project or choosing between different <strong>green</strong><br />
<strong>infrastructure</strong> approaches are not easily done.<br />
<strong>The</strong> <strong>green</strong> <strong>infrastructure</strong> <strong>valuation</strong> <strong>toolkit</strong> has been developed in response to<br />
these challenges to help local stakeholders make good decisions about the value<br />
of different options for change:<br />
<br />
<br />
It provides a simple framework that can help identify and broadly assess<br />
the benefits of proposed <strong>green</strong> investments and existing <strong>green</strong> assets –<br />
whether those benefits directly contribute to a local economy, or provide<br />
wider non-market returns for society and the environment.<br />
It provides insight in key evidence and concepts from a wide range of<br />
sectors, including economic development and regeneration, public<br />
health, nature conservation – providing a strong platform for improved<br />
mutual understanding and cooperation.<br />
Compiling the evidence base and <strong>valuation</strong> methodologies supporting <strong>The</strong> <strong>green</strong><br />
<strong>infrastructure</strong> <strong>valuation</strong> <strong>toolkit</strong> has been a vast undertaking. As the project<br />
developed, it became clear that there were a number of methodological and data<br />
challenges which were beyond the scope of the project to address. Some<br />
limitations to be aware of include:<br />
<br />
<strong>The</strong> mixed nature of the categories used to group <strong>green</strong> <strong>infrastructure</strong><br />
benefits that can result in risks of double counting.<br />
<br />
<br />
<strong>The</strong> limited distinctions made between benefits that might result in<br />
economic growth and those leading to non-market return.<br />
<strong>The</strong> use of benefit transfer values that are difficult to apply to a UK<br />
context.<br />
Full details on the strengths and limitations of the work can be found on pp. 12-13<br />
and should be fully taken into consideration.<br />
Despite these challenges, the development of <strong>The</strong> <strong>green</strong> <strong>infrastructure</strong> <strong>valuation</strong><br />
<strong>toolkit</strong> has inspired a great deal of interest and support. <strong>The</strong> present version of<br />
the <strong>toolkit</strong> is being released as a prototype, rather than as finalised product, to<br />
allow those organisations and individuals who have shown interest to experiment<br />
with and benefit from the progress that has been made.<br />
It is important that work on the economic <strong>valuation</strong> of <strong>green</strong> <strong>infrastructure</strong><br />
continues and complements ongoing efforts being taken forward at national level.<br />
Defra’s guidance on economic <strong>valuation</strong> provides an important point of reference.<br />
<strong>The</strong> link below provides access to key documents, including An Introductory<br />
Guide to Valuing Ecosystem Services and links to official value transfer<br />
<strong>guide</strong>lines.<br />
http://www.defra.gov.uk/environment/policy/natural-environ/using/<strong>valuation</strong>.htm<br />
<strong>The</strong> consortium who led the development of this <strong>toolkit</strong> has established the Green<br />
Infrastructure Value Network (GIVaN) to maintain the good working collaborations<br />
that the project has inspired. Based in the north of England, the GIVaN welcomes<br />
input from practitioners, policy makers and academics with an interest in open<br />
source learning and technical exchange on <strong>green</strong> <strong>infrastructure</strong> <strong>valuation</strong>.<br />
Further detail on how to take part can be found p. 13.<br />
What is <strong>green</strong> <strong>infrastructure</strong><br />
Green <strong>infrastructure</strong> is a term which has grown in use in recent years. Definitions<br />
vary, but most agree that <strong>green</strong> <strong>infrastructure</strong> should be seen as a collection of<br />
natural assets which provide multiple functions and services to people, the<br />
economy and the environment. <strong>The</strong>se natural assets span spatial scales and<br />
types of land use. For example, they include:<br />
<br />
<br />
<br />
<br />
<br />
<br />
<br />
<br />
woodland<br />
water courses<br />
coastal habitats<br />
highway verges<br />
parks<br />
urban trees<br />
private gardens<br />
the grounds of hospitals, schools and business parks.<br />
4
Building natural value for sustainable economic development: <strong>The</strong> <strong>green</strong> <strong>infrastructure</strong> <strong>valuation</strong> <strong>toolkit</strong> <strong>user</strong> <strong>guide</strong><br />
This network of natural assets and ‘<strong>green</strong>’ and ‘blue’ spaces that lies in and<br />
around towns and cities provides raw materials for our economy. Like other<br />
<strong>infrastructure</strong>, it sets the scene for recreation, tourism and investment and<br />
underpins physical and mental health and wellbeing. It provides balance to our<br />
urban centres and links them the countryside. Crucially, it is also our life-support<br />
system, regulating the quality of our air, water and soil.<br />
Why invest in <strong>green</strong> <strong>infrastructure</strong><br />
<strong>The</strong>re is a growing interest in integrated development models. How can we<br />
simultaneously achieve economic, environmental and social goals Can we<br />
include and capitalise on the promotion of biodiversity, the services that our<br />
ecological assets provide to our economy and society<br />
Well designed, planned and managed <strong>green</strong> <strong>infrastructure</strong> can offer multifunctional<br />
approaches to achieving sustainable economic development and<br />
address genuine practical challenges. For example:<br />
<br />
<br />
<br />
<br />
Supporting growth: investment in <strong>green</strong> <strong>infrastructure</strong> – for example<br />
enhancing a river corridor with paths, an improved river edge and<br />
opportunities for water-based activities – provides opportunities for<br />
tourism, attracting visitors, increasing income and employment. As well<br />
as providing opportunities for recreation, it can also enhance health and<br />
boost productivity for <strong>user</strong>s and onlookers.<br />
Stimulating investment: <strong>green</strong> spaces and landscaping can enhance<br />
the urban environment, influencing business location decisions and<br />
leading to new inward investment and employment – as well as<br />
increasing land and property values and improving quality of life.<br />
Mitigating climate change impacts: open spaces used both as playing<br />
fields and flood plains can provide effective temporary stores of flood<br />
water, protecting residential and business property – as well as providing<br />
resources for exercise and health benefits.<br />
Improving health: <strong>green</strong> lungs in urban environments, like public parks,<br />
<strong>green</strong> routes and trees close to offices, can provide resources for<br />
healthy lifestyles for employees and residents alike - as well as helping<br />
to reduce summer urban temperatures and supporting biodiversity.<br />
Green <strong>infrastructure</strong> is increasingly being embraced across the country. <strong>The</strong>re is<br />
particular interest in the north of England and other areas facing ongoing<br />
economic change, as they seek to develop sustainable approaches to<br />
regeneration and improve the quality of life for people living in old industrial<br />
centres.<br />
As new thinking develops about how to achieve sustainable models of<br />
development, there are opportunities to embed <strong>green</strong> <strong>infrastructure</strong> firmly within<br />
local plans and economic development initiatives.<br />
<strong>The</strong>re is also an opportunity to secure better value for money by joining up<br />
investment priorities from a number of agencies to address multiple issues<br />
through approaches that have not traditionally been encouraged. Partly this is<br />
because understanding of <strong>green</strong> <strong>infrastructure</strong>’s many benefits is not yet<br />
widespread - and the tools for valuing these benefits are under-developed.<br />
How can the <strong>toolkit</strong> help<br />
<strong>The</strong> <strong>toolkit</strong> is intended to help bridge the current gap between evidence and<br />
practice when it comes to environmental investments. It uses practical methods to<br />
value the benefits of <strong>green</strong> <strong>infrastructure</strong> projects, making it easier to:<br />
<br />
<br />
<br />
understand and make the case for investment across a broad suite of<br />
partners<br />
compare the benefits from <strong>green</strong> <strong>infrastructure</strong> with other developments<br />
prioritise between the different opportunities that are available.<br />
<strong>The</strong> <strong>toolkit</strong> is a self-contained, single resource, based on and including the best<br />
available <strong>valuation</strong> approaches – although, inevitably, necessary simplification<br />
has required some compromises.<br />
Who is the <strong>toolkit</strong> aimed at<br />
<strong>The</strong> <strong>toolkit</strong> can help land managers, developers and other organisations investing<br />
in local sustainable development – whether local authorities, city regions, local<br />
enterprise partnerships, economic development agencies or community and<br />
voluntary sector organisations.<br />
It gives those involved in the management or planning of urban centres and other<br />
large land assets ready access to hard numbers on the unique economic returns<br />
of their <strong>green</strong>ing projects. This will be helpful for:<br />
<br />
<br />
<br />
informing audits of land<br />
reviewing development proposals<br />
making the case for funding or improving <strong>green</strong> spaces.<br />
Board members, councillors and other investors on the receiving end of funding<br />
requests could equally use the <strong>toolkit</strong> to compare proposals, and select the<br />
projects that perform best against their own priorities. For instance, an economic<br />
development partnership might want evidence of how a project is likely to<br />
5
Building natural value for sustainable economic development: <strong>The</strong> <strong>green</strong> <strong>infrastructure</strong> <strong>valuation</strong> <strong>toolkit</strong> <strong>user</strong> <strong>guide</strong><br />
stimulate inward investment, while local health authorities might be interested in<br />
increasing physical activity.<br />
<strong>The</strong> <strong>toolkit</strong> can also sit alongside other appraisal mechanisms used to identify and<br />
assess the impact of resources.<br />
Why was it developed<br />
Over the past two decades, considerable research efforts have been made to<br />
show how trees and high quality <strong>green</strong> and blue spaces provide environmental,<br />
social and economic benefits.<br />
<strong>The</strong> Millennium Ecosystem Assessment (2005), i which assessed the<br />
consequences of ecosystem change for human wellbeing at a global scale,<br />
provided the impetus and the conceptual framework for much of the recent work<br />
at a more local level. <strong>The</strong> partners in this project – notably <strong>The</strong> Northern Way,<br />
Natural Economy Northwest, Natural England and the Commission for<br />
Architecture and the Built Environment - have also all been active in taking<br />
forward research on the <strong>green</strong> <strong>infrastructure</strong> agenda.<br />
However, despite the progress made, much of this work has yet to be considered<br />
in current policy and funding decisions. And in a context where public funding<br />
resources are tight and low-carbon development models are taking centre stage,<br />
decision-makers and practitioners need to assess and understand returns from<br />
<strong>green</strong> investment – so as to get the balance between ‘grey’ and ‘<strong>green</strong>’ right.<br />
A key problem has been a lack of readily accessible information. Case studies<br />
and research materials on the benefits of <strong>green</strong> <strong>infrastructure</strong> are often scattered<br />
across academic or specialist literature, and findings are often presented in a<br />
language that does not speak to those outside the environmental sector. <strong>The</strong><br />
partners were keen to address this.<br />
In addition, discussions held with Defra have also confirmed that a usable,<br />
practical <strong>guide</strong> would complement their ongoing work on ecosystems services* 1<br />
<strong>The</strong> aspiration is for the <strong>toolkit</strong> to develop over time, as new evidence and<br />
<strong>valuation</strong> approaches are developed. It should be seen as a ‘living’ set of tools,<br />
which can be used alongside, or incorporated into other appraisal mechanisms,<br />
and to help point the way to further research.<br />
What does the <strong>toolkit</strong> do<br />
<strong>The</strong> <strong>toolkit</strong> provides a set of calculator tools, to help assess an existing <strong>green</strong><br />
asset or proposed <strong>green</strong> investment and translate findings into a business case.<br />
It looks at how the range of <strong>green</strong> <strong>infrastructure</strong> benefits deriving from an asset or<br />
investment can be valued:<br />
<br />
<br />
<br />
in monetary terms - applying economic <strong>valuation</strong> techniques where<br />
possible<br />
quantitatively - for example with reference to jobs, hectares of land,<br />
visitors<br />
qualitatively – referencing case studies or important research where<br />
there appears to be a link between <strong>green</strong> <strong>infrastructure</strong> and economic,<br />
societal or environmental benefit, but where the scientific basis for<br />
quantification and/or monetisation is not yet sufficiently robust.<br />
<strong>The</strong> <strong>toolkit</strong> does not assess the quality of the design or detailed<br />
management requirements of <strong>green</strong> <strong>infrastructure</strong>.<br />
This <strong>guide</strong> describes the evidence base and rationale supporting each of the<br />
calculator tools, and provides advice on how to use them.<br />
Assessing the benefits<br />
<strong>The</strong> <strong>toolkit</strong> uses standard <strong>valuation</strong> techniques to assess the potential benefits<br />
provided by <strong>green</strong> <strong>infrastructure</strong> within a defined project area. <strong>The</strong>se benefits are<br />
assessed in terms of the functions the <strong>green</strong> <strong>infrastructure</strong> may perform,<br />
support or encourage, depending upon the type of project. For example, figure<br />
1 shows how an urban tree planting scheme can result in improved air quality,<br />
carbon sequestration and reduced health costs, thereby illustrating <strong>green</strong><br />
<strong>infrastructure</strong> function, resultant benefit and potential monetisation.<br />
However, not all benefits can be given a monetary value. A rich body of evidence<br />
illustrates and demonstrates the different types of benefits deriving from quality<br />
<strong>green</strong> spaces. But for many, robust <strong>valuation</strong> techniques do not yet exist. For<br />
others, proving a direct causal link between <strong>green</strong> <strong>infrastructure</strong> and the potential<br />
benefits is not yet possible.<br />
1<br />
* All terms followed by a star are defined in the Glossary<br />
6
Building natural value for sustainable economic development: <strong>The</strong> <strong>green</strong> <strong>infrastructure</strong> <strong>valuation</strong> <strong>toolkit</strong> <strong>user</strong> <strong>guide</strong><br />
Figure 1: Translating <strong>green</strong> <strong>infrastructure</strong> intervention into monetised benefit<br />
values<br />
New versus existing <strong>green</strong> <strong>infrastructure</strong><br />
Local strategies have different priorities for <strong>green</strong> <strong>infrastructure</strong>. Some aim to<br />
create new <strong>green</strong> spaces and assets, including <strong>green</strong> roofs and street trees,<br />
linked to programmes of economic or spatial development. Others aim to<br />
consider the impact of changing or shaping existing <strong>green</strong> assets in light of local<br />
public health priorities.<br />
This is an important consideration when valuing projects. Take, for example, a<br />
proposal to improve access to <strong>green</strong> space, perhaps a public park or community<br />
forest. Adding new footpaths and cycleways might increase the functionality of<br />
the <strong>green</strong> space, encouraging more people to use the area.<br />
<strong>The</strong> <strong>toolkit</strong> will help to identify the marginal benefits* associated with greater<br />
use. However, it is often useful to have a more complete view of the value of the<br />
asset, including the existing, baseline benefits. <strong>The</strong>se might include the<br />
contribution the <strong>green</strong> space makes to water management or local temperature<br />
control, or in storing carbon or supporting biodiversity.<br />
Most of the tools in the <strong>toolkit</strong> can be used to measure the benefits of existing<br />
<strong>green</strong> spaces. One of the case studies - Ropner Park, Stockton-on-Tees - shows<br />
its application to an existing urban park.<br />
This is also very relevant for projects which envisage a potential reduction in<br />
<strong>green</strong> space, or those that aim to secure/protect the long-term future of existing<br />
<strong>green</strong> <strong>infrastructure</strong> - an assessment can be made of the value that might<br />
otherwise be lost.<br />
How do I use the <strong>toolkit</strong><br />
<strong>The</strong> <strong>toolkit</strong> uses a three-stage approach to assessing the value of an existing<br />
<strong>green</strong> asset or proposed <strong>green</strong> investment:<br />
1. Preparation gather data about the physical character of the site or<br />
proposal and about the populations that might benefit from it.<br />
2. Assessment: identify the benefits involved and apply the relevant<br />
benefits calculator tools<br />
3. Reporting: compile the results from the assessment into a compelling<br />
‘return on investment’ argument highlighting all qualitative, quantitative<br />
and monetary findings.<br />
A more detailed breakdown can be found in the ‘Using the <strong>toolkit</strong>’ section.<br />
Three case study examples presenting results from applying the <strong>toolkit</strong> are<br />
included in Appendix 1:<br />
1. Ropner Park, Stockton-on-Tees - an existing, traditional Victorian urban<br />
park.<br />
2. Liverpool Knowledge Quarter - a proposed investment plan to enhance<br />
public spaces and <strong>green</strong> <strong>infrastructure</strong> in a fast-changing area of east<br />
Liverpool.<br />
3. Belvedere Employment Area Green Links, London Borough of Bexley –<br />
a proposed investment plan to improve access and environmental quality of<br />
the Belvedere Employment Are<br />
<strong>The</strong> calculator is available online at online at www.bit.ly/gi<strong>valuation</strong><strong>toolkit</strong><br />
i<br />
www.millenniumassessment.org<br />
7
Building natural value for sustainable economic development: <strong>The</strong> <strong>green</strong> <strong>infrastructure</strong> <strong>valuation</strong> <strong>toolkit</strong> <strong>user</strong> <strong>guide</strong><br />
Developing the <strong>toolkit</strong><br />
This section provides an overview of the approach taken to developing a practical<br />
framework for assessing <strong>green</strong> <strong>infrastructure</strong> benefits. It introduces some of the<br />
core economic concepts and reference studies used to create the present <strong>toolkit</strong><br />
proto-type. It sets out the strength and weaknesses of this work and proposed<br />
next steps for future improvements.<br />
<strong>The</strong> 11 benefits framework<br />
<strong>The</strong> benefit estimation tools are grouped into 11 categories. <strong>The</strong>se are based on<br />
work done by Ecotec with Natural Economy Northwest* (NENW) in 2008, which<br />
proposed 11 benefit groups.<br />
1. Climate change adaptation and<br />
mitigation<br />
7. Labour productivity<br />
2. Water and flood management 8. Tourism<br />
3. Place and communities 9. Recreation and leisure<br />
4. Health and wellbeing 10. Biodiversity<br />
5. Land and property values 11. Land management<br />
6. Investment<br />
Figure 2: Mapping <strong>green</strong> <strong>infrastructure</strong> benefit groups to the ecosystem services<br />
approach<br />
<strong>The</strong> framework complements other approaches to grouping the benefits of <strong>green</strong><br />
<strong>infrastructure</strong>, including the ecosystem services* approach. <strong>The</strong> ecosystem<br />
services approach looks at the services provided by ecosystems and their<br />
components: water, soil, nutrients and organisms.<br />
Ecosystem services can be defined in various ways. <strong>The</strong> Millennium Ecosystem<br />
Assessment provided the most comprehensive assessment of the state of the<br />
global environment to date, and it classified ecosystem services as follows:<br />
Supporting services - the services that are necessary for the production of all<br />
other ecosystem services, including:<br />
soil formation<br />
photosynthesis<br />
primary production<br />
nutrient cycling<br />
water cycling.<br />
Provisioning services - the products obtained from ecosystems, including:<br />
food<br />
fibre<br />
fuel<br />
genetic resources<br />
biochemicals<br />
natural medicines<br />
pharmaceuticals<br />
ornamental resources<br />
fresh water.<br />
Regulating services - the benefits obtained from the regulation of ecosystem<br />
processes, including:<br />
air quality regulation<br />
climate regulation<br />
water regulation<br />
erosion regulation<br />
water purification<br />
disease regulation<br />
pest regulation<br />
pollination<br />
natural hazard regulation.<br />
Cultural services - non-material benefits such as:<br />
spiritual enrichment<br />
cognitive development<br />
reflection<br />
recreation<br />
aesthetic experiences.<br />
8
Building natural value for sustainable economic development: <strong>The</strong> <strong>green</strong> <strong>infrastructure</strong> <strong>valuation</strong> <strong>toolkit</strong> <strong>user</strong> <strong>guide</strong><br />
Identifying functions, benefits and underlying logic chains<br />
An important step in deriving the <strong>valuation</strong> tools in this document was to identify<br />
the functions, benefits and impacts of <strong>green</strong> <strong>infrastructure</strong>.<br />
To assess their value, the <strong>toolkit</strong> needed to gather and assess evidence of how<br />
provision or protection of a <strong>green</strong> asset delivers a particular output or influences<br />
an outcome.<br />
This progression is known as the logic chain. <strong>The</strong> use of logic chains is<br />
recognised as a fundamental approach for assessing the value of investments,<br />
and in recent years this approach has been embedded in project appraisal<br />
methodology.<br />
Central to the logic chain approach is understanding the ‘evidence base’ for a<br />
particular <strong>green</strong> project – and using it to demonstrate the causal connections<br />
between the proposed activities, the outputs and outcomes, and how they lead to<br />
impacts, including their impact on goals such as economic development and<br />
human wellbeing. <strong>The</strong> logic chain approach is also a systematic method for<br />
identifying evidence gaps and strategic areas for evidence development.<br />
This is a particularly important issue for <strong>green</strong> <strong>infrastructure</strong> investment. <strong>The</strong><br />
evidence available to date can take us part of the way to the goals of this project.<br />
Case studies show that the environmental quality of an area has a positive<br />
influence on inward investment. However, the evidence base to enable the<br />
calibration of impacts is less clear and there is more work to do. In other areas<br />
such as climate change adaptation, scientific understanding of the impact of<br />
<strong>green</strong> <strong>infrastructure</strong> is still evolving.<br />
As part of this work a series of logic chains, based on key <strong>green</strong> <strong>infrastructure</strong><br />
functions - for example providing opportunities for exercise, offering shelter from<br />
wind, and so on - have been developed for each of the 11 categories, with<br />
associated benefits.<br />
Appendix 3 provides an overview of the tools offered by the <strong>toolkit</strong>, based on the<br />
<strong>green</strong> <strong>infrastructure</strong> functions captured in the 11 benefit groups. <strong>The</strong> table details<br />
the outputs from each tools and a recommended timeframe for appraising value<br />
and returns.<br />
<strong>The</strong>se timeframes are based on judgements of a <strong>green</strong> <strong>infrastructure</strong> asset’s<br />
lifespan - assuming between 30-50 years - or an appropriate accrual period of 20-<br />
25 years, allowing for growth to maturity. A lower 10 or five-year timescale is<br />
indicated for a number of the tools – this timescale is more usually associated<br />
with monetary benefits affecting gross value added.<br />
Capturing the ‘total economic value’<br />
While there is good qualitative evidence for the benefits of <strong>green</strong> <strong>infrastructure</strong>, it<br />
is not currently possible to put figures on some potential impacts.<br />
One example is economic growth and investment. A number of studies have<br />
shown a positive correlation between environmental quality and businesses’<br />
decisions to relocate, but have not been able to quantify the relationship:<br />
<br />
<br />
How much <strong>green</strong> <strong>infrastructure</strong> is enough<br />
What about other factors such as transport links, a skilled workforce and<br />
so on<br />
<strong>The</strong> complex nature of the relationships at play here mean that a simple tool<br />
cannot provide meaningful results - more detailed, specialist and bespoke<br />
techniques will be needed.<br />
<strong>The</strong> <strong>toolkit</strong> cannot count everything. What it does count is designed to be robust<br />
enough for initial, indicative project appraisal, providing a range of figures<br />
indicating the potential impact of a <strong>green</strong> <strong>infrastructure</strong> intervention or even an<br />
existing <strong>green</strong> asset.<br />
Given the multi-functional benefits from <strong>green</strong> assets, there is also a need to<br />
capture the wide range of benefits that contribute to the overall welfare of society.<br />
This can be done by assessing the total economic value* (TEV) of the <strong>green</strong><br />
investment.<br />
This includes:<br />
Use value* - relating to current or future uses of a good or service. <strong>The</strong>se<br />
include:<br />
<br />
<br />
<br />
Direct use values. <strong>The</strong>se may be consumptive – such as timber - or nonconsumptive<br />
– such as recreational activities.<br />
Indirect use values, including key ecosystem services like flood<br />
protection.<br />
Option value* is associated with retaining the option to use a resource<br />
in the future.<br />
Non-use values derive from:<br />
<br />
<br />
<br />
Existence value - the knowledge that environmental resources continue<br />
to exist<br />
Altruistic value – are available to others to use now<br />
Bequest value – are available for use in the future.<br />
9
Building natural value for sustainable economic development: <strong>The</strong> <strong>green</strong> <strong>infrastructure</strong> <strong>valuation</strong> <strong>toolkit</strong> <strong>user</strong> <strong>guide</strong><br />
Figure 3 demonstrates the total economic value approach.<br />
Figure 3: Total economic value schematic<br />
Figure 4 shows where these techniques are commonly used to estimate the value<br />
of the different components of total economic value.<br />
Figure 4: Approaches to the <strong>valuation</strong> of <strong>green</strong> <strong>infrastructure</strong> and environmental<br />
goods<br />
Source: Defra, 2007<br />
<strong>The</strong> <strong>toolkit</strong> provides guidance on estimating the total economic value. However, a<br />
proportionate approach needs to be adopted at appraisal stage.<br />
While there is often a focus on direct and indirect use values, it may be important<br />
to understand the option and non-use values associated with any <strong>green</strong><br />
investment. Where a project is shown to make a significant impact or contribution<br />
to a particular policy objective, for example tourism or flood alleviation, there may<br />
be a need for more detailed studies to underpin the <strong>toolkit</strong> results. <strong>The</strong> <strong>toolkit</strong> can<br />
help to identify the major impact areas of a <strong>green</strong> <strong>infrastructure</strong> investment.<br />
<strong>The</strong> HM Treasury Green Book - Appraisal and E<strong>valuation</strong> in Central Government<br />
provides overall guidance on the appraisal and e<strong>valuation</strong> of public sector<br />
investment. It states that<br />
<br />
<br />
public sector investment should be subjected to a comprehensive, but<br />
proportionate, assessment<br />
the assessment should consider the impact on society as a whole.<br />
Central to this are the estimates of the total benefits and full costs to society and,<br />
where feasible, that all relevant costs and benefits are expressed in monetary<br />
terms to arrive at a net benefit or cost.<br />
Costs and benefits related to market goods and services are estimated using<br />
market prices. For wider social and environmental costs and benefits for which no<br />
market price is available, specialised non-market <strong>valuation</strong> techniques may be<br />
applied.<br />
Some of the key methods include:<br />
<br />
<br />
Contingent <strong>valuation</strong> (CV): a survey method which aims to capture<br />
individual preferences for a change in the provision of a good or service<br />
through assessing their willingness to pay* (WTP) or willingness to<br />
accept (WTA) compensation. <strong>The</strong>se changes are hypothetical, and it is<br />
important to ensure surveys are well designed to minimise this and other<br />
sources of bias. <strong>The</strong> contingent <strong>valuation</strong> approach is widely used for<br />
generating option and existence values - for example in protecting<br />
biodiversity.<br />
Hedonic pricing: this method relates the price of a marketed good to a<br />
non-marketed good, the most common of which are property and labour.<br />
<strong>The</strong> property value (PV) approach is the most common use. It consists<br />
of observing differences in the values of property between locations, and<br />
10
Building natural value for sustainable economic development: <strong>The</strong> <strong>green</strong> <strong>infrastructure</strong> <strong>valuation</strong> <strong>toolkit</strong> <strong>user</strong> <strong>guide</strong><br />
<br />
<br />
<br />
<br />
<br />
isolating the effect of ambient environmental quality on those values.<br />
<strong>The</strong> approach has been used to assess the impact of <strong>green</strong><br />
<strong>infrastructure</strong> on residential property prices 2 .<br />
Travel cost method: this takes the cost of getting to a site as the value<br />
attributed to the good or service. So the value people place on a good<br />
environmental space is inferred from the time and cost they incur in<br />
travelling to it. This method is applied mainly to public recreation sites<br />
with free or minimal admission charges - for example coastal footpaths<br />
or a nature reserve - where it is argued that the cost of travel is a good<br />
proxy for the entry price.<br />
Effect on production: this measures the effect a project may have on<br />
the output, cost or profitability of producers through its effect on their<br />
environment and the welfare of consumers. An example might be<br />
reservoirs creating new fisheries, or bee keepers benefiting<br />
neighbouring gardens. This method is often used to assess negative<br />
impacts associated with an investment.<br />
Preventative expenditure: this is typically used when comparing the<br />
benefits provided by <strong>green</strong> <strong>infrastructure</strong> to the costs of providing<br />
engineering solutions – for example protection from flood risk - and/or<br />
replacement cost approaches.<br />
Benefit transfer: effectively adopts or adapts information from <strong>valuation</strong><br />
studies undertaken elsewhere - using a variety of the above techniques -<br />
and applies them in a new context. <strong>The</strong>re are many examples across a<br />
range of benefit streams - a scan of the EVRI (Environmental Valuation<br />
Reference Inventory) database is a useful introduction to the range of<br />
topics covered. A more sophisticated use of benefit transfer is called the<br />
transfer function approach. This adapts the results from one study to<br />
make it more suitable to another context – for example adjusting for the<br />
socio-economic context or the location.<br />
Specific values: are incorporated in the <strong>toolkit</strong>, the most significant<br />
being the ‘social cost of carbon’ or ‘shadow price of carbon’. This value<br />
is effectively a shadow price set by government - it is a requirement to<br />
adopt the value in public sector cost-benefit analysis.<br />
<strong>The</strong> use of the benefit transfer approach is a central feature of this <strong>toolkit</strong>. It is<br />
an approach supported by Defra as a cost-effective way of undertaking appraisal.<br />
<strong>The</strong> other methods outlined can be complex, and resource and time-intensive -<br />
where existing transferable values can be applied to provide an economic<br />
<strong>valuation</strong>, this will generally be more efficient and preferable.<br />
However, the benefit transfer method is only as good as the initial study<br />
from which the values are taken.<br />
Since <strong>valuation</strong>s are often context and time-specific, care needs to be taken in<br />
their use and interpretation. Defra has developed guidance on the use of benefit<br />
transfer and is currently providing a more detailed set of <strong>guide</strong>lines on the use of<br />
value transfer in valuing environmental impacts 3 .<br />
Demonstrating value for money<br />
Economic appraisal methodologies used to make decisions on public sector<br />
funding are increasingly adopting a benefits framework approach, considering the<br />
full range of impacts from a project and the total public sector benefit value<br />
created – rather than focusing solely on the direct economic impact on<br />
employment.<br />
This approach has been adapted for this <strong>toolkit</strong>. It fits well, given the growing<br />
recognition of the wide range of benefits that <strong>green</strong> <strong>infrastructure</strong> can provide.<br />
<strong>The</strong> approach also fits with the total economic value concept promoted by Defra<br />
for assessing the value of environmental outcomes of a project - whether costs or<br />
benefits.<br />
Key supporting studies<br />
<strong>The</strong> <strong>toolkit</strong> draws on a substantial body of evidence from a large number of<br />
sources in the UK and overseas over the last 30 years.<br />
Some studies and reports have been especially useful, providing the core<br />
information on which this <strong>toolkit</strong> is based:<br />
<br />
<br />
Northern Way/Ecotec, City region <strong>green</strong> <strong>infrastructure</strong> strategic planning:<br />
raising the quality of the north's city regions, 2006<br />
Ecotec, <strong>The</strong> economic benefits of <strong>green</strong> <strong>infrastructure</strong>, sponsored by<br />
Natural Economy Northwest, 2008<br />
Jacobs for Defra, Valuing England’s terrestrial ecosystem services, 2008<br />
<br />
AMION, <strong>The</strong> economic benefits of <strong>green</strong> <strong>infrastructure</strong> – an assessment<br />
framework for the NWDA, 2008<br />
Defra, An introductory <strong>guide</strong> to valuing ecosystem services, 2007<br />
Natural England, No charge Valuing the natural environment, 2009.<br />
<strong>The</strong>se reports have provided a wealth of background evidence and frameworks<br />
for appraisal. Many of the approaches and values used in this <strong>toolkit</strong> are drawn<br />
from this work. Other sources are listed in the text.<br />
11
Building natural value for sustainable economic development: <strong>The</strong> <strong>green</strong> <strong>infrastructure</strong> <strong>valuation</strong> <strong>toolkit</strong> <strong>user</strong> <strong>guide</strong><br />
Some specific studies have been used for key elements of <strong>valuation</strong>:<br />
<br />
<br />
Forestry Commission research (<strong>The</strong> social and environmental benefits of<br />
forests in Great Britain, Wills, Garrod et al, 2003) for average values for<br />
forestry and woodlands.<br />
Work by Eftec for Communities and Local Government (Valuing the<br />
external benefits of undeveloped land) gives a useful indication of the<br />
scale of external - non-use - benefits which <strong>green</strong> <strong>infrastructure</strong> can<br />
give. Careful application is required to avoid double counting if other<br />
tools are used for these benefits, and to be sensitive to context.<br />
However, the values do provide an initial estimate of the likely scale of<br />
benefits, and are used in tools on recreation, quality of place and<br />
biodiversity.<br />
Other sources are listed in the dedicated chapters associated with each of the 11<br />
benefits.<br />
Strength and limitations of the <strong>toolkit</strong><br />
Before releasing the <strong>toolkit</strong> in its current prototype form a wide range of feedback<br />
has been solicited from peer economists, potential <strong>user</strong>s and specialists in the<br />
various subject areas covered by the project. Summarised below are the findings<br />
from this wide consultation exercise.<br />
<strong>The</strong> peer review was conducted in March 2010 with expert economists:<br />
<br />
<br />
Andy McNab and Petrina Rowcroft from Scott Wilson, commissioned by<br />
CABE<br />
Simon Kyte, Senior Economist, Greater London Authority<br />
Field testing of the <strong>toolkit</strong> with a variety of potential <strong>user</strong>s currently managing<br />
large <strong>green</strong> <strong>infrastructure</strong> projects included the Red Rose Forest team, the<br />
Newlands Project Team (Forestry Commission), Cheshire West and Chester<br />
Council, Trafford Council and Rochdale Council.<br />
Consultation with specialists involved Professor John Handley and Dr Susannah<br />
Gill on climate change issues, Dr William Bird on health issues, Eleanor Lucas<br />
and Richard Copas from the Environment Agency on water management issues<br />
Professor Edward Maltby on the economics of biodiversity, and many others.<br />
Strengths<br />
<strong>The</strong> <strong>toolkit</strong> provides a very helpful introduction to the evidence demonstrating the<br />
benefits of <strong>green</strong> <strong>infrastructure</strong> interventions. It offers a structured argument that<br />
speaks the language of regeneration and economic developments.<br />
<strong>The</strong> 11 economic benefits structure provides a relatively simple high level means<br />
of presenting and communicating the benefits of <strong>green</strong> <strong>infrastructure</strong> projects in<br />
economic contexts, although it also brings some risks of double-counting (see<br />
Limitations below).<br />
<strong>The</strong> <strong>toolkit</strong> provides a structured approach to value <strong>green</strong> <strong>infrastructure</strong> benefits<br />
in monetary, quantitative and qualitative terms, with equal weight being applied to<br />
each of these three ways to present existing evidence. It can add value to and<br />
inform the decision-making process, particularly when used at an early stage to<br />
get broad brush figures and weigh pros and cons.<br />
<strong>The</strong> <strong>toolkit</strong> relies on current state-of-the-art evidence and <strong>valuation</strong> techniques for<br />
<strong>green</strong> <strong>infrastructure</strong> benefits. However, the <strong>toolkit</strong> also highlights the need for<br />
considerable improvement and expansion of the evidence base to enable future<br />
iterations to provide improved <strong>valuation</strong>s.<br />
<strong>The</strong> <strong>toolkit</strong> helps make <strong>green</strong> <strong>infrastructure</strong> benefits ‘visible’ to potential funders.<br />
<strong>The</strong> inclusion of environmental benefits in cost benefit analysis is currently very<br />
difficult, often requiring professional assistance. Such assistance is frequently<br />
beyond the means of many groups seeking project funding. <strong>The</strong> <strong>toolkit</strong> is aimed<br />
at filling this gap, providing a means of scoping out the indicative benefits of<br />
<strong>green</strong> <strong>infrastructure</strong> using tools and approaches accessible to many projects and<br />
groups.<br />
However, whilst the <strong>toolkit</strong> provides a means of undertaking a broad Value for<br />
Money assessment, it must but emphasised that this is only indicative and cannot<br />
replace more rigorous formal project appraisal techniques.<br />
Limitations<br />
Whilst the 11 benefits framework is easy to communicate, the benefit groups tend<br />
to overlap. Although guidance is provided throughout the Calculator, extra caution<br />
must be exercised to ensure that double counting is avoided when undertaking a<br />
<strong>valuation</strong> exercise.<br />
Some of the benefit groups such as ‘Place and Communities’ are large concepts<br />
in their own right and and the <strong>toolkit</strong> presents a selection of proxy indicators which<br />
can be measured to seek to give an indication of the benefit in these areas..<br />
Some areas of benefits such as ‘Transport’ or ‘Education’ are not captured in the<br />
11 benefits framework and should be included in further developments of the<br />
<strong>toolkit</strong>.<br />
12
Building natural value for sustainable economic development: <strong>The</strong> <strong>green</strong> <strong>infrastructure</strong> <strong>valuation</strong> <strong>toolkit</strong> <strong>user</strong> <strong>guide</strong><br />
<strong>The</strong> <strong>toolkit</strong> does not provide guidance on dealing with uncertainties. Uncertainties<br />
exist in science (i.e. in our understanding of <strong>green</strong> <strong>infrastructure</strong> functions and<br />
associated total economic value) and in our knowledge of what the future holds<br />
(e.g. in relation to climate change). Any quantitative appraisal should recognise<br />
such uncertainties. This could be achieved through providing lower and higher<br />
bound estimates where the evidence base suggests ranges in values and/or<br />
through conducting sensitivity analyses to demonstrate how the benefit estimates<br />
vary as a result of changes in any underlying assumptions. Whilst the Calculator<br />
contains a “Values Library” that was originally intended to document upper and<br />
lower bound ranges, the project was unable to complete it before the present<br />
proto-type release.<br />
<strong>The</strong> <strong>toolkit</strong> does not distinguish between economic impacts, which relate to<br />
economic growth, and economic value, which expresses welfare benefits to<br />
people in monetised terms. Nor does it distinguish between absolute and relative<br />
impacts.<br />
However, the <strong>toolkit</strong> does attempt to identify those benefits that can relate to<br />
gross value added, those which have a broader economic context and the<br />
residual benefits that cannot be monetised but can be either quantified or<br />
described. <strong>The</strong> <strong>toolkit</strong> enables projects to do a best estimate of the total benefits<br />
to make an indicative comparison with project capital and projected maintenance<br />
costs.<br />
<strong>The</strong> <strong>toolkit</strong> does not provide guidance on separating out project benefits from<br />
other benefits that might have happened anyway. When the <strong>toolkit</strong> is used to<br />
assess the impact of a <strong>green</strong> <strong>infrastructure</strong> investment, the <strong>user</strong> needs to be clear<br />
that these benefits should be treated a gross benefits and do not necessarily<br />
demonstrate additionality..<br />
<strong>The</strong> <strong>toolkit</strong> calculator makes extensive use of the value transfer approach, which<br />
is the process of inferring one economic <strong>valuation</strong> from another. This is complex<br />
and requires close attention to differences between the two contexts. Whilst it is<br />
right to caution that to achieve value transfer to standards acceptable for a<br />
‘Treasury acceptable Cost Benefit Analysis’ nearly always requires the support of<br />
an economist, because cost benefit analysis should be proportionate to the<br />
evidence, cruder value transfers may be appropriate provided the assumptions<br />
underpinning them are clearly stated and it is made clear that the end result is an<br />
indicative value, as advised throughout the <strong>toolkit</strong> calculator. Further assistance<br />
is available from Defra’s value transfer <strong>guide</strong>lines 2 .<br />
<strong>The</strong> <strong>toolkit</strong> has attempted to use the “best available” evidence, but the work done<br />
has demonstrated how there needs to be significant work done to improve the<br />
evidence base. In some instances where little evidence was available,<br />
calculation factors were adopted based on a “reasonable rules of thumb”<br />
approach. Whilst underscores the need to consider <strong>toolkit</strong> outputs as strictly<br />
indicative, the Calculator does provide clear warning and guidance where such<br />
assumption-based factors are being used. When good local data is available, the<br />
<strong>toolkit</strong> can be tailored by replacing these assumption-based factors with<br />
parameters specific to the project. This would improve the robustness of the<br />
<strong>valuation</strong>, but it is unlikely that data will exist of sufficient rigour to permit anything<br />
more than indicative <strong>valuation</strong> results. Toolkit outputs will thus invariably be<br />
broad scale and contextual.<br />
Some of the potential benefit streams have proved impossible to provide simple<br />
tools for. This has resulted in the necessary recommendation of the use of<br />
bespoke studies. Whilst these will invariably be complex and potentially costly,<br />
the <strong>toolkit</strong> provides a means of identifying which areas of <strong>valuation</strong>, if relevant to<br />
the specific project would require professional input.<br />
How can I help improve the <strong>toolkit</strong><br />
<strong>The</strong> present version of the <strong>toolkit</strong> is being released as a prototype.<br />
Developing the <strong>toolkit</strong>’s next iteration will require wide and sustained<br />
collaboration. To facilitate this process, interested parties are invited to pass the<br />
<strong>toolkit</strong> to others who might be able to incorporate it into their work and to provide<br />
feedback on:<br />
<br />
<br />
<br />
<br />
<strong>The</strong>ir experience in using the <strong>toolkit</strong>, good and bad!<br />
Sources of improved evidence<br />
Suggestions for improving the tools<br />
Ideas for new tools<br />
<strong>The</strong> consortium who led the development of this <strong>toolkit</strong> has handed over the<br />
responsibilities for co-ordinating future work to the Green Infrastructure Value<br />
Network (GIVaN). Further information on the network can be found at:<br />
www.bit.ly/gi<strong>valuation</strong><strong>toolkit</strong><br />
2<br />
http://www.defra.gov.uk/environment/policy/natural-environ/using/<strong>valuation</strong>/index.htm<br />
13
Building natural value for sustainable economic development: <strong>The</strong> <strong>green</strong> <strong>infrastructure</strong> <strong>valuation</strong> <strong>toolkit</strong> <strong>user</strong> <strong>guide</strong><br />
Using the <strong>toolkit</strong><br />
This section provides an overview of the approach to estimating the value of<br />
<strong>green</strong> <strong>infrastructure</strong> investments. It introduces some of the core economic<br />
<strong>valuation</strong> concepts and provides guidance on to how to use the <strong>toolkit</strong>.<br />
Figure 5: Step-by-step <strong>guide</strong> to using the <strong>toolkit</strong><br />
14
Building natural value for sustainable economic development: <strong>The</strong> <strong>green</strong> <strong>infrastructure</strong> <strong>valuation</strong> <strong>toolkit</strong> <strong>user</strong> <strong>guide</strong><br />
Preparation<br />
Step 1: Initial analysis<br />
Scope and gather the information needed on the purpose, physical<br />
characteristics and beneficiaries of the project or site being assessed.<br />
Good information about the project or asset to be valued is essential. <strong>The</strong> better<br />
the information, the greater the accuracy of the <strong>valuation</strong>. A checklist of the<br />
initial data requirements is provided in Appendix 2.<br />
Core information such as the type, quantity and location of a <strong>green</strong> asset, its<br />
current and future use and so on, should be readily available from the project<br />
developers or asset owners.<br />
Step 2: Identifying beneficiaries<br />
Estimate the number of beneficiaries from the project or site being<br />
assessed. This will be needed for assessing recreation, tourism, health and<br />
property benefits.<br />
Many of the benefits of <strong>green</strong> <strong>infrastructure</strong> come from its use by humans – for<br />
recreation or tourism. Baseline figures for current use are therefore important to<br />
help assess the net additionality* of the <strong>green</strong> <strong>infrastructure</strong> investment – the<br />
net positive difference resulting from the investment.<br />
<strong>The</strong> affected population will be an estimate of the relevant ‘<strong>user</strong>’ and ‘non-<strong>user</strong>’<br />
population – the beneficiaries of the investment.<br />
<br />
<br />
‘Users’ benefit directly, by using the new or improved <strong>green</strong><br />
<strong>infrastructure</strong> - think of people using a park, or a new cycle path.<br />
‘Non-<strong>user</strong>s’ may also derive a benefit - for example, a city dweller may<br />
value investment to safeguard a rural habitat even if they have no<br />
intention to visit the site.<br />
In many cases, the most appropriate approach to identifying beneficiaries will be<br />
some form of population or household density or catchment analysis.<br />
Understanding this is important, as the value given to a <strong>green</strong> <strong>infrastructure</strong><br />
investment - and in particular non-marketed goods - is sensitive to distance.<br />
<strong>The</strong>re is a reduction in value further away from the <strong>green</strong> asset.<br />
Some methods commonly used to estimate the number of potential beneficiaries<br />
include:<br />
Method 1: Density of use. Where the proposed investment involves the provision<br />
of a cycleway or footway it is possible to estimate the likely level of use based on<br />
density values from other sites or areas.<br />
British Waterways’ economic impact model uses national data on<br />
density of use for walking and cycling per kilometre<br />
local authority leisure services departments may also have local leisure<br />
use data to draw upon.<br />
Method 2: Population penetration analysis. This approach estimates the likely use<br />
of the <strong>green</strong> asset by local residents or visitors, based on taking a percentage of<br />
the relevant population. It draws on household population data. <strong>The</strong> percentage<br />
penetration can be based on evidence from other areas or <strong>green</strong> <strong>infrastructure</strong>type<br />
projects or a bespoke leisure use study.<br />
Method 3: Catchment analysis. This method is useful to determine the relevant<br />
beneficiaries of <strong>green</strong> <strong>infrastructure</strong> investment - for example the number of<br />
residential or commercial properties within a certain visual range or travel-time<br />
distance.<br />
This type of analysis is also useful for estimating non-<strong>user</strong> benefits. Here the aim<br />
is to identify the relevant household population that may value the <strong>green</strong> asset for<br />
its option use* or existence. This may be based on a geographical area or drive<br />
time, depending on the findings from the evidence base.<br />
Method 4: Site transfer<br />
This estimates the likely total number of visits based on the experience of other<br />
similar sites. For example, a woodland of 50 hectares with 25,000 visits per year<br />
has a density of use of 500 people per hectare per year. This can be applied to<br />
your project, based on the scale of your site.<br />
Calculating catchments<br />
<strong>The</strong> Greater London Authority (GLA) publishes guidance on the preparation of<br />
open space strategies, which includes a series of catchment areas:<br />
regional parks, of up to 400 hectares in size and catchment area of 3.2<br />
to 8 kilometres<br />
<br />
<br />
district parks of up to 20 hectares and catchment area of 1.2 kilometres<br />
local parks of 2 hectares serving the local population within 400 metres.<br />
Other councils have drawn on the GLA’s guidance when working up their own<br />
strategies. For example, Kirklees 2007 open space assessment modified the<br />
15
Building natural value for sustainable economic development: <strong>The</strong> <strong>green</strong> <strong>infrastructure</strong> <strong>valuation</strong> <strong>toolkit</strong> <strong>user</strong> <strong>guide</strong><br />
GLA’s guidance to include major parks - specialised parks capable of holding<br />
events – with a catchment of 2.4 kilometres.<br />
In the UK, local <strong>green</strong> space standards are increasingly being included in<br />
supplementary planning documents. <strong>The</strong> standard is often set that all households<br />
should be within 800 to 1,200 metres’ walking distance of large, neighbourhood<br />
<strong>green</strong> space (around 2 hectares).<br />
For the purpose of simplifying data collection for the <strong>toolkit</strong>, use by the local<br />
resident population living within 400 metres and 1,200 metres of a proposed<br />
<strong>green</strong> space asset is recommended.<br />
Calculating usage<br />
A significant gap currently exists in the research around the usage of <strong>green</strong><br />
assets – especially after investment to improve an existing asset.<br />
Depending upon the level of works done, there could be an increase in visitation<br />
reported by 30 per cent of <strong>user</strong>s (Glasgow Green 2007), through to 2.5 times the<br />
original level of park usage (Ladywell Fields, Lewisham).<br />
Other research includes:<br />
<br />
<br />
<br />
<strong>The</strong> Park Life Report by GreenSpace was published in 2007 as the ‘first<br />
ever public satisfaction survey of Britain’s parks and <strong>green</strong> spaces’.<br />
Almost 20,000 people commented on the quality of parks and <strong>green</strong><br />
spaces, how they used them and how well they felt they were managed<br />
and maintained.<br />
Grahn and Stigsdotter’s 2003 study Landscape planning and stress<br />
found that the distance to public urban <strong>green</strong> spaces appears to be<br />
critically important - average use varied from 3.2 times per week for<br />
residents within 300 metres to 1.5 times per week for residents between<br />
300 metres and 1,000 metres.<br />
<strong>The</strong> 2003 Use of public parks in England report was based on the<br />
findings of a national survey commissioned by English Heritage, Sport<br />
England, and the Countryside Agency.<br />
Step 3: Project data entry<br />
Enter the core data required in the Calculator. Some information might be<br />
missing at this stage, but you will be able to complete data entry later.<br />
Before starting to use the Calculator, ‘save as’ the version of the Excel workbook<br />
that will be used with the project name and a version number. As you complete<br />
critical steps throughout the project assessment, remember to regularly ‘save as’<br />
the work completed with a new version number. This will save time by allowing to<br />
go back to an earlier version without starting again from the beginning, in case an<br />
error is made and some of the formulas performing the calculation embedded<br />
within each tool gets in advertently corrupted or erased.<br />
As a rule of thumb, in the Calculator:<br />
<br />
<br />
Assessment<br />
Cells with grey, <strong>green</strong> or blue backgrounds contain critical information or<br />
formulas and should not be altered;<br />
Cells with a yellow background are for data entry or require review; Red<br />
comments in the right margin will always specify which action should be<br />
taken.<br />
Step 4: Key benefits identification<br />
Identify the breadth of benefits likely to be associated with the project or<br />
site being assessed. Benefits that can be quantified and monetised will be<br />
evaluated using the Calculator. Qualitative benefits will be captured through<br />
a narrative in your final return on investment case<br />
This will help identify which benefits and calculation tools from the <strong>toolkit</strong> apply to<br />
a particular <strong>green</strong> space, asset or proposed intervention.<br />
For example, when assessing a traditional park, it is obvious that the estimation<br />
tools related to recreation and leisure benefits would apply. However, there are<br />
other benefits – such as climate change, health and wellbeing, land and property<br />
values, tourism – which should not be overlooked.<br />
Figures 6 and 7 show the potential benefits provided by different <strong>green</strong> spaces<br />
and assets:<br />
<strong>green</strong> shows the biggest impact<br />
amber shows that the space or asset will provide some benefit<br />
white shows that the benefit is small or not relevant.<br />
Figures 6 and 7 are designed to signpost which benefits should be considered.<br />
Depending on the type of <strong>green</strong> <strong>infrastructure</strong> asset or improvement, it might be<br />
easier to first consider the type of space involved, using Figure 6. This allows the<br />
identification of the range of benefits which should be considered. A more<br />
detailed approach based on assets - using figure 7 - will allow this initial selection<br />
of applicable benefit areas to be refined, and confirm which calculation tools can<br />
be used.<br />
Judgement needs to be exercised throughout, based on the background<br />
information provided within each of the thematic chapters.<br />
16
Building natural value for sustainable economic development: <strong>The</strong> <strong>green</strong> <strong>infrastructure</strong> <strong>valuation</strong> <strong>toolkit</strong> <strong>user</strong> <strong>guide</strong><br />
Figure 6: Green spaces and <strong>green</strong> <strong>infrastructure</strong> benefits<br />
Figure 7: Green <strong>infrastructure</strong> assets and benefits<br />
Types of <strong>green</strong> spaces<br />
Parks and formal gardens<br />
Natural and semi-natural <strong>green</strong> spaces<br />
Green corridors – including river and canal<br />
banks, cycleways and right-of-way<br />
Outdoor sports facilities<br />
Amenity <strong>green</strong> space – including private<br />
gardens and landscape areas for business<br />
settings<br />
Provision for children and teenagers<br />
Climate change adaptation and<br />
mitigation<br />
Flood alleviation and management<br />
Place and communities<br />
Health and wellbeing<br />
Land and property values<br />
Investment<br />
1 2 3 4 5 6 7 8 9 10 11<br />
Labour productivity<br />
Tourism<br />
Recreation and leisure<br />
Biodiversity<br />
Land management<br />
Climate change adaptation an mitigation<br />
Flood alleviation and management<br />
Green <strong>infrastructure</strong> features (nonexhaustive<br />
list) 1 2 3 4 5 6 7 8 9 10 11<br />
Allotments<br />
Open and running water – canal, river, stream,<br />
marsh, wetland, pond<br />
Riverbank<br />
Path – footpath, cycle path, bridleway<br />
SUDS – swales, ditches, filter drain, infiltration<br />
trenches<br />
Green roofs and walls<br />
Place and communities<br />
Health and wellbeing<br />
Land and property values<br />
Investment<br />
Labour productivity<br />
Tourism<br />
Recreation and leisure<br />
Biodiversity<br />
Land management<br />
Allotments, community gardens and city<br />
farms<br />
Cemeteries and churchyards<br />
Civic spaces<br />
W oodland (*)<br />
Post-industrial land/brownfield land (*)<br />
Agricultural land (*)<br />
Trees<br />
Verges and hedges<br />
Woodland<br />
Grassland – meadow, rough, heath<br />
Grassland – lawn<br />
Playing fields<br />
Based on Planning Policy Guidance 17 (PPG17) typology and associated definitions with<br />
some additions (*).<br />
17
Building natural value for sustainable economic development: <strong>The</strong> <strong>green</strong> <strong>infrastructure</strong> <strong>valuation</strong> <strong>toolkit</strong> <strong>user</strong> <strong>guide</strong><br />
Step 5: Applicable tools selection<br />
Identify tools applicable to your project and check whether additional data<br />
entry might be needed to run the tools selected. Use the Cost-benefit<br />
assessment sheet in the Calculator to document your conclusions on the<br />
applicability of each tool.<br />
It is important to note that there is interconnection and overlap between the 11<br />
benefit categories. This reflects the multiple benefits that <strong>green</strong> assets can deliver<br />
– but means that some care is needed to avoid double counting.<br />
For example:<br />
<br />
<br />
<br />
land and property values might be expected to reflect the opportunities<br />
for recreation and leisure in local parks<br />
labour productivity is influenced by health and wellbeing<br />
economic growth and investment, and quality of place, are influenced by<br />
a number of other benefit streams.<br />
On the other hand, identifying discrete, measurable benefit streams can lead to<br />
the wider, ‘holistic’ benefits of <strong>green</strong> <strong>infrastructure</strong> being overlooked.<br />
Step 6: Tools application<br />
Work through the tools. Most will require manual input of additional data.<br />
Remember to regularly save your work with a new version number each time you<br />
have completed one tool.<br />
Reporting<br />
Step 7: Cost-benefit appraisal development<br />
Develop a full cost-benefit appraisal, compiling and interpreting results<br />
from individual tools and evidence base review.<br />
<strong>The</strong> <strong>toolkit</strong> is structured around assessing both the qualitative, quantitative and<br />
monetisable value of <strong>green</strong> <strong>infrastructure</strong> investment, acknowledging that not all<br />
benefits can be expressed in monetary terms.<br />
Whilst there is good qualitative evidence for the benefits of <strong>green</strong> <strong>infrastructure</strong>, it<br />
is not always currently possible to put figures on some potential impacts, still less<br />
to assign an economic value.<br />
One example is economic growth and investment, where a number of studies<br />
have shown a positive correlation between environmental quality and businesses’<br />
decisions to relocate, but have not been able to quantify the relationship. <strong>The</strong><br />
complex nature of the relationships at play – including other factors such as<br />
transport links or a skilled workforce – mean that a simple estimation tool cannot<br />
provide meaningful results. More detailed specialist and bespoke techniques will<br />
be needed.<br />
In short, the <strong>toolkit</strong> cannot count everything. What it does count is designed to be<br />
robust enough for initial project appraisal, providing a range of figures indicating<br />
the potential impact of a <strong>green</strong> <strong>infrastructure</strong> intervention or even an existing<br />
<strong>green</strong> <strong>infrastructure</strong> asset<br />
In applying the tools, it is important to understand:<br />
<br />
<br />
the strategic contribution of the investment - how the investment<br />
contributes to a local plan and strategic objectives<br />
the context and scale of outputs - the proximity to business or<br />
households.<br />
Step 8: Reality-testing<br />
Critical review: ‘are you sure the results from the cost-benefit assessment<br />
make sense’<br />
Uncertainties exist in the science, as well in our knowledge of what the future<br />
holds - for example, in relation to climate change and the relative scarcity of<br />
resources. Any quantitative appraisal of <strong>green</strong> <strong>infrastructure</strong> benefits should<br />
account for such uncertainties, for example by providing lower and higher<br />
estimates.<br />
Whenever the evidence base suggests ranges in values, the calculation tools<br />
should be used with both the low and high value to present the results as<br />
ranges.<br />
<strong>The</strong> summary of evidence associated with each benefit category also highlights<br />
any sensitivity issues that should be taken into account – for example where the<br />
occurrence or extent to which a benefit occurs is highly dependent on specific<br />
factors.<br />
Step 9: Return on investment case<br />
Write your return on investment case articulating the full range of benefits<br />
associated with the project or site assessed.<br />
<strong>The</strong> cost-benefit appraisal sheet in the Calculator features at the bottom a ‘value<br />
for money test’ to help report results on value and compare to costs. <strong>The</strong> test<br />
compares an indicative assessment of the present value (PV) of those benefits<br />
18
Building natural value for sustainable economic development: <strong>The</strong> <strong>green</strong> <strong>infrastructure</strong> <strong>valuation</strong> <strong>toolkit</strong> <strong>user</strong> <strong>guide</strong><br />
that can be monetised to the costs of implementation - both initial capital and<br />
long-term maintenance. <strong>The</strong> cost benefit appraisal also describes the project<br />
benefits in non monetised terms through compiling indicative non-monetary<br />
quantitative outputs and short qualitative descriptions of applicable benefits.<br />
Comparing the PVs of the benefits from <strong>green</strong> <strong>infrastructure</strong> assets or<br />
improvements against associated capital and revenue costs and discounting on a<br />
common basis, is particularly relevant given that the benefits of <strong>green</strong><br />
<strong>infrastructure</strong> investment can be long term. For example, a canal-side<br />
improvement may create the setting for investment over a period of five to 10<br />
years. Some of the benefit groups, such as carbon storage and flood protection,<br />
may deliver benefits for periods of 50 years or longer.<br />
‘Discounting’ is based on the premise that people prefer to receive benefits in the<br />
present rather than in the future. <strong>The</strong> <strong>toolkit</strong> is designed to help its <strong>user</strong>s express<br />
the net present value* (NPV) of <strong>green</strong> <strong>infrastructure</strong> assets – that is their value<br />
in present terms, accounting for all the net benefits the assets will bring over their<br />
lifetime. In technical terms, the NPV is the sum of the present and discounted<br />
future flows of net benefits associated with a <strong>green</strong> <strong>infrastructure</strong> asset. <strong>The</strong><br />
discount rate* is used to reduce future benefits and costs to their present-time<br />
equivalent.<br />
<strong>The</strong> challenge in arguing the value for money case of any public sector<br />
investment is that usually the test is for the value of the benefits to equal at least<br />
the value of the costs. Preferably, it should exceed this by some margin, although<br />
not always, depending upon the wider case.<br />
For <strong>green</strong> <strong>infrastructure</strong> projects, however, it is generally accepted that it is not<br />
possible to monetise all their benefits. This means a compromise position is<br />
needed. <strong>The</strong> judgement made within the <strong>toolkit</strong> is that three components are<br />
required - reflecting the principle that the range of benefits resonate with different<br />
parts of the public sector.<br />
<br />
of a life, where it is perhaps not yet possible to directly relate <strong>green</strong><br />
<strong>infrastructure</strong> investment to health sector savings.<br />
Non-monetiseable - at least at this point - typically environmental and<br />
social benefits likely to result from a given <strong>green</strong> <strong>infrastructure</strong><br />
investment. In some instances those can still be expressed in<br />
quantitative terms.<br />
Figure 8 illustrates these components, which considered altogether build up an<br />
estimate of total economic value* (TEV) to be used to write a return on<br />
investment case.<br />
Figure 8: Return on investment case: investment costs v. monetised and nonmonetised<br />
benefits<br />
<br />
<br />
Contribution to gross value added (GVA): ‘GVA’ or ‘market’ style<br />
benefits are those that relate best to the contribution that <strong>green</strong><br />
<strong>infrastructure</strong> can make to a local economy in terms of the value of<br />
goods, services, employment, measured either as production, income –<br />
for example through jobs - or expenditure. ‘GVA’ benefits will be of<br />
particular interest for economic development agencies, private investors<br />
and so on.<br />
Other economic benefits, additional or alternative to the ‘GVA’ benefits<br />
and including ‘non-market’, but nevertheless monetisable benefits<br />
perhaps more closely associated with social, environmental and welfare<br />
economics. Examples include willingness to pay values associated with<br />
recreation or leisure opportunities, habitat protection, the social value of<br />
carbon reduction, or health benefits calculated using the statistical value<br />
2 Impact of Oakland County’s Green Infrastructure on the Local Economy, Oakland County<br />
Planning and Economic Development Services, August 2009<br />
3 Defra, An introductory <strong>guide</strong> to valuing ecosystem services, 2007 and Eftec for Defra,<br />
Valuing environmental impacts: <strong>guide</strong>lines for the use of value transfer, 2010.<br />
19
Building natural value for sustainable economic development: <strong>The</strong> <strong>green</strong> <strong>infrastructure</strong> <strong>valuation</strong> <strong>toolkit</strong> <strong>user</strong> <strong>guide</strong><br />
1 Climate change adaptation and mitigation<br />
Trees and other plants provide natural air conditioning and shelter, modifying the<br />
storage and exchange of heat in urban areas - improving the liveability of towns<br />
and cities and reducing the need for energy for heating and cooling.<br />
Trees and other plants also absorb carbon as they grow, and soils store carbon.<br />
Relevant types of <strong>green</strong> spaces and features – all <strong>green</strong> <strong>infrastructure</strong>:<br />
<br />
<br />
<br />
trees provide particular benefits for local climate control, including<br />
cooling and sheltering<br />
<strong>green</strong> space in cities is effective in reducing surface temperatures<br />
investment in <strong>green</strong> roofs offers great potential for urban cooling.<br />
For carbon sequestration and storage, the key factor is the volume of biomass.<br />
While all plants store carbon, the amount of carbon stored by individual street<br />
trees, or small areas of groundcover, is negligible in isolation. Unless considering<br />
these as components of a larger-scale <strong>green</strong> <strong>infrastructure</strong> intervention, or where<br />
carbon sequestration figures are particularly needed, it will not generally be worth<br />
trying to measure this impact, compared to other benefits of <strong>green</strong> space.<br />
WHAT THE EVIDENCE SHOWS<br />
Temperature regulation<br />
Trees, climbing plants, hedges, <strong>green</strong> space and other elements of <strong>green</strong><br />
<strong>infrastructure</strong> modify climate locally - and globally. Increasing the proportion of<br />
<strong>green</strong> <strong>infrastructure</strong> can help urban areas adapt to rising temperatures - reducing<br />
the urban heat island effect where buildings and streets absorb, store and radiate<br />
solar energy.<br />
<strong>The</strong> impact of <strong>green</strong> <strong>infrastructure</strong> on the built environment has been widely<br />
researched. Positive benefits are achieved through:<br />
<br />
<br />
the dissipation of incoming solar heat on building structures through<br />
shading<br />
the reduction of long-wave radiation exchange between buildings due to<br />
the low surface temperatures created by shading of plants<br />
the reduction in ambient air temperature through evapo-transpiration 4 .<br />
A number of studies in the UK and overseas have looked at these effects. Work<br />
in Chicago 5 by Nowak and McPherson modelled the impact of tree planting on air<br />
temperature and wind, looking at the impact of tree planting on urban<br />
temperatures.<br />
<br />
<br />
At a local scale, large numbers of trees and <strong>green</strong> spaces were found to<br />
reduce local air temperatures by 0.5°C to 5°C – whi ch can help lessen<br />
the need for air conditioning in buildings nearby.<br />
At the city scale, increasing urban tree cover by 10 per cent was<br />
estimated to reduce average air temperatures by 1°C .<br />
Similar, more recent work in the UK modelled the impact of increasing <strong>green</strong><br />
cover - including trees, <strong>green</strong> space and <strong>green</strong> roofs - in Greater Manchester as a<br />
strategy for adapting to climate change 6 . It found that a 10 per cent increase of<br />
<strong>green</strong> cover in areas with little <strong>green</strong> - urban centre and high density residential<br />
areas - keeps maximum surface temperatures below 1961-1990 levels until 2080.<br />
Green roofs have significant potential to make the biggest difference, given<br />
practical constraints on increasing <strong>green</strong> cover in urban areas.<br />
This would maintain city centre ‘liveability’ – reducing stress and ill-health, and<br />
maintaining the ability of cities to function as centres of trade and employment.<br />
<strong>The</strong> economic scale of this impact could be very significant. Further work is<br />
needed to correlate temperature and economic activity.<br />
At a local level, <strong>green</strong> <strong>infrastructure</strong> can conserve building energy use:<br />
<br />
<br />
<br />
shading reduces the amount of heat absorbed and stored by buildings<br />
evapo-transpiration converts liquid water to water vapour, thus cooling<br />
the air by using solar energy that would otherwise heat the air and the<br />
buildings<br />
in winter, the shelterbelt effect of trees and other <strong>green</strong> <strong>infrastructure</strong><br />
can slow winds, thereby reducing the amount of heat lost from buildings.<br />
<strong>The</strong> Chicago study found that increasing tree cover by 10 per cent - or about<br />
three trees per building - could reduce total heating and cooling energy use by 5<br />
to 10 per cent. Care is needed in applying these figures in the UK where domestic<br />
air-conditioning is uncommon. Looking at heating costs alone, a single, mature<br />
tree sheltering a building from wind could save around 1.3 per cent in<br />
energy costs. A ‘rule-of-thumb’ used in the UK 7 suggests 3 to 9 per cent energy<br />
savings from tree screening.<br />
Other <strong>green</strong> <strong>infrastructure</strong> adaptation benefits<br />
Green <strong>infrastructure</strong> can also help with adaptation to changing patterns of rainfall<br />
and wind. Increasing <strong>green</strong> cover by 10 per cent can reduce surface run-off by 5<br />
per cent - though climate change scenarios still predict that higher winter rainfall<br />
20
Building natural value for sustainable economic development: <strong>The</strong> <strong>green</strong> <strong>infrastructure</strong> <strong>valuation</strong> <strong>toolkit</strong> <strong>user</strong> <strong>guide</strong><br />
means that overall run-off increases, requiring additional storage capacity 8 . This<br />
is considered separately within water management and flood alleviation (below).<br />
By reducing wind speeds and turbulence, trees can also reduce risk of property<br />
damage.<br />
Carbon sequestration and storage<br />
Trees and other plants sequester carbon as they grow. <strong>The</strong> carbon is released<br />
again naturally when the plants die and decompose. Carbon is also stored longterm<br />
in wood products, buildings, furniture and so on. More carbon is stored in<br />
soils, fixed over time from dead trees and plants. Peat bogs, where plants decay<br />
anaerobically, are particularly significant carbon stores, though they are also<br />
sources of methane - a more potent <strong>green</strong>house gas.<br />
In their work on valuing the UK’s ecosystem services*, Jacobs 9 pooled findings<br />
from a wide range of sources, estimating the total annual value of carbon<br />
sequestration benefits in England for the three most significant land uses:<br />
Land use Annual value of carbon sequestration<br />
Woodland £998 million<br />
Peatland £4,979 million<br />
Wetlands £4,583 million<br />
<strong>The</strong>se figures should be treated as estimates, but they do give an indication of<br />
the importance of <strong>green</strong> <strong>infrastructure</strong> in sequestering carbon. Different estimates<br />
are reported elsewhere in the literature, reflecting different assumptions, different<br />
discount rates* and values of sequestered carbon.<br />
National figures are useful, but to estimate the carbon benefits of <strong>green</strong><br />
<strong>infrastructure</strong> at a project and local level we need to look at unit values, per<br />
hectare. It is also possible to estimate the carbon stored by street trees using<br />
average figures, but the accuracy and value will be low.<br />
Woodland and forestry<br />
With sustainable planting and felling - where new trees take the place of old -<br />
woods and forests can provide long-term carbon sequestration benefits.<br />
Community forestry, reclamation and reforestation of derelict and unproductive<br />
land provide new opportunities for carbon sequestration. A net total of 15.11<br />
million tons (Mt) CO 2 was sequestered by forestry in 2006, equivalent to around 3<br />
per cent of UK CO 2 emissions. 10<br />
A 2003 study on behalf of the Forestry Commission 11 looked at carbon<br />
sequestration by different trees in commercial forestry and woodland.<br />
Size matters<br />
Large urban trees can store up to 1,000 times the amount of carbon as small<br />
trees, with sequestration rates up to 90 times greater. Shrubs store only around 4<br />
per cent of the carbon of trees 12 .<br />
Soils<br />
Soils store carbon, and their protection is important. Defra recognises the need to<br />
prevent the loss of soil carbon to the atmosphere, and is exploring the potential<br />
for increasing existing carbon stores as a contribution to meeting the<br />
Government’s climate change targets 13 . It is estimated that more carbon is<br />
stored in the UK’s soils - around 10 billion tonnes - than in all the forests in<br />
Europe. Over half of this is in peatland habitats.<br />
In the US Cicahek and Macha 14 , looked at the amount of carbon stored in<br />
grassland to a depth of 60 cm. Most – around 75 per cent - of the 10-16 tC/ha<br />
measured was in the soil. However, in order to make an estimate of the carbon<br />
stored within a given area of land, more data is required, particularly for urban<br />
soils and <strong>green</strong> space uses. <strong>The</strong> supporting scientific evidence is developing in<br />
this field.<br />
ASSESSING THE BENEFITS<br />
Scale is important in measuring the benefit of <strong>green</strong> <strong>infrastructure</strong>. Planting a few<br />
trees on a new business park or around a residential development will have<br />
localised impacts on temperature regulation, specific to nearby buildings.<br />
Chang’s study of 61 parks (2007) showed that parks of at least 3<br />
hectares in size are on average 0.81ºC cooler - noon, summer - than<br />
their surrounding urban areas 15 .<br />
<br />
<br />
Parks have also been found to reduce temperature around their<br />
boundary up to 200 to 500 metres away, with larger parks having a<br />
greater impact 16 .<br />
Looking at two parks in Singapore - 12 hectares and 36 hectares - Chen<br />
Yu’s study (2006) concluded that large urban parks can extend the<br />
positive effects to the surrounding built environment during both day and<br />
night. <strong>The</strong> modelling work also pointed to energy savings of 10 per cent<br />
on reduced cooling load when buildings are built near to parks. Other<br />
studies have reported savings as high as 25 per cent.<br />
Clearly, care is needed in transferring this research to the UK, given the less<br />
widespread use of air conditioning.<br />
21
Building natural value for sustainable economic development: <strong>The</strong> <strong>green</strong> <strong>infrastructure</strong> <strong>valuation</strong> <strong>toolkit</strong> <strong>user</strong> <strong>guide</strong><br />
To affect urban temperatures more widely, a city-wide <strong>green</strong>ing strategy is<br />
needed. Modelling has shown that changing the proportion of ‘<strong>green</strong>’ to ‘grey’ can<br />
significantly change peak summer temperatures.<br />
<strong>The</strong> rate at which trees and other plants absorb carbon varies. Likewise, the<br />
quantity of carbon stored in different soil types varies greatly.<br />
For most project appraisals, variations in carbon storage and sequestration will be<br />
too small to count meaningfully. <strong>The</strong> exceptions are:<br />
<br />
<br />
large-scale proposals for tree planting<br />
enhancement, reinstatement or loss of moorland, peat bog or wetland.<br />
For other projects, it may be useful to have an estimate of the amount of carbon<br />
stored as a whole – for example in parkland and other <strong>green</strong> space across a city.<br />
However, the change from any given urban <strong>green</strong> <strong>infrastructure</strong> enhancement will<br />
be low.<br />
QUANTIFYING<br />
Temperature moderation<br />
<strong>The</strong> Chicago study model took account of factors including:<br />
<br />
<br />
<br />
<br />
<br />
local climate<br />
type and maturity of the trees<br />
distance from the building<br />
type of building<br />
levels of insulation.<br />
It then considered the impact on building temperatures, and the potential for<br />
energy saving for heating and cooling.<br />
Undertaking similar modelling would be possible for sites in the UK, and would<br />
yield the most accurate figures. However, the level of data required is significant,<br />
so a simplified version based on the outputs of the Chicago modelling is<br />
preferred. Though the Chicago climate is subject to greater extremes, average<br />
seasonal temperatures are similar to those in the UK.<br />
Note that:<br />
<br />
<strong>The</strong> study looked only at residential properties. <strong>The</strong> <strong>toolkit</strong> uses figures<br />
for the largest property size to extrapolate for commercial property (see<br />
further work, below).<br />
<br />
<strong>The</strong> UK ‘rule-of-thumb’ for energy savings is in the order of 3 per cent to<br />
9 per cent of total energy. This is a higher figure than that derived from<br />
the Chicago work. Other research indicates that the sheltering impact of<br />
a belt of urban woodland can cut energy costs by 10 per cent 17 .<br />
As an average, the <strong>toolkit</strong> uses 3 per cent savings for domestic - heat - and<br />
8 per cent - heat and cooling - for commercial from the presence of trees.<br />
At a larger scale, a city-wide <strong>green</strong>ing strategy can impact on city temperatures,<br />
and estimates can be made of the degree of cooling against different climate<br />
change scenarios. Modelling in Manchester suggested an increase of 10 per cent<br />
in <strong>green</strong> cover could keep maximum surface temperatures in high density<br />
residential areas and town centres at or below 1961-1990 levels until the 2080s.<br />
Figure 9 illustrates this effect.. With 23 per cent <strong>green</strong> cover peak surface<br />
temperatures are 32 o C. Creating 10 per cent new <strong>green</strong> cover - for example with<br />
a <strong>green</strong> roof programme, or increased canopy from street trees - reduces peak<br />
summer temperatures to 29 o C.<br />
Reducing <strong>green</strong> space by 10 per cent - through development - will reduce<br />
cooling, and peak surface temperatures rise to 35 o C. Note that these are<br />
estimates based on modelling for Manchester, but give a good indication of<br />
potential impacts for other urban areas. A better estimate could be made with<br />
more detailed modelling.<br />
Figure 9: Variation in peak surface temperature as a function of the evaporative<br />
fraction (source: Gill et al, 2007)<br />
(Evaporative fraction is the fraction of ground cover which<br />
evapo-transpires – vegetation and water – within an area.)<br />
22
Building natural value for sustainable economic development: <strong>The</strong> <strong>green</strong> <strong>infrastructure</strong> <strong>valuation</strong> <strong>toolkit</strong> <strong>user</strong> <strong>guide</strong><br />
Carbon sequestration<br />
Key factors affecting rates of carbon sequestration include:<br />
<br />
<br />
<br />
species<br />
climate<br />
how the asset is managed – planting and felling.<br />
In most cases, it will be appropriate to use average values which take account of<br />
these factors.<br />
For managed coniferous forest over a full lifecycle - from planting to harvesting<br />
- around 2.5 tonnes of carbon is sequestered per hectare per year 18 .<br />
Urban <strong>green</strong> space, street trees and <strong>green</strong> roofs also store and sequester<br />
carbon. In principle, it would be possible to estimate both the carbon stored and<br />
the amount sequestered every year. However, there are two main problems:<br />
<br />
<br />
detailed knowledge of the type and quantity of <strong>green</strong> <strong>infrastructure</strong> is<br />
generally lacking – although the extent of <strong>green</strong> space cover can be<br />
relatively easily assessed from aerial photographs<br />
relevant values for carbon sequestration are not available for all <strong>green</strong><br />
<strong>infrastructure</strong> types – for example public parks.<br />
It is clear that the annual carbon sequestration value will be small for grass cover,<br />
compared to woodlands and forestry.<br />
Protection of carbon stores<br />
Protection of stored carbon in the soil is important. Carbon storage in soil<br />
depends on a number of factors, including soil type, condition and use.<br />
Knowledge of the carbon stored should be an important consideration where land<br />
use change is proposed. However, the evidence base does not yet allow robust<br />
estimates to be made of the carbon storage capacity of different types of <strong>green</strong><br />
<strong>infrastructure</strong>.<br />
MONETISING<br />
Gross value added impact – urban cooling<br />
In principle, an estimate can be made of the economic impact of a city-wide<br />
<strong>green</strong>ing strategy as a measure to adapt to climate change.<br />
This could be a very significant figure, sufficient in itself to justify a city-wide,<br />
urban <strong>green</strong>ing strategy. However, further work is first needed on the sensitivity of<br />
economic activity to temperature (see below).<br />
Building energy saving – cooling<br />
Using work from the US and UK, an estimate is made of the energy saved by<br />
having trees around buildings – the benefits include energy, fuel cost, CO 2. <strong>The</strong><br />
benefits will largely be for public and commercial premises given the limited use<br />
of air-conditioning in homes in the UK. Estimates can be made for reduced<br />
energy use, cost and also carbon reductions.<br />
Building energy saving – heating<br />
Using work from the US and UK, an estimate is made of the energy saved in<br />
having trees sheltering buildings, reducing the heat loss by slowing wind – the<br />
benefits include energy, cost, CO 2. This is dependent on the location of the<br />
tree(s) and local climatic conditions, so care is needed in applying the tool.<br />
Where the quantity of carbon sequestered is known, a monetary value can be<br />
found using an appropriate price of carbon.<br />
In 2009, the Department of Energy and Climate Change (DECC) issued new<br />
advice on carbon <strong>valuation</strong> 19 .<br />
For assessing projects that reduce or increase emissions in sectors not covered<br />
by the EU Emission Trading System - the ‘non-Traded Sector’ which includes<br />
most <strong>green</strong> <strong>infrastructure</strong> projects - a ‘non-traded price of carbon’ will be<br />
used. This is based on estimates of the marginal abatement cost* (MAC)<br />
required to meet a specific emission reduction target.<br />
For example, this gives a short-term non-traded price of carbon of £60 per tonne<br />
CO 2e in 2020, with a range of +/- 50 per cent - so a central value of £60, £90<br />
high estimate and £30 low estimate.<br />
In the longer term - 2030 onwards - consistent with the development of a more<br />
comprehensive global carbon market, the traded and non-traded prices of carbon<br />
will converge into a single traded price of carbon.<br />
• for 2030, the value is £70 per tonne of CO 2e, with a range of +/- 50<br />
per cent – so a £70 central estimate, £105 high estimate and £35 low<br />
estimate<br />
• for 2050, the value is £200 per tonne of CO 2e, with a range of +/- 50<br />
per cent – so a £200 central estimate, £300 high estimate and £100<br />
low estimate.<br />
Note that for assessing policies that reduce or increase emissions in sectors<br />
which are covered by the EU Emission Trading System, and in the future other<br />
trading schemes, a ’traded price of carbon’ will be used. Most <strong>green</strong><br />
<strong>infrastructure</strong> schemes will not fall into this category.<br />
23
Building natural value for sustainable economic development: <strong>The</strong> <strong>green</strong> <strong>infrastructure</strong> <strong>valuation</strong> <strong>toolkit</strong> <strong>user</strong> <strong>guide</strong><br />
TOOLS AVAILABLE IN THE CALCULATOR<br />
et al, April 2010)<br />
Tools Input data Tool basis<br />
Tool 1.1: Building energy saving –<br />
heating. [ Quantification and<br />
Monetisation functional for only<br />
residential properties]<br />
Estimates the energy saved in<br />
having trees sheltering residential<br />
and commercial buildings thereby<br />
reducing the heat loss.<br />
Tool 1.2: Reduction in carbon<br />
emissions from building energy<br />
saving – heating. [Quantification<br />
and Monetisation functional for<br />
only residential properties]<br />
Estimates reduction in carbon<br />
emissions associated with energy<br />
savings for heating by multiplying<br />
energy reduction (in kWh) by<br />
0.203<br />
Tree cover and<br />
types planted within<br />
10m of buildings.<br />
Size of trees.<br />
Residential building<br />
numbers and types.<br />
Commercial building<br />
numbers and types.<br />
Application of Chicago<br />
1994 study.<br />
For estimation, use 3%<br />
energy savings for each<br />
residential property
Building natural value for sustainable economic development: <strong>The</strong> <strong>green</strong> <strong>infrastructure</strong> <strong>valuation</strong> <strong>toolkit</strong> <strong>user</strong> <strong>guide</strong><br />
Adapting cities for climate change: the role<br />
of <strong>green</strong> <strong>infrastructure</strong>. Gill, Handley et al,<br />
2007<br />
Evaluating Green Roof Energy<br />
Performance. Jeffrey Sonne, Ashrae<br />
Journal 2006<br />
Carbon stored and sequestered in<br />
woodland and forest (including soils)<br />
Carbon storage and sequestration in soils<br />
Key benefit transfer values<br />
Average heating energy savings per tree<br />
Further research needed<br />
c.10tC/ha for grassland - further research<br />
needed<br />
1.3% (Chicago)<br />
3-9% (UK)<br />
emissions if natural gas was the heating fuel. This study also suggests that the<br />
benefit would be more significant in buildings with curtain walls of which U-value<br />
is much lower than a standard wall and in residential buildings.<br />
Further work is needed to provide useable values for the carbon stored in<br />
different land use types, including soils. This is very complex and context-specific<br />
– there is great variety in soil type and usage, and hydrology, climate and ecology<br />
are important factors. It is unrealistic to expect highly accurate estimates to be<br />
possible for all land-use types, but it should be possible to obtain better ‘ball park’<br />
figures for broad groups.<br />
4 Wong N. et al, 2003. Investigation of thermal benefits of rooftop gardens in the tropical<br />
KNOWLEDGE GAPS<br />
<strong>The</strong> main area for further work is clarification of the current research - to bring<br />
together a consistent view on the science - and work to link temperature rises on<br />
economic activity, measured by gross value added. Coupled with work cited here<br />
on using <strong>green</strong> <strong>infrastructure</strong> to adapt to climate change, this would allow an<br />
estimate to be made of the gross value added impact of urban <strong>green</strong>ing<br />
strategies, influencing <strong>green</strong> roofs, tree planting and <strong>green</strong> space<br />
protection/enhancement.<br />
Further work is also desirable to model local impacts of <strong>green</strong> <strong>infrastructure</strong> on<br />
local temperature regulation in the UK, to inform tree planting strategies in<br />
relation to species type, location, scale of planting and so on.<br />
UK based evidence on the cooling impact of trees on buildings could help<br />
complete tool 1.5. A number of bespoke academic studies have also been<br />
undertaken in the UK and elsewhere assessing the cooling impact of trees on<br />
particular buildings, however it is difficult to generalise findings:<br />
<strong>The</strong> Centre for Urban Forestry Research (part of the US Forest Service, a USDA<br />
agency) reports that well placed, mature trees can save consumers up to 30% of<br />
annual cooling costs and save 10-25% of energy used for heating 20 .<br />
Royal Institute of Chartered Surveyors sponsored research 21 finds that based on<br />
the typical UK climate, the savings on energy costs from <strong>green</strong> roof installation<br />
are negligible, with the energy savings possible with a 10cm deep <strong>green</strong> roof<br />
capable of being delivered with just 3mm extra insulation.<br />
Another study 22 predicted 4.45% annual heating energy savings for a typical<br />
office building in Scotland, equivalent to a reduction of 400 kg of annual CO2<br />
environment. Building and Environment 38: 267-270.<br />
5<br />
Nowak, McPherson and Rowntree, Chicago’s urban forest ecosystem: results of the<br />
Chicago urban forest climate project, USDA,1994<br />
6<br />
Gill, Handley et al, Adapting cities for climate change: the role of <strong>green</strong> <strong>infrastructure</strong>, 2007<br />
7<br />
Rawlings for DETR, Environmental rules of thumb, 1999<br />
8<br />
Gill, Handley et al, Adapting cities for climate change: the role of <strong>green</strong> <strong>infrastructure</strong>,<br />
2007<br />
9<br />
Jacobs, Valuing England’s terrestrial ecosystems services, 2008<br />
10<br />
Natural England, Research report NERR026: Carbon management by land and marine<br />
managers, 2008<br />
11<br />
Brainard, Lovett and Bateman, Carbon sequestration benefits of woodland, 2003<br />
12<br />
Nowak, McPherson and Rowntree, Chicago’s urban forest ecosystem: results of the<br />
Chicago urban forest climate project, USDA,1994<br />
13<br />
Defra, Safeguarding our soils, 2009<br />
14<br />
Macha, D., and L. Cihacek.. Carbon storage in plant and soil components of selected<br />
grass monocultures. AnMtgsAbsts2009.53321. ASA, CSSA, SSSA, Madison WI, 2009<br />
15<br />
Chang et al, 2007 "A preliminary study on the local cool-island intensity of Taipei city<br />
parks." Landscape and Urban Planning 80(4): 386-395.<br />
16<br />
Yu and Hien, 2006, <strong>The</strong>rmal benefits of city parks. Energy and Buildings 38, 105-120.<br />
17<br />
Heisler, Energy savings with trees, 1986 and Jones (2003) cited in Landscape<br />
consultants (2004)<br />
18<br />
Forestry Commission<br />
25
Building natural value for sustainable economic development: <strong>The</strong> <strong>green</strong> <strong>infrastructure</strong> <strong>valuation</strong> <strong>toolkit</strong> <strong>user</strong> <strong>guide</strong><br />
19<br />
Department of Energy and Climate Change, Carbon <strong>valuation</strong> in UK policy appraisal: a<br />
revised approach, Climate Change Economics, July 2009<br />
20 Cited in http://www.nmenvirothon.com/Forestry/Ch.9_urban%20forestry.pdf<br />
21 Can <strong>green</strong>ery make commercial buildings more <strong>green</strong> Built and Rural Environments,<br />
Aug 2007<br />
22 Wang et al, Heriot Watt University, December 2006. Reducing Space Heating in Office<br />
Buildings Through Shelter Trees, Energy and Buildings 38,<br />
26
Building natural value for sustainable economic development: the <strong>green</strong> <strong>infrastructure</strong> <strong>valuation</strong> <strong>toolkit</strong> <strong>user</strong> <strong>guide</strong><br />
2 Flood alleviation and water management<br />
Green <strong>infrastructure</strong> can help store and intercept rainwater and facilitate<br />
natural drainage.<br />
Relevant types of <strong>green</strong> spaces and features – all trees, plants and <strong>green</strong><br />
<strong>infrastructure</strong>, but particular functional benefits from:<br />
<br />
<br />
elements of sustainable urban drainage systems (SUDS)<br />
<strong>green</strong> roofs in urban areas.<br />
WHAT THE EVIDENCE SHOWS<br />
Creating, reinstating or protecting natural drainage systems can reduce flood risk<br />
as well as demand on sewers and the wastewater treatment network:<br />
trees and other plants process rainwater, through interception,<br />
evaporation and transpiration<br />
<strong>green</strong> space allows natural infiltration of surface water<br />
Sustainable Urban Drainage Systems (SUDs) include elements of<br />
<strong>green</strong> <strong>infrastructure</strong> - culverts, ditches and swales<br />
reed beds can be used to treat wastewater<br />
washlands and wetlands can store water and provide a buffer against<br />
flooding<br />
woodland and forests can help regulate watersheds, reducing river<br />
flow speeds, the frequency and severity of flooding and soil erosion,<br />
and conserving nutrients.<br />
Flooding<br />
<strong>The</strong> summer of 2007 was the wettest on record, causing substantial flooding in<br />
areas around York and Humberside, as well as the Midlands, Gloucestershire<br />
and South East. Flooding claimed the lives of several people and over 55,000<br />
homes and businesses were flooded across England and Wales. Insured losses<br />
totalled approximately £3 billion 23 alone, and key critical utilities were affected.<br />
Water supplies to 140,000 homes in Gloucestershire were cut off for up to two<br />
weeks, and almost 300 schools in Yorkshire and Humberside suffered damage.<br />
Climate change brings with it increased risk of surface water flooding in the<br />
future. Land-use planning is an important tool in managing that risk 24 .<br />
Surface water<br />
Protecting and enhancing <strong>green</strong> space within urban areas is important for<br />
managing rainwater. A study in Manchester showed that a 10 per cent increase in<br />
<strong>green</strong> cover resulted in a 5 per cent reduction in surface water run off 25 . Green<br />
space reduces the total volume of run-off through infiltration, absorption and<br />
evapotranspiration. It also flattens out the peaks in run-off by holding back the<br />
water, acting as temporary storage. <strong>The</strong> need for increased sewer capacity is<br />
reduced on both counts.<br />
Water companies offer reduced bills for customers who handle their own surface<br />
water, avoiding discharging to the combined sewer network.<br />
Sustainable Urban Drainage Systems (SUDS)<br />
<strong>The</strong>se are increasingly specified as a requirement for new developments 26 .<br />
SUDS reduce the need for hard engineering solutions – so can be compared with<br />
these to estimate the value of benefits. SUDS can also create high quality<br />
environments which encourage biodiversity.<br />
<strong>The</strong> uptake of SUDS in the UK has been slow, partly because of the lack of a<br />
clear framework on responsibility for their maintenance and upkeep. However, the<br />
Flood and Water Management Act 2010 includes a requirement for developers to<br />
build new surface water drainage systems to standards that reduce flood damage<br />
and improve water quality. It also gives local authorities responsibility for<br />
approving, adopting and maintaining new SUDS, where they affect more than<br />
one property 27 .<br />
River catchment management<br />
River flows can be moderated by careful planning of <strong>green</strong> <strong>infrastructure</strong>,<br />
including restoring natural vegetation, and creating or protecting washlands. This<br />
can slow river flows and allow venting to undeveloped floodplains, reducing the<br />
incidence and severity of flooding in urban areas.<br />
Rising sea levels will increase the risk of coastal flooding. Rewetting schemes*<br />
and managed realignment* can reduce coastal flood risk and reduce drainage<br />
costs:<br />
<br />
.<br />
<br />
rewetting schemes refer to the deliberate process of elevating the<br />
average annual water table in an area by partially or completely<br />
removing the drainage controls previously in place<br />
managed realignment refers to the deliberate process of altering the<br />
line of river, estuary or coastal defences – this can include widening a<br />
flood plain or lowering or moving flood defences<br />
27
Building natural value for sustainable economic development: the <strong>green</strong> <strong>infrastructure</strong> <strong>valuation</strong> <strong>toolkit</strong> <strong>user</strong> <strong>guide</strong><br />
<strong>The</strong>se are promoted by the Environment Agency as a cost-effective approach to<br />
coastal defence.<br />
ASSESSING THE BENEFITS<br />
Measuring the impact of <strong>green</strong> <strong>infrastructure</strong> on improved water management and<br />
reduced flood requires detailed knowledge of:<br />
the hydrology of an area<br />
existing water <strong>infrastructure</strong><br />
the area and permeability of surfaces (natural and built)<br />
climatic conditions.<br />
For most schemes, detailed appraisal by the Environment Agency and statutory<br />
drainage authorities - water companies and local authorities - will be needed.<br />
This <strong>toolkit</strong> provides a <strong>guide</strong> to assess the type and potential level of<br />
benefits likely to be achievable. <strong>The</strong> evidence highlighted above shows that the<br />
potential benefits are significant. For example, reinstatement of catchment<br />
ecosystems can improve water quality and attenuate river flows, reducing flood<br />
risk. Reduced flood risk can reduce losses from property damage - avoided loss -<br />
and reduce insurance premiums. Green <strong>infrastructure</strong> can also substitute for<br />
more costly hard engineering/flood prevention solutions.<br />
QUANTIFYING<br />
Quantifying and valuing water management benefits accurately requires detailed<br />
modelling of water catchments, including surface water sewer systems.<br />
Major flood risk management schemes<br />
Bespoke appraisal by the Environment Agency will usually be required, where<br />
natural drainage options will be considered alongside other flood risk<br />
management interventions. <strong>The</strong> Environment Agency uses a number of ‘Outcome<br />
Measures (OM)’ 28 to assess schemes, including:<br />
OM1: Economic benefits<br />
OM2: Households at risk<br />
OM3: Deprived households at risk<br />
Other output measures include:<br />
nationally important wildlife sites<br />
UK Biodiversity Action Plan habitats<br />
flood warning<br />
contingency planning<br />
inappropriate development<br />
long-term policies and action plans.<br />
SUDS schemes<br />
An indication of the scale of benefit can be derived from their capacity, measured<br />
in cubic metres (m 3 ). An indirect <strong>valuation</strong> (see below) can then be made,<br />
comparing the scheme to the cost of creating equivalent capacity via a hard<br />
engineering solution.<br />
Green space<br />
Partial estimates of the water management value can be made using data for<br />
evaporation, transpiration and interception of rainwater for different land cover<br />
types. This effectively estimates reduced surface water run off - where this run<br />
off would otherwise enter the sewer network, there are resulting cost reductions in<br />
treatment and provision of the sewer capacity.<br />
Water companies recognise the benefit of reducing surface water flows into their<br />
combined sewers and offer reduced tariffs to customers who implement<br />
sustainable drainage schemes.<br />
All these <strong>valuation</strong> approaches will significantly underestimate the<br />
cumulative impact of local <strong>green</strong> <strong>infrastructure</strong> schemes. Reducing surface<br />
water run off will reduce failure of combined sewer overflows (CSO) and overtopping<br />
of flood defences in extreme flows - this is where there are significant<br />
cost savings through avoided <strong>infrastructure</strong> costs and avoided cost of property<br />
damage.<br />
MONETISING<br />
Three <strong>valuation</strong> tools are included in the <strong>toolkit</strong>.<br />
Tool 2.1 – Energy and CO2 emissions savings from reduced volume of<br />
stormwater entering combined sewers<br />
-!- This tool is only appropriate in urban areas with a combined sewer<br />
network.<br />
This tool is designed to help assess the impact of vegetation on the amount of<br />
rainfall entering combined sewers. It uses Forestry Commission values for<br />
evapotranspiration and interception for different land cover - coniferous trees,<br />
deciduous trees, grassland.<br />
It does not take account of water retention within soils, which is highly dependent<br />
on soil types and their storage capacity - which itself varies according to how<br />
much water they are already holding.<br />
28
Building natural value for sustainable economic development: the <strong>green</strong> <strong>infrastructure</strong> <strong>valuation</strong> <strong>toolkit</strong> <strong>user</strong> <strong>guide</strong><br />
Reductions in surface water entering combined sewers lower operational costs<br />
for water treatment, including energy consumption - water companies use an<br />
average of 645 kWh/megalitre of wastewater treated.<br />
Tool 2.2 - Savings in wastewater treatment costs to domestic and<br />
commercial water customers<br />
This tool uses published water industry figures for surface water drainage<br />
charges to assess cost savings to residential and commercial customers who are<br />
not draining rain water into combined sewers. Where property holders –<br />
residential and commercial – avoid discharging surface water from their property<br />
into the combined sewer network, water companies provide a discount to<br />
wastewater bills. For domestic properties in north-west England, the discount is<br />
£35.33 per year 29 . For commercial properties the discount varies with ‘chargeable<br />
area’ - the area of the premises, discounting and permeable areas - in bands. For<br />
example:<br />
• for a site of 0.15-0.3 hectares, the discount is £918 per year<br />
• for a site of 2.5-5 hectares the discount is £15,313 per year.<br />
Potential: tool 2.3 - Avoided <strong>infrastructure</strong> costs<br />
This tool is designed to help assess cost savings from managing stormwater with<br />
SUDS and avoiding the need for hard engineering solutions. SUDS can bring<br />
savings by reducing or avoiding the need for investment in new storage and<br />
treatment capacity, and also avoids ongoing operating costs.<br />
TOOLS AVAILABLE IN THE CALCULATOR<br />
Tools Data input Tool basis<br />
Tool 2.1: Energy and CO2<br />
emissions savings from<br />
reduced volume of<br />
stormwater entering<br />
combined sewers [<br />
Functional]<br />
Estimates the energy<br />
savings associated with<br />
the impact of vegetation<br />
on reducing the amount of<br />
stormwater entering<br />
combined sewers.<br />
Tool 2.2: Savings in<br />
wastewater treatment<br />
costs to domestic and<br />
commercial water<br />
customers [ Functional]<br />
Uses published water<br />
industry figures for surface<br />
water drainage charges, to<br />
estimate the actual cost<br />
savings to residential and<br />
commercial customers<br />
who are not draining<br />
rainwater into combined<br />
sewers.<br />
Land use - coniferous trees,<br />
deciduous trees, grassland.<br />
Average rainfall (or 800mm<br />
pa default)<br />
Water treatment costs<br />
(energy and other inputs)<br />
Number of domestic<br />
properties avoiding<br />
discharging to combined<br />
sewers.<br />
Area of commercial<br />
property.<br />
Application of Forestry<br />
Commission data on the<br />
use of water by trees and<br />
other land cover to estimate<br />
reduction in surface water to<br />
sewers.<br />
Water company information<br />
on site area charges for<br />
surface water drainage.<br />
Tool 2.3: Avoided costs of<br />
traditional water drainage<br />
<strong>infrastructure</strong><br />
[Quantification and<br />
monetisation require<br />
further research]<br />
Estimates cost saving from<br />
managing stormwater<br />
through SUDS rather than<br />
through traditional<br />
engineering solutions.<br />
Requires average cost data<br />
for construction of new<br />
rainwater storage tank<br />
capacity<br />
29
Building natural value for sustainable economic development: the <strong>green</strong> <strong>infrastructure</strong> <strong>valuation</strong> <strong>toolkit</strong> <strong>user</strong> <strong>guide</strong><br />
KEY EVIDENCE AND SOURCES<br />
Market Values<br />
£35.33 – surface water drainage<br />
charge for residential properties<br />
£35.33-£58,000 – surface water<br />
drainage charge for commercial<br />
properties, dependent on area<br />
Average cost of additional water<br />
storage capacity.<br />
United Utilities, 2009/10<br />
www.unitedutilities.com/siteareacharges.htm<br />
Figure from water industry<br />
evidence base will be strengthened in this area as the results of major upland<br />
catchment management schemes begin to emerge. Recent work by EFTEC 31 on<br />
upland moorland ecosystem management did not include potential flood risk<br />
reduction benefits due to lack of data. Likewise, no data was available on the<br />
impact of <strong>green</strong> <strong>infrastructure</strong> interventions on drinking water quality, where<br />
investment to improve upland blanket bog can reduce peat erosion and<br />
colouration.<br />
Developing the evidence base is essential. Further research work into the<br />
impacts of <strong>green</strong> <strong>infrastructure</strong> intervention on attenuation of river flows is<br />
needed, for example, to model the impact of tree planting or land restoration.<br />
Scientific values/research<br />
Evaporation losses by land cover<br />
types eg conifers – 550mm-<br />
800mm for 1m annual average<br />
rainfall.<br />
Benefit transfer values<br />
Conversion factors<br />
645kWh / megalitre<br />
KNOWLEDGE GAPS<br />
Water use by trees, Forestry Commission, April 2005<br />
Average energy use in wastewater treatment (Water<br />
UK)<br />
23 Pitt, Learning lessons from the 2007 floods, Cabinet Office<br />
24<br />
Foresight: Future flooding study, 2004<br />
25<br />
Gill, Adapting cities for climate change, ASSCUE, 2006<br />
26<br />
Communities and Local Government, Eco towns planning guidance, 2009<br />
27<br />
Flood and Water Management Act 2010<br />
28<br />
Environment Agency’s flood and coastal erosion risk management appraisal guidance<br />
(FCERM-AG): www.environment-agency.gov.uk/research/planning/116705.aspx<br />
29<br />
United Utilities, 2009/10, www.unitedutilities.com/siteareacharges.htm<br />
30<br />
Gill, Adapting cities for climate change, ASSCUE, 2006<br />
31<br />
EFTEC for Natural England, Economic <strong>valuation</strong> of upland ecosystem services, 2009<br />
A key gap is in relating small-scale interventions – for example the creation of a<br />
<strong>green</strong> roof or new <strong>green</strong> space – to wider surface water management. Modelling<br />
work has been carried out for Manchester showing a 5 per cent reduction in<br />
surface water run off from a 10 per cent increase in <strong>green</strong> cover 30 . It would be<br />
helpful to be able to derive a monetary value for this impact (in terms of cost<br />
avoidance) and to be able to commoditise this for local schemes.<br />
<strong>The</strong> estimates for the reduction in wastewater treatment costs are solely based<br />
on energy savings, not on wider inputs - including other operating costs,<br />
chemicals and so on. Estimates also do not take account of the capital costs of<br />
providing the sewer network, including the wastewater treatment works. To<br />
capture these costs in full, it might be best to use the long run marginal cost* for<br />
wastewater treatment, with average values obtained from the water companies.<br />
<strong>The</strong> <strong>toolkit</strong> does not include any quantification of the benefits of improved water<br />
quality resulting from improved catchment management. It is hoped that the<br />
30
Building natural value for sustainable economic development: the <strong>green</strong> <strong>infrastructure</strong> <strong>valuation</strong> <strong>toolkit</strong> <strong>user</strong> <strong>guide</strong><br />
3 Place and communities<br />
Green <strong>infrastructure</strong> can improve the environment, providing<br />
opportunities for recreation, community cohesion, improved visual<br />
amenity, and attracting inward investment.<br />
Relevant types of <strong>green</strong> spaces and features – primarily planned urban <strong>green</strong><br />
<strong>infrastructure</strong> aimed at enhancing the urban environment, providing a setting for<br />
investment and improving quality of life.<br />
Green <strong>infrastructure</strong> types include:<br />
<br />
<br />
<br />
<br />
<br />
<br />
amenity <strong>green</strong>space<br />
civic squares and spaces<br />
allotments<br />
community gardens and urban farms<br />
parks and public gardens<br />
community woodland.<br />
WHAT THE EVIDENCE SHOWS<br />
Green <strong>infrastructure</strong> is one of the key components of quality of place, together<br />
with other factors such as transport links, the range and mix of homes, services<br />
and amenities, the design and upkeep of buildings and streets and so on. Work<br />
done on behalf of the Northern Way 32 defines quality of place as ‘...the sum of<br />
those factors – culture, local environment, public realm, housing, community<br />
safety, access, health – which together make somewhere – whether a town, city<br />
or region – an attractive place to live’.<br />
Green <strong>infrastructure</strong> is part of a mix of factors contributing to quality of<br />
place helping to position a place or location as economically attractive, and<br />
therefore meriting investment.<br />
Research conducted by CABE based on statistical analysis of the Best Value<br />
Performance Indicators data (2006/07) has shown that there is a strong link<br />
between people’s satisfaction with their local parks and open spaces and their<br />
satisfaction with their neighbourhood. People do value and use their local <strong>green</strong><br />
spaces: three out of four people visit a public <strong>green</strong> space at least once a month<br />
– and more than a quarter do so at least three times a week. 33<br />
ECOTEC 34 describe how the debate surrounding <strong>green</strong> space has evolved<br />
rapidly, in part ‘forced in the UK by the emergence of the concept of sustainable<br />
communities, with quality of place and quality of life as key drivers of regeneration<br />
and economic renewal’. ECOTEC highlighted the case for <strong>green</strong> <strong>infrastructure</strong> as<br />
a key element of sustainable communities, linking the value that people place<br />
upon <strong>green</strong> space - opportunity for recreation, improved image of place,<br />
attractiveness to visitors, increased community cohesion and civic pride - with<br />
additional land and property value and desirable business location that well<br />
planned, high quality <strong>green</strong> <strong>infrastructure</strong> brings.<br />
<strong>The</strong> scale of the impact is likely to vary: additional investment in an already<br />
good quality public park may have less impact on quality of place than creating a<br />
new local park in an area with little <strong>green</strong> space.<br />
Isolating the contribution of <strong>green</strong> <strong>infrastructure</strong> is problematic, as is<br />
identifying an indicator or set of indicators which adequately cover all aspects of<br />
quality of place – the full range of benefits considered in the <strong>toolkit</strong> contribute to<br />
making <strong>green</strong> <strong>infrastructure</strong> one of the quality of place’s key components. Much<br />
of the literature focuses on land and property prices as a proxy for quality of place<br />
– see section 5, Land and property. Section 9 considers recreation and leisure<br />
benefits to people using <strong>green</strong> space. This chapter focuses on the benefits of<br />
<strong>green</strong> space for community cohesion, and visual amenity.<br />
Community cohesion<br />
Various surveys have shown that <strong>green</strong> <strong>infrastructure</strong> has the ability to bring<br />
people together and to promote social cohesion.<br />
A 2004 literature review by the Health Council of the Netherlands 35 found three<br />
papers addressing the social impact of shared <strong>green</strong> space. <strong>The</strong> presence of<br />
<strong>green</strong> space correlated positively with social ties within a neighbourhood.<br />
Communal/shared activities such as community gardening and allotments are<br />
also seen as a means of improving local neighbourhoods, enhancing community<br />
attractions and improving attitudes of residents towards their neighbourhood.<br />
Useful studies include:<br />
<strong>The</strong> value of public space, Cabe Space 2005<br />
Greenspaces, better places, Urban Green Spaces Taskforce, 2002<br />
QUANTIFYING<br />
Landscape/visual amenity<br />
This is the approach used by the <strong>toolkit</strong>. It is generally expressed as a<br />
willingness to pay* for a view, and varies according to landscape type.<br />
<strong>The</strong> simplest tool for valuing landscape and visual amenity is provided in Eftec’s<br />
work on valuing the external benefits of undeveloped land - see below. <strong>The</strong><br />
values provided include a basket of benefits, including recreation. It does not take<br />
account of local context - including <strong>green</strong> space nearby, the quality of the asset,<br />
31
Building natural value for sustainable economic development: the <strong>green</strong> <strong>infrastructure</strong> <strong>valuation</strong> <strong>toolkit</strong> <strong>user</strong> <strong>guide</strong><br />
the accessibility of the asset and so on. It can, however, provide a ballpark<br />
estimate of the level of benefits. More detailed studies are needed.<br />
A 2003 Garrod/Macmillan study for the Forestry Commission – see below -<br />
estimated the value of woodland views from properties. It focused on the number<br />
of urban fringe households with a woodland view, which was found using 1991<br />
Census classification of wards.<br />
<strong>The</strong> willingness to pay figures generated by the study can be used together with<br />
the number of households within 450 metres of the <strong>green</strong> asset.<br />
Community cohesion<br />
Attempts at quantification appear to be limited to the number of volunteer hours<br />
committed by individuals to shared or communal <strong>green</strong> <strong>infrastructure</strong> projects and<br />
activities. Greenspace Scotland is embarking upon a two-year research<br />
programme ‘Greenspace is good – so prove it!’ funded by the Big Lottery<br />
Research Programme. Recruitment of participating groups was targeted for<br />
January 2010 – so it is possible that a potential tool may evolve through this<br />
research.<br />
forests in different landscape contexts – such as mountain, hilly/rolling, urban<br />
fringe - and found that clear preferences for woodland/forest views were really<br />
only to be found in urban fringe settings.<br />
<strong>The</strong> study estimated an annual willingness to pay of £268.79 amounting to a<br />
capitalised (note: in perpetuity) value of £7,680 per urban fringe property with a<br />
woodland view. This approach provides values significantly higher than the Eftec<br />
work.<br />
Community cohesion<br />
Very little data is currently available for monetising the economic value of <strong>green</strong><br />
<strong>infrastructure</strong>. It does point to some evidence linking increased community<br />
cohesion to reduced levels of crime.<br />
Monetising community cohesion and promoting the social inclusion benefits that<br />
good quality <strong>green</strong> <strong>infrastructure</strong> can offer is problematic, with the evidence base<br />
largely qualitative.<br />
MONETISING<br />
Landscape/visual amenity<br />
Work by Eftec for the Department of Communities and Local Government 36<br />
brought together 47 studies on the externalities* associated with undeveloped<br />
land. <strong>The</strong> study does not systematically isolate landscape from other benefits -<br />
such as recreation, ecology and tranquillity - for each of the land types<br />
considered, but it does have some useful values:<br />
<br />
<br />
<br />
£54,000 per hectare per year for an urban park<br />
£2,700 per hectare per year for urban fringe forestry<br />
£889 per hectare per year for urban fringe - <strong>green</strong>belt.<br />
<strong>The</strong>se figures include recreation benefits, but explicitly exclude ‘functional’<br />
benefits – climate control, water management and so on.<br />
A study 37 for the Forestry Commission looked at a range of ‘non-market’ benefits<br />
including recreation, landscape amenity, biodiversity, carbon sequestration,<br />
pollution absorption, water supply and quality.<br />
For landscape amenity, a survey of over 400 residents was done across England,<br />
Scotland and Wales to estimate the value of woodland views from properties and<br />
on journeys - based on willingness to pay. It explored the value of woodlands and<br />
32
Building natural value for sustainable economic development: the <strong>green</strong> <strong>infrastructure</strong> <strong>valuation</strong> <strong>toolkit</strong> <strong>user</strong> <strong>guide</strong><br />
TOOLS AVAILABLE IN THE CALCULATOR<br />
KEY EVIDENCE AND SOURCES<br />
Benefit valued Input data Tool basis<br />
Tool 3.1: Willingness to pay<br />
for view of urban <strong>green</strong><br />
space [ Quantification and<br />
monetisation require further<br />
research]<br />
Market Values<br />
N/A<br />
Scientific research<br />
N/A<br />
Benefit transfer values<br />
Tool 3.2: Increase in<br />
volunteering [/<br />
Quantification and<br />
monetisation require<br />
bespoke appraisal]<br />
Volunteering<br />
hours/organisations formed<br />
Qualitative benefit, no<br />
generally applicable<br />
monetisation tool other than<br />
monetisation of volunteer<br />
input (accepted by some<br />
funders)<br />
Urban core (public space, city park)<br />
£54,000/ha/yr<br />
Urban fringe (<strong>green</strong> belt) £889/ha/yr<br />
Urban fringe (forested land) £2,700 /ha/yr<br />
Rural (forested, amenity) £6,626 /ha/yr<br />
Natural and semi-natural land (wetlands)<br />
£6,616 ha/yr<br />
Agricultural land (extensive) £3,150 /ha/yr;<br />
Agricultural land (intensive), £103 /ha/yr<br />
Eftec (2005)<br />
£268.79 per household with a view of <strong>green</strong><br />
space including woodland per year (2003<br />
price base).<br />
Updating by Consumer Price Index uplift to<br />
2010 prices, this would equal £308.03<br />
Capitalised per household: £7,680 (2003)<br />
(in perpetuity), updated to 2010 prices<br />
£8,800.<br />
Note: Capitalised benefit over 10-year<br />
period = £2,557, over 20-year period =<br />
£4,374<br />
<strong>The</strong> social and environmental benefits of<br />
forests in Great Britain, Kenneth G. Willis,<br />
Guy Garrod, Riccardo Scarpa, Neil Powe,<br />
Andrew Lovett, Ian J. Bateman, Nick<br />
Hanley, and Douglas C. Macmillan, 2003<br />
33
Building natural value for sustainable economic development: the <strong>green</strong> <strong>infrastructure</strong> <strong>valuation</strong> <strong>toolkit</strong> <strong>user</strong> <strong>guide</strong><br />
KNOWLEDGE GAPS<br />
<strong>The</strong>re is some evidence, from CABE and others, linking investment in public<br />
realm generally to overall quality of place, but no attempts have been made to do<br />
a similar task for <strong>green</strong> <strong>infrastructure</strong>.<br />
<strong>The</strong>re is much work to be done to value to the community cohesion benefits from<br />
<strong>green</strong> <strong>infrastructure</strong> investment. Research being commissioned by Greenspace<br />
Scotland ‘Greenspace is good – so prove it!’ appears to offer potential. This will<br />
be based on case study evidence, but is a two-year research program<br />
32<br />
Residential futures, 2009<br />
33<br />
CABE, Urban <strong>green</strong> nation, 2009<br />
34<br />
ECOTEC, <strong>The</strong> public and business case for investing in <strong>green</strong> <strong>infrastructure</strong> and a review<br />
of the underpinning evidence, 2008<br />
35<br />
Health Council of the Netherlands and Dutch Advisory Council for Research on Spatial<br />
Planning Nature and the Environment. Nature and health: the influence of nature on social,<br />
psychological and physical well-being, 2004.<br />
36<br />
Eftec, Valuing the external benefits of undeveloped land, 2005<br />
37<br />
Willis, Garrod et al, <strong>The</strong> social and environmental benefits of forests in Great Britain,<br />
2003<br />
34
Building natural value for sustainable economic development: the <strong>green</strong> <strong>infrastructure</strong> <strong>valuation</strong> <strong>toolkit</strong> <strong>user</strong> <strong>guide</strong><br />
4 Health and wellbeing<br />
Green <strong>infrastructure</strong> improves air quality, reduces stress levels and provides<br />
opportunities for formal and informal physical activity and recreation.<br />
Relevant types of <strong>green</strong> spaces and features – potentially all <strong>green</strong> <strong>infrastructure</strong>,<br />
including:<br />
<br />
<br />
<br />
<br />
<br />
<br />
<br />
amenity <strong>green</strong> space<br />
cycling routes<br />
grasslands and heathlands<br />
open countryside<br />
outdoor sports facilities<br />
parks<br />
woodland.<br />
WHAT THE EVIDENCE SHOWS<br />
Green <strong>infrastructure</strong> provides health and wellbeing benefits. <strong>The</strong>se can be<br />
broadly classified into three areas:<br />
<br />
<br />
<br />
providing opportunities for exercise<br />
helping to reduce stress levels and improving mental health<br />
contributing to improved air quality, and as such to the reduced<br />
incidence of respiratory illness.<br />
A fourth benefit area, with studies dating back to the 1980s is the impact of <strong>green</strong><br />
space on shortening patient recovery time and therefore reducing costs<br />
associated with long hospital stays 62 .<br />
<strong>The</strong>re is a growing recognition amongst health authorities of the links between<br />
increased opportunities for exercise and health benefits. Significant recent<br />
changes include:<br />
<br />
<br />
policy changes within the Department of Health to further promote the<br />
benefits of increased exercise 63<br />
local primary care trusts (PCTs) actively promoting programmes such<br />
as health walks and <strong>green</strong>/blue gyms.<br />
Physical activity and reducing obesity are now PCT priorities 64 , though only a<br />
minority of PCTs are actively considering investment in <strong>green</strong> <strong>infrastructure</strong><br />
projects. For the majority, the benefit of <strong>green</strong> space investment remains<br />
unfamiliar territory which will require cultural change, although there is confidence<br />
that this is slowly changing.<br />
<strong>The</strong>re is much work in the UK and overseas on the impact of <strong>green</strong> space on<br />
general health and specific health conditions, and the evidence base is building.<br />
This should lead to new <strong>valuation</strong> approaches and tools.<br />
Opportunities for exercise<br />
Local, accessible <strong>green</strong> space provides opportunities for exercise, increasing<br />
overall levels of fitness and reducing obesity.<br />
work by Giles-Corti 65 suggests that open spaces with a range of<br />
attractive attributes - such as trees, lakes, landscaped features -<br />
encourage higher levels of walking<br />
<br />
Benefits of exercise<br />
the National Institute for Health and Clinical Excellence (NICE) has<br />
published formal guidance on promoting and creating both built and<br />
natural environments that encourage and support physical activity. 66<br />
Regular physical activity reduces the risk of:<br />
<br />
<br />
<br />
<br />
<br />
cardiovascular disease<br />
non-insulin dependent diabetes mellitus<br />
osteoarthritis<br />
some forms of cancer - 2,500 colon cancer deaths are attributed to<br />
inactivity 67<br />
obesity.<br />
Despite the well-recognised benefits of regular physical activity, in 2008 only 39<br />
per cent of men and 29 per cent of women in England met the public health<br />
recommendation of at least 30 minutes of moderate intensity physical activity for<br />
five days per week. That amount of activity – which can take place in short bursts<br />
or by walking two miles relatively briskly – is enough to expend 200 calories per<br />
day. This means 27 million people in England are not active enough to benefit<br />
their health.<br />
Costs of physical inactivity<br />
Considerable research has been done in the US by the Center for Disease<br />
Control and Prevention (CDC) on the cost of additional healthcare needs due to<br />
inactivity. <strong>The</strong> graphs show the difference in the annual medical costs between<br />
active and inactive women - aged 45 or older - and how this gap escalates with<br />
increasing age. <strong>The</strong> second shows a representation of this for all population<br />
groups.<br />
35
Building natural value for sustainable economic development: the <strong>green</strong> <strong>infrastructure</strong> <strong>valuation</strong> <strong>toolkit</strong> <strong>user</strong> <strong>guide</strong><br />
Figure 10: Healthcare cost and physical inactivity<br />
Source: Centers for Disease Control and Prevention. Promoting active lifestyles among<br />
older adults. National Center for Chronic Disease Prevention and Health Promotion.<br />
Nutrition and Physical Activity<br />
Research 68 has found an estimated 35,000 deaths every year in the UK are<br />
directly related to physical inactivity. Two-thirds of these deaths are due to<br />
cardiovascular disease - around 100 deaths a day.<br />
<strong>The</strong> Department of Health’s 2009 Let’s get moving study and various NHS<br />
studies reported the cost of physical inactivity in England at £8.2 billion a year<br />
(2002) 69 . This calculation added the direct costs of healthcare and the indirect<br />
costs, such as earnings lost due to inability to work and premature death. This<br />
model excluded the additional contribution of physical inactivity to obesity, whose<br />
overall cost has been estimated to be £6.6 to £7.4 billion per year.<br />
<strong>The</strong> Let’s get moving report estimated that:<br />
<br />
<br />
<br />
a 10 per cent increase in physical activity in adults would benefit<br />
England, both directly and indirectly, by at least £500 million per year<br />
and would save around 6,000 lives<br />
of this £500 million saving, 17 per cent was attributable to direct health<br />
costs<br />
the direct health saving for a 10 per cent increase in physical activity<br />
would be £85 million per year.<br />
Let’s get moving also estimated direct costs to the UK healthcare system for<br />
<br />
Coronary heart disease (CHD). This is the single most common<br />
cause of death in the UK, costing the healthcare system around £3.5<br />
billion in 2003. Studies show that regular exercise halves the risk of<br />
heart disease.<br />
<br />
<br />
Stroke care. This costs the NHS about £2.8 billion per year. For each<br />
individual who has a stroke in the UK, the cost to the NHS is £15,000<br />
over five years.<br />
Diabetes. <strong>The</strong>re are currently around 2.1 million people in the UK<br />
diagnosed with diabetes. <strong>The</strong> treatment of diabetes and its<br />
complications costs the NHS 5 per cent of its budget - £3.5 billion per<br />
year, equating to £1,666 per person. <strong>The</strong> concern is that if current<br />
trends in obesity levels are not reversed then diabetes health costs will<br />
escalate – by an estimated 15 per cent over the next 20 years.<br />
Benefits of <strong>green</strong> space<br />
Current goals set by government focus on increasing physical activity by helping<br />
two million more adults to be more physically active by the year 2012. 70<br />
An important step in developing a tool to assess the health benefits of investing in<br />
<strong>green</strong> space is to understand the relationship between <strong>green</strong> assets and<br />
participation in physical activity. <strong>The</strong> difficulty is that the evidence to quantify<br />
relationship between access to <strong>green</strong> space and increased levels of physical<br />
activity is limited..<br />
US-based evidence by Cohen et al (2007) suggests that park use is positively<br />
associated with people living within 1 mile of the park 71 . People living within 1<br />
mile were four times more likely to visit the park once a week or more, and to take<br />
38 per cent more exercise on average in a week than those living further away.<br />
During 2009, Natural England commissioned two studies by the Universities of<br />
Bristol and East Anglia looking at the association between access to <strong>green</strong> space,<br />
frequency of use, physical activity levels, and the probability of being overweight<br />
or obese 72 . Key findings were:<br />
<br />
<br />
<br />
55 per cent of people within Bristol live with 300 metres of some form<br />
of <strong>green</strong> space<br />
a third of respondents used <strong>green</strong> spaces at least weekly<br />
frequency of <strong>green</strong> space use declined with increasing age and<br />
worsening levels of deprivation.<br />
<strong>The</strong> researchers controlled for neighbourhood deprivation, and concluded that<br />
people who perceive easy access to safe <strong>green</strong> spaces report higher <strong>green</strong><br />
space use, more regular physical activity and lower risk of obesity - whatever the<br />
quality of the local area.<br />
However, the research does not provide a mechanism for extrapolating the<br />
impact of creating or improving <strong>green</strong> space on the level of physical activity in the<br />
local population.<br />
36
Building natural value for sustainable economic development: the <strong>green</strong> <strong>infrastructure</strong> <strong>valuation</strong> <strong>toolkit</strong> <strong>user</strong> <strong>guide</strong><br />
Research in Holland has struggled to find support for a positive relationship<br />
between the amount of local <strong>green</strong> space and levels of physical activity 73 ,<br />
although this contrasts with the bulk of studies done in the US and Australia.<br />
Further work appears to be needed in this area to obtain a <strong>valuation</strong> tool.<br />
Reducing stress levels and improving mental health<br />
Regular, physical activity is also associated with reduced risk of depression and<br />
improved mental wellbeing. A number of theories link the presence of nature to<br />
good mental health and wellbeing – relating to the ability of natural and <strong>green</strong><br />
spaces to foster relaxation, reduction of stress and restoration. Some refer to the<br />
‘Biophilia effect’ originally proposed by Wilson (1984) which linked human<br />
wellbeing to close contact with nature. 74<br />
Professor Jules Pretty, Centre for Environment and Society at the University of<br />
Essex analysed responses from 1,252 people - of different ages, genders and<br />
mental health status - drawn from 10 existing studies in the UK. <strong>The</strong> analysis<br />
showed that activity in the presence of nature led to mental and physical health<br />
improvements, concluding that as little as five minutes’ exercise in a park,<br />
working in a backyard garden, on a nature trail, or other <strong>green</strong> space will benefit<br />
mental health 75 .<br />
<strong>The</strong> results of a Swedish study 76 indicate that city landscape planning may affect<br />
the health of town-dwellers, concluding that the more time people spend in<br />
outdoor <strong>green</strong> spaces, the less stressed they feel:<br />
<br />
<br />
<br />
<br />
Costs of stress<br />
statistically significant relationships were found between the use of<br />
urban open <strong>green</strong> spaces and self-reported experiences of stress –<br />
regardless of the informant's age, sex and socio-economic status.<br />
the more often a person visits urban open <strong>green</strong> spaces, the less often<br />
he or she will report stress-related illnesses.<br />
the same pattern was shown when time spent per week in urban open<br />
<strong>green</strong> spaces was measured<br />
distance to urban <strong>green</strong> spaces is associated with amount of use - see<br />
research on <strong>green</strong> space usage.<br />
Research undertaken by the Kings Fund in 2008 assessed the direct NHS service<br />
costs and total costs - including lost earnings - of mental health disorders –<br />
excluding dementia. <strong>The</strong> results showed direct costs to the NHS of £7.65 billion<br />
and lost earnings of £26.1 billion, with projections to increase to £8.71 billion and<br />
£28.1 billion - 2007 prices - by 2026.<br />
Figures published by the Health & Safety Executive claim that 6.7 million working<br />
days are lost each year due to the effects of stress. <strong>The</strong> cost to society is<br />
estimated to be in the region of £3.8 billion per year.<br />
However, further work is needed in this area to obtain a <strong>valuation</strong> tool.<br />
Improved air quality<br />
Green <strong>infrastructure</strong>, particularly trees, can filter, trap and lock in airborne<br />
pollutants.<br />
Increased levels of fine particles in the air are increasingly being linked to health<br />
hazards such as heart disease, respiratory illnesses like asthma and the<br />
incidence of lung cancer. Much research focuses on particulate matter of less<br />
than 10 micrometres (PM 10) which presents the greatest health risk, and is the<br />
subject of European Air Quality targets.<br />
However, trees remove a wide range of pollutants including ozone, nitrogen<br />
dioxide, carbon monoxide and sulphur dioxide as well as PM 10 particulates and of<br />
course carbon dioxide.<br />
Research led by Professor Nick Hewitt at the Department of Environmental<br />
Science, University of Lancaster differentiated those species with the greatest<br />
capacity to improve air quality - ash, larch, Scots pine, silver birch - from those<br />
species with the potential to worsen air quality - English oak, willow and poplar.<br />
<strong>The</strong> research looked at a regional level at the potential to reduce mortality rates. It<br />
concluded that doubling the tree cover across the West Midlands - currently 8.1<br />
million trees - could reduce premature deaths due to particulates in the air by up<br />
to 140 people per year.<br />
In a smaller study area, Tiwary et al (2009) have modelled PM 10 reduction by<br />
<strong>green</strong> space establishment across a 10 kilometre by 10 kilometre area of the East<br />
London Green Grid. 77 This was based on a scenario of 75 per cent grassland, 20<br />
per cent sycamore maple and 5 per cent Douglas fir. <strong>The</strong> study looked at the<br />
impact on premature mortality and respiratory hospital admissions, estimating<br />
that two deaths and two hospital admissions would be averted each year.<br />
Most of the research has been at the large spatial scale. It does not model the<br />
impact of a smaller number of urban street trees, although Professor Hewitt’s<br />
forthcoming work will look at the effects of city <strong>green</strong>ing on air quality. At the<br />
current time, design of a generally applicable <strong>valuation</strong> tool - other than one<br />
designed at large scale – looks problematic.<br />
37
Building natural value for sustainable economic development: the <strong>green</strong> <strong>infrastructure</strong> <strong>valuation</strong> <strong>toolkit</strong> <strong>user</strong> <strong>guide</strong><br />
QUANTIFYING<br />
Opportunities for exercise and Improving mental health<br />
Benefits can be measured in terms of:<br />
<br />
<br />
increased participation in regular exercise as a result of local <strong>green</strong><br />
<strong>infrastructure</strong> investment<br />
ward/output area population in close proximity to the <strong>green</strong> asset.<br />
<strong>The</strong> weight of evidence is beginning to build around the cost savings that can be<br />
derived from investment in physical activity 78 . For example, 2006 NICE research<br />
suggests “brief interventions for physical activity cost between £20 and £440 per<br />
Quality Adjusted Life Year* – significantly below the £30,000 cost-effective<br />
threshold and therefore represent exceptional value for money”.<br />
<strong>The</strong> closest currently available <strong>valuation</strong> methods appears to be the calculation<br />
tools included in the Department for Transport’s WebTag Guidance Note 3.14.1 79<br />
on the appraisal of walking and cycling projects. This models the number of<br />
preventable deaths using the 2007 World Health Organisation’s Health Economic<br />
Assessment Tool for cycling (HEAT).<br />
This is based on research undertaken by Andersen et al (2000) for the<br />
Copenhagen Heart Study. 80 This found that individuals who cycle for three hours<br />
per week reduce their risk of all-cause mortality – relative risk of death - to 72 per<br />
cent of that of non-cyclists, controlled for other types of physical activity.<br />
Improved air quality<br />
Benefits are measurable at relatively large spatial scales - for example, county,<br />
district, or metropolitan area level. This requires mapping or estimating either the<br />
canopy cover or the number of trees within this spatial area.<br />
It is possible to design a <strong>valuation</strong> tool from established US research - if the<br />
principle of transferring US data to the UK is accepted. This looks at the impact of<br />
improved air quality in a different way - in terms of the cost savings of other<br />
pollutant control measures.<br />
<strong>The</strong> key research in this area is the Chicago Urban Forest Climate Study by the<br />
USDA Forest Service 81 which concluded that the 4.1 million trees across the<br />
metropolitan area of Chicago in 1991 removed:<br />
<br />
<br />
15 tonnes of carbon monoxide<br />
84 tonnes of sulphur dioxide<br />
<br />
<br />
89 tonnes of nitrogen dioxide<br />
191 tonnes of ozone<br />
212 tonnes of PM 10.<br />
MONETISING<br />
Two out of six potential tools are currently functional to monetise some of the<br />
health benefits of <strong>green</strong> <strong>infrastructure</strong>.<br />
Tool 4.2 Reduced mortality from increased walking and cycling<br />
This is based on reductions in all-cause mortality, using the Department for<br />
Transport’s statistical value of a life. <strong>The</strong> tool requires:<br />
<br />
<br />
<br />
an assessment of the <strong>green</strong> <strong>infrastructure</strong> scheme on journey distance<br />
an assumption that 90 per cent of <strong>user</strong>s make a return trip<br />
an assessment of how many trips per year will be made.<br />
Assumptions can also be taken from Sustrans’ 2009 e<strong>valuation</strong> of Cycling<br />
England’s Cycling Demonstration Towns 82 (CDTs) programme. This found a<br />
mean time per week cycled by new cyclists of 60 minutes, based on an average<br />
of 20 minutes per day and 2.9 days per week per person.<br />
<strong>The</strong> study found that cycling rates did not rise immediately, but took a period of<br />
three years to increase. <strong>The</strong> six towns showed an increase of between 10 per<br />
cent and 57 per cent - an average of 27 per cent, or 6.2 per cent each year.<br />
A 1 kilometre journey, being made by an individual 2.9 times per week on<br />
average, would be calculated as follows:<br />
Step 1: Calculate mean distance travelled per year<br />
Mean distance travelled: 1 km<br />
% of <strong>user</strong>s making return trip: 90%<br />
Average days travelled per year 150 days (2.9 average trips per week)<br />
Mean distance travelled per year per cyclist = 1km x (1+90%) x 150 days = 285<br />
km<br />
Step 2: Calculate relative risk for <strong>green</strong> <strong>infrastructure</strong> scheme<br />
Mean distance travelled per year by cyclist in Copenhagen study = 1,620 km<br />
Relative risk of death for cyclists found in Copenhagen study = 72% of that of<br />
non-cyclists<br />
[Note for walking: WebTag advises use of 85%]<br />
<strong>The</strong>refore reduction in relative risk of death found in Copenhagen = 1 - 0.72 =<br />
0.28<br />
38
Building natural value for sustainable economic development: the <strong>green</strong> <strong>infrastructure</strong> <strong>valuation</strong> <strong>toolkit</strong> <strong>user</strong> <strong>guide</strong><br />
<strong>The</strong>refore, estimated reduction in relative risk of death for <strong>green</strong> <strong>infrastructure</strong><br />
scheme = 285/1620 x 0.28 = 0.049<br />
Step 3: Calculate reduced mortality benefit<br />
Mean % of England & Wales population aged 15-64 who die each year from all<br />
causes = 0.00235<br />
Extra cyclists encouraged by <strong>green</strong> asset scheme relative to no intervention case<br />
= Y<br />
(calculated from population within 1,200 m of <strong>green</strong> asset, and in absence of local<br />
survey information, for Ready Reckoner, use finding from Cycling Demonstration<br />
Town (CDT) programme that improved <strong>infrastructure</strong> will increase use by 27%)<br />
Expected deaths in this population = 0.00235 x Y = 0.00235Y<br />
Lives saved per year = 0.00235Y x 0.049<br />
Cost of life (source DFT, 2007 cost) = £1.6m<br />
Reduced mortality benefits (2007 prices) = 0.00235Y x 0.049 x £1.6m<br />
<strong>The</strong> WebTag Guidance indicates that there is currently no specifically applicable<br />
guidance available for walking, although the World Health Organisation intends to<br />
develop a walking-specific model. <strong>The</strong> WebTag Guidance indicates that walking<br />
should provide greater benefits to the average individual over the same distance<br />
travelled, and therefore at least for the time being, the HEAT tool for cycling can<br />
also be applied for walking.<br />
Tool 4.6: Avoided costs for air pollution control measures<br />
<strong>The</strong> Chicago Urban Forest Climate Study by the USDA Forest Service 83 gave<br />
dollar values per metric tonne for preventing the emission of pollutants, based on<br />
‘current control strategies’. It calculated pollution absorption capacity and typical<br />
monetary values down at the level of the individual tree. This ranged from $0.04<br />
per year for small trees to more than $2 per year for large trees. Tool 4.7 is based<br />
on these figures.<br />
CASE STUDY: ERITH MARSHES & BELVEDERE LINKS, LONDON THAMES<br />
GATEWAY<br />
<strong>The</strong> Erith Marshes & Belvedere Links will provide major investment in public<br />
space and will include new access opportunities. Using benefit tool 4.2 it has<br />
been estimated that walking benefits provide NPV of £1.4m over 5 years and<br />
cycling benefits of £0.6m over a similar period.<br />
See Appendix 1 for case study details.<br />
TOOLS AVAILABLE IN THE CALCULATOR<br />
Tools Input data Tool basis<br />
Tool 4.1: Direct savings to the NHS<br />
from improved health of the local<br />
population/reduced obesity levels<br />
from increased levels of physical<br />
activity [ Quantification and<br />
monetisation require further<br />
research]<br />
Tool 4.2: Reduced mortality from<br />
increased walking and cycling<br />
Estimates the reduction in mortality<br />
rates from take-up of moderate<br />
physical exercise through walking or<br />
cycling [ Functional]<br />
Tool 4.3: Health cost savings from<br />
reduction in mental health disorders<br />
[Quantification and monetisation<br />
require further research]<br />
Tool 4.4: Health cost savings from<br />
reduced in-patient stays<br />
[Quantification and monetisation<br />
require further research]<br />
Tool 4.5: Reduced mortality from<br />
respiratory illnesses<br />
Estimates the reduction in mortality<br />
rates from illnesses associated with<br />
particulates in the air<br />
[Quantification and monetisation<br />
require further research]<br />
Tool 4.4 Avoided costs for air<br />
pollution control measures<br />
Estimates savings from not having<br />
to implement other pollution control<br />
measures to prevent emissions or<br />
Estimate of extra<br />
numbers of the local<br />
population who<br />
have taken up<br />
physical exercise<br />
(walking or cycling)<br />
Webtag<br />
Guidance note<br />
3.14.1 outlines<br />
the methodology<br />
for calculating the<br />
number of<br />
preventable<br />
deaths<br />
USDA Forest<br />
Service: Chicago<br />
Urban Forest<br />
Climate Study<br />
39
Building natural value for sustainable economic development: the <strong>green</strong> <strong>infrastructure</strong> <strong>valuation</strong> <strong>toolkit</strong> <strong>user</strong> <strong>guide</strong><br />
remove from the air sulphur dioxide,<br />
carbon monoxide, PM10 captured<br />
by trees [ Functional]<br />
KEY EVIDENCE AND SOURCES<br />
Market values<br />
Cost of life (reduced mortality)<br />
Net cost saved per Quality Adjusted<br />
Life Year gained<br />
DfT: £1.215m – statistical value of a life<br />
(2002 prices)<br />
Webtag 3.14.1 Guidance note (April<br />
2009)<br />
Between £750 - £3,150 (NICE)<br />
Scientific research<br />
University of Lancaster, Professor Nick<br />
Hewitt<br />
USDA Forest Service: Chicago urban<br />
forest climate study<br />
Benefit transfer values<br />
Tool 4.2<br />
Tool 4.4<br />
Statistical value of life as above.<br />
Pollutant control strategies calculating<br />
pollution absorption capacity at typical<br />
monetary values down at the level of<br />
the individual tree (ranging between<br />
$0.04/year for small trees to more than<br />
$2/year for large trees).<br />
40
Building natural value for sustainable economic development: the <strong>green</strong> <strong>infrastructure</strong> <strong>valuation</strong> <strong>toolkit</strong> <strong>user</strong> <strong>guide</strong><br />
KNOWLEDGE GAPS<br />
Opportunities for increased exercise and mental health<br />
Further work with some input from a specialist health economist could allow the<br />
development of tools calculating:<br />
<br />
<br />
<br />
net cost saved to the NHS per Quality Adjusted Life Year<br />
direct savings to the NHS from improved health of the local population<br />
from reduction in mental health disorders<br />
direct savings to the NHS from reduced in-patient stays.<br />
Discussions held with Natural England’s specialist health advisor suggest it will<br />
also be important that the <strong>toolkit</strong> uses appropriate language in the final version of<br />
the tools – for example Quality Adjusted Life Year (QUALY) - so that its credibility<br />
holds with primary care trusts.<br />
Distance to <strong>green</strong> <strong>infrastructure</strong><br />
A significant gap in the research evidence base appears to be the mapping of<br />
increased participation in exercise as a result of local <strong>green</strong> <strong>infrastructure</strong><br />
enhancement, for use within a <strong>valuation</strong> tool.<br />
Grahn and Stigsdotter’s 2003 research review 84 is helpful as it provides usage<br />
data within a local population in terms of distance bands to <strong>green</strong> <strong>infrastructure</strong>.<br />
This is based upon research across nine Swedish cities. It shows that distance to<br />
urban <strong>green</strong> spaces is associated with amount of use, as well as a statistically<br />
significant relationship between the use of urban open <strong>green</strong> space and selfreported<br />
experiences of stress.<br />
Improved air quality<br />
Most of the research that has been undertaken in this area is at large scale, and<br />
for example, does not model the impact of a smaller number of urban street trees.<br />
Professor Hewitt at Lancaster University has indicated that work is soon to get<br />
underway using EPSRC funding by a consortium - ‘Urban Futures’ - to look at the<br />
effects of city <strong>green</strong>ing on air quality. This could potentially offer a project-level<br />
<strong>valuation</strong> tool.<br />
62 Ulrich, View through a window may influence recovery from surgery,<br />
Science 27 April 1984: Vol. 224. no. 4647, pp. 420 – 421<br />
63<br />
Department of Health, Let’s Get Moving, September 2009<br />
64<br />
Department of Health, Vital signs, operational planning guidance 2008/09-2010/11<br />
65<br />
Giles-Corti, B., Broomhall, M. H., Knuiman, M., Collins, C., Douglas, K., Ng, K., Lange, A.<br />
and Donovan, R. J. (2005) Increasing walking: how important is distance to, attractiveness,<br />
and size of public open space American Journal of Preventative Medicine 28 (2 Suppl 2),<br />
169-176.<br />
66<br />
National Institute for Health & Clinical Excellence, Public health guidance note 8, January<br />
2008<br />
67<br />
Cabinet Office Strategy Unit, Health economics model for Game Plan, 2002<br />
68<br />
Allender S, Foster C, Scarborough P & Rayner M, <strong>The</strong> burden of physical activity-related<br />
ill health in the UK. Journal Epidemiology & Community Health, 61:344-8, 2007<br />
69<br />
Department of Culture Media and Sports Strategy Unit, Game Plan: a strategy for<br />
delivering government’s sport and physical activity objectives, 2002<br />
70<br />
DCMS, Before, during and after: making the most of the London 2012 Games (Legacy<br />
Action Plan), June 2008<br />
71<br />
Cohen, D. A., Mckenzie, T. L., Sehgal, A., Williamson, S., Golinelli, D. and Lurie, N.<br />
(2007). Contribution of public parks to physical activity. American Journal of Public Health<br />
97 (3), 509-514.<br />
72<br />
<strong>The</strong> relationship of physical activity and overweight to objectively measured <strong>green</strong> space<br />
accessibility and use, Emma Coombes, Andrew P. Jones, Melvyn Hillsdon, Social Science<br />
& Medicine, Volume 70, Issue 6, March 2010, 816-822<br />
73<br />
Maas, J. Verheij, R. A., Groenewegen, P. P., de Vries, S. and Spreeuwenberg, P. (2006).<br />
Green space, urbanity and health: how strong is the relation Journal of Epidemiology and<br />
Community Health 60 (7), 587-592.<br />
74<br />
Edward O. Wilson, Biophilia, 1984<br />
75<br />
Barton, J and Pretty, J, What is the best dose of nature and <strong>green</strong> exercise for improving<br />
mental health A multi-study analysis. Environmental Science & Technology, 2010<br />
76<br />
Grahn P and Stigsdotter UA. Landscape planning and stress. Urban forestry and urban<br />
<strong>green</strong>ing, 2003<br />
77<br />
Tiwary, A., Sinnett, D., Peachey, C.J., Chalabi, Z., Vardoulakis, S., Fletcher, T., Leonardi,<br />
G., Grundy, C., Azapagic, A. and Hutchings, T.R. (2009). An integrated tool to assess the<br />
role of new planting in PM10 capture and the human health benefits: a case study in<br />
London. Environmental pollution 157, 2645-2653.<br />
41
Building natural value for sustainable economic development: the <strong>green</strong> <strong>infrastructure</strong> <strong>valuation</strong> <strong>toolkit</strong> <strong>user</strong> <strong>guide</strong><br />
78<br />
Matrix Insight on behalf of Health England, Prioritising investments preventative health,<br />
2009 www.healthengland.org/publications/HealthEnglandReportNo5.pdf<br />
79<br />
Guidance on the appraisal of walking and cycling schemes, TAG Unit 3.14.1, January<br />
2010, Department for Transport, Transport Analysis Guidance (TAG)<br />
http://www.dft.gov.uk/webtag/documents/expert/pdf/unit3.14.1.pdf<br />
80<br />
Andersen, L B, Schnohr, P, Schroll, M, Hein, H O, (2000) All-cause mortality associated<br />
with physical activity during leisure time, work, sports, and cycling to work, Archives of<br />
Internal Medicine, Vol. 160, pp1621-1628<br />
81<br />
Nowak, McPherson and Rowntree, Chicago’s urban forest ecosystem: results of the<br />
Chicago urban forest climate project, USDA,1994<br />
82<br />
Aylesbury, Brighton and Hove, Darlington, Derby, Exeter and Lancaster<br />
83<br />
Nowak, McPherson and Rowntree, Chicago’s urban forest ecosystem: results of the<br />
Chicago urban forest climate project, USDA,1994<br />
84<br />
Grahn P and Stigsdotter UA. Landscape planning and stress. Urban forestry and urban<br />
<strong>green</strong>ing, 2003<br />
42
Building natural value for sustainable economic development: the <strong>green</strong> <strong>infrastructure</strong> <strong>valuation</strong> <strong>toolkit</strong> <strong>user</strong> <strong>guide</strong><br />
5 Land and property values<br />
<strong>The</strong> existence of trees and <strong>green</strong> spaces within urban and semi-urban<br />
areas can increase land and property values.<br />
Relevant types of <strong>green</strong> spaces and features – primarily planned urban <strong>green</strong><br />
<strong>infrastructure</strong> aimed at enhancing the urban environment, providing a setting for<br />
investment and improving quality of life.<br />
This includes:<br />
amenity <strong>green</strong> space<br />
civic squares and spaces<br />
allotments<br />
community gardens and urban farms<br />
parks and public gardens<br />
community woodland.<br />
WHAT THE EVIDENCE SHOWS<br />
Land and property values are a useful proxy measure for the relative prosperity<br />
and attractiveness of a community, neighbourhood or place. Property values<br />
reflect a basket of factors – for example transport links, proximity to employment<br />
and local services, as well as environmental quality.<br />
A number of studies have tried to isolate the impact of <strong>green</strong> <strong>infrastructure</strong>,<br />
including trees, parks and community woodland on neighbouring property prices,<br />
particularly in a residential context. <strong>The</strong> magnitude of the suggested impact on<br />
value varies significantly between the studies.<br />
CABE Space’s study 105 on the impact of park improvements on residential values<br />
found that:<br />
• properties near a park were on average 5 to 7 per cent more expensive<br />
than comparable houses further away<br />
• the highest value increase was 34 per cent<br />
• ‘off-park’ impacts - on properties ‘within the vicinity of a park’ - achieved<br />
an average of 7.3 per cent<br />
• ‘on-park’ impacts – on properties overlooking a high quality park – saw<br />
an 11.3 per cent increase.<br />
Work undertaken by Dunse for the Royal Institution of Chartered Surveyors<br />
(RICS) 106 used Aberdeen as a case study area. It found that the overall premium<br />
for a property next to a park, relative to a similar property 450 metres away, is<br />
positive across all house types.<br />
<strong>The</strong> price premium ranges between 0.44 per cent and 19.97 per cent depending<br />
on house and park type. <strong>The</strong> study even suggests that park shape matters -<br />
rectangular or oblong (long/narrow) parks being preferable to square or circular<br />
(short/wide) parks. A rectangular park, for example, would potentially offer greater<br />
opportunities for access – suggesting that accessibility as well as proximity is<br />
important to households. <strong>The</strong> findings are attractive in that they provide a<br />
relationship between house type and park type:<br />
Detached Flat Non-detached<br />
City park 19.97% 7.54% 2.93%<br />
Local park 9.62% 7.92% 9.44%<br />
Open space 2.71% 4.7% 0.44%<br />
US-based research also suggests that distance from the park or open space is<br />
valued as important 107 . Interestingly however, immediate adjacency - within 30<br />
metres - of the park or open space can in some instances attract its own relative<br />
disadvantages. Lutzenhiser and Netusil’s study suggested the largest premiums<br />
lie in the 61-120, 121-180 and 301-365 metre distance bands, respectively.<br />
Relationship between property value and distance from a park:<br />
Distance from park (m.)<br />
< or = 30 meters ns<br />
31 - 120 4.09<br />
121 - 210 2.96<br />
211 - 300 2.28<br />
301 - 400 2.18<br />
401 - 450 1.51<br />
Source: Bolitzer & Netusil, 2000 108<br />
%Change<br />
43
Building natural value for sustainable economic development: the <strong>green</strong> <strong>infrastructure</strong> <strong>valuation</strong> <strong>toolkit</strong> <strong>user</strong> <strong>guide</strong><br />
Inter-relationship between property value, park distance and park type:<br />
% Change:<br />
Distance from park (m.)<br />
Urban park Natural park Specialised<br />
park<br />
< or = 60 meters 2.9 16.9 11<br />
61 - 120 3.1 15.4 8..6<br />
121 - 180 1.8 19.1 15.4<br />
180 - 240 ns 16.9 8.5<br />
241 - 300 ns 13.5 7.4<br />
301 - 365 2.5 12.2 6.9<br />
366 - 450 ns 15 5.8<br />
Source: Lutzenhiser & Netusil, 2001 109<br />
Commercial property values can also benefit from the presence of <strong>green</strong><br />
<strong>infrastructure</strong>. In principle, higher landscape quality will help to make sites and<br />
premises easier to sell or let and help retain occupants.<br />
Some studies suggest that some occupants value landscape quality more highly<br />
than others, to the extent that they are prepared to pay a higher than average<br />
rent for premises located in an area of high landscape quality 110 . This, however<br />
appears to vary from occupant to occupant. A review of the evidence base<br />
suggests that the link between high quality <strong>green</strong> <strong>infrastructure</strong> and up-lifts in<br />
commercial property value is much less clear cut than for residential.<br />
Much appears to depend upon the type of business. High value businesses that<br />
have a choice of location tend to put a higher premium on quality of place than<br />
lower-value businesses.<br />
A good quality public realm can increase the attractiveness of retail centres,<br />
leading to higher commercial retail rents and increased occupancy. Trees, verges<br />
and <strong>green</strong> space can be central to improved public realm, although few studies<br />
have sought to isolate the contribution that this <strong>green</strong> <strong>infrastructure</strong> makes from<br />
other ‘grey’ aspects of public realm enhancement.<br />
QUANTIFYING<br />
Residential land and property uplift<br />
Benefits can be measured in terms of household type and numbers within 450<br />
metres of park/open space.<br />
UpMyStreet.com can be used as a quick reference to define the volume of sales<br />
– for flats, terraced, semi-detached, detached and so on - and the average sale<br />
prices achieved. Depending on whether an existing <strong>green</strong> <strong>infrastructure</strong> asset –<br />
such as a park - is being valued, or whether a new <strong>green</strong> <strong>infrastructure</strong> asset is<br />
being proposed, the findings above can be used to derive:<br />
<br />
<br />
the value premium incorporated within the average property price,<br />
attributable to the existing asset<br />
the uplift premium that could be expected as a result of implementing<br />
the <strong>green</strong> <strong>infrastructure</strong> investment.<br />
Commercial land and property<br />
Extrapolating figures for the economic benefit of <strong>green</strong> <strong>infrastructure</strong> on<br />
commercial land and property values does not appear straightforward. It is likely<br />
that a detailed, bespoke study, consulting prospective investors/developers,<br />
purchasers, tenants or occupiers on their willingness to pay* for <strong>green</strong><br />
enhancements will offer a more robust and meaningful approach.<br />
Note: Where property value uplift can be estimated, it is important to avoid<br />
double counting. To varying degrees, particularly for residential property,<br />
property prices will reflect other <strong>green</strong> <strong>infrastructure</strong> benefit streams - health/air<br />
quality, visual amenity, recreation, quality of place and so on. Care must therefore<br />
be taken in presenting these other benefits alongside potential property price<br />
increases.<br />
MONETISING<br />
Two tools are currently included in the <strong>toolkit</strong>:<br />
Tool 5.1 Residential land and property uplift<br />
This either values the impact of an existing <strong>green</strong> <strong>infrastructure</strong> asset, or<br />
assesses the impact of a proposed <strong>green</strong> <strong>infrastructure</strong> investment<br />
(Potential) Tool 5.2 Commercial land and property uplift<br />
44
Building natural value for sustainable economic development: the <strong>green</strong> <strong>infrastructure</strong> <strong>valuation</strong> <strong>toolkit</strong> <strong>user</strong> <strong>guide</strong><br />
<strong>The</strong> <strong>toolkit</strong> evidence review suggests that the link between high quality <strong>green</strong><br />
<strong>infrastructure</strong> and uplifts in commercial property value is much less clear than for<br />
residential. No generally applicable monetisable tool has emerged at this point.<br />
<strong>The</strong> tool is, however, being retained on the basis that future evidence or studies<br />
may be undertaken in the future.<br />
CASE STUDY: ERITH MARSHES & BELVEDERE LINKS, LONDON THAMES<br />
GATEWAY<br />
<strong>The</strong> Erith Marshes and Belvedere Links project is seeking to deliver improved<br />
access and environmental quality at the interface of open space and a major<br />
employment area. <strong>The</strong> Toolkit has shown that if environmental enhancements<br />
improved land value by only 5%, this would be £75-100k per hectare, based on<br />
current values. Households are expected to benefit from a combined £9.5m uplift<br />
in value.<br />
See Appendix 1 for full details.<br />
45
Building natural value for sustainable economic development: the <strong>green</strong> <strong>infrastructure</strong> <strong>valuation</strong> <strong>toolkit</strong> <strong>user</strong> <strong>guide</strong><br />
TOOLS AVAILABLE IN THE CALCULATOR<br />
Tools Input data Tool basis<br />
Tool 5.1: Residential land and<br />
property uplift [ Functional]<br />
Estimates residential land and<br />
property uplift within 450 metres of<br />
park/open space<br />
Tool 5.2: Commercial land and<br />
property uplift<br />
[Quantification and monetisation<br />
require further research]<br />
Commercial land and property uplift<br />
- requires bespoke willingness to<br />
pay surveys with prospective<br />
investors/developers, purchasers,<br />
tenants or occupiers<br />
KEY EVIDENCE AND SOURCES<br />
Market values<br />
Properties near the park were on<br />
average 5-7% more expensive than<br />
comparable houses further away, with<br />
the highest value increase seen at<br />
34%<br />
Price premium ranges between<br />
0.44% and 19.97% depending on<br />
house and park type<br />
Price premium ranges between 1.8%<br />
and 19.1% depending on distance<br />
and type of <strong>green</strong> space<br />
Benefit transfer values<br />
No. of units and<br />
property types<br />
within 450m of<br />
enhanced <strong>green</strong><br />
<strong>infrastructure</strong><br />
asset<br />
CABE Space<br />
Dunse on behalf of RICS<br />
Various studies –<br />
Dunse (2007) for<br />
the RICS, and work<br />
by Lutzenhiser and<br />
Netusil (2001)<br />
Lutzenhiser and Netusil (2001)<br />
KNOWLEDGE GAPS<br />
Further work is needed to explore whether a generally applicable tool can be<br />
devised for commercial development values associated with <strong>green</strong> assets.<br />
Meta-analysis of existing studies using a regression model* could help<br />
determine how important <strong>green</strong> <strong>infrastructure</strong> is in businesses’ decisions<br />
regarding location.<br />
105 CABE Space, Does money grow on trees, 2005<br />
106 Neil Dunse for RICS, Urban parks, open space and residential property values, 2007<br />
107 Lutzenhiser, M., & Netusil, N.R. (2001). <strong>The</strong> effect of open spaces on a home's sale<br />
price. Contemporary Economic Policy, 19(3), 291-298<br />
108 Bolitzer, B. and Netusil, N (2000) <strong>The</strong> impact of open space on property values In<br />
Portland, Oregon, Journal of Environmental Management 59, pp 185-193.<br />
109 Lutzenhiser, M., & Netusil, N.R. (2001). <strong>The</strong> effect of open spaces on a home's sale<br />
price. Contemporary Economic Policy, 19(3), 291-298.<br />
110 South Yorkshire Forest et al, Creating a setting for investment - economic landscapes,<br />
2008<br />
46
Building natural value for sustainable economic development: the <strong>green</strong> <strong>infrastructure</strong> <strong>valuation</strong> <strong>toolkit</strong> <strong>user</strong> <strong>guide</strong><br />
6 Investment<br />
High environmental quality and the creation and development of <strong>green</strong><br />
spaces and landscaping can encourage and attract high value industry to<br />
a locality or region. Including <strong>green</strong> <strong>infrastructure</strong> in and around a new<br />
estate and buildings can improve functionality, reducing cost and<br />
improving outcomes.<br />
Relevant types of <strong>green</strong> spaces and features – these include:<br />
<br />
<br />
<br />
<br />
all trees, plants and <strong>green</strong> spaces<br />
<strong>green</strong> <strong>infrastructure</strong> within, in close proximity to, or providing gateways<br />
to, investment sites<br />
<strong>green</strong> roofs and SUDS<br />
investment in the public estate, including hospitals and schools.<br />
WHAT THE EVIDENCE SHOWS<br />
Economic growth is influenced by many factors, including:<br />
skills<br />
health<br />
education<br />
transport networks<br />
access to capital<br />
proximity to markets<br />
environmental quality.<br />
<strong>The</strong>re is anecdotal and qualitative evidence that high environmental quality is an<br />
important factor to some businesses. Investing in <strong>green</strong> <strong>infrastructure</strong> can both<br />
improve the quality and the image of an area or site - leading to new investment<br />
and employment.<br />
<strong>The</strong> presence of trees and <strong>green</strong> spaces has also been shown to improve<br />
outcomes, for example improving labour productivity [see section 7] or reducing<br />
patient recovery time - and hence length of stay in hospitals. Well-designed <strong>green</strong><br />
<strong>infrastructure</strong> can reduce running costs, through sustainable water management<br />
[see section 2] and reduced energy costs [see section 1a].<br />
For the purpose of <strong>valuation</strong>, <strong>green</strong> <strong>infrastructure</strong> affects private sector<br />
investment - helping to drive economic growth - in two main ways.<br />
At a wider scale<br />
Green <strong>infrastructure</strong> provides a context for inward investment, enhancing an<br />
area’s image.<br />
Poor perceptions of an area can be a barrier to inward investment and to<br />
recruitment - especially of highly skilled workers 109 . Investment in environmental<br />
improvements has the potential to help improve perceptions:<br />
<br />
<br />
At the site level<br />
33 per cent of new investors in the West Midlands region cited the<br />
attractiveness of the region as an important factor in location<br />
decisions 110<br />
in the South West, over 35 per cent of companies quoted<br />
environmental attractiveness as a key reason for their move 111 .<br />
<strong>The</strong> public realm and <strong>green</strong> <strong>infrastructure</strong> in and around particular investment<br />
sites can help attract and retain companies.<br />
A high quality public realm can create the impression of a prosperous area which<br />
businesses are keen to buy into. <strong>The</strong> fluidity and footloose nature of many<br />
business sectors means that they can relocate if the circumstances are not right.<br />
Typical <strong>green</strong> investments might include tree planting, landscaping and provision<br />
of <strong>green</strong> space. Functional <strong>green</strong> <strong>infrastructure</strong> – like SUDS and <strong>green</strong> roofs –<br />
can be attractive to firms concerned with their environmental impact.<br />
Current research<br />
A literature review by Greenspace Scotland concluded that while there was likely<br />
to be a positive relationship for some investors, there was a need to enhance the<br />
evidence base 112 .<br />
A number of studies however do show a positive relationship between<br />
environmental quality and investment, particularly for high-value, mobile<br />
businesses:<br />
<br />
Research on the benefits of environmental enhancements to<br />
investment showed that the quality of the location had a direct impact<br />
on investment – see the Riverside and Speke Garston investment<br />
projects below.<br />
A CABE and DETR (2001) study 113 examining the value of urban<br />
design found that ‘evidence was offered that the better designed<br />
environments beneficially impacted on the productivity and the health<br />
and satisfaction of the workforce’.<br />
44
Building natural value for sustainable economic development: the <strong>green</strong> <strong>infrastructure</strong> <strong>valuation</strong> <strong>toolkit</strong> <strong>user</strong> <strong>guide</strong><br />
A Groundwork and CLES report 114 found that the environmental<br />
interventions ‘in all the case study areas enhanced the ability of<br />
businesses to attract staff’.<br />
Environmental improvements have been shown to beneficially affect the image of<br />
employment areas:<br />
<br />
<br />
CABE (2005) suggests that there is recognition that high quality <strong>green</strong><br />
spaces can help businesses build a good image and reputation, which<br />
will encourage inward investment and employment into an area. 115<br />
CABE (2001) found that prestige and image were important factors for<br />
occupiers in choosing a place to locate, particularly among UK-based<br />
businesses whose clients visited frequently.<br />
Other research also highlights the positive role of a high quality environment in<br />
image making and urban regeneration.<br />
ASSESSING THE BENEFITS<br />
While available evidence points to a strong relationship between high<br />
environmental quality and inward investment, valuing this impact in isolation from<br />
other factors is difficult.<br />
At a wider scale, interventions intended to attract inward investment are likely to<br />
focus on tackling poor perception of an area, that might be associated with its<br />
industrial legacy and deteriorated environmental condition, for example.<br />
<br />
<br />
Where the need to address poor environmental quality is assessed as<br />
significant - for example as evidenced through baseline quality of life<br />
surveys or inward investor surveys - comprehensive <strong>green</strong><br />
<strong>infrastructure</strong> interventions have the potential to make a high impact.<br />
Where the survey evidence is less supportive of the need for<br />
investment and/or partial limited <strong>green</strong> <strong>infrastructure</strong> improvements are<br />
being proposed, the likelihood of influencing inward investment<br />
decisions will be lower.<br />
At the site level, where the <strong>green</strong> <strong>infrastructure</strong> intervention is comprehensive<br />
and the end <strong>user</strong>s are in sectors and product areas known to value the<br />
surrounding environmental quality, the impact is likely to be high.<br />
Table 1 summarises the conditions and factors to consider, in order to assess the<br />
level of impact (high / medium / low) that <strong>green</strong> <strong>infrastructure</strong> improvements are<br />
likely to have on inward investment.<br />
Table 1: Impact of <strong>green</strong> <strong>infrastructure</strong> improvements on inward investment<br />
Impact of<br />
improvements<br />
Scale of<br />
improvements<br />
Area-wide<br />
Site-based<br />
QUANTIFYING<br />
High Medium Low<br />
High relative<br />
assessment of<br />
need<br />
Comprehensive<br />
range of <strong>green</strong><br />
<strong>infrastructure</strong><br />
Target sectors in<br />
high value,<br />
knowledge<br />
industries and<br />
with strong<br />
environmental<br />
market linkages<br />
Comprehensive<br />
range of <strong>green</strong><br />
<strong>infrastructure</strong><br />
Medium relative<br />
assessment of need<br />
Broader mix of<br />
<strong>green</strong> <strong>infrastructure</strong><br />
solutions<br />
Higher value added<br />
activities<br />
(professional<br />
services etc)<br />
Broader mix of<br />
<strong>green</strong> <strong>infrastructure</strong><br />
solutions<br />
Low relative<br />
assessment of<br />
need.<br />
Smaller area and<br />
partial <strong>green</strong><br />
<strong>infrastructure</strong><br />
intervention<br />
General business<br />
and industry use<br />
Partial <strong>green</strong><br />
<strong>infrastructure</strong><br />
intervention<br />
<strong>The</strong> first step in assessing the economic value of <strong>green</strong> <strong>infrastructure</strong> in relation<br />
to inward investment is to identify whether the investment context is:<br />
a general investment at a wide scale, or<br />
an area-based project focused on a particular development site.<br />
Wider scale investment<br />
<strong>The</strong> objective for investing in <strong>green</strong> <strong>infrastructure</strong> is likely to be to influence<br />
perceptions – with the aim of over the longer term changing behaviours - for<br />
example attracting higher value-added jobs and skills.<br />
<strong>The</strong> benefits can be assessed through perception surveys - a baseline can be<br />
set and changes examined over time.<br />
45
Building natural value for sustainable economic development: the <strong>green</strong> <strong>infrastructure</strong> <strong>valuation</strong> <strong>toolkit</strong> <strong>user</strong> <strong>guide</strong><br />
Area-based projects<br />
Where <strong>green</strong> <strong>infrastructure</strong> is integrated into an area master plan or a strategic<br />
investment site, the approach to measuring the benefit can be more specific.<br />
At the outset of the project, public realm - including <strong>green</strong> <strong>infrastructure</strong><br />
investment - will be looked at in the context of:<br />
<br />
<br />
the target end-<strong>user</strong> requirements<br />
best practice or minimum standards.<br />
This process implicitly makes a judgement about the importance of, and<br />
willingness to pay* for, a high quality environment.<br />
This can be supported through investor and end-<strong>user</strong> interviews or expert<br />
opinion to gauge the relative importance of the <strong>green</strong> <strong>infrastructure</strong> proposed for<br />
the site to the inward investment. <strong>The</strong> value may include:<br />
<br />
<br />
<br />
whether the target firms were achieved<br />
higher rental premiums<br />
occupancy levels.<br />
For example, a review by Whitehead 116 found that in response to urban quality<br />
improvements, office rents increased by 15 to 35 per cent, with a mean uplift of<br />
24 per cent.<br />
Some examples of developments where the quality of the environment was<br />
viewed as central to the success of the development include:<br />
<br />
Riverside Park Industrial Estate Middlesbrough: investment in the<br />
<strong>green</strong> <strong>infrastructure</strong> of the park created a setting for stimulating<br />
business growth and investment. <strong>The</strong> redeveloped site attracted new,<br />
high profile, occupants, and saw occupancy grow from 40 per cent to<br />
78 per cent. It levered over £1 million of private investment 117 .<br />
MONETISING<br />
It is not currently possible to provide a tool which can value the impact of <strong>green</strong><br />
<strong>infrastructure</strong> on attracting investment. However, further analysis from existing<br />
case study material could provide the basis for a monetising tool (See Knowledge<br />
Gaps below).<br />
CASE STUDY: LIVERPOOL KNOWLEDGE QUARTER<br />
Liverpool Knowledge Quarter is comprises the area of the City Centre where<br />
Liverpool’s knowledge economy is focused, and includes three Universities, both<br />
Cathedrals, Lime Street Station and a major teaching hospital. Partners are<br />
seeking to increase the number of high value jobs in conjunction with a<br />
programme of enhance <strong>green</strong> <strong>infrastructure</strong> and improved public realm.<br />
Application of the <strong>toolkit</strong> has shown that investment and enhancement of <strong>green</strong><br />
space could help secure 3.5% - 4.6% annual GVA growth rate over the next 10<br />
years – or 5,600-8,000 jobs<br />
See Appendix 1 for full details of the case study<br />
<br />
Speke–Garston<br />
redevelopment: this study examined the<br />
importance of the £8 million environmental programme within the £100<br />
million Speke–Garston redevelopment to the decision of companies to<br />
invest in the area. Five out of seven investors interviewed stated that<br />
the improvements were an important element in their overall location<br />
assessment 118 .<br />
46
Building natural value for sustainable economic development: the <strong>green</strong> <strong>infrastructure</strong> <strong>valuation</strong> <strong>toolkit</strong> <strong>user</strong> <strong>guide</strong><br />
TOOLS AVAILABLE IN THE CALCULATOR<br />
Tools Input data Tool basis<br />
Tool 6.1: Private sector<br />
investment levered<br />
[Quantification and<br />
monetisation require<br />
further research]<br />
Estimate of the level of<br />
private sector<br />
investment levered<br />
Tool 6.2: Employment<br />
creation<br />
[Quantification and<br />
monetisation require<br />
further research]<br />
Estimates site<br />
employment capacity<br />
and employment based<br />
gross value added<br />
(GVA) that can be<br />
attributed to the<br />
presence of high quality<br />
<strong>green</strong> <strong>infrastructure</strong><br />
Tool 6.3: Image<br />
enhancement<br />
[Quantification and<br />
monetisation require<br />
further research]<br />
No generally applicable<br />
monetisable tool, but<br />
anecdotally, high<br />
quality environment has<br />
been reported to<br />
influence location<br />
decision-making<br />
Number of companies<br />
expected to occupy a<br />
site where a <strong>green</strong><br />
<strong>infrastructure</strong> investment<br />
is being made<br />
Estimates of the site’s<br />
capital and/or rental<br />
value with and without<br />
the <strong>green</strong> <strong>infrastructure</strong><br />
investment<br />
Projected employment<br />
numbers and associated<br />
GVA<br />
Scale of <strong>green</strong><br />
<strong>infrastructure</strong> proposed<br />
Views of investors and/or<br />
opinion formers through<br />
a baseline perceptions<br />
survey<br />
Ex-ante survey of importance of<br />
<strong>green</strong> <strong>infrastructure</strong> investment<br />
to development of the site (to<br />
inform attribution)<br />
Development appraisals (expert<br />
opinion on impact of <strong>green</strong><br />
<strong>infrastructure</strong> on values)<br />
Attribution factor (zero to 1)<br />
based on relative importance of<br />
<strong>green</strong> <strong>infrastructure</strong> investment.<br />
It is very unlikely that attribution<br />
of 1 would be applied except<br />
where the development site<br />
concept was being led by <strong>green</strong><br />
<strong>infrastructure</strong> as an attraction<br />
theme. <strong>The</strong> upper level of<br />
attribution is likely to be in the<br />
order of 0.2 (where it is<br />
assessed as being one of 5 key<br />
business location factors).<br />
However, the weighting of the<br />
key location factors should also<br />
be explored to ensure a best<br />
estimate is applied<br />
.<br />
KEY EVIDENCE AND SOURCES<br />
Market values<br />
Property market values<br />
Occupancy rates<br />
Research<br />
Regional development agency<br />
ongoing e<strong>valuation</strong> of similar<br />
investments – for example public<br />
realm<br />
Benefit transfer values<br />
Premium uplifts<br />
Conversion factors<br />
Employment/Gross value added<br />
KNOWLEDGE GAPS<br />
Property agents and developers<br />
Property agents and developers<br />
Regional development agencies and<br />
Homes and Communities Agency<br />
Environmental Valuation Reference<br />
Inventory* (EVRI) database for studies<br />
(in particular British Waterways)<br />
elsewhere and expert opinion (Delphi<br />
techniques)<br />
Office for National Statistics (ONS) &<br />
Regional Observatories<br />
This benefit could be strengthened further with reference to good case studies<br />
which support a link between <strong>green</strong> <strong>infrastructure</strong> investment and inward<br />
investment – for example where investment has been made in business parks<br />
and other inward investment sites.<br />
Care will be needed in extrapolating from other areas, but an indication of<br />
potential investment, types of business attracted and occupancy rates<br />
should be possible to help support outline project proposals.<br />
For example, an e<strong>valuation</strong> of the impact of public realm investment in Torbay<br />
found that the public investment was recognised by businesses as important in<br />
influencing their investment decisions and increased trade 119 . <strong>The</strong> analysis,<br />
based on waterfront business surveys and interviews, was able to attribute on<br />
average some 20 per cent of private sector investment to the waterfront public<br />
investment. Key retailers had noticed increased footfall as a benefit and some 10<br />
per cent of investment was attributed by the evaluators.<br />
47
Building natural value for sustainable economic development: the <strong>green</strong> <strong>infrastructure</strong> <strong>valuation</strong> <strong>toolkit</strong> <strong>user</strong> <strong>guide</strong><br />
It should be possible to provide indicative ranges of benefits from <strong>green</strong><br />
interventions. However, providing a predictive tool is not likely to be possible<br />
without:<br />
specific research to develop the evidence base for <strong>green</strong> <strong>infrastructure</strong><br />
projects<br />
a robust mechanism for isolating the impact of <strong>green</strong> <strong>infrastructure</strong><br />
from other contributing variables [see section 6].<br />
109<br />
Northern Way/Llewelyn Davies Yeang, Quality of place: the North's residential offer,<br />
2006<br />
110<br />
Advantage West Midlands, 2001 cited in Amion, Economic value of <strong>green</strong> <strong>infrastructure</strong>,<br />
2008<br />
111<br />
Advantage West Midlands, 2001 cited in Amion, Economic value of <strong>green</strong> <strong>infrastructure</strong>,<br />
2008<br />
112<br />
Greenspace Scotland, Greenspace and quality of life: a critical literature review, 2008<br />
113<br />
CABE/DETR, <strong>The</strong> value of urban design, 2001<br />
114<br />
CLES and Groundwork, <strong>The</strong> contribution of the local environment to the local economy,<br />
2007<br />
115<br />
CABE, Does money grow on trees, 2005<br />
116<br />
Whitehead, T., Simmonds, D. and Preston, J. (2006). <strong>The</strong> link between urban quality<br />
improvements and economic development. Journal of Environmental Management, 80/1:1-<br />
12.<br />
117 CLES/Groundwork, 2007<br />
118<br />
NWDA, Speke-Garston e<strong>valuation</strong><br />
119<br />
SWRDA, 2006<br />
48
Building natural value for sustainable economic development: the <strong>green</strong> <strong>infrastructure</strong> <strong>valuation</strong> <strong>toolkit</strong> <strong>user</strong> <strong>guide</strong><br />
7 Labour productivity<br />
High quality accessible <strong>green</strong> <strong>infrastructure</strong> can support a more productive<br />
workforce for employers through improved health, stress alleviation and<br />
enhancing motivation or attracting and retaining motivated people.<br />
Relevant types of <strong>green</strong> spaces and features – <strong>green</strong> space, trees and so on in<br />
and around public and commercial premises, including business parks.<br />
WHAT THE EVIDENCE SHOWS<br />
Research suggests that well planned, accessible <strong>green</strong> <strong>infrastructure</strong> can be<br />
expected to have an impact on labour productivity. <strong>The</strong> impacts include:<br />
<br />
<br />
<br />
<br />
physical health improvements – resulting principally from increased<br />
exercise and improved air quality<br />
mental health improvements – from the calming effects of the<br />
presence of trees and <strong>green</strong> spaces, and also from physical exercise<br />
improvements at work - psychologists have noted that when workers<br />
have access to plants and <strong>green</strong> spaces they can be more patient,<br />
better at problem-solving and more productive<br />
a reduction in short-term absenteeism.<br />
<strong>The</strong> first two effects are part of health benefits [see section 4] and are qualitative<br />
benefits. <strong>The</strong> third effect – improvements at work - is a localised benefit derived<br />
by employers who choose to invest in <strong>green</strong>ing the workplace.<br />
US studies show the influence that <strong>green</strong> space can have on people’s<br />
effectiveness and productivity:<br />
<br />
<br />
A 2004 study by <strong>The</strong> Centre for Health Design saw reduced staff<br />
turnover to below 12 per cent – from around 30 per cent - and a 6 per<br />
cent increase in a case study hospital’s market share following <strong>green</strong><br />
<strong>infrastructure</strong> investment.<br />
A 2003 report by <strong>The</strong> California Energy Commission found that<br />
workers in a call centre in Sacramento performed 10 to 25 per cent<br />
better on tests of memory function and recall when they had a view of<br />
vegetation, as opposed to no view.<br />
ASSESSING THE BENEFITS<br />
An assessment can be developed considering:<br />
<br />
<br />
how many individuals in the workplace benefit from the <strong>green</strong><br />
<strong>infrastructure</strong> investment or the existing <strong>green</strong> provisions - scale<br />
considered<br />
how comprehensive the planned <strong>green</strong> investment is or how extensive<br />
the existing <strong>green</strong> <strong>infrastructure</strong> provision is - levels of <strong>green</strong><br />
<strong>infrastructure</strong>.<br />
This enables a qualitative assessment using high, medium and low impact<br />
scores, as proposed in table 2.<br />
<strong>The</strong> scale is more likely to be a spectrum - for example, where a site-level<br />
investment delivers a comprehensive programme, the impact will be higher than<br />
medium. Moreover, working with an individual organisation on a demonstration<br />
project would ultimately have important wider benefits when rolled out across a<br />
number of companies.<br />
Table 2: Impact of <strong>green</strong> <strong>infrastructure</strong> improvements on labour productivity<br />
Scale considered<br />
Levels of <strong>green</strong><br />
<strong>infrastructure</strong><br />
QUANTIFYING<br />
High Medium Low<br />
Several sites One site<br />
One site<br />
Several<br />
Several<br />
One organisation<br />
organisations organisations<br />
Comprehensive Partial Limited or absent<br />
<strong>The</strong> key output is the number of workplace individuals that will benefit from<br />
the proposed <strong>green</strong> <strong>infrastructure</strong> investment. This will require:<br />
<br />
<br />
an assessment of the number of employees in the company, on the<br />
site or across the programme<br />
surveys of workers to build up the evidence base on the perceived<br />
impact of the <strong>green</strong> investment.<br />
More recently, research undertaken in the US has shown a link between<br />
improved <strong>green</strong> space and problem-solving/labour productivity.<br />
49
Building natural value for sustainable economic development: the <strong>green</strong> <strong>infrastructure</strong> <strong>valuation</strong> <strong>toolkit</strong> <strong>user</strong> <strong>guide</strong><br />
MONETISING<br />
In order to estimate the labour productivity benefit of a <strong>green</strong> <strong>infrastructure</strong><br />
investment or asset, two impacts need to be considered:<br />
<br />
<br />
the impact on labour productivity - workers’ effectiveness on the job<br />
the increased profit - as a result of reduced costs of recruitment.<br />
Both impacts enhance overall gross value added (GVA) per firm. However, the<br />
key limitation is the evidence to calibrate both effects:<br />
the evidence shows that the impact on productivity is generally<br />
positive, but it needs to be estimated in terms of higher output per<br />
employee and thus a reduced requirement for labour<br />
the cost-saving benefit needs to be expressed in terms of a<br />
percentage of profit.<br />
CASE STUDY: ROPNER PARK, STOCKTON-ON-TEES<br />
Ropner Park is an existing urban park that has recently undergone extensive<br />
refurbishment and improvement. Use of the recreational value tool has<br />
demonstrated that park <strong>user</strong>s are willing to pay an average of £0.96 per visit.<br />
This is worth £98.8k per annum, or £822k PV (3.5%, 10 years).<br />
See Appendix 1 for full details of the case study.<br />
Better evidence for these two indicators would enable a GVA estimate to be<br />
made.<br />
It does, however, seem possible at this time to assess the reduction in shortterm<br />
absence from work that can result from the improved levels of health of<br />
those who take up physical activity as a result of a walking or cycling intervention.<br />
2003 research by the World Health Organisation (WHO) in the US showed that<br />
physical activity programmes involving 30 minutes of exercise a day reduced<br />
short-term sick leave by between 6 per cent and 32 per cent. 120<br />
In the UK, the average absence of employees is 6.8 days, of which 95 per cent is<br />
accounted for by short-term sick leave. 121 For each employee who takes up<br />
physical exercise for 30 minutes a day, five days a week as a result of a walking<br />
or cycling intervention, the annual benefit to employers is likely to be - on average<br />
- at least 0.4 days gross salary costs (6 per cent of 95 per cent of 6.8 days).<br />
<strong>The</strong>se benefits can be monetised, though it should be noted that these are<br />
business benefits rather than the consumer benefits of improved health.<br />
In order to calculate the benefits, this figure needs to be combined with the<br />
average gross salary costs and the number of affected working people. This<br />
can then be combined with average hours worked per day to generate a gross<br />
salary figure.<br />
50
Building natural value for sustainable economic development: the <strong>green</strong> <strong>infrastructure</strong> <strong>valuation</strong> <strong>toolkit</strong> <strong>user</strong> <strong>guide</strong><br />
TOOLS AVAILABLE IN THE CALCULATOR<br />
KEY EVIDENCE AND SOURCES<br />
Tools Input data Tool basis<br />
Tool 7.1: Savings from<br />
reduced employee<br />
turnover<br />
[Quantification and<br />
monetisation require<br />
further research]<br />
Tool 7.2: Increase in<br />
labour productivity<br />
[Quantification and<br />
monetisation require<br />
further research]<br />
Tool 7.1: Savings from<br />
reduced short-term<br />
absenteeism from work<br />
[ Quantification and<br />
monetisation functional<br />
only for the amount of<br />
work days loss avoided]<br />
Estimates the reduction<br />
in working days lost<br />
and associated<br />
employment-based<br />
GVA<br />
Estimate number of<br />
workforce within a local<br />
population, and<br />
proportion that are likely<br />
to take up moderate<br />
exercise through walking<br />
and cycling<br />
DfT Webtag 3.14.1<br />
Market Values<br />
Reduction in sick days per year –<br />
average short-term sick leave= 6.8<br />
days (UK)<br />
Average gross salary costs<br />
Research<br />
Take-up of moderate physical activity<br />
reducing short-term sick leave by<br />
between 6% and 32% per annum.<br />
Benefit transfer values<br />
KNOWLEDGE GAPS<br />
CBI, 2004, <strong>The</strong> lost billions: 2003 CBI<br />
absence and labour turnover survey<br />
WHO, 2003<br />
While the available evidence suggests a link between <strong>green</strong> space and increased<br />
productivity, further work is needed to provide the basis for a predictive tool.<br />
<strong>The</strong> various studies quoted show improvements in aspects of performance, but<br />
not a direct impact of productivity over a sustained period. Nor do they control for<br />
other external factors. To achieve a usable tool, a study would need to be<br />
designed that:<br />
considered different types of workplace with differing levels of <strong>green</strong><br />
space<br />
controlled for other factors – for example views of cityscapes, other<br />
local amenities/opportunities for recreation<br />
looked at whether the benefits are maintained long-term.<br />
120<br />
World Health Organisation, Effectiveness and economic impact of worksite interventions<br />
to promote physical activity and healthy diet, 2008.<br />
121<br />
CBI, <strong>The</strong> lost billions: 2003 CBI absence and labour turnover survey, 2004<br />
51
Building natural value for sustainable economic development: the <strong>green</strong> <strong>infrastructure</strong> <strong>valuation</strong> <strong>toolkit</strong> <strong>user</strong> <strong>guide</strong><br />
8 Tourism<br />
Green <strong>infrastructure</strong> provides opportunities for tourism<br />
Relevant types of <strong>green</strong> spaces and features - the types of <strong>green</strong> <strong>infrastructure</strong><br />
assets or projects that give rise to tourism benefits include:<br />
<br />
<br />
<br />
<br />
woodlands<br />
access to mountain or moorland<br />
water courses<br />
<strong>green</strong> corridors.<br />
WHAT THE EVIDENCE SHOWS<br />
<strong>The</strong> protection and enhancement of <strong>green</strong> <strong>infrastructure</strong> can help an area<br />
maintain its existing tourism economy and attract new visitors. <strong>The</strong> establishment<br />
or development of a site offering a range of tourist activities can be a significant<br />
attractor of economic activity.<br />
<br />
<br />
<br />
<br />
the National Trust has estimated that 40 per cent of tourism-related<br />
employment is dependent on a high quality environment 122<br />
the environmental economy sustains 26 per cent - or £2.8 billion - of<br />
the North West region’s tourism sector with rural tourism supporting<br />
£0.7 billion<br />
across England over 33 million people make over 2.5 billion trips to<br />
urban <strong>green</strong> spaces 123<br />
US research highlights that parks play an important part in a city’s<br />
tourism economy, although often the number of tourists is not<br />
recorded. 124<br />
Investing in quality <strong>green</strong> space is vital to the health of a sustainable tourism<br />
industry. Green space adds value to tourism destinations and services, improving<br />
the quality of the experience for tourists and increasing income and<br />
employment 125 .<br />
This part of the <strong>toolkit</strong> focuses on the impact of proposed investment on<br />
attracting visitors to an area. By definition, this means attracting people from<br />
outside the target area – whether a local authority area, sub region or region -<br />
who will spend in this area, thus helping grow the local tourism economy. Visits<br />
by local people are considered under recreation and leisure [see section 9].<br />
<strong>The</strong> types of <strong>green</strong> <strong>infrastructure</strong> projects likely to contribute most to the growth of<br />
the tourism economy are those:<br />
<br />
<br />
with a unique appeal in terms of the quality of the environment<br />
that provide a range or critical mass of activities on site, increasing<br />
value-added and on-site expenditure<br />
Projects that attract people from outside the region and overnight visitors will<br />
generate greater off-site expenditure in the local economy.<br />
Examples of sites that have developed strong tourism offerings based around the<br />
quality of their <strong>green</strong> <strong>infrastructure</strong> include:<br />
Yorkshire Dales National Park<br />
A study into the economic benefits of the Yorkshire Dales National Park found<br />
that the tourism economy was worth £235 million - 2004 prices - and that the<br />
landscape, cultural and human heritage were key factors underpinning the<br />
tourism sector 126 .<br />
<strong>The</strong> study quotes the results of a contingent <strong>valuation</strong> exercise which found that<br />
on average households were willing to pay £47 per year - 2004 prices - to enjoy<br />
the public benefits associated with upland areas across the UK 127 .<br />
A study by Eftec in 2006 found that cultural heritage - taken to mean the visual<br />
presence in the landscape of traditional farm buildings - is highly valued. <strong>The</strong><br />
study found a willingness to pay* of between £3 and £11 by households in the<br />
region for a 1 per cent improvement in the attributes of the area’s cultural<br />
heritage.<br />
South West<br />
A National Trust study examined the value of tourism associated with the<br />
conserved landscape in the South West. A survey of visitors leaving the area<br />
asked them to score the extent to which conserved landscape motivated their trip<br />
away from home. <strong>The</strong> average score given was 7.8 out of 10, which was directly<br />
translated into a motivation proportion of 78 per cent. Applying this factor to the<br />
region’s tourism economy volume and value gave 12.6 million trips and £2.3<br />
billion of expenditure motivated by the landscape 128 .<br />
New Forest<br />
<strong>The</strong> New Forest attracts 30 million visitors per year and contributes some £60-70<br />
million annually to the local economy as a result of its use as a recreational<br />
resource.<br />
Oakland County<br />
Oakland County in the US developed a <strong>green</strong> <strong>infrastructure</strong> strategy based<br />
around an interconnected network of open spaces, natural areas and<br />
watercourses. A study of the economic impact found that the county attracted 1.3<br />
million people staying an average of 3.5 nights, generating $177 million of tourism<br />
52
Building natural value for sustainable economic development: the <strong>green</strong> <strong>infrastructure</strong> <strong>valuation</strong> <strong>toolkit</strong> <strong>user</strong> <strong>guide</strong><br />
revenue. Over 40 per cent of the trips involved outdoor recreation and 20 per cent<br />
were water-based activities. 129<br />
ASSESSING THE BENEFITS<br />
Qualitative assessment is based on the overall impact of the proposed investment<br />
on tourism, on a scale of low, medium and high:<br />
<br />
<br />
<br />
low impact - improves the setting for existing tourism use<br />
medium impact - improves access to public space for tourism use<br />
high impact - provides a new tourism resource and/or an integrated<br />
approach to access and enhance an existing resource.<br />
QUANTIFYING<br />
<strong>The</strong> starting point for quantifying the benefit is to understand the demand. In case<br />
the <strong>valuation</strong> is applied to an existing <strong>green</strong> <strong>infrastructure</strong> asset, visitor figures will<br />
most likely be available. If this is not the case, or for assessing the impact of a<br />
proposed <strong>green</strong> <strong>infrastructure</strong> intervention, an estimate of visitors will be needed:<br />
<br />
<br />
often a project sponsor will already have a baseline estimate of visitors<br />
and the potential increase in use<br />
where the project is new, a specific market study may have been done,<br />
looking at the tourism potential.<br />
<strong>The</strong> <strong>toolkit</strong> provides guidance on a number of demand estimate methods,<br />
including:<br />
<br />
<br />
<br />
using a density factor based on the size of the <strong>infrastructure</strong> – for<br />
example the kilometres of footpaths<br />
penetration rates based on population drive-time catchment areas<br />
benefit transfer using tourism density from a similar site.<br />
In estimating the number of visitors, there is a need to make a distinction between<br />
local leisure use by residents, and use by a visitor from outside the area. This will<br />
partly depend on the area of impact for the project – for example regeneration<br />
area, sub-region, or region.<br />
Method 1: Density of use<br />
Where the proposed <strong>green</strong> investment involves a cycleway or footway, it is<br />
possible to estimate the likely level of use based on density values from other<br />
sites or areas.<br />
British Waterways’ economic impact model uses national data on<br />
<br />
density of use for walking and cycling per kilometre<br />
local authority leisure services departments may also have leisure use<br />
data to draw upon<br />
An estimate of visitors is needed - so a deduction for local resident use is<br />
required.<br />
Method 2: Population penetration analysis<br />
This approach estimates the likely use of the <strong>green</strong> <strong>infrastructure</strong> by local<br />
residents, based on taking a percentage of the relevant population - drawing on<br />
household population data. <strong>The</strong> percentage penetration is based on evidence<br />
from other areas or <strong>green</strong> <strong>infrastructure</strong> projects, or a specific leisure use study.<br />
Method 3: Site transfer<br />
This estimates the likely total number of visits based on the experience of other<br />
similar sites. For example, if a particular woodland of 50 hectares is known to<br />
have 25,000 visits per year, the density of use is 500 people per hectare. This<br />
can be applied to your project, based on the scale of the site after adjustment for<br />
the proportion of <strong>user</strong>s from the local area.<br />
MONETISING<br />
In the majority of cases, the economic value of tourism can be estimated by using<br />
market prices based on visitor expenditure surveys or tourism economic models.<br />
This allows estimates of visitor expenditure, gross value added and<br />
associated employment supported to be made.<br />
Figure 11 summarises the steps in estimating the tourism value of a <strong>green</strong><br />
<strong>infrastructure</strong> investment.<br />
Figure 11: Estimating the tourism value of a <strong>green</strong> <strong>infrastructure</strong> investment or<br />
asset<br />
53
Building natural value for sustainable economic development: the <strong>green</strong> <strong>infrastructure</strong> <strong>valuation</strong> <strong>toolkit</strong> <strong>user</strong> <strong>guide</strong><br />
<strong>The</strong> key issue in tourism impact assessments is being able to estimate the<br />
additional number of visitors drawn to an area as a result of the <strong>green</strong><br />
investment and the associated value.<br />
Estimating the additional impact requires a judgement to be made about the<br />
primary purpose of the visit, and the extent to which the visit to the proposed<br />
project displaces activity from somewhere else. Where a project provides a<br />
unique offer to an area, displacement would be expected to be low. If there are<br />
alternative similar activities in the area, it could be that the proposed investment<br />
will simply displace existing tourism expenditure.<br />
Average expenditure per visitor varies depending on the type of visitor, origin and<br />
in particular whether they stay overnight. Using the most appropriate daily<br />
expenditure is therefore important in estimating economic value and impact.<br />
TOOLS AVAILABLE IN THE CALCULATOR<br />
Tools Input data Tool basis<br />
Tool 8.1: Tourism<br />
expenditure [<br />
Functional]<br />
Estimates the volume<br />
and value of tourismrelated<br />
expenditure<br />
Tool 8.2: Employment<br />
supported by tourism<br />
[Quantification and<br />
monetisation require<br />
good project data]<br />
Estimates the number<br />
of jobs supported by<br />
tourism activity and<br />
GVA associated with<br />
employment<br />
Number of tourist visitors<br />
(defined as people from<br />
outside the target area)<br />
Average expenditure per<br />
day<br />
Total additional<br />
expenditure<br />
Average expenditure<br />
required to support one<br />
full-time job in the<br />
tourism economy<br />
Number of jobs<br />
supported in the tourism<br />
economy<br />
Average GVA per<br />
employee in the tourism<br />
sector<br />
Local expenditure<br />
surveys or tourism data<br />
sets such as the<br />
Scarborough Tourism<br />
Economic Activity<br />
Monitor (STEAM)<br />
<strong>The</strong> tool provides<br />
employment conversion<br />
factors to be applied to<br />
expenditure estimates<br />
54
Building natural value for sustainable economic development: the <strong>green</strong> <strong>infrastructure</strong> <strong>valuation</strong> <strong>toolkit</strong> <strong>user</strong> <strong>guide</strong><br />
KEY EVIDENCE AND SOURCES<br />
Market Values<br />
Visitor expenditure profiles<br />
Benefit transfer values<br />
Density of visitors<br />
Conversion factors<br />
Job conversion factors - the<br />
tourism expenditure required to<br />
support one job<br />
Survey data such as the England Leisure Visits<br />
Survey provides estimate of expenditure by type of<br />
use.<br />
Scarborough Tourism Economic Activity Monitor<br />
(STEAM) data provides information on day and<br />
staying visitor expenditure for a variety of spatial<br />
areas.<br />
Local economic partnerships and tourism bodies also<br />
conduct regular visitor expenditure surveys.<br />
It is possible to gather information directly from similar<br />
sites, or use the England Leisure Visits Survey which<br />
provides information on the use of open spaces.<br />
Also several studies in EVRI (Environmental<br />
Valuation Reference Inventory*) on valuing benefits<br />
of national parks.<br />
Various tourism studies that quantify the economic<br />
value of national parks/attractions are available for the<br />
UK, e.g. through local/regional tourism authorities<br />
and/or local authorities.<br />
STEAM data is available for many areas at the<br />
regional, sub-regional and local authority level.<br />
KNOWLEDGE GAPS<br />
<strong>The</strong>re is a considerable amount of research on the economic impact of tourism<br />
and key attractions. This includes work on the tourism value of the environment.<br />
A library of this information would be useful to help make impact estimates more<br />
specific to a <strong>green</strong> <strong>infrastructure</strong> context - by providing better information on<br />
additionality, density of use and average expenditure made by the types of<br />
visitors to <strong>green</strong> <strong>infrastructure</strong>-intensive projects.<br />
122<br />
National Trust, 2004 cited in Amion, Economic value of <strong>green</strong> <strong>infrastructure</strong>, 2008<br />
123<br />
Amion, Economic value of <strong>green</strong> <strong>infrastructure</strong>, 2008<br />
124<br />
Harnik, P and Welle, B Measuring the impact of a city park system, <strong>The</strong> Trust for Public<br />
Land, 2009<br />
125<br />
Sustainable Tourism Partnership quoted in Greenspace for a more successful and<br />
sustainable Scotland, Green Space Scotland, 2009<br />
126<br />
Courtney, P, Gaskell, P, Mills, J, Edwards, R A socio-economic study of grant funded dry<br />
stone walls and farm building restoration in the Yorkshire Dales National Park, CCRU and<br />
ADAS, 2007<br />
127<br />
McVitie, 2005 cited in Courtney, P, Gaskell, P, Mills, J, Edwards, R A socio-economic<br />
study of grant funded dry stone walls and farm building restoration in the Yorkshire Dales<br />
National Park, CCRU and ADAS, 2007<br />
128<br />
National Trust, Valuing our environment: A study on the economic impact of the<br />
conserved landscapes and the National Trust in the South West, 1998<br />
129<br />
Oakland County Planning and Economic Development Services, Impact of Oakland<br />
County’s <strong>green</strong> <strong>infrastructure</strong> on the local economy, 2009<br />
Gross value added (GVA) per<br />
employee<br />
Gross to net conversion factor –<br />
enables the conversion of gross to<br />
net additional impact<br />
<strong>The</strong> Annual Business Inquiry (ABI) data, the Office for<br />
National Statistics’ survey of employment and<br />
financial information provides information on average<br />
GVA per employee by sub-sector. <strong>The</strong> figure for the<br />
hotels and restaurants sector is a reasonable<br />
approximation.<br />
BIS Occasional Paper Number 1 (Research to<br />
improve the assessment of additionality, October<br />
2008) provides information on deadweight,<br />
displacement, and multipliers by types of projects.<br />
For regeneration-type projects (including tourism<br />
projects) the average gross to net ratio was 50%. This<br />
is used as a default value in the tourism tool. Project<br />
appraisers can select alternative gross to net factors<br />
where they have project-specific evidence.<br />
55
Building natural value for sustainable economic development: the <strong>green</strong> <strong>infrastructure</strong> <strong>valuation</strong> <strong>toolkit</strong> <strong>user</strong> <strong>guide</strong><br />
9 Recreation and leisure<br />
Green <strong>infrastructure</strong> provides opportunities for recreation<br />
Relevant types of <strong>green</strong> spaces and features - assets or projects that give rise to<br />
recreational benefits include:<br />
<br />
<br />
<br />
<br />
<br />
<br />
<br />
parks and public gardens<br />
general amenity space<br />
outdoor sports facilities<br />
woodlands<br />
access to mountain or moorland<br />
water courses<br />
<strong>green</strong> corridors.<br />
WHAT THE EVIDENCE SHOWS<br />
Publicly accessible <strong>green</strong> space provides recreational and leisure opportunities<br />
for local residents.<br />
Investment in <strong>green</strong> <strong>infrastructure</strong> can enhance access to natural <strong>green</strong> space<br />
and provide opportunities for various forms of formal and informal recreational<br />
activity. <strong>The</strong>se include:<br />
<br />
<br />
<br />
<br />
<br />
<br />
<br />
<br />
<br />
<br />
hill walking<br />
casual walking<br />
freshwater angling<br />
bird watching<br />
game shooting<br />
cycling<br />
horse riding<br />
golf<br />
gardening<br />
water sports.<br />
In addition, <strong>green</strong> <strong>infrastructure</strong> can be seen as a cultural asset that helps to give<br />
an area a sense of identity 130 .<br />
Each recreational activity has a different degree of reliance upon natural<br />
ecosystems – for example bird watching has a higher reliance than say hill<br />
walking. However, it is likely that enjoyment would decline markedly following any<br />
degradation of the natural environment.<br />
Studies have shown that the value attached to such investment by the public will<br />
vary across different forms of recreation and will be area-specific 131 . It is therefore<br />
important that consideration is given to the applicability of benefit transfer<br />
values.<br />
<strong>The</strong> approach to estimating the monetary value is based on an understanding of:<br />
<br />
<br />
<br />
the scale of the intervention or existing asset - for example kilometres<br />
of cycleways or footpaths provided<br />
its contextual setting - urban or rural<br />
recreational use - for example walking, cycling, or fishing.<br />
An impact has been noted in the following case studies – but these may not be<br />
generally applicable.<br />
National Ridgeway Trail<br />
As with other public rights of way, the public do not pay for the use of national<br />
trails, but they do have an economic value. A survey of <strong>user</strong>s of the National<br />
Ridgeway Trail found that on average walkers were willing to pay £1.85 per visit -<br />
based on an average visit lasting six hours and visiting the trail six times a<br />
year 132 . A similar study found that birdwatchers visiting forests were willing to pay<br />
£8.64 per visit 133 .<br />
Forests<br />
A study into the economic and environmental benefits of forests estimated the<br />
marginal benefit* of visits in the range of £1.66 to £2.75 per recreational visit 134 .<br />
<strong>The</strong> study was based on recreational surveys across seven forests in England<br />
and Wales. <strong>The</strong> total recreational value of the forest system was estimated at<br />
£393 million (2002 prices).<br />
<strong>The</strong> report highlighted that marginal recreational benefits varied according to the<br />
attributes of the forests. <strong>The</strong>se attributes included:<br />
<br />
<br />
<br />
the size of forest<br />
percentage coverage of broadleaves, larch<br />
the presence of a site of special scientific interest (SSSI).<br />
<strong>The</strong> recreational willingness to pay* estimates ranged from £1.10 for Epping<br />
Forest to £3 for Delamere Forest.<br />
Parks<br />
<strong>The</strong> park system of Boston in the US was designed to provide a series of open<br />
places accessible to all. Today across Boston there are 5,040 acres of parkland<br />
space, supporting a wide range of recreational activities.<br />
56
Building natural value for sustainable economic development: the <strong>green</strong> <strong>infrastructure</strong> <strong>valuation</strong> <strong>toolkit</strong> <strong>user</strong> <strong>guide</strong><br />
In a study on the economic benefits of Boston’s parks by the Trust for Public<br />
Land 135 , residents were asked to value their direct use of the open <strong>green</strong> space<br />
for:<br />
<br />
<br />
<br />
general use – such as walking<br />
sports – for example cycling<br />
special uses – for example golf.<br />
<strong>The</strong> study found an average value attributed to each use of $1.9, $3 and $9<br />
respectively (2006 prices).<br />
ASSESSING THE BENEFITS<br />
Qualitative assessment is based on the overall impact of the proposed investment<br />
on recreation, on a scale of low, medium and high:<br />
<br />
<br />
<br />
QUANTIFYING<br />
low impact - improves the setting for existing recreational use<br />
medium impact - improves access to public space for recreational use<br />
high impact - provides an integrated approach to access and the<br />
enhancement of recreational space.<br />
In order to measure the benefit, the starting point is understanding the<br />
relationship between the <strong>green</strong> <strong>infrastructure</strong> investment and the direct leisure<br />
use that it enables. For example, the introduction of a new path or cycleway will<br />
enable recreational use. <strong>The</strong> protection of wildlife or rivers will support uses such<br />
as bird watching or angling.<br />
<strong>The</strong>re are a number of ways to estimate use by residents – two are outlined here.<br />
If a <strong>user</strong> demand assessment has already been done, this can be used to<br />
underpin the benefit assessment tool.<br />
<strong>The</strong> estimate of the total number of <strong>user</strong>s can either estimate an overall number<br />
of <strong>user</strong>s, or break the number down by different types of activity – for example<br />
walking, cycling. Which approach is used will depend on the type of <strong>green</strong> asset<br />
and the level of understanding of the end <strong>user</strong>s.<br />
Method 1<br />
This involves analysis of the number of people in a catchment area - based on<br />
varying distances from the <strong>green</strong> <strong>infrastructure</strong> - and the average frequency of<br />
use.<br />
total demand = total population in catchment x average frequency of use for the<br />
type of activity<br />
Census and other leisure surveys can be used to set an appropriate frequency of<br />
use.<br />
Method 2<br />
An alternative approach is to estimate the population in a catchment area and<br />
apply a participation factor and a frequency factor.<br />
total demand = total population in catchment x participation in recreational activity<br />
x frequency of use<br />
MONETISING<br />
<strong>The</strong> approach to estimating the recreational economic value of a particular <strong>green</strong><br />
project involves:<br />
assessing the expected change in visitors as a result of the project -<br />
based on a visitor demand estimate<br />
<br />
assessing the ‘associated consumer surplus value’ – the willingness to<br />
pay.<br />
As there is often no market price for the recreational service - for example an<br />
entrance fee or permit fee - an appropriate benefit transfer monetary value is<br />
needed to provide a proxy for a persons’ willingness to pay.<br />
A more sophisticated approach is the transfer function method. This enables<br />
the transfer value to take account of the specific context – for example the socioeconomic<br />
characteristics of an area. However, this requires that the study being<br />
drawn upon has provided details on the willingness to pay. Alternatively, for major<br />
<strong>green</strong> investments, a willingness to pay study could be done.<br />
<strong>The</strong>re are a number of key sources that summarise the results of benefit transfer<br />
studies:<br />
<br />
<br />
the most significant database is EVRI (Environmental Valuation<br />
Reference Inventory*) – however it is not always up-to-date<br />
new evidence may come from academic studies and e<strong>valuation</strong>s by<br />
Defra, the National Trust and British Waterways<br />
57
Building natural value for sustainable economic development: the <strong>green</strong> <strong>infrastructure</strong> <strong>valuation</strong> <strong>toolkit</strong> <strong>user</strong> <strong>guide</strong><br />
<br />
guidance on the application of benefit transfer is available from<br />
Defra 136 .<br />
KEY EVIDENCE AND SOURCES<br />
Market values/recreational use<br />
Figure 12 summarises the steps involved in estimating the economic value of<br />
recreational activity enabled through <strong>green</strong> <strong>infrastructure</strong> investment.<br />
Figure 12: Estimating the economic value of recreational activity induced by<br />
<strong>green</strong> <strong>infrastructure</strong><br />
TOOLS AVAILABLE IN THE CALCULATOR<br />
Benefit valued Input data Tool basis<br />
Tool 9.1: Recreational<br />
value [ Functional]<br />
Estimates the<br />
willingness to pay for<br />
various types of<br />
outdoor recreation<br />
Number of local people<br />
using <strong>green</strong><br />
<strong>infrastructure</strong> for<br />
recreational purposes.<br />
Profile of types of activity<br />
enabled by the <strong>green</strong><br />
<strong>infrastructure</strong> asset<br />
A quantitative approach<br />
based primarily on a<br />
non-marketed <strong>valuation</strong><br />
methodology<br />
Leisure use surveys provide details on<br />
population penetration rates and<br />
average expenditure for different<br />
leisure uses.<br />
Census data provides estimates of the<br />
frequency that people take part in<br />
different leisure activities and<br />
participation rates.<br />
Benefit transfer values<br />
Department for Transport (DfT)<br />
provides an estimate of the value of<br />
leisure time to be employed in<br />
transport economic appraisal.<br />
<strong>The</strong> tool uses a selection of values<br />
drawn from EVRI applicable to different<br />
leisure uses.. Examples include (per<br />
trip):<br />
Hill walking = £1.85<br />
Casual walking = £5.59<br />
Freshwater angling = £2.21<br />
Bird watching = £8.64<br />
Game shooting = £1.11<br />
Cycling = £16.37<br />
Horse riding = £15.53<br />
Woodland visit (local up to 10<br />
miles) = £0.90<br />
Rutland Water Nature Preserve<br />
(multiple uses) = £25.50<br />
General park use = £0.96<br />
Use of <strong>green</strong> space = £4.46<br />
-!- Where a general use value* is<br />
used - for example the value for<br />
general use of park space - it is<br />
important not to double count a<br />
specific leisure use - such as cycling.<br />
England Leisure Visits Survey<br />
Results from the Sports and Leisure<br />
Module General Household Survey<br />
2002, National Statistics, 2004<br />
2009 DfT Web Tag guidance sets an<br />
average value of £4.46 per trip.<br />
Environmental Value Reference<br />
Inventory (EVRI) provides a database<br />
of studies.<br />
See also recent work by Jacobs on<br />
behalf of Defra and British Waterways<br />
(2009) on valuing the benefits of<br />
Britain’s inland waterways. This<br />
includes recreational value. Earlier<br />
work by Sheffield Hallam University on<br />
this topic might also be useful.<br />
58
Building natural value for sustainable economic development: the <strong>green</strong> <strong>infrastructure</strong> <strong>valuation</strong> <strong>toolkit</strong> <strong>user</strong> <strong>guide</strong><br />
KNOWLEDGE GAPS<br />
<strong>The</strong> primary issue for estimating recreational values is keeping abreast of new<br />
studies providing up-to-date information or a wider variety of activity and contextspecific<br />
benefit transfer values. <strong>The</strong> Environmental Value Reference Inventory<br />
(EVRI) database is the key repository for studies and is the first port of call.<br />
However, it could be worthwhile for a <strong>green</strong> <strong>infrastructure</strong>-specific filter to be<br />
developed, to aid the identification of relevant information and values.<br />
<strong>The</strong> collection of density information across a range of <strong>green</strong> <strong>infrastructure</strong><br />
projects would be helpful to enable rapid and more robust demand assessments<br />
for a project. <strong>The</strong> frequency of participation in leisure uses is also an area<br />
requiring simplification.<br />
130<br />
AMION, Economic benefits of <strong>green</strong> <strong>infrastructure</strong>, 2008<br />
131<br />
O’Gorman and Bann, Valuing England’s terrestrial ecosystem services, a report to Defra,<br />
2008<br />
132<br />
Bennet, 2003 cited in O’Gorman and Bann, Valuing England’s terrestrial ecosystem<br />
services, a report to Defra, 2008<br />
133<br />
Christie, 2006 cited in O’Gorman and Bann, Valuing England’s terrestrial ecosystem<br />
services, a report to Defra, 2008<br />
134<br />
Forestry Commission, 2003<br />
135<br />
Harnik, P and Welle, B Measuring the impact of a city park system, <strong>The</strong> Trust for Public<br />
Land, 2009<br />
136<br />
Eftec, Valuing environmental impacts: <strong>guide</strong>lines for the use of value transfer, 2010<br />
59
Building natural value for sustainable economic development: the <strong>green</strong> <strong>infrastructure</strong> <strong>valuation</strong> <strong>toolkit</strong> <strong>user</strong> <strong>guide</strong><br />
10 Biodiversity<br />
Investment in <strong>green</strong> <strong>infrastructure</strong> can improve and protect habitats,<br />
provide ecosystem services such as pollination, and support biodiversity<br />
Relevant types of <strong>green</strong> spaces and features – all <strong>green</strong> <strong>infrastructure</strong> supports<br />
biodiversity, but the conservation, enhancement and restoration of biodiversity<br />
should be a key output of <strong>green</strong> <strong>infrastructure</strong> investment:<br />
<br />
<br />
<strong>green</strong> space in towns and cities provides habitat and migration routes,<br />
making the urban area more permeable<br />
designated sites – SSSIs, NNRs, SACs and so on [see table] – are<br />
recognised as having high biodiversity value.<br />
WHAT THE EVIDENCE SHOWS<br />
Investment in <strong>green</strong> <strong>infrastructure</strong> can lead to better management of land,<br />
supporting ecosystem services* and biodiversity.<br />
Biodiversity 137 provides non-use values to individuals within society. <strong>The</strong>se reflect<br />
peoples’ cultural concerns, or concerns about the preservation of particular<br />
habitats or species. <strong>The</strong>se form the main pillar of the <strong>valuation</strong> approach in the<br />
<strong>toolkit</strong>.<br />
Investment in <strong>green</strong> <strong>infrastructure</strong> also contributes to maintaining critical<br />
supporting ecosystem services such as the carbon and water cycles. From these,<br />
direct and indirect benefits are realised, and these are covered in sections 1 and<br />
2 of this <strong>guide</strong>.<br />
Investment in <strong>green</strong> <strong>infrastructure</strong> can help reverse habitat fragmentation and<br />
increase biodiversity. In urban areas, larger sites – urban parks and community<br />
woodland – are most valuable, but smaller sites play a vital role as part of a<br />
patchwork of <strong>green</strong> space through which species can move 138 . Urban trees are<br />
important, offering a range of habitats for insects and birds.<br />
Key factors influencing the value of <strong>green</strong> <strong>infrastructure</strong> for biodiversity are:<br />
<br />
<br />
<br />
the typology - the woodlands, urban forests, ponds, rivers and<br />
riverbanks, parks and gardens, allotments and cemeteries<br />
the quantity/area<br />
proximity of other sites.<br />
A small, isolated site is likely to have lower value than a larger site which forms<br />
part of a mosaic of <strong>green</strong> space.<br />
A study of four urban areas on Merseyside revealed that the greatest influence on<br />
their ecology was the proportion of <strong>green</strong> space, particularly trees. 139 Other<br />
studies 140 have shown the importance of networks of sites, allowing species to<br />
move between and through urbanised areas: this will be increasingly important for<br />
species’ adaptation to climate change.<br />
ASSESSING THE BENEFITS<br />
Many areas in the UK are subject to international, national or local habitat and<br />
biodiversity designations. Investment which improves these sites is likely to have<br />
high value. Designations include:<br />
SAC (Special Area of<br />
Conservation)<br />
International statutory designation -<br />
Natural England<br />
NNR (National Nature Reserve) National statutory designation -<br />
Natural England<br />
SSSI (Site of Special Scientific<br />
Interest)<br />
LWS (Local Wildlife Site)/ BNS<br />
(Biological Notification site)<br />
RIGS (Regionally Important<br />
Geological/Geomorphological<br />
Sites)<br />
LNR (Local Nature Reserve)<br />
National statutory designation -<br />
Natural England<br />
Local non-statutory designation<br />
Local non-statutory designation<br />
Local statutory designation<br />
Other important strategies and targets for biodiversity improvements include:<br />
Ancient Woodlands<br />
UK Biodiversity Action Plan<br />
(BAP) Priority Habitats and<br />
Species<br />
BOA (Biodiversity Opportunity<br />
Areas)<br />
Important networks of habitats<br />
National, non-statutory – Natural<br />
England and Forestry Commission<br />
National – Natural England.<br />
Translated into local action through the<br />
local BAP<br />
Non-statutory, local/regional<br />
Under national planning policy<br />
statement 9, biodiversity and<br />
geological conservation (PPS9)<br />
Even where they are not specially designated, some types of habitat always have<br />
special biodiversity value, including wetlands and lowland forest. Likewise, in<br />
urban areas, street trees and <strong>green</strong> space can be very important locally.<br />
60
Building natural value for sustainable economic development: the <strong>green</strong> <strong>infrastructure</strong> <strong>valuation</strong> <strong>toolkit</strong> <strong>user</strong> <strong>guide</strong><br />
QUANTIFYING<br />
Eftec’s study on undeveloped land 144 includes figures for ‘ecology’<br />
which may be applicable (but care is needed to avoid double-counting<br />
Some quantification of benefits can be linked to national biodiversity targets within<br />
the other benefits included)<br />
the UK Biodiversity Action Plan, translated into local BAP Plans.<br />
• Status – Designation: European site (SAC/SPA), SSSI, Local Wildlife Site,<br />
research undertaken to inform agri-environment policy 145 places a<br />
LNR, Identified Biodiversity Opportunity (from biodiversity opportunities<br />
monetary figure of £906 (1999 prices) per hectare on biodiversity, an<br />
map). With Local Wildlife sites there is a link to NI197 and DCLG guidance<br />
average estimated willingness to pay from a variety of studies.<br />
for local authority monitoring<br />
However, these values depend on how biodiversity is defined.. Values elicited by<br />
• BAP Habitat - contribution to National BAP target (and potentially regional<br />
respondents to willingness to pay surveys will also strongly reflect the extent to<br />
BAP target). Some targets area based on area (Ha) which gives a<br />
which they believe the particular habitat being valued is under threat. If they<br />
quantitative measure<br />
perceive little or no threat, the value they offer is likely to be low. If they are aware<br />
of a real or present danger, then the value is likely to be significantly higher.<br />
• BAP Species contribution – potential for supporting a species from the<br />
BAP list, located within<br />
• Support for protected species – as above for protected species.<br />
• Ecological network contribution – contribution to an identified<br />
Ecological Network/Framework area<br />
• Broad (local) ecological value – potential to develop ways of recognising<br />
the broader ecological value of a proposal in supporting local biodiversity,<br />
including improving access to nature, contact with wildlife and support for<br />
local species.<br />
MONETISING<br />
Biodiversity is generally treated as a non-use value, based on research studies<br />
into individuals’ willingness to pay* to protect and maintain particular habitats or<br />
species - which they may never themselves see.<br />
<strong>The</strong> evidence base is stronger for designated areas – for example national parks,<br />
Natura 2000 sites, SSSIs - than for non-designated sites such as parkland and<br />
other <strong>green</strong> space.<br />
Values for designated areas vary greatly:<br />
Jacobs cites a willingness to pay value of £0.41 to £1.14 per<br />
household per year for preserving or creating individual SSSIs 141<br />
another study estimates a value of £12.29 per person per year for<br />
preservation of the Norfolk Broads. 142<br />
<strong>The</strong>re is less <strong>valuation</strong> evidence for other, non-designated sites:<br />
research on woodland and forestry gives biodiversity values of £0.33<br />
(lowland conifer) to £0.90 (upland native broadleaf) per household per<br />
year for an increase in 12,000 hectares of commercial woodland 143<br />
61
Building natural value for sustainable economic development: the <strong>green</strong> <strong>infrastructure</strong> <strong>valuation</strong> <strong>toolkit</strong> <strong>user</strong> <strong>guide</strong><br />
TOOLS AVAILABLE IN THE CALCULATOR<br />
Benefit valued Input data Tool basis<br />
Tool 10.1: Willingness to pay<br />
for protection or enhancement<br />
of biodiversity<br />
[ Functional]<br />
Type and area of<br />
site.<br />
Accessibility.<br />
Application of benefit<br />
transfer values from<br />
appropriate studies.<br />
(area X appropriate<br />
benefit transfer figure =<br />
value) – but care needed<br />
on application<br />
140 Cabe Space, Does money grow on trees, 2005<br />
141<br />
Jacobs, Valuing England’s terrestrial ecosystem services, 2008<br />
142<br />
Bateman and Langford, Non-<strong>user</strong>s' willingness to pay for a national park, 1997<br />
143<br />
Garrod and Willis, <strong>The</strong> social and environmental benefits of forestry, Forestry<br />
Commission, 2003<br />
144<br />
Eftec, Valuing the external benefits of undeveloped land, 2009<br />
145<br />
MAFF/Defra, Estimating the value of environmental features, 1999<br />
KEY EVIDENCE AND SOURCES<br />
Benefit transfer values<br />
<strong>The</strong>re are a wide range of possible transfer values which could be cited from the<br />
literature. However, there does not appear to be widespread support for the use<br />
of willingness to pay values as a mechanism for valuing biodiversity.<br />
KNOWLEDGE GAPS<br />
<strong>The</strong> main challenge for future work is to extend <strong>valuation</strong> to urban areas. While<br />
there has been research in rural areas to inform national policy on agriculture and<br />
water management, there is little evidence which can be readily applied to urban<br />
biodiversity values.<br />
<strong>The</strong>re is significant ongoing work on trying to understand the relationship between<br />
biodiversity, ecosystem functioning and human wellbeing. As this work evolves,<br />
the <strong>toolkit</strong> should take account of the findings and best practice <strong>valuation</strong><br />
approaches.<br />
137<br />
Jacobs, Valuing England’s terrestrial ecosystem services, 2008<br />
138<br />
Landuse Consultants, <strong>The</strong> environment, economic growth and competitiveness. <strong>The</strong><br />
environment as an economic driver, 2006<br />
139<br />
Cabe Space, Does money grow on trees, 2005<br />
62
Building natural value for sustainable economic development: the <strong>green</strong> <strong>infrastructure</strong> <strong>valuation</strong> <strong>toolkit</strong> <strong>user</strong> <strong>guide</strong><br />
11 Land management<br />
Green <strong>infrastructure</strong> includes land in productive use in the countryside.<br />
Managing this land provides employment opportunities, and investment<br />
to reinstate degraded land - in both urban and rural environments - can<br />
restore ecosystems and reduce land management costs.<br />
Relevant types of <strong>green</strong> spaces and features – all land types, including:<br />
<br />
<br />
<br />
<br />
<br />
<br />
<br />
agricultural land<br />
commercial forestry and woodland<br />
moorland<br />
allotments and community orchards in urban settings<br />
urban <strong>green</strong> space<br />
parkland<br />
country parks and nature reserves.<br />
WHAT THE EVIDENCE SHOWS<br />
<strong>The</strong> <strong>green</strong> <strong>infrastructure</strong> ‘sector’ is a major employer nationally. Agriculture,<br />
hunting, forestry and fishing 146 alone employ some 247,000 people in the UK.<br />
lnvestment can provide new opportunities for agricultural diversification for food<br />
and non-food crops, as well as providing the resource to generate renewable<br />
sources of energy, including growth of biomass and biofuels. Diversification of<br />
agricultural production can also be encouraged to meet local market demand, and<br />
produce added-value, regionally distinctive food and drink.<br />
In an urban context, community assets such as allotments and community<br />
orchards provide opportunities for communities to come together, as well as<br />
providing fresh, locally-sourced produce.<br />
Green <strong>infrastructure</strong> such as urban and country parks and community forest<br />
require ongoing operation and maintenance which supports jobs. A study<br />
commissioned by CABE in 2009 147 estimated that some 122,000 people were<br />
employed in the <strong>green</strong> space sector, including:<br />
<br />
<br />
<br />
<br />
<br />
public parks departments<br />
nature reserves<br />
botanical/zoological gardens<br />
landscape services<br />
architects.<br />
<strong>The</strong> level of employment supported by <strong>green</strong> <strong>infrastructure</strong> can vary greatly<br />
according the land type and use. Maintaining the quality of urban public space<br />
will require greater resource than open moorland. <strong>The</strong> level of public access is<br />
likely to be an important determinant, as will the attitude of the landowner.<br />
Reducing management costs<br />
Green <strong>infrastructure</strong> investment can itself have an impact on long-term<br />
management costs. For example, investment in derelict industrial sites can be an<br />
efficient and effective land remediation strategy. <strong>The</strong> Land Trust has been<br />
managing a number of remediated sites in this way since its establishment of the<br />
Land Restoration Trust in 2005.<br />
Trees can absorb pollutants as part of natural biological processes. Through<br />
repeated felling and removal of the timber the level of contamination can be<br />
reduced, and leaching of pollutants to groundwater lessened 148 . Creation of new<br />
<strong>green</strong> space can provide new habitat, enhancing the value to local wildlife - and<br />
where sites are also publicly accessible, there is new <strong>green</strong> amenity space for the<br />
local community.<br />
Reinstating ecosystems has the potential to reduce management costs. For<br />
example, traditional intensive management strategies can require significant and<br />
costly inputs in the form of nutrients, herbicides and pesticides. Restoring<br />
ecological balance and making land more self-sustaining can reduce the need for<br />
these inputs 149 , though overall production may fall. Likewise, investment to<br />
reinstate natural hydrological systems in upland moorland, through blocking of<br />
drainage channels - ‘grips’ 150 - can deliver downstream benefits. [See also section<br />
2].<br />
QUANTIFYING<br />
A market <strong>valuation</strong> of produce – for example wood, biomass, crops - could be<br />
carried out using current market prices. Sources for this data could be built into<br />
the <strong>toolkit</strong>, but the maintenance task to keep them up-to-date would be<br />
demanding. Likewise, it is possible to view productive land as a commodity itself -<br />
which provides the opportunity for productive use and an income stream,<br />
measured by market value.<br />
A proxy for the value of a particular land use is the employment it sustains. This<br />
is a similar approach to that taken by project assessors in looking at traditional<br />
economic investments, where employment impacts can be an important output.<br />
Based on data from Land Restoration Trust project appraisals for various site end<br />
uses, table 3 gives an indication of the potential direct employment per hectare<br />
for different land uses. <strong>The</strong> figures vary greatly – an urban nature reserve can<br />
require intensive management.<br />
63
Building natural value for sustainable economic development: the <strong>green</strong> <strong>infrastructure</strong> <strong>valuation</strong> <strong>toolkit</strong> <strong>user</strong> <strong>guide</strong><br />
Table 3: Employment supported by <strong>green</strong> <strong>infrastructure</strong> assets<br />
Employment in different land uses<br />
Jobs/hectare<br />
Urban core (public space, city park) 0.026<br />
Urban allotments, community gardens, orchards<br />
Urban fringe (forested land)<br />
Volunteers<br />
No data<br />
Urban fringe (country park/mixed amenity) 0.011<br />
Urban nature reserve 1.53<br />
MONETISING<br />
For productive land, an assessment can be made of the market value of the<br />
products. Again, no market values are provided in the <strong>toolkit</strong> because they would<br />
very quickly become out of date.<br />
Valuing the employment supported by <strong>green</strong> <strong>infrastructure</strong> can be undertaken by<br />
multiplying jobs to average sectoral gross value added values - around £20-<br />
£30,000 per year 151 . For many projects, employment figures will be an integral<br />
part of the project plan, and included in maintenance costs.<br />
TOOLS AVAILABLE IN THE CALCULATOR<br />
Benefit valued Input data Tool<br />
Tool 11.1: Market value<br />
of products<br />
[Quantification and<br />
monetisation require<br />
bespoke appraisal]<br />
Tool 11.2: Employment<br />
–based GVA generated<br />
by land management [<br />
Functional]<br />
Quantity and type of<br />
product (for exmple<br />
crops, biomass, wood<br />
etc)<br />
Market value of products<br />
Actual employment<br />
figures (where known).<br />
Estimated employment<br />
figures (based on table<br />
above).<br />
Gross value added<br />
(GVA) value for jobs by<br />
sector<br />
KEY EVIDENCE AND SOURCES<br />
Market Values<br />
Quantity x market value<br />
Jobs (no) x sectoral GVA<br />
value<br />
Market value of products from the land<br />
Benefit transfer values<br />
Not included here. Current values should be<br />
sourced by project developers.<br />
Employment/hectare of land for different<br />
land uses, including commercial and<br />
publicly-owned.<br />
GVA values for employment in relevant<br />
sectors<br />
64
Building natural value for sustainable economic development: the <strong>green</strong> <strong>infrastructure</strong> <strong>valuation</strong> <strong>toolkit</strong> <strong>user</strong> <strong>guide</strong><br />
KNOWLEDGE GAPS<br />
Further work to develop the range of employment figures by land type/use would<br />
be useful.<br />
146<br />
ONS, Employment in agriculture, hunting, forestry and fishing, 2009<br />
147<br />
CABE, Green space skills 2009: National employer survey findings<br />
148<br />
National Urban Forestry Unit, Trees matter, 2005<br />
149<br />
Town and Country Planning Association, 2004<br />
150<br />
United Utilities Sustainable Catchment Management Programme (SCAMP)<br />
151<br />
Bridge Economics, Environmental economy report for the North West, Environment<br />
Agency, 2006.<br />
<strong>The</strong> environmental economy of the North West was valued at £2.6 billion annual gross<br />
value added, supporting 109,000 jobs, equivalent to gross value added/job of £23,853<br />
65
Building natural value for sustainable economic development: the <strong>green</strong> <strong>infrastructure</strong> <strong>valuation</strong> <strong>toolkit</strong> <strong>user</strong> <strong>guide</strong><br />
Glossary<br />
Mt – million tons<br />
tC – tons of carbon<br />
CO 2e - equivalent carbon dioxide<br />
Discounted cash flow analysis: a way of estimating the value of an investment in<br />
today’s money by adjusting future returns to get their present value.<br />
Discount rate: (*) the rate used to reduce future benefits and costs to their presenttime<br />
equivalent.<br />
Ecosystem approach: (*) a strategy for the integrated management of land, water and<br />
living resources that promotes conservation and sustainable use in an equitable way.<br />
An ecosystem approach is based on the application of appropriate scientific<br />
methodologies focused on levels of biological organization, which encompass the<br />
essential structure, processes, functions and interactions among organisms and their<br />
environment.<br />
Ecosystem services: (*) the goods or services provided by the ecosystem to society.<br />
In order for an ecosystem to provide services to humans, some interaction with, or<br />
demand from, people for the good or service concerned is required.<br />
Environmental Valuation Reference Inventory (EVRI): a comprehensive storehouse<br />
of over 2,000 international studies providing values, methodologies, techniques and<br />
theories on environmental <strong>valuation</strong>. https://www.evri.ca/Global/Splash.aspx<br />
Externalities: (*) uncompensated side effects of human actions. For example, if a<br />
stream is polluted by runoff from agricultural land, the people downstream experience a<br />
negative externality.<br />
Indices of Multiple Deprivation (IMD): composite indices developed by the Office of<br />
National Statistics to identify areas of multiple deprivation. Levels of deprivation are<br />
measured for a number of separate dimensions or 'domains' such as income,<br />
employment, education and health. <strong>The</strong>se dimensions, sometimes referred to as<br />
'domains' are then aggregated to provide an overall measure of multiple deprivation<br />
and each individual area is allocated a deprivation rank and score. <strong>The</strong> indices are<br />
used to help target policies and funding, and reinforce a common goal to improve the<br />
quality of life in disadvantaged communities.<br />
Long run marginal cost: this refers to the cost of providing an additional unit of<br />
service or commodity under the assumption that this requires investment in capacity<br />
expansion. A long run marginal cost for a wastewater treatment company is to have to<br />
build a bigger plant. <strong>The</strong> costs will vary from how fast the demand for water treatment<br />
is growing, how far are existing plants from being at capacity, and so on.<br />
Managed realignment: this is the deliberate process of altering the line of river,<br />
estuary or coastal defences. This can include widening a flood plain, lowering or<br />
moving flood defences, often to create or recreate natural habitats such as salt<br />
marshes and mudflats, which then act as a natural form of flood and storm defence. A<br />
key aspect of this is the goal of establishing more sustainable estuarine, riverine or<br />
coastal forms, better able to deal with natural processes, surge tides and heavy rainfall.<br />
<strong>The</strong> creation of these natural areas also has nature conservation benefits.<br />
Marginal abatement cost: carbon emission reductions usually involve some costs,<br />
often the cost of investing in new technologies or processes. <strong>The</strong> total cost of reducing<br />
emissions is known as the abatement cost. <strong>The</strong> marginal abatement cost refers to the<br />
cost at a given time of eliminating an additional unit of emissions.<br />
Marginal benefit: this is a way to measure change in benefits over the change in<br />
quantity. For example, it could refer to the value of the benefits of an additional<br />
recreational visit for a tourist site.<br />
Natural Economy Northwest (NENW): <strong>The</strong> Natural Economy Northwest £3million, 3<br />
year programme ended in December 2009 – a partnership led by Natural England, the<br />
Northwest Regional Development Agency and SITA Trust. <strong>The</strong> Natural Economy<br />
Northwest team worked with a wide range of partners and stakeholders to reposition<br />
the natural environment within sustainable futures, and to encourage proper<br />
investment in the natural environment by developing a framework for establishing the<br />
economic value of such investment. For further information please see:<br />
www.naturaleconomynorthwest.co.uk<br />
Net additionality: this is the net positive difference that results from economic<br />
development intervention, or any other type of investment.<br />
Net present value (NPV): (**) a calculation used to estimate the value – or net benefit<br />
– over the lifetime of a particular project, often longer-term investments. NPV allows<br />
decision-makers to compare various alternatives on a similar timescale by converting<br />
all options to current pound figures. A project is deemed acceptable if the net present<br />
value is positive over the expected lifetime of the project.<br />
(*) the sum of the present and discounted future flows of net benefits. A discount rate is<br />
used to reduce future benefits and costs to their present time equivalent.<br />
Option value: (*) the value that people place on having the option to enjoy something<br />
in the future, although they may not currently use it.<br />
66
Building natural value for sustainable economic development: the <strong>green</strong> <strong>infrastructure</strong> <strong>valuation</strong> <strong>toolkit</strong> <strong>user</strong> <strong>guide</strong><br />
Quality Adjusted Life Year (QUALY): this provides a way to measure the outcomes<br />
from treatments and other health-influencing activities not only in terms of life<br />
expectancy (increase in length of life) but also in terms of quality of life.<br />
Regression analysis: in statistics, this refers to the techniques for modelling and<br />
analysing several variables and identifying their relationships.<br />
Regression models: are used to predict one variable from one or more other<br />
variables.<br />
Rewetting scheme: this is the deliberate process of elevating the average annual<br />
water table in an area by partially or completely removing the drainage controls<br />
previously put in place.<br />
Total economic value: (*) the sum of the direct use, indirect use, option and non-use<br />
values for a good or service.<br />
Use value: (*) value derived from actual use of a good or service. Uses may include<br />
indirect uses. For example, the buffering impact of upstream forests on downstream<br />
water flows provides an indirect use value of the forest for downstream water <strong>user</strong>s.<br />
Willingness to pay: (*) the amount of money (or goods or services) that a person is<br />
willing to give up to obtain a particular good or service.<br />
Sources:<br />
(*)Environmental Economics Toolkit, United Nations Development Programme – Global<br />
Environment Facility, 2006<br />
(**) Environmental Economics, <strong>The</strong> Essentials, Environmental Literacy Council, 2007<br />
67
Building natural value for sustainable economic development: the <strong>green</strong> <strong>infrastructure</strong> <strong>valuation</strong> <strong>toolkit</strong> <strong>user</strong> <strong>guide</strong><br />
Appendix 1: Case studies<br />
ERITH MARSHES & BELVEDERE LINKS, BELVEDERE, London Thames Gateway<br />
“We watch with interest the evolving concept of the <strong>valuation</strong> <strong>toolkit</strong><br />
for its potential to help in attracting future investment in <strong>green</strong><br />
<strong>infrastructure</strong>.” London Borough of Bexley<br />
Belvedere and the nearby towns of Erith and Thamesmead [in the boroughs of Bexley<br />
and Greenwich] lie in the London Thames Gateway growth area. <strong>The</strong>y are<br />
characterised by a low skill, low wage economy that struggles to sustain a retail and<br />
wider amenity offer. <strong>The</strong> area’s main employment location of Belvedere is blighted by<br />
70ha of vacant or derelict land. In order to attract new businesses a new link road has<br />
been planned, with the intention of opening up the area.<br />
<strong>The</strong> site enjoys a unique environmental setting. It is immediately adjacent to the Erith<br />
Marshes, a site of regional importance for nature conservation. Underinvestment in the<br />
environment of the area needed to be addressed in order improve access, flood<br />
prevention, recreation and biodiversity as a way of maximising the functionality of the<br />
<strong>green</strong> <strong>infrastructure</strong>. <strong>The</strong> local network of drainage dykes has received little or no<br />
maintenance in recent years and its restoration is considered vital in preventing the<br />
flooding of low-lying residential areas. Pedestrian and cycleway improvements (<strong>green</strong><br />
links) are also planned.<br />
<strong>The</strong> Erith Marshes and Belvedere Links project aims to enhance the environmental<br />
quality of the marshland and to improve its accessibility from the surrounding area. In<br />
turn, this is expected significantly to increase the attractiveness of the Belvedere<br />
employment site to higher value businesses.<br />
<strong>The</strong> <strong>green</strong> <strong>infrastructure</strong> <strong>valuation</strong> <strong>toolkit</strong> has been used to evaluate the benefits of this<br />
significant investment in the marshes and adjacent area. As recommended in this<br />
<strong>guide</strong>, a three stage process was applied.<br />
Preparation: Understanding physical characteristics and beneficiaries<br />
<strong>The</strong> project would be focused on 156ha of existing marshland, including 15km of<br />
drainage dykes, and the redevelopment of 12.5ha of derelict land, which would be<br />
made possible by the construction of the new link road.<br />
<strong>The</strong> works will greatly improve access, security and sustainability in Belvedere, with a<br />
range of long term benefits for local employers, staff and residents. <strong>The</strong> main direct<br />
beneficiaries of the new access and enhanced <strong>green</strong>space are expected to be local<br />
residents. Based on an analysis of the number of households, the number of residents<br />
living within 300m and 1200m of the project were estimated to be over 5,000 and<br />
around 47,500, respectively. [Actual figures are 5,164 and 47,518, but this sounds too<br />
precise!]<br />
<strong>The</strong> number of recreational <strong>user</strong>s is predicted to be 237,600 (based upon a likely 10<br />
visits each year, 50% of which are assumed additional to the existing baseline figure).<br />
Assessment: Identifying potential benefit areas and applying relevant tools<br />
As a natural <strong>green</strong>space area, the marshes are considered likely to have a positive<br />
impact on climate change adaptation, flood alleviation and general quality of place.<br />
<strong>The</strong> <strong>green</strong> corridor element of the project (paths and cycleways) is likely to have<br />
tourism, transport [it seems obvious we that we should mention it, although Genecon<br />
haven’t costed transport benefits] and public health and well-being benefits.<br />
<strong>The</strong> different elements of <strong>green</strong> <strong>infrastructure</strong> within the project (exact area of canal,<br />
wetland, different types of grassland, woodland and length of footpaths and cycleways)<br />
have been analysed in the context of the likely beneficiaries.<br />
<strong>The</strong> relevant tools were applied to assess the value of the benefits identified in<br />
monetary terms (for those benefits that could be costed) quantitative terms or<br />
qualitative terms. Some <strong>valuation</strong>s were expressed as a precise figure, whereas<br />
others were expressed as falling within a range of figures. For <strong>valuation</strong> purpose, most<br />
benefits were deemed to last for 10 years, although some were deemed to last for<br />
longer periods. In each case, the <strong>valuation</strong>s were discounted to give a present value<br />
(PV) figure, so that benefits which accrued for different lengths of time could be easily<br />
and directly compared.<br />
Reporting: Articulating a strong return on investment case<br />
<strong>The</strong> benefits were calculated as follows:<br />
<br />
<br />
<br />
Climate change adaptation and mitigation<br />
<strong>The</strong> marshes and other areas of <strong>green</strong>space exhibit a significant urban<br />
cooling effect. This benefit, though uncosted, is recognised as having an<br />
impact on 2,000 to 2,500 households within 300-450m of the marshes.<br />
Water management and flood alleviation<br />
Energy costs and carbon emissions relating to water treatment will be<br />
reduced through improvement of the natural drainage system on the marshes.<br />
<strong>The</strong> value of these benefits were calculated to be £0.6 million and £0.3<br />
million, respectively, at present value (PV).<br />
Health and wellbeing<br />
<strong>The</strong> calculation of reduction in mortality rates from increased take-up of<br />
moderate exercise (walking and cycling) was estimated to be £7.4million (PV)<br />
for walking and £1.5 million (PV) for cycling.<br />
68
Building natural value for sustainable economic development: the <strong>green</strong> <strong>infrastructure</strong> <strong>valuation</strong> <strong>toolkit</strong> <strong>user</strong> <strong>guide</strong><br />
<br />
<br />
<br />
<br />
<br />
<br />
Land and property values<br />
Residential land and property uplift within a 450m radius of the site was<br />
estimated to be £9.5 million (PV).<br />
Investment<br />
An earlier study considered employment and environmental outputs from the<br />
Belvedere Link road on its own, from the marshland improvement and <strong>green</strong><br />
links on their own and from a combination of the two. For employment, by<br />
2016 the link road alone might provide an additional 2,200 jobs, and the <strong>green</strong><br />
links 650, but together the increase is predicted to be a net 8,700. Adjusted<br />
for the relative importance of the <strong>green</strong> <strong>infrastructure</strong>, the estimation of site<br />
employment capacity and employment based GVA assessment was £31<br />
million (PV).<br />
Labour productivity<br />
Reduced absenteeism was calculated to be worth between £0.1 million and<br />
£0.5 million (PV).<br />
Recreation and leisure<br />
Based on a “willingness to pay” measure, the recreational benefits were<br />
estimated to be £1.64 million (PV).<br />
Biodiversity<br />
Erith Marshes are some of the last remnants of grazing marshes in south<br />
London. It is recognised that their enhancement through this project will bring<br />
increased qualitative biodiversity benefit, especially the promotion of rare and<br />
specially protected species such as the water vole.<br />
Land management<br />
Direct management of the land was estimated to generate employment for three<br />
people, calculated at a benefit value of £0.6 million (PV).<br />
Summary<br />
<strong>The</strong> total value of the benefits generated by the improvements was estimated to be<br />
£53.1 million - £55.8 million (PV). Just over half of this (56%) was accounted for by<br />
that aspect of the site’s increased employment potential which was considered<br />
attributable to the <strong>green</strong> <strong>infrastructure</strong>. <strong>The</strong> other significant benefits included land and<br />
property uplift, improved labour productivity from fewer working days lost, enhanced<br />
health and well-being, recreation and flood alleviation.<br />
<strong>The</strong> capital investment is to be made by regeneration and economic development<br />
agencies. <strong>The</strong> total cost of £10.54 million includes the road construction and just £1.84<br />
million of this relates to the landscape improvements. This case study illustrates the<br />
challenge of how best to capture the relative impacts of <strong>green</strong> and grey <strong>infrastructure</strong>.<br />
Without the link road, the number of jobs attracted would be low, but with improved<br />
access, the importance of improved environment becomes much greater.<br />
This project therefore shows a very good rate of return on investment in the natural<br />
environment.<br />
69
Building natural value for sustainable economic development: the <strong>green</strong> <strong>infrastructure</strong> <strong>valuation</strong> <strong>toolkit</strong> <strong>user</strong> <strong>guide</strong><br />
KNOWLEDGE QUARTER, Liverpool<br />
“<strong>The</strong> <strong>toolkit</strong> enabled us to provide a robust figure that showed the<br />
value of investing in <strong>green</strong> <strong>infrastructure</strong> in the heart of Liverpool. In<br />
this case street trees and <strong>green</strong> roofs were the predominant types.<br />
Retaining <strong>green</strong> <strong>infrastructure</strong> in the projects to regenerate the area<br />
from the design stage to implementation will require this strong<br />
economic evidence.” <strong>The</strong> Mersey Forest<br />
Liverpool’s Knowledge Quarter (LKQ) is a diverse inner city neighbourhood which<br />
includes three universities, the two cathedrals, a large teaching hospital, a concert hall,<br />
theatres, restaurants and bars. It also contains a residential district which includes<br />
some attractive Georgian streets and squares. LKQ is within easy reach of the M62<br />
motorway, main railway links and the Mersey Tunnels. However, the physical setting is<br />
fragmented, both environmentally and socially, by piecemeal planning, poor pedestrian<br />
access, inappropriate highways schemes and general neglect of the public realm.<br />
LKQ is identified as a strategic employment site within the north-west of England. An<br />
Urban Design and Public Realm Framework was produced in 2007. <strong>The</strong> framework set<br />
out a long term vision to reconnect the area with a strong network of enhanced spaces<br />
and connecting routes. A programme of street improvements (projects estimated at<br />
£15 million) and place improvements (projects estimated at £7.25 million) was<br />
proposed.<br />
As a follow-up to the public realm framework, a Green Infrastructure Enhancement<br />
Plan was commissioned. This maps existing <strong>green</strong> <strong>infrastructure</strong> and identifies<br />
opportunities for its extension. <strong>The</strong> plan proposes a net gain in <strong>green</strong> cover of 7.7ha,<br />
increasing it from 37.7ha (22% of the area) to 45.4ha (27% of the area). This increase<br />
is planned to be primarily in the form of street trees and <strong>green</strong> roofs, with some<br />
additional <strong>green</strong> spaces.<br />
<strong>The</strong> <strong>green</strong> <strong>infrastructure</strong> <strong>valuation</strong> <strong>toolkit</strong> was used to evaluate the benefits of this<br />
proposed investment in the LKQ. A three stage process was applied.<br />
Preparation: Understanding physical characteristics and beneficiaries<br />
<strong>The</strong> main new contribution to the planned <strong>green</strong> <strong>infrastructure</strong> is from the inclusion of a<br />
significant area of <strong>green</strong> roofs in the new hospital and university buildings and the<br />
planting of an additional 3,300 trees. Existing parks, private gardens and smaller<br />
spaces are also included.<br />
<strong>The</strong> direct beneficiaries of the proposed GI enhancement plan will be residents and<br />
visitors to the LKQ, including employees, students and patients at the hospital. <strong>The</strong>se<br />
are as follows:<br />
university staff 11,250<br />
other employees 15,000<br />
students 45,200<br />
residents 7,500<br />
patients<br />
visitors<br />
unknown<br />
unknown<br />
Assessment: Identifying potential benefit areas and applying relevant tools<br />
Street trees and <strong>green</strong> roofs are considered likely to confer a range of benefits,<br />
including climate change adaptation, flood alleviation, property value enhancement and<br />
general employment uplift.<br />
<strong>The</strong> relevant tools were applied to assess the value of the benefits identified in<br />
monetary terms for those benefits that could be costed, as well as other quantitative<br />
terms and qualitative terms. Some <strong>valuation</strong>s were expressed as a precise figure,<br />
whereas others were expressed as falling within a range of figures. For <strong>valuation</strong><br />
purpose, some benefits were deemed to last for 10 years and some for 25 years. In<br />
each case, the <strong>valuation</strong>s were discounted to give a present value (PV) figure, so that<br />
benefits which accrued for different lengths of time could be easily and directly<br />
compared.<br />
Reporting: Articulating a strong return on investment case<br />
<strong>The</strong> benefits were calculated as follows:<br />
<br />
<br />
<br />
Climate change adaptation and mitigation<br />
Savings in energy costs from the reduction in heating of buildings and savings<br />
in carbon emissions through increased shelter were estimated to be £3.4<br />
million - £4.7 million, present value (PV).<br />
A small benefit from the value of stored carbon in trees was calculated at £6K<br />
- £18K (PV).<br />
Water management and flood alleviation<br />
Avoided surface water charges and reduced carbon emissions from reduced<br />
water treatment (primarily due to <strong>green</strong> roofs) were calculated to be worth<br />
£1.6 million – £2.0 million (PV).<br />
Place and communities<br />
70
Building natural value for sustainable economic development: the <strong>green</strong> <strong>infrastructure</strong> <strong>valuation</strong> <strong>toolkit</strong> <strong>user</strong> <strong>guide</strong><br />
<br />
<br />
<br />
<br />
Summary<br />
Clearly, one of the major benefits of such a substantial investment in the<br />
public realm is the improvement to quality of place, though placing a monetary<br />
value on this was not possible.<br />
Health and wellbeing<br />
Calculation of savings from pollution control benefits amounted to £14K -<br />
£112K (PV).<br />
Land and property values<br />
Over 2,000 houses within the LKQ and over 4,000 just outside (within 450m)<br />
were deemed to benefit from property value uplift amounting to £1.7 million -<br />
£6.7 million (PV). [Not sure this compares with property uplift for Erith<br />
Marshes, which is much more.]<br />
Investment<br />
Assuming a 3.5% - 4.6% annual GVA growth rate over the next decade, 5,600<br />
– 8,000 additional jobs are expected be created in the LKQ. Assuming that<br />
20% of this is attributable to overall public realm improvements and one third<br />
of this, 7%, is attributable to the <strong>green</strong> <strong>infrastructure</strong>, this equates to £23<br />
million - £32 million (PV).<br />
Land management<br />
Employment directly supported by the additional <strong>green</strong>space is calculated to<br />
be 1.5 full-time equivalent posts, which is calculated to be £40K (PV).<br />
Use of the <strong>toolkit</strong> demonstrated that the value of the <strong>green</strong> <strong>infrastructure</strong> benefits would<br />
amount to between £29.3 million and £45.6 million (present value). 70%–78% of this<br />
return is accounted for by increased employment benefits and 10%-12% by climate<br />
change adaptation benefits. <strong>The</strong> value for money test shows that, on a proposed<br />
landscape capital investment of £29.7 million, at the lower estimate of value, the<br />
benefits almost cover the cost of investment and at the higher end of the range there is<br />
a definite positive return. <strong>The</strong> benefit value is likely to have been understated, since<br />
there are considerable benefits to both hospital patients and visitors to the area, neither<br />
of which have been quantified.<br />
71
Building natural value for sustainable economic development: the <strong>green</strong> <strong>infrastructure</strong> <strong>valuation</strong> <strong>toolkit</strong> <strong>user</strong> <strong>guide</strong><br />
ROPNER PARK, Stockton-on-Tees<br />
“<strong>The</strong> <strong>toolkit</strong> provides some really useful data to demonstrate the<br />
multi-functional nature of the park and its social, environmental and<br />
economic value. For a site like Ropner Park this helps to justify<br />
previous capital investment, and can be used to support the case for<br />
maintaining high-standards of management in the future in order to<br />
maximise the benefits to local people and the Borough as a whole”<br />
Stockton-on-Tees Borough Council<br />
Stockton-on-Tees is one of five boroughs within the Tees Valley in the north-east of<br />
England. It is an area of traditionally heavy industry. Stockton’s population is around<br />
178,000, and that of the wider metropolitan region is around 651,000.<br />
Ropner Park is a Victorian urban park, established in 1893 as Stockton’s principal park.<br />
It covers an area of 15.5ha. <strong>The</strong> park is laid out in a classical style, with grassed<br />
areas, formal bedding, bowling <strong>green</strong>s, a fountain, a bandstand and an ornamental<br />
lake. In 2006 Ropner Park underwent a major refurbishment, with substantial<br />
landscape restoration, construction of a pavilion, tennis courts, a play area and the<br />
installation of an art feature. <strong>The</strong> total cost of this work was nearly £3.5 million, 69% of<br />
which was funded by the Heritage Lottery Fund, with the balance funded by Stocktonon-Tees<br />
Borough Council.<br />
<strong>The</strong> <strong>green</strong> <strong>infrastructure</strong> <strong>valuation</strong> <strong>toolkit</strong> was used to evaluate the benefits of this<br />
significant investment in the park.<br />
Preparation: Understanding physical characteristics and beneficiaries<br />
<strong>The</strong> physical characteristics of the park were analysed to establish the extent of each<br />
<strong>green</strong> <strong>infrastructure</strong> asset, such as area of woodland, rough grassland, lawn and open<br />
water.<br />
<strong>The</strong>n the likely beneficiaries were identified. <strong>The</strong>se were deemed to be visitors to the<br />
park (103,500 per annum) and also the people who live within its range (over 4,500<br />
within 300m and over 22,000 within 1200m) and those businesses which are located<br />
nearby (over 70 within 300m and over 1000 within 1200m).<br />
Assessment: Identifying potential benefit areas and applying relevant tools<br />
<strong>The</strong> next stage was to consider which of the 11 <strong>green</strong> <strong>infrastructure</strong> benefits were likely<br />
to be significant. Parks and formal gardens are likely to have a good climate change<br />
adaptation impact, particularly for temperature regulation. This type of space is also<br />
likely to contribute to quality of place, improved health and well-being, uplift of land and<br />
property value as well as tourism and recreation and leisure. Information on<br />
beneficiaries and maintenance levels (both in terms of density of population and level<br />
of park use) both point to a good likelihood of those benefits occurring.<br />
Looking into the <strong>green</strong> <strong>infrastructure</strong> assets in greater details confirmed this initial<br />
assessment, but it allowed the e<strong>valuation</strong> to be further refined.<br />
<strong>The</strong> relevant tools were applied in order to assess the benefits. <strong>The</strong>se were valued in<br />
monetary terms for those benefits that could be costed, as well as other quantitative<br />
terms and qualitative terms. Some <strong>valuation</strong>s were expressed as a precise figure,<br />
whereas others were expressed as falling within a range of figures. Some benefits<br />
were deemed to last for 20, 30 or even 50 years. In each case, the <strong>valuation</strong>s were<br />
discounted to give a present value (PV) figure, so that benefits which accrued for<br />
different lengths of time could be easily and directly compared.<br />
Reporting: Articulating a strong return on investment case<br />
<strong>The</strong> benefits were calculated as follows:<br />
<br />
<br />
<br />
<br />
Climate change adaptation and mitigation<br />
<strong>The</strong> park, as a large <strong>green</strong> space, has an impact on urban temperatures and<br />
consequently on city liveability. <strong>The</strong> cooling effect was calculated to be 1°C<br />
and this benefited an estimated 2000 households and 74 businesses. This<br />
benefit was not monetised.<br />
<strong>The</strong> value of stored and sequestered carbon in trees and woodland was<br />
calculated to be £30,200 (PV).<br />
Water management and flood alleviation<br />
<strong>The</strong> park provides natural evapo-transpiration of c5iMI of rainfall/annum.<br />
Within an urban context this is a benefit as it reduces volumes entering<br />
combined sewers. <strong>The</strong> value of avoided energy costs and carbon emissions<br />
from the reduced need for water treatment was calculated to be £215,000<br />
(PV).<br />
Health and wellbeing<br />
<strong>The</strong> park provides good opportunities for walking and cycling. Take-up of<br />
such moderate physical exercise helps to reduce mortality rates and this was<br />
calculated at PV of £0.35m over 5 years, £0.65m over 10 years. Annual<br />
mortality reduction benefit was calculated at £75,000 p.a.<br />
Various <strong>green</strong> <strong>infrastructure</strong> elements within the park have an impact on<br />
improving air quality. <strong>The</strong> savings from avoiding other pollution control<br />
measures was calculated to be between £21,000 and £165,000 (PV).<br />
Land and property values<br />
72
Building natural value for sustainable economic development: the <strong>green</strong> <strong>infrastructure</strong> <strong>valuation</strong> <strong>toolkit</strong> <strong>user</strong> <strong>guide</strong><br />
<br />
<br />
<br />
Well kept parks and <strong>green</strong> spaces enhance property values in the<br />
neighbourhood, with uplift ranging from 3% - 20%. Properties within 450m<br />
were considered to have their value increased. <strong>The</strong> total value of this was<br />
£18.8 million (PV).<br />
Investment<br />
<strong>The</strong> positive perception of the area created by the park may have an impact<br />
on private sector investment decision making, but further analysis would be<br />
required to make a quantitative estimate.<br />
Tourism<br />
Increased visitor numbers bring additional expenditure, supporting local<br />
employment. This was calculated to have a value of £979,000 (PV).<br />
Recreation<br />
<strong>The</strong> park clearly provides extensive opportunities for recreation. 103,500<br />
<strong>user</strong>s per annum were estimated and, based on a “willingness to pay”<br />
measure, the recreational value was calculated to be £822,000 (PV).<br />
Summary<br />
<strong>The</strong> results showed that the overall benefits were valued at £20.81 million - £21.01<br />
million. 90% of this benefit was associated with the impact on adjacent residential<br />
property values. <strong>The</strong> other monetisable benefits amounted to £2.07 million - £2.21<br />
million per annum at net present value.<br />
73
Building natural value for sustainable economic development: the <strong>green</strong> <strong>infrastructure</strong> <strong>valuation</strong> <strong>toolkit</strong> <strong>user</strong> <strong>guide</strong><br />
Appendix 2: Initial data requirements<br />
<strong>The</strong> table below shows the Project Data Entry sheet featured at the beginning of the Calculator. Fields highlighted in yellow are for data entry.<br />
Current Proposed<br />
Project area 0 0 ha Linked to tool 1.4<br />
Total area of <strong>green</strong>space 0 0 ha Linked to tools 1.4, 2.1, 4.7 and 10.1<br />
New <strong>green</strong> space created n.a. 0 ha Linked to tools 2.1, 4.7, 5.1<br />
Area of <strong>green</strong>space enhanced n.a. 0 ha Linked to tool 5.1<br />
Current<br />
Proposed<br />
Trees/tree cover 0 0 number/ha Linked to tools 1.7 and 3.4<br />
Additional tree cover n.a. 0 number/ha Linked to tool 1.5 and 1.7<br />
Green roofs Total area 0 0 sq.m Linked to tool 1.5<br />
Current land use<br />
Project context eg inner city, urban or rural area (or a mix of all)<br />
Land ownership<br />
What is the level of deprivation in the area Refer to IMD data<br />
Is there currently a lack of <strong>green</strong> space in the area Refer to local open<br />
space audit results and associated open space standards. Refer to<br />
national benchmarks such as ANGsT standards.<br />
How will this project help<br />
Does the site have heritage value What features are being<br />
enhanced/protected/ promoted through the project<br />
Context only<br />
Context only<br />
Context only<br />
Context. Can contribute to business case.<br />
Context. Can contribute to business case.<br />
Context. Can contribute to business case.<br />
Current Proposed<br />
Cycle routes 0 0 km Linked to tool 4.2b<br />
Current cycle routes upgraded n.a. 0 km Linked to tool 4.2b<br />
Footpaths 0 0 km Linked to tool 4.2a<br />
Footpaths upgraded n.a. 0 km Linked to tool 4.2a<br />
Is the land publicly accessible<br />
Is the site currently well connected or remote<br />
Will the project improve <strong>green</strong> travel options<br />
Assessment of transport impact conducted<br />
Links to existing networks<br />
Context only<br />
Context only<br />
Context. Can contribute to business case.<br />
Context. Can contribute to business case.<br />
Context. Can contribute to business case.<br />
74
Building natural value for sustainable economic development: the <strong>green</strong> <strong>infrastructure</strong> <strong>valuation</strong> <strong>toolkit</strong> <strong>user</strong> <strong>guide</strong><br />
Building natural value for sustainable economic development: the <strong>green</strong> <strong>infrastructure</strong> <strong>valuation</strong> <strong>toolkit</strong> <strong>user</strong> <strong>guide</strong><br />
Current Proposed<br />
Number of construction jobs created as a result of scheme delivery n.a. 0 Context. Can contribute to business case.<br />
Number of jobs created/safeguarded for management/maintenance of site n.a. 0 Linked to tool 11.2<br />
Number of new businesses established n.a. 0 Context. Can contribute to business case.<br />
Average residential property price in the area £0 n.a. £ Linked to 5.1<br />
76
Building natural value for sustainable economic development: the <strong>green</strong> <strong>infrastructure</strong> <strong>valuation</strong> <strong>toolkit</strong> <strong>user</strong> <strong>guide</strong><br />
Appendix 3: Tool index<br />
Benefit groups Functions Tools Tool Outputs<br />
Recommended timeframe<br />
for value assessment<br />
Monetary<br />
Quantitative<br />
Qualitative<br />
1.1 Reduced building energy consumption for heating<br />
□ □ ■<br />
Monetisation and quantification functional for residential<br />
properties only<br />
10 years<br />
Shelter from wind<br />
1.2 Avoided carbon emissions from building energy saving<br />
for heating<br />
□ □ ■<br />
Monetisation and quantification functional for residential<br />
properties only<br />
10 years<br />
1. CLIMATE<br />
CHANGE<br />
ADAPTATION &<br />
MITIGATION<br />
2. WATER<br />
MANAGEMENT &<br />
FLOOD<br />
ALLEVIATION<br />
3. PLACE &<br />
COMMUNITiES<br />
Reduction of urban heat island<br />
effect<br />
Cooling through shading and<br />
evapo- transpiration<br />
Carbon storage and sequestration<br />
Interception, storage and<br />
inflitration of rainwater<br />
Catalyst for community cohesion<br />
and pride<br />
1.3 Avoided damage from wind and storms x x ■ Monetisation and quantification require further research t.b.d.<br />
1.4 Reduction of peak summer surface temperatures x ■ ■ Monetisation requires further reserch t.b.d.<br />
1.5 Reduced energy consumtion for cooling ■ ■ ■ 10 years<br />
1.6 Avoided carbon emissions from building energy saving<br />
for cooling<br />
□ □ ■<br />
1.7 Carbon stored and sequestered in woodland and<br />
forests<br />
□ □ ■<br />
Monetisation and quantification functional for <strong>green</strong> roofs<br />
only<br />
Monetisation and quantification functional for broadleaf<br />
woodland only<br />
1.8 Carbon stored and sequestered in non-woodland<br />
based landscapes<br />
x x ■ Monetisation and quantification require further research t.b.d.<br />
2.1 Energy and carbon emissions savings from reduced<br />
stormwater volume entering combined sewers<br />
■ ■ ■ 30 years<br />
2.2 Reduced wastewater treatment costs for domestic and<br />
commercial water customers<br />
■ ■ ■ 30 years<br />
2.3 Avoided costs of traditional water drainage<br />
<strong>infrastructure</strong><br />
x x ■<br />
Monetisation and quatification requires access to average<br />
contruction costs data<br />
10 years<br />
50 years, benefit accrual period 20-25<br />
years with new tree planting<br />
30 years<br />
3.1 Willingness to pay for a view of urban <strong>green</strong> space x x ■ Monetisation and quantification requires further research 10 years<br />
3.2 Increase in volunteering x □ ■<br />
Monetisation requires bespoke appraisal. Quantification<br />
requires access to good project data.<br />
5 years<br />
4. HEALTH &<br />
WELLBEING<br />
Provision of attractive<br />
opportunities for exercise<br />
Stress and mental illness<br />
alleviation<br />
4.1 Health costs savings from increase in physical activity x x ■ Monetisation and quantification require further research<br />
4.2 Reduced mortality from increased walking and cycling ■ ■ ■<br />
4.3 Health cost savings from mental health disorders x x ■ Monetisation and quantification require further research t.b.d.<br />
Healing time reduction 4.4 Health cost savings from reduced in-patient stays x x ■ Monetisation and quantification require further research 10 years<br />
10 years, benefit accrual period first 5<br />
years<br />
10 years, benefit accrual period first 5<br />
years<br />
Air pollution removal<br />
4.5 Reduced mortality from respiratory illnesses x x ■ Monetisation and quantification require further research<br />
4.6 Avoided costs for air pollution control measures ■ ■ ■<br />
25 - 50 years, benefit accrual period 20-<br />
25 years with new tree planting<br />
25 - 50 years, benefit accrual period 20-<br />
25 years with new tree planting<br />
77
Building natural value for sustainable economic development: the <strong>green</strong> <strong>infrastructure</strong> <strong>valuation</strong> <strong>toolkit</strong> <strong>user</strong> <strong>guide</strong><br />
Benefit groups Functions Tools Tool Outputs<br />
Recommended timeframe<br />
for value assessment<br />
Monetary<br />
Quantitative<br />
Qualitative<br />
5. LAND AND<br />
PROPERTY<br />
VALUES<br />
6. INVESTMENT<br />
Setting for higer value residential<br />
and commercial properties<br />
Setting for inward investment<br />
5.1 Residential land and property values uplift ■ ■ ■ n.a.<br />
5.2 Commercial land and property values uplift x □ ■<br />
Monetisation requires further research. Quantification<br />
requires access to good project data.<br />
6.1 Private sector investment levered x x ■ Monetisation and quantification require further research 10 years<br />
6.2 Employment creation x x ■ Monetisation and quantification require further research 10 years<br />
6.3 Image enhancement x x ■ Monetisation and quantification require further research 10 years<br />
t.b.d.<br />
7. LABOUR<br />
PRODUCTIVITY<br />
Reduction of absenteism from<br />
work<br />
7.1 Savings from reduced employee turnover x x ■ Monetisation and quantification require further research<br />
Labor productivityimprovement 7.2 Increase in labour productivity x x ■ Monetisation and quantification require further research 10 years<br />
Attraction and retaintion of high<br />
quality staff<br />
7.3 Savings from reduced absenteism from work □ □ ■<br />
Monetisation and quantification based on proportion of<br />
workforce cycling or walking to work<br />
10 years, benefit accrual period first 5<br />
years<br />
5 years<br />
8. TOURISM<br />
Tourism attraction<br />
8.1 Tourism expenditure ■ ■ ■ 10 years<br />
8.2 Employment supported by tourism □ □ ■ Monetisation and quantification require good project data. 10 years<br />
9. RECREATION &<br />
LEISURE<br />
10. BIODIVERSITY<br />
11. LAND<br />
MANAGEMENT<br />
Provision of recreation<br />
opportunities<br />
Provision, protection and<br />
enhancement of natural habitats<br />
Production of food, timber and<br />
industrial crops<br />
9.1 Recreational use by the local population ■ ■ ■ 10 years<br />
10.1 Willingness to pay for protection or enhancement of<br />
biodiversity<br />
■ ■ ■ 10 years<br />
11.1 Market value of products x x ■ Monetisation and quantification require bespoke appraisal 10 years<br />
Land management 11.2 Employment suported by land management ■ ■ ■ 8 years<br />
Benefit groups to be considered for future work:<br />
12. MOBILITY & CONNECTIVITY<br />
13. EDUCATION<br />
79
Building natural value for sustainable economic development: the <strong>green</strong> <strong>infrastructure</strong> <strong>valuation</strong> <strong>toolkit</strong> <strong>user</strong> <strong>guide</strong><br />
For r further information visit www.bit.ly/gi<strong>valuation</strong><strong>toolkit</strong><br />
80