a Public Benefit Mapping Project - Green Infrastructure North West
a Public Benefit Mapping Project - Green Infrastructure North West
a Public Benefit Mapping Project - Green Infrastructure North West
- No tags were found...

Create successful ePaper yourself
Turn your PDF publications into a flip-book with our unique Google optimized e-Paper software.
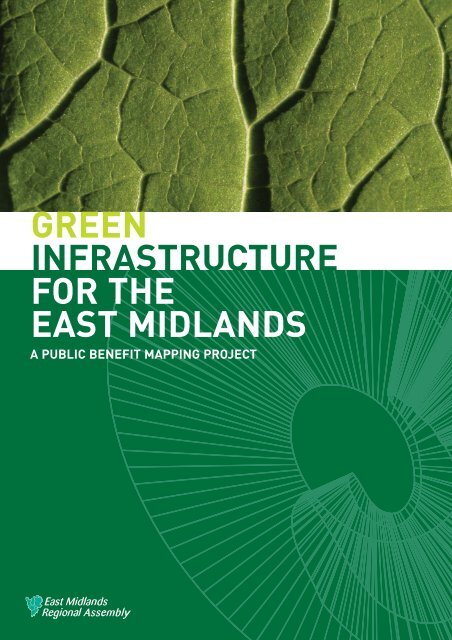
GREENINFRASTRUCTUREFOR THEEAST MIDLANDSA PUBLIC BENEFIT MAPPING PROJECT
GREENINFRASTRUCTUREFOR THEEAST MIDLANDSA PUBLIC BENEFIT MAPPING PROJECTENVIRONMENTAL INFRASTRUCTURECONSISTS OF THE PHYSICAL FEATURES AND NATURAL RESOURCES OF THE ENVIRONMENT(WATER, AIR, MINERALS, SOIL) THAT PROVIDE SERVICES OR SUPPORT TO SOCIETY. PHYSICALFEATURES INCLUDE FLOODPLAINS AND COASTLINES. THE CAPACITY OF NATURALRESOURCES TO PROVIDE SERVICES CAN BE EXCEEDED, IN TERMS OF EITHER QUALITY ORQUANTITY. IN ORDER TO DELIVER SUSTAINABLE DEVELOPMENT, THESE RESOURCES MUSTBE MANAGED SUSTAINABLY TO CONTINUE TO MEET FUTURE NEEDS OF SOCIETY, TAKINGINTO ACCOUNTPARTICULARLY THE EFFECTS OF CLIMATE CHANGE.GREEN INFRASTRUCTUREIS A NETWORK OF MULTI -FUNCTIONAL GREENSPACE WHICH SITS WITHIN, AND CONTRIBUTESTO, THE TYPE OF HIGH QUALITY NATURAL AND BUILT ENVIRONMENT REQUIRED TO DELIVER‘SUSTAINABLE COMMUNITIES’. DELIVERING, PROTECTING AND ENHANCING THIS NETWORKREQUIRES THE CREATION OF NEW ASSETS TO LINK WITH RIVER CORRIDORS, WOODLANDS,NATURE RESERVES AND URBAN GREENSPACE AND OTHER EXISTING ASSETS. IF PROPERLYPLANNED AND MANAGED, GREEN INFRASTRUCTURE SHOULD ALSO CONTRIBUTE TO WIDERENVIRONMENTAL INFRASTRUCTURE THROUGH LOCAL CLIMATE AND AIR QUALITYAMELIORATION, FLOODPLAIN MANAGEMENT, AND COASTAL SEA DEFENCES.1
FORWARDEnsuring the delivery of green infrastructure is one of five key priorities in the IntegratedRegional Strategy, which is the East Midlands sustainable development framework.The Regional Assembly's Environment group has been working with partners to linkregional environmental policy to the delivery mechanisms at regional, sub-regional andlocal levels. This document; <strong>Green</strong> <strong>Infrastructure</strong> for the East Midlands - a <strong>Public</strong><strong>Benefit</strong> <strong>Mapping</strong> <strong>Project</strong> [title in italics] maps the multiple public benefits that greeninfrastructure can deliver across the region. These benefits include adapting to climatechange, improving health and biodiversity.THIS PROVIDES THE STRATEGIC FRAMEWORK FOR ALL PARTNERS TO DELIVER THE "GREEN" BIT OFSUSTAINABLE COMMUNITIES IN THE EAST MIDLANDS. WE HOPE THIS PROVIDES A GREAT STARTINGPOINT FOR ALL PARTNERS TO PLAY A VITAL ROLE IN ENSURING A BETTER QUALITY OF LIFE FOR ALL.MATT DORANChair of theEnvironment GroupJOHN FREEMANChair of the Regional andCommunities Policy Board.Funding Partners:2
A PUBLICBENEFIT MAPPINGPROJECTCONTENTSPAGE1.0 INTRODUCTION 51.1 BACKGROUND TO THE STUDY 51.2 GREEN INFRASTRUCTURE – DEFINITIONS AND BENEFITS 51.3 THE PUBLIC BENEFIT RECORDING SYSTEM (PBRS) APPROACH 62.0 AIMS AND OBJECTIVES 63.0 METHODOLOGY 73.1 STAKEHOLDER DATABASE 73.2 REGIONAL STRATEGY REVIEW 73.3 GEOGRAPHIC AND DEMOGRAPHIC BASELINE MAPPING 73.4 PUBLIC BENEFIT MAPPING 73.5 CONSULTATION 84.0 GEOGRAPHIC AND DEMOGRAPHIC BASELINE MAPS 95.0 PUBLIC BENEFIT MAPS – THE EVIDENCE BASE 146.0 COMBINING THE EVIDENCE – TOWARDS A PUBLIC 42BENEFIT ASSESSMENT7.0 SUMMARY AND CONCLUSIONS 538.0 RECOMMENDATIONS FOR FUTURE WORK 558.1 DEVELOPING INDICATORS FOR GREEN INFRASTRUCTURE 558.2 GREEN INFRASTRUCTURE RESOURCE MAPPING 558.3 DEFINING A GREEN INFRASTRUCTURE SKELETON FOR THE REGION 568.4 MULTI-FUNCTIONALITY AND SCALE 578.5 CREATING A GREEN INFRASTRUCTURE GUIDE 578.6 DEVELOPING A GREEN INFRASTRUCTURE PLANNING TOOLKIT 588.7 PROMOTING A REGIONAL GREEN INFRASTRUCTURE NETWORK 589.0 KEY REFERENCES 59ACKNOWLEDGEMENTS 60APPENDIX 1GREEN INFRASTRUCTURE RESPONSE TO THE OBJECTIVES OF 61THE EAST MIDLANDS INTEGRATED REGIONAL STRATEGYAPPENDIX 2NOTES OF THE STAKEHOLDER CONSULTATION WORKSHOP 6731ST MAY 2006.APPENDIX THREEEAST MIDLANDSPUBLIC BENEFIT MAPPING PROJECT 733
EXECUTIVE SUMMARY28TH JULY 2006The purpose of this study was to identify whether the <strong>Public</strong><strong>Benefit</strong> Recording System (PBRS) technique could be appliedto the East Midlands region to identify where the greatest publicbenefit could be derived from investments in <strong>Green</strong><strong>Infrastructure</strong> (GI).The Integrated Regional Strategy (IRS) outlines 17 keyobjectives for the region across social, economic andenvironmental themes. The provision or enhancement of GIcan contribute significantly to the achievement of most of these.Geographical Information Systems (GIS) were used to spatiallyand thematically map where GI could contribute to the IRSobjectives. Appropriate indicator datasets, ranging in scalefrom neighbourhood to local authority level, were identified toenable these assessments. Data was benchmarked andranked in order to provide a robust regional focus and toaccount for urban, rural and national contexts where appropriate.Twenty seven ‘public benefit’ maps were produced, each relatingto a separate theme of the IRS (eg. health, housing, culturalassets etc.), to identify where there is greatest need and/oropportunity for GI to contribute to IRS objectives. The mapsare presented, each with a narrative, outlining areas of particularpriority for GI, together with a short discussion on thelimitations of the data.The greatest depth of public benefit will generally be derivedwhere greatest need and opportunity coincide and where multipleobjectives may be delivered in parallel. A simple scoringsystem was devised to represent the depth of public benefitpotentially attainable from GI for each of the objectives,spatially across the region. <strong>Public</strong> benefit scores were thencombined within and across the social, economic andenvironmental themes to create maps highlighting thepotential for multiple public benefits.THE RESULTING MULTIPLE PUBLICBENEFITS MAPS REVEALED:The greatest opportunity for social uplift occurs within theThree Cities Areas, the Derbyshire and <strong>North</strong> Nottinghamshirecoalfields, the Lincolnshire coast and the <strong>North</strong>amptonshireGrowth Areas.The greatest opportunity for environmental uplift occursaround areas of existing environmental assets (particularlyaround Strategic River Corridors) and in areas of poorenvironmental quality.The greatest opportunity for economic uplift occurs mainlywithin the Three Cities Area and around strategic economicgateways. <strong>North</strong>ampton, the Lincolnshire Coast, some ruralareas and key natural assets also show potential for tourismand environmental economy benefits.The Combined Multiple <strong>Public</strong> <strong>Benefit</strong>s Map revealed thegreatest opportunity for uplift around the Strategic RiverCorridors, the Three Cities sub area, the <strong>North</strong>amptonshireGrowth Area centres, the <strong>North</strong>ern sub area and theLincolnshire coast. Cross-reference with the Environmental<strong>Public</strong> <strong>Benefit</strong>s Map confirmed that most of the areas ofgreatest environmental priority are included within themultiple benefits map.The implications of the results are discussed in terms ofpriorities for the delivery of GI and the implications for theregion’s spatial strategy, population growth, quality of life andsustainable development.The study shows at a regional scale that it is possible to mapthe potential public benefit GI can bring. Further, it provides afirm evidence base for strategic investment in GI to deliverregional objectives in an integrated manner. It substantiates GIinvestments in the River Nene Regional Park and other<strong>North</strong>amptonshire Growth Areas but also emphasises thatequal, and in some cases greater, public benefit can beachieved by GI investments elsewhere in the region.It is recognised that the PBRS is a ‘top-down’ approach – it isan aid to strategic planning and investment. The spatialinsights it brings must be combined with local knowledge andcommunity values in order to deliver GI and its benefits onthe ground.To facilitate the realisation of enhanced GI in the region, adatabase of stakeholders was developed through correspondencewith regional and local Government and NonGovernmental Organisations. This will form the basis of a<strong>Green</strong> <strong>Infrastructure</strong> Network (GIN) for the coordinateddelivery of GI across the region.A seminar was held in Melton Mowbray (May 2006) and apublic information leaflet was created (opposite) to increaseawareness of the study throughout the region.4
1.0INTRODUCTION1.1 BACKGROUND TO THE STUDY1.1.1 In 2005 the East Midlands Regional Assembly(EMRA)and a number of its regional partners 1 commissioned a scopingstudy of <strong>Green</strong> <strong>Infrastructure</strong> (GI) in the East Midlands. Thisstudy investigated the potential for mapping the functionality ofopen spaces in a number of study areas across the region.These study areas were located in existing economic and socialregeneration initiative areas.1.1.2 The purpose of the study was to identify whether GIprovision and deficit could be mapped and assessed spatially.Further, it proposed to identify a technique for assessing themultiple-functionality of greenspaces in their existingcondition, and the potential to derive additional functionalitythrough management interventions.1.1.3 The study has achieved significant success in embeddingthe concept of GI as a component in successful regenerationand as an integral part of “Environmental <strong>Infrastructure</strong>” -central to the region’s strategy for growth. The study has alsosucceeded in promoting the concept of multifunctional use ofgreen spaces and green networks.1.1.4 However, the EMRA Environment Group recognised thatit is important to prioritise delivery of GI in those areas where itis most needed. Whilst the pilot-study areas will undoubtedly begood examples of where GI provision will be beneficial, theremay be other areas in the region with significant deficits in GIand/or significant needs for the benefits that GI can bring.1.1.5 The Environment Group thus commissioned this, theEast Midlands <strong>Public</strong> <strong>Benefit</strong> <strong>Mapping</strong> <strong>Project</strong>, as a secondstage to that earlier work, examining whether the <strong>Public</strong><strong>Benefit</strong> Recording System (PBRS) technique could be appliedto the region to identify areas of greatest public benefit frominvestments in GI.1.2 GREEN INFRASTRUCTURE – DEFINITION AND BENEFITS1.2.1 <strong>Green</strong> <strong>Infrastructure</strong> (GI) is a term which has evolved inrecent years within Governmental social and regenerationpolicies to describe the network of greenspaces and naturalelements that intersperse and connect our cities, villages andtowns. In urban situations GI complements and balances thebuilt environment; in rural settings it provides a framework forsustainable economies and biodiversity; in-between it linkstown and country and interconnects wider environmentalprocesses. GI is an holistic approach to viewing the natural environmentwhich acknowledges the multiple benefits and vitalfunctions it provides for the economy, wildlife, local people,communities and cultural assets alike.1.2.2 Governmental commitment to economic and populationgrowth in the South East and South Midlands is accompanied bya commitment to infrastructure improvements including GI.There are examples from Milton Keynes and <strong>North</strong>amptonshireof direct Government funding intervention to support GI creationand encourage GI benefits from planning gain.1.2.3 This is of course not a new trend. Initiatives such as theCommunity Forests and the National Forest have shown howformerly private or degraded land can be regenerated andbrought into the public domain so that greenspaces canperform many more functions of benefit to neighbourhoods.Through such contributions to healthier and sustainablelifestyles it is increasingly being recognised as a key factorcentral to the agendas of sustainable communities,development and growth.1.2.4 There are numerous national policy priorities that maybe delivered through GI 2 ., and at the regional level it is nowfirmly recognised as being a core component of Regional SpatialStrategies, and is featured within Regional Rural DevelopmentFrameworks and Economic Strategies. It is implicitly recognisedin numerous other regional level strategy and policy documentsconcerning planning, health, sport, biodiversity, culture etc.1.2.5 There is now a need for strategic overview of where themost significant public benefit can be secured through investmentin GI. Given a situation of limited resources and a desireto maximise the cost cutting benefits of public investment;there is an over-riding need in spatial strategy to identify areas;• which are undergoing social or environmental deficit(a ‘needs’ focussed approach) and/or;• where the sustainable development opportunitiesarising from a high quality environment can be captured(an ‘opportunity’ focussed approach).1.2.6 There is also a need for this to be firmly evidence-basedand to be driven by integrated sustainable objectives –combining social, environmental and economic outcomes.1 The Countryside Agency, Environment Agency, The National Trust, East Midlands Development Agency, English Nature, English Heritage, Groundwork,Defra, Sport England, Government Office for the East Midlands, The Wildlife Trusts and the Institute for Sustainable Development in Business.5
1.0INTRODUCTION1.3 THE PUBLIC BENEFIT RECORDING SYSTEM (PBRS) APPROACH1.3.1 The PBRS is a strategic decision making tool initiallyconceived by the Forestry Commission and the <strong>North</strong> <strong>West</strong>Development Agency to assist in the prioritisation of derelictland sites for reclamation investment, based upon the site’spotential to generate public benefits.1.3.2 PBRS has an ethos to identify where greatest publicbenefit can be secured through policy/funding intervention –the benefit may be social, economic or environmental, butgenerally greater benefits will emerge where all threeconverge. It is also an approach which builds evidence from awide range of data sources; using GIS to spatially analyse andmap areas of significant need and opportunity.1.3.3 In the <strong>Green</strong>wood Forest area TEP (The EnvironmentPartnership) were commissioned to undertake public benefitassessments relating to the priorities and objectives of the EastMidlands Regional Forestry Framework (hereafter RFF). A suite ofmaps was produced illustrating where strategic opportunitieswere aligned with RFF objectives. The maps were combined toproduce 3 dimensional maps of multiple public benefit. This communicatedquickly in a highly visual format the areas of <strong>Green</strong>woodForest where the policies promoted in the Regional ForestryFramework were most needed. A similar approach is now proposedfor the region.1.3.4 It is important that the PBRS is viewed as an aid tostrategic planning and investment: the spatial insights itbrings need to be tested and weighed alongside localknowledge and community values.2.0AIM & OBJECTIVESPhotograph © Nathalie HeuberAIMTHE AIM OF THE STUDY IS TO PRODUCE A SPATIALFRAMEWORK SO THE POTENTIAL PUBLIC BENEFIT OF GICAN BE ASSESSED FOR THE EAST MIDLANDS.In support of this aim, a series of maps are produced toidentify those parts of the region where GI is a priority.The reasons why GI might be a priority include;• Provision of new or enhanced GI for areas of present andfuture deficit• Management of existing GI resources to increase theirusefulness (multi- functionality)• Conservation of key GI resources which contribute to theregion’s environmental infrastructure• Improving connectivity of existing GI resources where theyare presently fragmentedSTUDY OBJECTIVES• To define the particular public benefits that GI gives (orcould give) to the East Midlands, taking account of regionalstrategies and national policies for sustainability.6• To identify relevant indicators of need and opportunity bywhich public benefit can be assessed, and map theseindicators in GIS (Geographical Information Systems).• To identify those areas where needs and opportunitiesoverlap to the greatest extent - in relation to social,economic and environmental benefits.• To compile a database of stakeholders within the region whowill have most interest in the existing and future delivery ofEnvironmental <strong>Infrastructure</strong>, particularly GI.• To disseminate findings to a relevant regional audience,through a consultative seminar and summary report.• To identify the need for further work to improve the depth ofthe study and to intervene in particular areas to promote GI.At this point, it must be emphasised that this study is a regionaloverview. It responds to regional strategy and uses regionaldatasets as indicators of social, economic and environmentalconditions. It is recognised that county and local levelpractitioners will want to consider further priorities; and uselocal knowledge and other datasets to add depth to theassessment of the potential benefit of GI.
3.0METHODOLOGYTHERE WERE FIVE STRANDS OF WORK:I. STAKEHOLDER DATABASEII.III.IV.REGIONAL STRATEGY REVIEWGEOGRAPHIC & DEMOGRAPHICBASELINE MAPPINGPUBLIC BENEFIT MAPPINGV. CONSULTATION3.1 STAKEHOLDER DATABASETo facilitate the realisation of strategic GI delivery a databaseof relevant regional stakeholders was developed throughcorrespondence with regional and local Government and NonGovernmental Organisations. The database is not included inthis report – it has been provided separately to EMRA. Thiswill form the basis of the development of a <strong>Green</strong><strong>Infrastructure</strong> Network (GIN) for the region.3.2 REGIONAL STRATEGY REVIEW“England’s East Midlands Integrated Regional Strategy – oursustainable development strategy” (EMRA, 2005), knownhereafter as the IRS, encapsulates the East Midlands’ keystrategy and policy documents into a framework comprisingfour “themes”; within which there are seventeen objectivesfor the sustainable development of the region.On one hand, GI is itself a desired outcome of the IRS. Just asimportantly, GI can contribute to most IRS objectives inindirect ways e.g. through providing a setting for healthierlifestyles, inward investment; as described in section 1.2.In essence, this is the potential “public benefit” that GIcan deliver.For each of the 4 themes and 17 objectives, the potentialcontribution of GI to IRS outcomes was considered – Appendix1 sets out in tabulated form, the results of this exercise.3.3 GEOGRAPHIC AND DEMOGRAPHIC BASELINE MAPPINGIn order to provide a geographical context for the mapping ofpublic benefit, various background maps were produced;showing administrative and cultural boundaries, along withpopulation density information. These maps are shown atChapter 4.development. For most of the IRS objectives, it is possible(using regionally- benchmarked indicators), to map areas ofgreatest need for intervention.A 4-STEP APPROACH TO MAPPING PUBLICBENEFIT WAS ADOPTED.• Identifying how GI can deliver public benefit• Identifying appropriate indicator datasets• Benchmarking and ranking indicators in order to provide arobust regional focus• Identifying where there is greatest need for GI and/orgreatest opportunity for GI to deliver IRS objectivesSTEP 1 – IDENTIFYING THE PUBLIC BENEFIT OF GI –was carried out using the IRS as a guide. The process isdescribed above and is tabulated in detail at Appendix 1, inthe first 4 columns. Thus for example, IRS has a social theme,within which objective 1 is to ensure that the existing andfuture housing stock meets the needs of all communities. Forpeople without independent means of travel (often the veryyoung and the very old), there is a particular need fordoorstep greenspace.Thus it may be concluded that GI will have particular publicbenefit to neighbourhoods with particularly high numbers ofthe very young or old.STEP 2 – IDENTIFYING APPROPRIATE INDICATOR DATASETS –was carried out in dialogue with the project Steering Group,but also used the consultants’ previous experience of mappingin the East Midlands and elsewhere. Datasets were usedwhere they fulfilled most of the following criteria;• Relevance to the particular public benefit being mapped• Available consistently across the region• Available in digital format• Available at a fine-grain, preferably more focussed thanLocal Authority boundaries• Capable of benchmarking against national datasets• Available as “public domain” material3.4 PUBLIC BENEFIT MAPPINGThe Regional Strategy Review described above, and tabulatedat Appendix 1, led to various conclusions about how GI cancontribute directly or indirectly to regional7
3.0METHODOLOGYDatasets were available to map GI’s potential contribution tomost IRS objectives – there has been considerable investmentin mapping and data collection over the past few years, whichmeans that for most objectives, directly relevant datasets areavailable; or at least good “proxies” can be found.In the example cited above re GI contributing to sustainablehousing, Census 2001 statistics were used to identify SuperOutput Areas 3 where proportions of the very young and/or veryold were significantly higher than the regional average.Column 4 (Map Theme) of Appendix 1 lists the various themeswhich were mapped. Column 6 identifies the sources of dataused for each map.Inevitably there are limitations imposed by the geographicfocus of the data, and in some cases, time has passed sincedata was collected. Significant areas for future developmentare discussed in relation to each map; and are summarised atthe end of this study.STEP 3 - BENCHMARKING AND RANKING INDICATORS –was carried out to identify regional “hotspots” of need oropportunity. As far as possible, data was benchmarked aroundregional (rather than national) means; although nationalbenchmarks were borne in mind to ensure onlygenuine need was prioritised.It was also found useful, for many social datasets, to provideparallel benchmarks for urban and rural neighbourhoods;specifically to ensure that pockets of rural disadvantage are notignored or obscured due to the rather urban-centric nature ofIndex of Deprivation statistics. This process of urban – ruralbenchmarking used the Defra rural classification (see Map B).Once datasets had been assembled and benchmarked to theregion, a process of ranking occurred in order to identify theareas of greatest need and / or opportunity.In some cases the maps simply identify areas of need /opportunity. In other cases, the maps illustrate the “depth” ofneed / opportunity, using a ranking. This process requiredsensitivity testing in order to ensure that only genuine need /opportunity was ranked highly.75, 76-100). However, if an East Midlands neighbourhoodranked 51 is in fact significantly healthier than the Englishmedian, a weighting may be set to give priority only to thoseareas of genuine health need.Column 5 of Appendix 1 lists how the ranking was carried out,showing for each map, which areas are of greatest need /opportunity – and how this translates into “scores”.A simple scoring system, from 0 to 3, was adopted for eachindicator dataset. Areas which scored 3 indicating, for thatspecific dataset, that either;There is a significant need, at regional level, for GI uplift toaddress social, environmental or economic problem areas; orthat GI makes, or could make, a significant contribution to theeconomy, environment or society’s needs.STEP 4 – IDENTIFYING WHERE THERE IS GREATEST NEEDFOR GI AND/OR GREATEST OPPORTUNITY FOR GI TODELIVER IRS OBJECTIVES –resulted in the production of 27 themed <strong>Public</strong> <strong>Benefit</strong>s maps:13 in relation to the IRS’s 5 social outcomes, 8 in respect of the5 environmental outcomes; and 6 illustrating contribution tothe 3 economic outcomes. Of course, a number of the mapsare cross-cutting e.g. Map 13 (Index of Multiple Deprivation)which falls into the “social” theme also has aneconomic purpose.Appendix 1 (in column 4) lists the 27 maps, in relation to theirIRS theme.A series of Multiple <strong>Public</strong> <strong>Benefit</strong> maps were then producedby combining the 27 themed maps to demonstrate where GIprovision would have the greatest public benefit potentialtowards social, environmental, economic and combined agendas.3.5 STAKEHOLDER CONSULTATIONA seminar and workshop was held at Pera Innovation Park,Melton Mowbray on May 31st to present the interim findings,discuss the project and promote the formation of a regional GInetwork. Results of a questions and answer session andinteractive workshop are included at Appendix 2.For example, a map outlining health may rank areas acrossthe region from 1 (best) to 100 (worst). One might impose afour point scoring scale based on quartiles (1- 25, 26-50, 51-3 Demographic units for the purposes of census and social mapping – typically 1/3rd of an electoral ward, comprising 3 to 4,000 people.8
4.0GEOGRAPHIC ANDDEMOGRAPHICBASELINE MAPSPhotograph © River Nene Regional ParkMAP A: COUNTY & DISTRICT BOUNDARIES IN THE EAST MIDLANDS*Based upon data compiled prior to 21st July 2006*Based upon data compiled prior to 21st July 2006MAPS A-E PROVIDE BACKGROUND INFORMATION ONTHE GEOGRAPHIC, DEMOGRAPHIC AND LANDSCAPECHARACTER OF THE REGION. THESE MAPS PROVIDECONTEXTUAL INFORMATION, BUT ARE NOT USED FORPUBLIC BENEFIT SCORING.Map A: County & District Boundaries in the East MidlandsMap B: Urban & Rural Area ClassificationsMap C: Percentage of ‘Non-Built’ Land by Super Output AreaMap D: Population Density by Super Output AreaMap E: Joint Character Areas9
4.0GEOGRAPHIC ANDDEMOGRAPHICBASELINE MAPSPhotograph © Nathalie HeuberMAP B: URBAN AND RURALAREA CLASSIFICATION10
4.0GEOGRAPHIC ANDDEMOGRAPHICBASELINE MAPSMAP C: PERCENTAGE OF ‘NON-BUILT’ LAND11
4.0GEOGRAPHIC ANDDEMOGRAPHICBASELINE MAPSMAP D: POPULATION DENSITY IN THE EAST MIDLANDS*Based upon data compiled prior to 21st July 200612
4.0GEOGRAPHIC ANDDEMOGRAPHICBASELINE MAPSPhotograph © Nathalie HeuberMAP E: JOINT CHARACTER AREAS*Based upon data compiled prior to 21st July 200613
5.0PUBLIC BENEFIT MAPS –THE EVIDENCE BASEMAPS 1-27 COMPRISE A SERIESRELATING TO THE IRS THEMES ANDOBJECTIVES, AS LISTED INAPPENDIX 1. THESE ARE USED TOINTERPRET THE POTENTIAL FOR GITO DELIVER PUBLIC BENEFITSACROSS THE REGION. ALTHOUGHASSIGNED TO INDIVIDUAL THEMATICHEADINGS, IT WILL BE EVIDENTTHAT MANY OF THE MAPS ACTUALLYCUT ACROSS 2 OR 3 IRS THEMESAND EVEN MORE IRS OBJECTIVES.SOCIAL THEMEIRS Objective 1: Sustainable Housing for allMap 1: House PricesMap 2: Growth Points and AreasMap 3: Population Age StructureIRS Objective 2: Healthy People and LifestylesMap 4: HealthMap 5: Population Density - based on 300mbuffers per hectareMap 6: Open Space DeficiencyIRS Objective 3: Enjoyment of Culture and recreationMap 7: Population Catchment within 10kmMap 8: Sports Facilities IRS Objectives 4 & 5: Safe Placesand Cohesive CommunitiesIRS Objectives 4 & 5: Safe Places and Cohesive CommunitiesMap 9: Quality of Local Parks & Open SpacesMap 10: Quality of Community ActivitiesMap 11: Community Diversity by EthnicityMap 12: Education DeprivationMap 13: Index of Multiple DeprivationENVIRONMENTAL THEMEIRS Objective 6: Caring for our best environmental assetsMap14: Natural & Cultural AssetsMap 15: Environmental DeclineIRS Objective 7 & 10: Improving and re-Connecting ourenvironmental infrastructure, in line with individuallifestyle changesMap 16: Biodiversity Enhancement AreasMap 17: Flood Alleviation and MitigationMap 18: <strong>Green</strong> <strong>Infrastructure</strong> ConnectivityIRS Objective 8: Managing Natural ResourcesMap 19: Water Quality Map20: Air QualityIRS Objective 9: Sustainable Energy UsageMap 21: Renewable Energy Potential (Biomass)Economic ThemeIRS Objective 11: Quality Employment, Skills and CompetitivenessMap 22: UnemploymentMap 23: Adult Qualification LevelsMap 24: Environmental Tourism AssetsIRS Objective 12: Innovation and EntrepreneurshipMap 25: Business DensityMap 26: Economic Regeneration InitiativesIRS Objective 13: A modern infrastructure for businessMap 27: Gateways to Economic AreasThe maps are presented on subsequent pages, each with anarrative outlining areas of particular priority for GI in relationto the theme in question, together with a short discussion oflimitations on the data and interpretation thereof.For maps with a white backdrop, the use of colour showspriority areas. For maps with full colour, the gradation fromblue (low) through to red (high) indicates the priority for GI.Each map shows, in the bottom right-hand corner, howscores are allocated on the 0-3 point scale describedat Section 3.4 (Step 4).Appendix 1 contains detail on the rationaleunderpinning selection of datasets14
5.0PUBLIC BENEFIT MAPS –THE EVIDENCE BASEMAP 1: HOUSE PRICESInvestments in local parks and urban spaces can have a real impact upon people’s perception of an area. An attractivesetting and high quality environment can improve confidence in the future social and economic viability of a location, attractinghouse buyers and encouraging those who live and invest in the area to stay there. Such factors can have a direct and positive effecton house prices. Lowest house prices generally occur to the north of the region, through the Coalfields to include Nottinghamand Derby and to the south Leicester, Corby, Kettering and Wellingborough.Many factors interrelate to determine how attractive an area is to homebuyers. Comparison with maps 9, 12, 21 & 24 may help toreveal where a lack of local employment opportunities or facilities may be of greatest influence or where there is arelatively high level of public perception that the quality of local parks and open spaces is deteriorating.15
5.0PUBLIC BENEFIT MAPS –THE EVIDENCE BASEMAP 2: GROWTH POINTS & AREAS*Based upon data compiled prior to 21st July 2006To tackle the national housing shortage the government has proposed residential developments within key areas and points ofrecognised growth potential. Map 2 illustrates these growth areas and proposed growth points in the East Midlands. These areasare likely to see a sharp increase in population in coming years, which will inevitably place increasing pressures upon their existinggreenspaces and <strong>Green</strong> <strong>Infrastructure</strong>. Strategic planning is a priority in these areas to ensure that environmental impacts canbe absorbed sustainably through environments that support a high quality of life for existing and future communities.16
5.0PUBLIC BENEFIT MAPS –THE EVIDENCE BASEMAP 3: POPULATION AGE STRUCTURE<strong>Green</strong> <strong>Infrastructure</strong> can provide a range of inspiring outdoor venues for sport, recreation, leisure and play - promoting positivelife experiences, exercise, education, tranquillity, relaxation, social interaction and connection with the natural environment.National and local strategies recognise these have a high impact upon the development and well-being of young and elderlypeople, yet these groups often have the lowest degree of mobility to access quality green environments. In areas where a highproportion of the population belongs to either of these age groups the provision of quality ‘doorstep greens’ is important. Whereboth young and elderly people constitute a large proportion of the population there may be further benefits from socialinteraction and community cohesion. Urban fringe areas appear to hold the greatest concentrations of these target age groups.17
5.0PUBLIC BENEFIT MAPS –THE EVIDENCE BASEMAP 4: HEALTHQuality greenspaces offer opportunities and incentives to engage in physical and mental activity. Interaction with the environmentand others helps to develop a sense of place and person. Such experiences are central to well-being, withpositive physical and mental health implications. Map 4 illustrates where health deprivation statistics (ODPM, 2004) andself-reported general health statistics (National Census, 2001) indicate the poorest health in the region. Insightful greenspacecreation and management could offer public health benefits. Poor health appears most prevalent within urban areas. Notableconcentrations lie around the coalfields and three cities (Leicester, Derby and Nottingham) areas. There is a high degree ofcorrelation between the trends observed here and the pattern of multiple deprivation seen in map 13.18
5.0PUBLIC BENEFIT MAPS –THE EVIDENCE BASEMAP 5: POPULATION DENSITY BASED ON 300 METRE BUFFERS PER HECTAREThe Accessible Natural <strong>Green</strong>space Standards (ANGSt) model outlined in Planning Policy Guidance 17 (PPG17) require that:• no person should live more than 300m from their nearest area of natural greenspace of at least 2ha in size• there should be provision of at least 1ha of Local NatureReserve per 1,000 population.Map 5 illustrates the potential population catchment within 300m of any given point in the East Midlands. Black dotsindicate where the catchment exceeds 1000 people. Local sites of accessible natural greenspace (ANG) are likely toconfer the greatest public benefit within these areas. This map illustrates “demand” for ANG – local knowledge isneeded to identify whether these high-demand areas are already well-supplied by accessible greenspace.19
5.0PUBLIC BENEFIT MAPS –THE EVIDENCE BASEPhotograph © Nathalie HeuberMAP 6: OPEN SPACE DEFICIENCYMap 6 highlights the areas of least ‘non-built’open space (i.e. greenspace, water or gardens) across the region. Although thediffering contexts of urban and rural areas were accounted for (see section 3.4), the pattern of deficit follows the major areas ofurban settlement. Open spaces in these areas show high potential to deliver public benefits across a number of themes (e.g.health, education etc.).Given the high existing population catchment (Maps 5 & 7) and likely future growth (Map 2) of these areas, the limited open spaceresources may have increasing quality and management implications and this suggests that <strong>Green</strong> <strong>Infrastructure</strong> investmentsnow will provide greatest public good and sustainability in the future. It should be noted that public perception of the quality ofparks and open space in these areas is often lower than the regional average (see map 9).20
5.0PUBLIC BENEFIT MAPS –THE EVIDENCE BASEMAP 7: POPULATION CATCHMENT WITHIN 10 KMThe Accessible Natural <strong>Green</strong>space Standards (ANGSt) model outlined in Planning Policy Guidance 17 (PPG17) requires that there shouldbe one accessible 500ha site within 10km of every household – so-called “strategic greenspace”.Map 7 illustrates the potential population catchment within 10km of any point in the region; suggesting where strategic greenspace maybe located to serve greatest numbers of the public. In addition to the major urban areas within and around the region, a range of morerural areas appear to have much potential for benefit.Supply-side research might compare this demand-oriented map with the distribution of existing accessible natural greenspaces of >500ha in size in order to ascertain optimum locations for new strategic greenspace resources such as regional parks, community forests etc.21
5.0PUBLIC BENEFIT MAPS –THE EVIDENCE BASEMAP 8: SPORTS FACILITIESAt a personal level sport provides opportunities for positive experiences involving learning, socialising, competing, conquering personalchallenges and improvements in health. At a community level sport has a positive effect on educational achievement,economic growth, community cohesion and crime. In areas which lack an adequate range and standard of sports facilities, GI cansupport a range of facilities and regenerate interest and participation in sports. Comparison with the population density/catchment mapssuggests that the current relative lack of sport facilities around <strong>North</strong>ampton, Lincoln, Nottingham and the Coalfields may affect thegreatest number of people.In the open access areas of the Peak District, along the coast and in rural areas with effective public rights of waynetworks, the natural environment may lend itself to additional sporting opportunities (e.g. cycling, watersports, rambling etc.).Further study here may also wish to focus on stimulating outdoor sports participation.22
5.0PUBLIC BENEFIT MAPS –THE EVIDENCE BASEPhotograph © River Nene Regional ParkMAP 9: QUALITY OF LOCAL PARKS & OPEN SPACES*Based upon data compiled prior to 21st July 2006Clean, safe and attractive environments can affect and reflect the well-being of local communities. Equally, poorly-managed open spacesmay suggest, and compound despondency and decline. The Coalfields area, Nottingham, Leicester, Melton and <strong>North</strong>ampton are wherethe local public perceive that a fall in the quality of the local open space environment has recently occurred. These areas generally showrelatively high levels of unemployment, health deprivation and a deficiency of quality accredited sports facilities. These factors may be interrelatedand are relevant to regeneration initiatives such as the Neighbourhood Renewal Fund which covers many of these areas (map 26).Data represented here is not an actual assessment of the quality of local parks and open spaces, rather a survey of public perceptionsof the trend in their condition over the past three years. A more standardised approach to assessment (e.g <strong>Green</strong> Flag)awards may help to overcome any potential influences of ‘negative frames of mind’.23
5.0PUBLIC BENEFIT MAPS –THE EVIDENCE BASEPhotograph © Nathalie HeuberMAP 10: QUALITY OF COMMUNITY ACTIVITIES*Based upon data compiled prior to 21st July 2006Greater interaction within and between communities generates a greater sense of community spirit through social interaction andunderstanding which may help to break down barriers to community cohesion. Further, it encourages membership to clubs andorganisations, volunteering and civic engagement. <strong>Green</strong> <strong>Infrastructure</strong> can provide a venue and a focus for the development of theseforms of social capital. Indeed the creation of, interest in and concern for a local greenspace is often a strong driver for the formation oflocal community groups.The Coalfields, Three Cities, Leicester, Corby and <strong>North</strong>west <strong>North</strong>amptonshire feature strongly here, bearing some relation to thequality of local parks indicator (map 9) and interestingly, little relation to the areas of greatest ethnic diversity (map11). Again, the datarepresented here is not a direct assessment of the quality of community activities across the region, rather it relates to publicperceptions of the trend in local quality over the recent past.24
5.0PUBLIC BENEFIT MAPS –THE EVIDENCE BASEMAP 11: COMMUNITY DIVERSITY BY ETHNICITY<strong>Green</strong> <strong>Infrastructure</strong> can provide a centre for meetings and shared events and experiences, thereby assisting community cohesion.Recent research by Countryside Agency suggests that some ethnic groups have historically not used greenspace much, but once they areempowered, they will do so enthusiastically.There is a special need for <strong>Green</strong> <strong>Infrastructure</strong> in areas where there is high community diversity, partly because of the need to provide asetting for meetings. Also different communities imbue different types of space with special meaning. Thus in an ethnically-rich area,greenspace is more likely to provide public benefit if it is large in area and diverse in terms of topography and habitat.Map 11 shows the particularly diverse communities which tend to be concentrated in urban areas.25
5.0PUBLIC BENEFIT MAPS –THE EVIDENCE BASEMAP 12: EDUCATIONThe East Midlands <strong>Green</strong> <strong>Infrastructure</strong> Scoping Study identifies a range of <strong>Green</strong> <strong>Infrastructure</strong> forms which can contribute tonational curriculum study topics as well as vocational training. These include parks and gardens, outdoor sports facilities, grasslandand heathland, cemeteries, churchyards, woodlands, water, local nature reserves, scheduled monuments and registeredparks and gardens. The nature and design of such “outdoor classrooms” can inspire and influence the attitudes of studentstowards arts, science and physical education.Map 13 highlights areas where a high density of schools occurs, coupled with a convergence of indicators ofeducational deprivation (school absences, low points scores and failing interests in further education). There is a clear pattern ofopportunity in urban and urban fringe areas in line with the vision of “The Countryside In and Around Towns” to use and enhancingthe urban fringe <strong>Green</strong> <strong>Infrastructure</strong> resource for education.26
5.0PUBLIC BENEFIT MAPS –THE EVIDENCE BASEPhotograph © Nathalie HeuberMAP 13: INDEX OF MULTIPLE DEPRIVATIONThe Index of Multiple Deprivation (IMD) assesses quality of life deficits across seven themes (Employment; Income; Health;Education; Housing and Services; Living Environment & Crime). Individuals living in areas with high IMD mayexperience shortcomings in relation to several themes.There is an unfortunate association between the quality and quantity of greenspaces and levels of multiple deprivation. <strong>Green</strong><strong>Infrastructure</strong> uplift (particularly in terms of quality) has a role in Neighbourhood Renewal.An interesting aspect of this map (which is benchmarked for rural and urban areas) is that much of rural East Lindsey shows highlevels of social disadvantage. A discussion is needed as to whether and how rural GI can be managed to address rural exclusion;and how to balance the need for urban GI enhancement, which may inherently affect greater numbers of people.27
5.0PUBLIC BENEFIT MAPS –THE EVIDENCE BASEMAP 14: NATURAL AND CULTURAL ASSETS*Based upon data compiled prior to 21st July 2006IRS Objective 6 recognises the need to protect, enhance and manage the existing environmental assets of the region. Map 14 outlinesareas within and immediately surrounding the region’s main natural, cultural and built environmental assets, where <strong>Green</strong> <strong>Infrastructure</strong>management is either integral to the site or may offer protection through buffering and aesthetic contributions to the setting.Interestingly, outside the Peak District and Lincolnshire Wolds areas, the greatest densities of assets occurs around the morepopulated as opposed to rural areas. This may be related to the extensive cultural history of occupation and farming practicesassociated with the region.Further features to recognise under this objective and which can benefit from GI contributions may include the region’s sites ofarchaeological interest and listed buildings (NB nationally- Scheduled monuments are included here)28
5.0PUBLIC BENEFIT MAPS –THE EVIDENCE BASEMAP 15: ENVIRONMENTAL DECLINE*Based upon data compiled prior to 21st July 2006Map 15 illustrates where the region’s finest natural, cultural and built environmental assets are currently at risk or in an unfavourable /declining condition. The protection, enhancement and management of these landscape and feature scale assets is paramount to theconservation of the region’s environmental infrastructure.Much of the region has seen changes in landscape character inconsistent with their existing character and there are largeareas of declining SSSIs at the Lincolnshire Coastal Fens and in Dark Peak.The East Midlands has the lowest proportion of land designated as SSSI in England and Wales and over half of these are in decline.To preventfurther loss is of up-most importance for the region and towards the national target of all SSSIs being in good condition by 2010.Similarly, the safeguarding of monuments and landscapes of tranquility, biodiversity and heritage character is essential for the retention ofcultural distinctiveness and environmental quality.29
5.0PUBLIC BENEFIT MAPS –THE EVIDENCE BASEMAP 16: BIODIVERSITY ENHANCEMENT AREASBiodiversity has probably declined faster in the East Midlands than anywhere in Britain in recent decades. The initial challenge for theregion is to halt this decline and to restore the network of habitats and processes that support the natural environment. Maps 14 and15 highlight areas of high existing biodiversity value and where these are under threat.Map 16 highlights the Regional Biodiversity Strategy’s Biodiversity Enhancement Areas. These are areas where “the biodiversityresource is exceptionally poor or where there are regionally significant opportunities to reverse biodiversity losses by implementinghabitat creation projects on a landscape scale”. Lincolnshire features strongly here particularly throughout the Fens. Sherwood is anotherarea where such opportunities converge. The strategic river corridors, such as the River Nene are considered biodiversity enhancementareas and their form offers opportunities to connect the vastness of the region through riparian habitat creation (refer to map 18).30
5.0PUBLIC BENEFIT MAPS –THE EVIDENCE BASEMAP 17: FLOOD MITIGATION AND ALLEVIATIONThe management of land within river catchments, particularly in floodplains and alongside watercourses, can have a significant impactupon flood mitigation and alleviation. Appropriate improvements to landform, such as the creation of wet woodlands, mudflats, reedbedsand water-meadows, can reduce peak river flows through storm water infiltration, absorption and storage, and can mitigate coastalsqueeze from rising sea levels. Map 17 displays the risk of flooding, without flood defences, using Environment Agency Flood Zone data.Using GLUD statistics it further illustrates where these coincide with areas of relatively low levels of greenspace. Notable areas lie aroundthe River Trent in Nottingham, Derby and Loughborough, the River Soar around Leicester, the River Nene in <strong>North</strong>ampton and the RiverWytham around Lincoln Though outside the scope of this study, it would be beneficial to factor in the effect of flood defences, todistinguish between tidal and fluvial floodzones and to identify areas outside of floodzones and upstream of urban areas with flood storage/interceptionpotential.31
5.0PUBLIC BENEFIT MAPS –THE EVIDENCE BASEMAP 18: GREEN INFRASTRUCTURE CONNECTIVITY*Based upon data compiled prior to 21st July 2006Agricultural intensification, population growth and economic development have altered the landscape dramatically over recent decades.Natural habitats and species have become increasingly reduced and fragmented and disturbed by human activities. Yet biodiversity excitesand inspires people to interact with the environment and enjoy the wider public benefits that it provides. Repairing and reconnecting <strong>Green</strong><strong>Infrastructure</strong> is a real priority to ensure the conservation of species through green networks of reserves that support viable populationsand meta-populations resistant to the pressures of spatial, temporal and climatic variation. Map 18 is a first-step towards mapping wherethere are most pragmatic opportunities to link and expand areas of a ‘natural essence’. Using simplified versions oftechniques pioneered in the River Nene Regional Park, this map shows where patches of natural essence are situated alongsustainable transport routes and near wider environmental tourism assets that can further motivate public interest and interaction.32
5.0PUBLIC BENEFIT MAPS –THE EVIDENCE BASEMAP 19: WATER QUALITY*Based upon data compiled prior to 21st July 2006<strong>Green</strong> <strong>Infrastructure</strong> creation and management can affect water quality in two ways:1) De-contamination – agricultural run-off is a major contributor to poor water in the East Midlands with almost theentirety of the region classed as a surface water nitrate vulnerable zone. Post industrial landscapes, such as thoseprevalent in the coalfields area, can also generate water contamination2) Remediation – riverside vegetation can have a direct positive effect upon water quality through phyto-remediationand stabilisation.Map 19 outlines the areas of poor water quality and greatest nitrate sensitivity in the region. A focus upon Entry and Higher Level Schemeand the wider adoption of environmentally friendly agricultural practices and the creation of riparian habitats in these areas may helpto improve water quality. It should be noted that the data used here accounts for the percentage of rivers in each local authority thathave a poor water quality rating, but does not account for the total area of river that this represents. Use of primary EA Water qualitydata (not available to this study for licencing reasons) would improve the geographical accuracy of this map.33
5.0PUBLIC BENEFIT MAPS –THE EVIDENCE BASEPhotograph © Nathalie HeuberMAP 20: AIR QUALITYMap 20 highlights the areas of worst air quality in the region based upon the ODPM 2001 Index of Deprivation Air Quality Indicator,and EA data. There is a clear pattern of high pollution associated with the M1 corridor and major road junctions especially aroundthe Three Cities areas.Trees can be beneficial to air quality in terms of the deposition of particulate matter and harmful gases (O3, NO2, CO, and HNO3).Roadside planting schemes are now common practice and have added benefits relating to infrastructure sustainability and noiseand visual screening as well as contributing to the wider climate through off-setting ‘carbon debt’.Upon the creation of digital boundaries outlining designated Air Quality Management Areas, their incorporation in similar futurestudies would be beneficial.34
5.0PUBLIC BENEFIT MAPS –THE EVIDENCE BASEMAP 21: RENEWABLE ENERGY POTENTIAL (BIOMASS)Productive agricultural land, where it is not constrained by environmental designation, offers the greatest opportunity for production ofenergy crops. The most productive land is in Lincolnshire, Leicestershire and <strong>North</strong>amptonshire. If energy crops can be managed insuch a way that they are assimilated into, and contribute to, the quality of the landscape for public enjoyment, then they can form partof <strong>Green</strong> <strong>Infrastructure</strong> – in the same way that farmland managed under Environmental Stewardship or similar regimes contribute tolocal environmental quality.Further consideration may be given to how and whether renewable energy production in the landscape can contribute to wider publicbenefit, rather than just the benefit of fossil fuel substitution.35
5.0PUBLIC BENEFIT MAPS –THE EVIDENCE BASEMAP 22: UNEMPLOYMENTMap 22 indicates areas of relatively high unemployment. GI can contribute indirectly to employment through the provision ofattractive settings for inward investment.GI can also make a more direct contribution through offering settings for schemes that encourage people into the world of work – forexample, various Community Forests in England specialise in providing training opportunities for excluded pupils and ex-prisoners.The environmental economy is a significant employer in the region. Part of this economy relies directly on GI. The RegionalBiodiversity Strategy estimates that the “environment/wildlife/biodiversity” sector contributes 71,000 jobs and 3% of the region’sgross domestic product. This makes it comparable in size to sectors such as construction and food and drink.36
5.0PUBLIC BENEFIT MAPS –THE EVIDENCE BASEPhotograph © River Nene Regional ParkMAP 23: ADULT QUALIFICATION LEVELSOne of the region’s aspirations is to be in the top 20 performing regions in Europe. To achieve this will require a continuing process ofskills acquisition to allow adaptation to knowledge-based, high-technology industries. <strong>Green</strong> <strong>Infrastructure</strong> can play a role in this attwo levels; firstly by creating a setting for higher-value industries to wish to locate into; secondly by enabling training opportunities e.g.skills in the environmental economy itself, plus also confidence-boosting basic skills for those returning to, or joining, the world of workfrom difficult personal circumstances.Map 23 reveals those areas where the working-age adult is relatively low qualified – indicating priority areas for investment.37
5.0PUBLIC BENEFIT MAPS –THE EVIDENCE BASEPhotograph © Nathalie HeuberMAP 24: ENVIRONMENTAL TOURISM ASSETS*Based upon data compiled prior to 21st July 2006Map 14 shows the location of all the region’s key natural and cultural assets, whether or not they are an attraction in their ownright. For many such assets, their ability to sustain visitor numbers is key to their financial viability and manage-ability. As notedearlier (Map 22), such assets can also sustain jobs and businesses. For example, the RSPB estimates that each visitor to the <strong>North</strong>Norfolk Coast nature reserves spends £14 and that £30-40,000 pounds spent equates to the employment of one full time post.Sherwood Forest National Nature Reserve receives over 500,000 visitors a year.This Map shows the location of those assets which, or are most likely to, sustain a tourism-related business. Also included is a500m buffer around each of these assets to reflect a zone within which GI plays a supporting role to an environmental business.38
5.0PUBLIC BENEFIT MAPS –THE EVIDENCE BASEMAP 25: BUSINESS DENSITY*Based upon data compiled prior to 21st July 2006Business Density is a reasonable proxy for the areas where innovation and entrepreneurship is most likely to occur at a significant scale.One factor influencing the region’s future prospects is the relative difficulty some areas (Leicester Shire, for example) have inretaining graduates.GI can play a role in creating and maintaining an accessible and high-quality landscape which will be one positive factor influencing theretention and attraction of high-calibre skilled workforces and an entrepreneurial labour market.39
5.0PUBLIC BENEFIT MAPS –THE EVIDENCE BASEMAP 26: ECONOMIC REGENERATION INITIATIVESMap 26 shows a range of economic initiative areas acting within the region. Some areas are covered by several overlapping initiatives.<strong>Green</strong> infrastructure forms an important part of regeneration efforts. Often areas of social and economic blight are alsoundergoing environmental decline, particularly at neighbourhood level.<strong>Green</strong> space improvements can result in up-skilling and confidence building measures for inward investment. Other initiativesare focussing on rapid population and economic growth, here <strong>Green</strong> <strong>Infrastructure</strong> is seen as creating an appropriate setting forsuch growth.40
5.0PUBLIC BENEFIT MAPS –THE EVIDENCE BASEPhotograph © Nathalie HeuberMAP 27: GATEWAYS TO ECONOMIC AREASMap 27 shows the primary transport routes through the region. Areas shown in brown are nodes and gateways where certain businesslocations are optimal. The quality of GI and the environment in such areas is an influence on inward investment decisions.The Map could be further refined through local knowledge and incorporation of data on strategic sites for inward investment.41
6.0COMBINING THE EVIDENCE –TOWARDS A PUBLICBENEFIT ASSESSMENT6.0 COMBINING THE EVIDENCE –TOWARDS A PUBLIC BENEFIT ASSESSMENT6.1 Maps 1 to 27 have illustrated a range of indicators of mostrelevance to how GI might support the delivery of the EastMidlands’ Integrated Regional Strategy. It will be recognisedthat these maps are interlinked.6.2 The key to the study was to illustrate how the mass of indicatordata and maps can be combined in such a way as tohighlight those areas of the East Midlands where uplift inquantity and/or quality of GI is most critical to the region’ssustainable development.6.3 <strong>Public</strong> benefit will generally be greatest where social,economic and environmental outcomes are delivered in parallel.6.8 The use of kilometre square grids might be thought to be arather broad scale of focus, especially as many of the build-upmaps are constructed at much finer scales of analysis.However, the combination exercise, even usingsophisticatedGIS, is resource-hungry; and to map the whole region at finerscales would require more memory than was available.6.9 To overcome concerns about local hotspots of need beingobscured, the score that was used for each kilometre squarewas calculated on the basis of the highest scoring pointanywhere within that square. At a regional spatial scale, it isfelt that the results are more than adequate; although forlocal prioritisation exercises, a finer scale of mapping wouldbe desirable and feasible.COMBINED MULTIPLE BENEFITS MAP6.4 With this in mind, the single-issue evidence base shown inMaps 1 – 27 was combined to build a picture of where greatestsocial, environmental and/or economic benefit might arise.SOCIAL, ENVIRONMENTAL & ECONOMIC BENEFITS MAPS6.5 For all 27 maps, the region was broken down into 1km gridsquares. Within each of these maps, and based upon itspotential to deliver GI benefits, a score from zero to three wasassigned to each square. Scores were then totalled for eachIRS theme (social, environmental and economic).6.6 For example, as thirteen maps were generated torepresent the public benefits GI could contribute towards theIRS`s social objectives, the maximum score any square couldtotal under the social theme would be 39 (13 x 3).6.10 Because of the unequal number of indicators for eachtheme, aggregating them into a single combined public benefitsmap would disproportionately weight the theme with thehighest number of maps (in this case, the social outcomes).6.11 To avoid this, the range of scores were equalised into 10quantiles, with scores ranging from 1 - 10 (10 being the areasof greatest benefit, and 1 the lowest). The individually themedmaps were then overlaid and the score for each grid squarewas again aggregated to a maximum possible value of 30 (10x 3). In this way all the scores from across all the three themeswere aggregated, but with an equal (33.3%) weighting tosocial, economic and environmental themes.6.12 This resulted in the following suite of maps, described onthe following pages:6.7 For each of the three themes, a map is produced showingthe region in scoring “bands” relating to the potential togenerate public benefits (maps 28a – 30b).Map 28a Potential Social <strong>Benefit</strong> arising from GI DeliveryMap 28b: Potential Social <strong>Benefit</strong> arising from GI Delivery(3D visualisation)Map 29a: Potential Environmental <strong>Benefit</strong> arising fromGI DeliveryMap 29b: Potential Environmental <strong>Benefit</strong> arising fromGI Delivery (3D visualisation)Map 30a: Potential Economic <strong>Benefit</strong> arising fromGI DeliveryMap 30b: Potential Economic <strong>Benefit</strong> arising fromGI Delivery (3D visualisation)42Map 31a: Combined Multiple <strong>Benefit</strong> arising from GI DeliveryMap 31b: Combined Multiple <strong>Benefit</strong> arising from GI Delivery(3D viualisation)Map 31c: Combined Multiple <strong>Benefit</strong> arising from GI DeliveryEmphasising top 30% environmental benefits
6.0COMBINING THE EVIDENCE –TOWARDS A PUBLICBENEFIT ASSESSMENTMAP 28A: POTENTIAL SOCIAL BENEFIT ARISINGFROM GREEN INFRASTRUCTURE DELIVERY*Based upon data compiled prior to 21st July 20066.13 A combined map of social benefit arising from GI ispresented at Figure 28A (in 2D) and 28B (in 3D). The colourscale is banded from blue (low) through green, yellow andorange and red (high). The greatest social benefits from GIinevitably will be felt where there are the highest populationdensities, particularly where there are issues of communitydiversity or community need for doorstep GI.6.14 For example, areas where there are significant numbersof the young and old, coupled with issues of poor generalhealth, mean that there is a particular potential benefit fromdoorstep GI of high quality to meet the needs of people whodo not enjoy the mobility benefits that come with good healthand good income.6.15 Study of figures 28A and 28B shows that the social benefitis particularly concentrated around the Three Cities Areas,the Derbyshire and <strong>North</strong> Nottinghamshire coalfields, theLincolnshire coast and the <strong>North</strong>amptonshire Growth Areas.6.16 In the case of the growth areas and growth points (Map2), there will be sustained pressure on the existing GI arisingfrom the projected increase in population. Maps 7 and 8indicate that these areas are already subject to highpopulation densities and significant demand for open space.Maps 15 and 16 show the open spaces in these areas are allalready short in biodiversity and greenspace interest. Map 9also shows that some of these areas have open spaces whichare not managed in accordance with community aspirations.43
6.0COMBINING THE EVIDENCE –TOWARDS A PUBLICBENEFIT ASSESSMENT6.17 The weight of this evidence suggests that a very significantinvestment in GI will be needed in these growth areas inorder to ensure that population growth is sustainable in termsof community development and impact on the environmentand enjoyment of the environment.6.18 Initiatives such as the Community Forests elsewhere inurban fringe Britain and the National Forest have shown thatlandowners can be persuaded to manage their land for publicbenefit provided that adequate resources are available.Although the resources needed to implement initiatives suchas the National Forest are somewhat higher than hashistorically been the case for rural and urban fringecountryside management practices, nevertheless the actualsums involved are extremely economic forms of regeneration(figures such as £10K - £15K per hectare are cited by theNational Forest as being needed to encourage a privatelandowner to dedicate his open land as GI for the neighbourhood).In areas such as those shown in red on Map 28, such levels ofinvestment seem to provide excellent value for money.6.19 There is a need for local knowledge and communityvalues to be considered before formulating an interventionstrategy for any particular place. An example of how this canbe achieved is the recent feasibility study for a CommunityForest around Leicester (TEP, 2006). This used national,regional and local datasets to precisely map the levels of localsocial need; and levels of demand for, and deficit of GI.Consultation also formed a part of the feasibility study toensure local values and aspirations formed part of theappraisal of benefit of GI.6.20 Similarly, in Boston, there is an active community groupaiming to establish a network of woods around the town toprovide more outlets for informal recreation. Map 28 showsthat there is strong evidence for the social benefits of GIaround Boston (although small, a number of red and orangepatches are evident in and around Boston). In a situation ofcompeting resources, such evidence may indeed reinforce anyapplication the Boston Woodland Group might make for publicfunds towards their aspiration, and reinforces a need forpolicy-making to stimulate opening – up of land around thetown for GI. However, it will be a matter for local knowledge todetermine the optimum locations around the town for actualGI implementation.MAP 28B:POTENTIAL SOCIAL BENEFITARISING FROM GREENINFRASTRUCTURE DELIVERY(3 DIMENSIONAL REPRESENTATION)44
6.0COMBINING THE EVIDENCE –TOWARDS A PUBLICBENEFIT ASSESSMENTMAP 29A: POTENTIAL ENVIRONMENTAL BENEFIT ARISINGFROM GREEN INFRASTRUCTURE DELIVERY*Based upon data compiled prior to 21st July 20066.21 Figure 29A (2D) and 29B (3D) shown the potentialenvironmental benefit from GI enhancement.6.22 The areas of greatest potential benefit tend to fall intotwo categories. On one hand, the “crown jewels” such asSSSIs, Scheduled Ancient Monuments and strategic rivervalleys will benefit particularly from investment becausethese form the backbone of the <strong>Green</strong> <strong>Infrastructure</strong> for theregion. Investment here needs to be targeted particularly atrestoration of declining assets, along with buffering andconnecting assets with each other.6.23 On the other hand, there are many areas which are inenvironmental deficit, i.e. they are suffering a shortage ofbiodiversity interests, air quality/water quality problems.This has happened due to the significant long term attritionaffects of agricultural enhancement and urbanisation.However, in these environmentally-deprived areas, theprioritisation tool suggests that public benefit potentialis greatest where habitat creation works can jointlyaddress water quality, flood risk and environmentalconnectivity issues.45
6.0COMBINING THE EVIDENCE –TOWARDS A PUBLICBENEFIT ASSESSMENT6.24 The beauty of the public benefit approach to environmentalenhancement is that those locations which are in greatestenvironmental deficit but, at the same time, have the greatestopportunity for uplift can be identified. This will allow forbetter targeting of investment. Where such an investment canalso yield social and / or economic returns particularly interms of community enjoyment of natural greenspaces thenthere is surely the strongest case for investment.6.25 Even within the environmental sector alone, prioritisationof investment for GI management is needed since the scale ofthe task is so great. Maps such as 18 (GI Connectivity) showwhere an environmental skeleton can be re-built in order toact as a framework for sustained environmental enhancementin the long term. This is a starting point from which tointerpret how to create networks of green infrastructure at astrategic level. Further development of mapping techniquesand incorporation of local knowledge can only enhance theability to flesh out these skeletons of connectivity which can beprioritised in Local Development Frameworks. We can thenwork down through the layers to identify appropriatesituations for local delivery.6.26 For example, it is important to be aware that certaindatasets relating to public rights of way are not included in theanalysis. The addition of data showing where public access toopen space is poor would help map need. Conversely, areaswhere the PROW network is well-developed offer a “skeleton”for reconstruction of other environmental and culturalnetworks.6.27 It would be useful to build in local knowledge where thisis available. This may be particularly relevant to local heritagefeatures which are not necessarily mapped consistentlyacross the region. It is known that some areas, for examplesome parts of the River Nene Regional Park and parts of aputative Sherwood Regional Park appear relatively devoid ofregionally or nationally-significant heritage, but do supportnumerous pockets of local heritage which collectively producea rich landscape.6.28 Further thinking is needed on how to value, at a regionallevel, such areas where there is high sub-regional interestand high potential for enhancement. As noted above, furtherdevelopment of tools for mapping how environmentalinfrastructure might be re-built could be considered (as isoccurring in the River Nene). Another approach might be toensure a priority for the environmental focus in the multiplebenefitmap stages, for example biodiversity enhancementareas – see discussion below in relation to Map 31C.MAP 29B:POTENTIAL ENVIRONMENTALBENEFIT ARISING FROM GREENINFRASTRUCTURE DELIVERY(3 DIMENSIONAL REPRESENTATION)46
6.0COMBINING THE EVIDENCE –TOWARDS A PUBLICBENEFIT ASSESSMENTMAP 30A: POTENTIAL ECONOMIC BENEFIT ARISINGFROM GREEN INFRASTRUCTURE DELIVERY*Based upon data compiled prior to 21st July 20066.29 The potential economic benefit of GI is shown on Figure30A (2D) and 30B (3D), showing an economic benefit profilenot dissimilar to that for social benefit (Figure 28A). Thegreatest case for economic benefit is in the Three Cities Areaand around strategic economic gateways. In addition certainkey areas of natural assets such as the Peak District NationalPark, Lincolnshire Wolds AONB and the Lincolnshire coastalso feature reasonably highly in terms of potential tourismand environmental economy benefits.6.30 A reasonably high number of rural areas also show thepotential for economic benefits which can be obtainedthrough GI investments and this may be a theme for theRegional Rural Development Framework.6.31 The Regional Development Agencies and Sub-RegionalEconomic Partnerships across Britain all acknowledge thatquality of environment is critical to economic profile. TheEast Midlands sets out to be one of the 20 top regions inEurope in terms of economic performance. Hopefully thisaspiration will be translated into an investment in GI forsocial and economic benefit.47
6.0COMBINING THE EVIDENCE –TOWARDS A PUBLICBENEFIT ASSESSMENTPhotograph © Nathalie Heuber6.32 Unfortunately, there is relatively little research evidenceconcerning the economic value of GI in attracting inwardinvestment. There is substantial anecdotal evidence thatenvironment is an important factor in location of knowledgebased industries and is an important factor in the retention ofhigh calibre high skilled workers and graduates. This absenceof research is being addressed by various academic studies,including some work at Sheffield Hallam University.6.33 Figure 30A suggests those areas where economicbenefit might be greatest. However it is recognised that eachlocation will require a specific solution to environmentalenhancement. It is also recognised that environmentalinvestment in one area can actually deliver benefits in asurrounding neighbourhood or “catchment”. A typical examplemight be where investment in a sub-regional strategictrail may generate jobs in the tourism sector at some distancefrom the trail itself.6.34 This lends weight to an argument that an investment inGI should be seen as a cross cutting approach so that benefitsare not felt merely at the site of the environmentalimprovement but also in the catchment surrounding the site.6.35 In these terms, the social catchment can mean theneighbourhood, the environmental catchment can mean thesurrounding natural area or landscape) and the economiccatchment can mean the drive to work zone.MAP 30B:POTENTIAL ECONOMIC BENEFITARISING FROM GREENINFRASTRUCTURE DELIVERY(3 DIMENSIONAL REPRESENTATION)48
6.0COMBINING THE EVIDENCE –TOWARDS A PUBLICBENEFIT ASSESSMENTMAP 31A: COMBINED MULTIPLE PUBLIC BENEFIT ARISINGFROM GREEN INFRASTRUCTURE DELIVERY*Based upon data compiled prior to 21st July 20066.36 The public benefit arising from each of the individualsectors can be combined. In this process the social,environmental and economic benefits are weighted equally,thus Map 31A (2D) and 31B (3D) show in red those areaswhere there is the highest combined score for all categoriesof sustainable land management. These are areas wheresocial, environment and economic needs and opportunitiesare greatest individually and in combination.6.37 In short, Map 31A shows those areas where investmentin GI can achieve the highest returns in terms of the greatestnumber of objectives of the Integrated Regional Strategy.49This is entirely consistent with Government investmentprinciples where public interventions should be firmlyevidence-based and should be targeted at communities andenvironments indemonstrable need and where there isgreatest opportunity to make a difference.6.38 The key areas of potential public benefit are in theStrategic River Corridors, the Three Cities sub area, the<strong>North</strong>amptonshire Growth Area centres, the <strong>North</strong>ern subarea and the Lincolnshire coast. Although these results areperhaps not surprising this is a clarion call to really focus GIinvestment into these areas.
6.0COMBINING THE EVIDENCE –TOWARDS A PUBLICBENEFIT ASSESSMENT6.39 The very significant commitment made by Government tothe River Nene Regional Park and other GI in the<strong>North</strong>amptonshire Growth Areas is to be welcomed. However,Map 31A reminds us that equal, and in some cases greater,public benefit can be achieved by GI investment elsewhere inthe region.6.40 Map 31A gives a regional overview, taking account of allthe objectives of the integrated regional strategy. Of course,there will be many individual delivery vehicles for economicregeneration, health improvement, education, environmentetc. Each of these delivery vehicles will have their own remitsand their own specific objectives. Maps like this can help suchprogrammes to direct their interventions towards those areaswhere GI does bring the greatest cross cutting benefit.6.41 Just as importantly, the data underpinning Map 31A canbe disaggregated to help programme managers understandwhere best their own priorities might be delivered; and alsounderstand what other IRS objectives need delivery in theirown priority areas. This may help build new partnerships forcross-cutting action.6.42 For example, Environmental Stewardship programmemanagers (whose primary remit is protection andmanagement of key environmental assets) can identify fromMaps such as 14, 15, 16 and 29 where their funds might bebest targeted. They can also examine maps such as 28, 30 and31 to see if any of their priority areas are also highly-rankedfor cross-cutting benefit – these might become the top-priorityareas for intervention and for establishing new partnerships.Such new partnerships might lead to, say, strategies forhealthy food and lifestyle promotion on farms close to urbanareas of low health.6.43 Another example is that a sport-orientated deliveryvehicle will naturally take account of health data as well asdata on sport provision. However, in addition, data from mapssuch as 17 (environmental connectivity) show how creatinglong distance links for cycling, horse riding, walking throughthe landscape can simultaneously contribute towardenvironmental connectivity.MAP 31B:COMBINED MULTIPLE PUBLICBENEFIT ARISING FROM GREENINFRASTRUCTURE DELIVERY(3 DIMENSIONAL REPRESENTATION)50
6.0COMBINING THE EVIDENCE –TOWARDS A PUBLICBENEFIT ASSESSMENTPhotograph © River Nene Regional ParkMAP 31C: COMBINED MULTIPLE PUBLIC BENEFIT EMPHASISINGTOP 30% ENVIRONMENTAL BENEFITS*Based upon data compiled prior to 21st July 200651
6.0COMBINING THE EVIDENCE –TOWARDS A PUBLICBENEFIT ASSESSMENT6.44 One concern of the Steering Group is that GI is anenvironmental investment, albeit equally valid for social andeconomic outcomes. There is therefore a danger that infocussing only on multiple benefits, areas which provide highlevels of environmental benefit might be ignored if they do notprovide simultaneous socio-economic outcomes.6.45 In order to capture those areas of high environmentalbenefit, Map 31C was produced. This is a multiple-benefit mapbut also highlights those areas where environmental benefitwas in the top 30% of scores – even if such areas do not scorehighly on multiple-benefit.6.46 Map 31C does of course capture all the multiple benefitareas but also includes certain buffer areas and strategic rivervalleys and low-lying landscapes.6.50 This suggests that GI policy and investment does make ademonstrable difference when targeted. However, thegeneral picture in the East Midlands is of rather low gradelandscapes which have not enjoyed levels of investment in GI,nor enjoyed policy protection. A similar investment andpolicy-strengthening may be needed if the environmentalinfrastructure is to be restored to a situation such as in theNational Park where it sustains a healthy economyand society.6.51 Initiatives such as the National Forest, although morerecent, are also successful examples of how targeted policyand land management can make a rapid impact on landscapequality and GI recreational / economic opportunities.6.47 One finding of interest is that the Peak National Parkdoes not feature in either Map 31A or Map 31C as being ofhighest public benefit in terms of its GI. This may be becausethe general thrust of the IRS focuses on quality of life - inparticular for communities with relatively poor health, skillsand employment.6.48 The IRS also focuses on improvements to environmentalquality and environmental infrastructure. Particular emphasisis placed on reversing the decades of environmental declineprevalent throughout the region.6.49 By contrast the National Park scores very highly on alimited number of indicators such as protection of assets ofhighest environmental quality and its role as strategicgreenspace and as a tourism asset. However, the fact that itis by-and-large reasonably affluent with reasonably good skilllevels and a high environmental quality means that, under thecriteria of the present IRS, the potential for public benefit of GIcreation, management and enhancement may be greaterelsewhere. The fact that the National Park appears generallyin reasonable condition is a testament to the efficacy of policyand investment in GI in past decades.52
7.0SUMMARY ANDCONCLUSIONS7.0 SUMMARY AND CONCLUSIONS7.1 <strong>Green</strong> <strong>Infrastructure</strong> (GI) is now recognised in nationaland regional policy as a desirable outcome – bringing a rangeof “public benefits”7.6 These <strong>Public</strong> <strong>Benefit</strong> maps allow a regional overview ofwhere intervention to promote GI will bring greatest publicbenefit. This is the essence of the PBRS approach.7.7 “Intervention for GI” can take many forms –7.2 In the East Midlands, the Integrated Regional Strategy(IRS) is a core reference point setting out what “publicbenefit” means for the region.7.3 GI is itself an implicit objective of the IRS. Just asimportantly, it also helps deliver many of the other IRSobjectives – e.g. health, good housing, economic prosperity.7.4 This study has gathered evidence from 27 differentsectors, all relevant to the IRS objectives, in order tomap where;A. there is the greatest need for the public benefits GI bringsB. there is the greatest opportunity for GI to supportsustainable economic growthC. such needs and opportunities can be met in parallel7.5 As well as mapping 27 different evidence bases, the studycombined the evidence in order to map where there isgreatest public benefit in terms of• Social outcomes• Environmental outcomes• Economic outcomes• Multiple (cross-cutting) outcomes• investment in landscape management, creation of newgreenspaces, enhancement / restoration / renewal of existinggreenspaces, increasing the number of functions that agreenspace provides, connecting patches of greenspace toform an environmental “skeleton”• policy-making to ensure that new hard development andinfrastructure is truly sustainable in terms of its environmental impact – not only for its own setting, but also “retro-fitting”GI in areas where it is in deficit due to past neglect.• bending of mainstream service delivery by Local Authoritiesand other public bodies so that GI uplift is considered as anoutcome of service delivery.• creation of new cross-cutting partnerships between varioussectors which may benefit from good GI.7.8 The study shows that it is possible to map the potentialpublic benefit GI can bring at a regional scale. However, it isrecognised that PBRS is not the “answer” to spatial planning– it is an aid to strategic planning and investment.The spatial insights it brings must be combined with localknowledge and community values in order to interveneappropriately to uplift GI.7.9 In addition, a spirit of entrepreneurship and innovation isneeded to ensure that a GI project takes off – at a macroscale,the success of the National Forest shows that the rightactivity, in the right place, by enthusiastic and well-resourcedteams can make a rapid and measurable difference.At a more local scale, the enthusiasm of the Boston Woods<strong>Project</strong> also highlights that environmental entrepreneurshipis essential to make a difference to neighbourhoods.53
7.0SUMMARY ANDCONCLUSIONSPhotograph © Nathalie Heuber7.10 The study acknowledges that certain indicators requirefurther refinement, but it is noted that data availability andconsistency is better now than it ever has been before.Particular areas for future refinement of regional scalemaps are;• Techniques for mapping how and where environmentalconnectivity might be most effectively built across presentlyimpoverished landscapes• Techniques for mapping deficit of accessible greenspace asexperienced on the ground – i.e. taking account of factorssuch as barriers to movement, or corridors which connectpeople to good quality open space (in line with PPG17objectives).7.11 The regional overview highlights areas of greatestpotential public benefit arising from GI uplift. However, thisneeds to be translated into action at a local level. The 2005<strong>Green</strong> <strong>Infrastructure</strong> Scoping Study demonstrated how thebaseline quantity, quality and functions of actual greenspacescan be mapped. The Study also showed how those sameactual greenspaces might widen the range of functions theypresently support.7.15 <strong>Green</strong> <strong>Infrastructure</strong> Planning will become an essentialpart of Local Development Frameworks and, in time, willbecome standard terminology for planning policy makers andin development control. Good practice guidance on how toimplement GI is already generally available (e.g. the MiltonKeynes guidance). However, there is still a need for guidanceto local policy-makers on;• How to word GI policies in Core strategy and otherLocal Frameworks• How to map GI priority areas in LDFs• How to negotiate development-specific GI Plans thataddress not only the needs of the specificdevelopment, but also the wider environment withinwhich the development sits.• How to integrate GI with emerging Local Area Agreements• How to embed GI within the operations and philosophyof Local Strategic Partnerships7.12 The Scoping Study showed how, within various pilot studyareas, which greenspaces are most capable of significantuplift in the range of functions – with the implication that suchgreenspaces should be prioritised for investment.7.13 The regional study will need to allow for sub-regionalmodification, to take account of local priorities and datasets.This sub-regional modification could be accomplished by• Altering the weightings used in the regional study• Removing indicators of little local priority• Adding new indicators of local priority• Adding closer definition through use of local datasets.7.14 In this regard, there are various examples of existinggood practice in the form of local greenspace audits andstrategies – some were highlighted at the stakeholder workshopreported at Appendix 2. It may be useful to compare the<strong>Public</strong> <strong>Benefit</strong> approach with the results of some of theseaudits to see how the public benefit approach might be refinedfor local application; and conversely to see if the audit resultsmight be informed by a <strong>Public</strong> <strong>Benefit</strong> approach.54
8.0RECOMMENDATIONSFOR FUTURE WORK8.1 DEVELOPING INDICATORS FOR GREEN INFRASTRUCTURE8.1.1 The spatial assessments made within this study arebased upon key environmental, social and economic datasets.Though there have been marked improvements in recentyears, a considerable number of fundamental social andenvironmental datasets remain unavailable or are unusabledue to issues of format, resolution, quality or accessibility.Examples include species distribution data, fear ofneighbourhood crime, qualitative assessments of greenspaceprovision, occurrence of respiratory diseases, numbers ofcommunity volunteers, accessible natural greenspacedistribution, obesity levels, tourist attractions and facilities,local and unitary development plan designations, etc.Some of these datasets relate directly to Governmentpolicy objectives.8.1.2 Limitations in the availability of such data directlyaffects the depth and range of assessments possible instudies of this nature. Without comprehensive data it isdifficult to identify areas in need of investment and to monitorthe effectiveness of intervention, particularly at neighbourhoodscales of analysis.It is recommended that a database of deficient indicators becompiled and a strategy be developed to encourageimprovements in their quality, consistency, resolutionand availability.public benefit. However, the EMGISS methodology wasextremely resource intensive and assessments were limitedto 9 discrete study areas. A regional GI resource map wouldbe required for assessments of this type to be madecomprehensively across the region.8.2.3 A number of studies have highlighted the need forcomprehensive GI mapping to inform the early stages ofstrategic GI planning 4 . A regional/national GI resource mapwould be an invaluable tool to enable:• Stock-taking – Assessment of the <strong>Green</strong> <strong>Infrastructure</strong>‘State of the Region / Nation’ and identification of greennetworks, environmental assets, deprivation, opportunitiesand potential• Monitoring – Assessment of the effectiveness of past,current and future initiatives in delivering functionallandscapes and public benefits through GI• Funding Procurement – Providing an evidence base forinvestment in particular areas and projects• Local Strategy Development – Informed prioritisation,matching need with opportunity• Information based planning tool - Greater understanding ofGI processes and landscape functionality through aninformation network and framework upon which to build8.2 GREEN INFRASTRUCTURE RESOURCE MAPPING8.2.1 This study was commissioned as a second stage tocomplement the East Midlands <strong>Green</strong> <strong>Infrastructure</strong> ScopingStudy (EMGISS). The EMGISS categorised greenspaces intofunctional types derived from Planning Policy Guidance (PPG)17 recommendations, to enable assessment of their form andfunction. The result was a methodology to highlight areaswith the greatest potential to increase their publicbenefit function.8.2.2 There is obvious merit in cross referencing these twostudies to reveal where there are opportunities to increase GIfunctionality and where this might generate the greatest• Influencing Policy & Taking the GI Agenda Forward –Increasing the understanding and profile of GI and itscontributions to quality of life8.2.4 The Department for Communities and Local Governmentis currently in the early stages of developing a map-basedurban greenspace database. Similar to the EMGISS it aims tofurther categorise greenspaces, identified within theGeneralised Land Use Database (GLUD), into more detailedtypologies. The typologies will be based upon Planning PolicyGuidance 17 recommendations and data will be drawn from anumber of local and national organisations and datasets. It isintended that the information will be shared via a map-basedinternet tool.4 Countryside Agency & Groundwork UK (2005) The Countryside In and Around Towns <strong>North</strong> <strong>West</strong> <strong>Green</strong> <strong>Infrastructure</strong> Think – Tank (2006) <strong>North</strong><strong>West</strong> <strong>Green</strong> <strong>Infrastructure</strong> Guide CUDEM (2006) The Countryside In and Around Towns - The <strong>Green</strong> <strong>Infrastructure</strong> of Yorkshire and the Humber55
8.0RECOMMENDATIONSFOR FUTURE WORK8.2.5 The urban greenspace database could provide a strongbasis for the creation of national and regional GI resourcemaps. The results of this <strong>Public</strong> <strong>Benefit</strong> study and the EMGISShave the potential to contribute positively towards itscompletion and application (i.e. the greenspace typologiesdevised, datasets used and <strong>Green</strong> <strong>Infrastructure</strong> StakeholderDatabase created).The Regional Assembly and relevant partner organisationsshould pro-actively contribute to the efficient and effectivecompletion of the urban greenspace database and towards thedevelopment of a robust GI resource map. Opportunitiesshould be taken to promote the region as a pilot for thenational database.8.3 DEFINING A GREEN INFRASTRUCTURE SKELETONFOR THE REGION8.3.3 It is evident that there are key aspects of Environmentaland <strong>Green</strong> <strong>Infrastructure</strong> upon which wider benefits depend,the most obvious of which being species preservation. Putsimply, without plants and animals there is no <strong>Green</strong><strong>Infrastructure</strong> – and hence no Environmental <strong>Infrastructure</strong>.8.3.4 Given the increasing number of threatened species andbiodiversity impoverishment, driven by continuing rates ofpopulation expansion, development and climate change,should we be focusing more upon the ‘heart and lung’ issuesof GI than the ‘wider circulation’ issues? For example, healthyecosystems provide fundamental economic benefits throughinsect pollination, pest control, natural resource sustainability(air, water and soil) and stimulating tourism. In comparisonthe economic gains derived from GI contributions to inspiringinnovation, entrepreneurship, or employment are lesssignificant and less dependant upon landscape scale planning.8.3.1 Both this study and the EMGISS gave equal emphasis toall social, economic and environmental objectives in order topromote the greatest number of public benefits from GIinvestments. During consultations, members of the steeringgroup proposed the following question:As a component of Environmental <strong>Infrastructure</strong>, should<strong>Green</strong> <strong>Infrastructure</strong> planning focus primarily uponenvironmental public benefits, with social and economic gainsconsidered in terms of their ‘additionality’?8.3.2 The consultants accept that GI investment must deliverenvironmental benefit as a core outcome. We recognise thatthere is a feeling in the environmental lobby that social andeconomic agendas receive a disproportionately highinvestment in comparison to the environment. However, wefeel that there is a danger of an ultimately sterile and fruitlessargument about precisely what weightings should be given tosocial / economic / environmental outcomes. Nevertheless,fundamental implications do become apparent whenconsidering a further question:Are there particular ‘keystone’ functions of <strong>Green</strong><strong>Infrastructure</strong> which are vital to the sustainable delivery ofhigh quality environments?8.3.5 Species survival is dependent upon habitat quality andconnectivity 5 . In this study, habitat quality and connectivityassessments affected approximately one sixth influence uponthe final Multiple <strong>Public</strong> <strong>Benefit</strong>s map (maps 31 a, b & c). Thissuggests that, in the pursuit of promoting multi-functionalitythe impact of the most vital GI objectives may be being diluted.8.3.6 One option might be to define a sustainable ‘GI skeleton’for the region (as discussed in Section 6.25) as a first stage toGI planning. Localised GI investments within this, prioritisedupon the basis of their additional social and economicbenefits, would then contribute to the vitality andmulti-functionality of a wider GI network. The approachadopted by the River Nene Regional Park <strong>Project</strong> 6 provides apragmatic and integrated example of how such ‘<strong>Green</strong>Corridors’ might be defined at a sub-regional level.Research is required to define a sustainable <strong>Green</strong><strong>Infrastructure</strong> skeleton for the region. This skeleton shoulddelineate where investments in GI would contribute to therestoration of intact ecological processes and underpin thesurvival of species and the long-term sustainability ofenvironmental quality.5 The UK Biodiversity Action Plan 2005 Reporting Round states that habitat loss/degradation and global warming are the current or emergingthreats of significance to the highest proportion of priority species and habitats.6 LDA Design (2006) Making the Connection - <strong>Green</strong> <strong>Infrastructure</strong> in <strong>North</strong>amptonshire, Strategic Framework Study for <strong>West</strong> <strong>North</strong>amptonshire,River Nene Regional Park 7 Ling C., J. Handley & J. Rodwell (2003) 'Multifunctionality and scale in post-industrial land regeneration' in Moore,H.M., Fox, H.R., Elliott, S. eds.: Land Reclamation - Extending the Boundaries - Proceedings 7th International Conference, Runcorn, UK, 13 - 16May 2003, Rotterdam: Balkeema56
8.0RECOMMENDATIONSFOR FUTURE WORK8.4 MULTI-FUNCTIONALITY AND SCALE8.4.1 Both this study and the EMGISS promote a ‘mixed-use’approach to the development and management of GI in orderto optimise landscape functionality. This ‘multifunctional’approach to landscape planning has many benefits and hasbeen identified as a key requirement in the creation ofsustainable and cost-effective landscapes 7 .8.4.2 The ‘multifunctional’ approach also encourages theformation and collaboration of partnerships by investing inprojects which have the potential to deliver combinedbenefits. It promotes the identification of wider stakeholdersthat may be effectors of landscape change (eg. governmentorganisations and developers) and stakeholders that may beaffected by such change (eg. local communities and wildlife).Further it promotes collaboration and consensus-buildingbetween diverse bodies and competing interests.8.4.3 ‘Multi-functionality’ is therefore a key component ofsustainable GI planning. It is proposed here, however, thatthere is the need for further research into how best to assess‘multi-functionality’ in relation to political and landscapeplanning scales:• Political scale – Both of these studies identified the spatialand economic planning objectives of greatest importance tothe region and assessed the potential of GI to contribute tothese across the region. It is recognised that furtherimprovements can be made by including planning priorities ata finer scale (eg. sub-regional, county, local authority leveletc). Scores might then be coalesced to enable a regional mapand cross-regional comparisons to be drawn whilstaccounting for more localised planning agendas.It may then, be more appropriate to measure the multifunctionalityof landscapes, within which individual sites maycontribute any number of public benefit functions. The extentof such ‘landscapes’ might be defined in relation to thecommunities, processes and/or wildlife they serve.Information regarding the quality of functional provisionwould be an invaluable addition to such assessments. Againthe ability to draw cross-regional comparisons wouldbe essential.Multi-functionality should be promoted as a core valueof <strong>Green</strong> <strong>Infrastructure</strong> planning. Future methodologies forthe mapping and assessment of GI multi-functionalityshould define appropriate political and landscape scalesfor assessment.8.5 CREATING A GREEN INFRASTRUCTURE GUIDEFOR THE REGION8.5.1 The Seminar and workshops held at Melton Mowbray inMay went some way towards disseminating information on GIfrom recent projects in the East Midlands and to outliningtheir relevance to the Regional Plan and wider policies.However, there is still much that can be done to increaseawareness, understanding and guidance on GI issuesamongst the wider regional audience of planners, developers,local practitioners etc.• Landscape Scale – Multi-functionality is a component of,but does not in itself constitute, a high quality environment.Particularly in relation to smaller sites, simply assessing thenumber of functions that a site provides, may not give anaccurate representation of its environmental quality. Forexample, allowing visitors to access an area of coastalsand-dunes may increase its functionality but might at thesame time reduce its environmental quality and long-termsustainability through erosion.57
8.0RECOMMENDATIONSFOR FUTURE WORK8.5.2 A number of GI guides and prospectuses 8 have recentlybeen produced to increase the awareness of GI issues inrelation to specific contexts and agendas. A GI guide for theEast Midlands might aspire to:planners and strategists from a range of backgrounds andwould accommodate for differing scales, resources andagendas. The GIPT could be made publicly available viathe internet.• Provide information and guidance on GI issues forpolicy-makers and planners (as outlined in section 7.15).• Provide guidance on technical aspects of GI planningand mapping• Encourage GI investment, particularly in areas of need andfor the long-term management of GI• Provide a springboard from which to launch the formation ofa ‘<strong>Green</strong> <strong>Infrastructure</strong> Network’• Invoke the interest, resources and collaboration of widerstakeholders such as developers, academics and localcommunity and specific interest groups• Raise standards of GI provision (quality / quantity /connectivity) within new developments• Increase the delivery of GI through mainstream supportprogrammes, especially in the land and agricultural sector.A <strong>Green</strong> <strong>Infrastructure</strong> Guide for the East Midlands should bedrawn up to disseminate information, encourage regionalpartnerships and promote GI in a range of regional arenas.8.6 DEVELOPING A GREEN INFRASTRUCTUREPLANNING TOOLKITA <strong>Green</strong> <strong>Infrastructure</strong> Planning Toolkit should be developedas a guide to highlight planning priorities & best practice forlocal and sub-regional planners.8.7 PROMOTING A REGIONAL ‘GREEN INFRASTRUCTURENETWORK’ (GIN)8.7.1 Recent GI projects have revealed a great deal of interestand enthusiasm for GI planning across a range of regionalstakeholders. This is an encouraging climate within which tobuild a regional partnership or ‘<strong>Green</strong> <strong>Infrastructure</strong> Network’(GIN) and a consensus for action.8.7.2 The formation of a GI Stakeholder Database within thiscommission was a starting point from which to identifypotential partners. Correspondence is now required toinstigate the next steps towards formation of the GIN. Inparticular a project outline needs to be drafted and circulatedto identify the remits, objectives, timescales, representativesand coordinators of the partnership. Regular correspondence,workshops and information will be required to generate andsustain momentum for action.The Assembly should instigate the next steps towards thedefinition and formation of the <strong>Green</strong> <strong>Infrastructure</strong> Network.Opportunities for correspondence and workshops should beutilised where possible.8.6.1 As noted above, a number of GI studies have recentlybeen published. Each has approached GI planning andassessment from a different perspective and has consequentlyinvested time and resources into the development of suitableand effective GI mapping and assessments methodologies.8.6.2 It may be possible to draw upon these precedents,together with the methodologies trialled in this study and theEMGISS to develop a <strong>Green</strong> <strong>Infrastructure</strong> Planning Toolkit(GIPT). This toolkit would provide support and guidance to8 The <strong>North</strong> <strong>West</strong> <strong>Green</strong> infrastructure Guide, ‘Planning Sustainable Communities: A <strong>Green</strong> <strong>Infrastructure</strong> Guide for Milton Keynes and the SouthMidlands', Cambridge <strong>Green</strong> <strong>Infrastructure</strong> Strategy, <strong>Green</strong> <strong>Infrastructure</strong> for the <strong>West</strong> Midlands (In Prep.),58
9.0 KEY REFERENCESCountryside Agency & Groundwork (2006)‘The Countryside in and Around Towns: A vision for connectingtown and country in the pursuit of sustainable development’.East Midlands Regional Assembly (2005)‘Options for Change, Review of the East Midlands RegionalPlan to 2026’Culture East Midlands (2001)‘Time for Culture: A Regional Cultural Strategy for theEast Midlands’East Midlands Regional Assembly (2006)‘Putting Wildlife Back on the Map: A Biodiversity Strategy forthe East Midlands’Department for Communities and Local Government (2003)‘Sustainable Communities: Building for the Future’<strong>Green</strong> <strong>Infrastructure</strong> Think Tank (2006)‘<strong>North</strong> <strong>West</strong> <strong>Green</strong> <strong>Infrastructure</strong> Guide’East Midlands Development Agency (2003)‘Regional Economic Strategy, Destination 2010’Government Office for the East Midlands (2004)‘East Midlands Regional Housing Strategy 2004 – 2010’East Midlands Development Agency & Advantage<strong>West</strong> Midlands (2005)‘Smart Growth the Midlands Way’ (Consultation Document)Government Office for the East Midlands (2006)‘East Midlands Rural Delivery Framework’(Consultation Draft)East Midlands Development Agency (2005)‘East Midlands Urban Action Plan 2005 - 2011’East Midlands Regional Assembly (2002)‘State of the Region Report’East Midlands Regional Assembly (2002)‘Regional Environment Strategy’East Midlands Regional Assembly (2003)‘Investment for Health, A public Health Strategy for theEast Midlands’HM Government (2005)‘Securing the Future: The UK Government SustainableDevelopment Strategy’Sport England (2004)‘Change 4 Sport in England’s East Midlands: A Regional Planfor Sport 2004 – 2008’TEP (2005)East Midlands <strong>Green</strong> <strong>Infrastructure</strong> Scoping StudyEast Midlands Regional Assembly (2005)‘Integrated Regional Strategy’59
9.0 ACKNOWLEDGEMENTS“GREEN INFRASTRUCTURE FOR THE EAST MIDLANDS – A PUBLIC BENEFIT MAPPING PROJECT” HASBEEN DEVELOPED BY THE EAST MIDLANDS REGIONAL ASSEMBLY’S ENVIRONMENT GROUP,WHO WOULD LIKE TO THANK THE FOLLOWING INDIVIDUALS AND ORGANISATIONS FOR THEIR TIME,INPUT AND GUIDANCE:GREEN INFRASTRUCTURE STEERING GROUP:Jon Baker, Environment AgencyAlex Bowness, Government Office for the East MidlandsAustin Brady, Forestry CommissionKaren Devonport, Natural EnglandMatt Doran (Chair), National TrustCharlotte Gault, East Midlands Wildlife TrustsSally Gill, Sport EnglandAlison Hepworth, East Midlands Regional AssemblyDavid Lepper, Natural EnglandJim Lennon, Natural EnglandJason Longhurst, River Nene Regional ParkJames Luger, East Midlands Development AgencyDavid Parker, Natural EnglandIan Paterson, Natural EnglandAnn Plackett, English HeritageDavid Slinger, Derby City CouncilAlan Smith, Groundwork East MidlandsAnd special thanks to John Bull60
APPENDIX ONEGREEN INFRASTRUCTURE RESPONSE TOTHE OBJECTIVES OF THE INTEGRATEDREGIONAL STRATEGYPhotograph © Nathalie HeuberTHEMEOBJECTIVEGREEN INFRASTRUCTUREBENEFITMAP THEMERANKING / SCORINGDATASETS1. To ensure thatthe existing andfuture housingstock meets thehousing needs ofall communitiesin the regionUplift values of existingstock through bettersurroundings and access togreenspace.Create accessible qualityenvironments for areas andzones of future growthProvide doorstep greenspacefor young families and elderlyMap 1: House PricesMap 2: GrowthPoints & AreasMap 3: PopulationAge Structure(Neighbourhoodswith highestproportion of 65 yr olds)Prioritise areas withthe lowest, bottomquartile house pricesPrioritise withingrowth areas and in a2km buffer aroundgrowth pointsPrioritise SOAs whereone or other demographicvariable is >regional averageODPM 1996-2005House PriceIndex.ODPMCensus StatisticsSocial2. To improvehealth andreduce healthinequalities bypromotinghealthylifestyles,protecting healthand providinghealth servicesProvide neighbourhoodgreenspaces for exerciseProvide a leafy environmentfor mental well-beingMap 4: HealthDeprivationMap 5: PopulationCatchment within300m (walkingdistance).Map 6: Open spacedeficiencyPrioritise wherehealth deprivation isgreatest Prioritiseareas of highestpopulation densityPrioritise top deficitquartilesIMD health,Census – selfreported‘notgood’ generalhealth”Census StatisticsANGSTGLUD datasets forgreenspace, wetlandand garden,Rural / urbanbenchmarked61
APPENDIX ONETHEMEOBJECTIVEGREEN INFRASTRUCTUREBENEFITMAP THEMERANKING / SCORINGDATASETS3. To providebetter opportunitiesfor people tovalue and enjoythe region’s heritageand participatein culturaland recreationalactivitiesProvide accessible greenspacesof significant sizenear areas of greatest populationdensityMap 7: PopulationCatchment within10kmMap 8: SportsFacilities (% of populationnot within 20minutes of a rangeof 3 sports facilities)Scale related topopulation densityQuartiles related to %of populationCensus StatisticsANGSTComprehensivePerformanceIndicators (SportEngland)Social(continued)4. To improvecommunitysafety, reducecrime and thefear of crime&5. To promoteand support thedevelopment andgrowth of socialcapital acrossthe communitiesof the regionMulti-functional wellmaintainedgreenspace willencourage greater usageand natural surveillanceMulti-functional greenspacecan provide a setting forcommunity events, projectsand meeting.Different ethnic groupsimbue open spaces with differentmeaningsEnvironmental Educationopportunities at schools canpromote connections of urbanchildren to natural worldMap 9: Quality ofLocal Parks andOpenspaces (% ofresidents who feelthe quality hasdeclined)Map 10: Quality ofCommunity Activities(% of residents whofeel the quality hasdeclined)Map 11: Communitydiversity by ethnicityMap 12: EducationDeprivationPrioritise lowestsatisfaction bands(>50%,>75%quartiles)Prioritise lowest satisfactionbands(>50%,>75%quartiles)Scale by degree ofdiversityScale for density &deprivationArea Profiles(AuditCommission)Area Profiles(AuditCommission)Census StatisticsSchool locationpoint data &Indices ofDeprivationEducationDeprivation(ODPM 2004)There is an associationbetween quality and quantityof greenspaces and levels ofmultiple deprivationMap 13: Index ofMultiple DeprivationScale consideringareas worse thanregional averageIndices ofMultipleDeprivation(ODPM 2004)62
APPENDIX ONETHEMEOBJECTIVEGREEN INFRASTRUCTUREBENEFITMAP THEMERANKING / SCORINGDATASETS6. To protect,enhance andmanage the richdiversity ofnatural, culturaland builtenvironment andarchaeologicalassets of theregionProtection and Managementof the region’s bestenvironmental assets is criticalgiven past lossesMap 14: Natural andCultural AssetsMap 15:EnvironmentalDecline (Trends inCondition of SSSIs,ScheduledMonuments &LandscapeCharacter Areas)Areas within 500mradius of natural /cultural assetsFeatures inunfavourable/ decliningcondition or atrisk. Landscapeschanges inconsistentwith characterEcologically, culturallyand historicallysignificant sites(various sources)English NatureSSSI units,CountrysideAgencyCountrysideQuality Counts &English HeritageScheduledMonuments atRiskEnvironmental7. To enhanceand conserve theenvironmentalquality of theregion byincreasing theenvironmentalinfrastructureCreation of ecologicallydiverse and distinctive habitatswill enhance biodiversity<strong>Green</strong>space contributes toclimate change adaptationand flood managementMap 16: BiodiversityEnhancement AreasMap 17: FloodAlleviation &Mitigation (Potentialfor existing openspace to contributeto climate changeadaptation)BiodiversityEnhancement Areasand strategic rivercorridorsScale depending onfloodzone 2,3 andamount of greenspaceRegionalBiodiversityStrategyFloodzone data(EnvironmentAgency) & GLUDStatistics (ODPM2005)<strong>Green</strong> networks connectenvironmental assets andallow ecological processes tofunction through the landscapeMap 18:Environmental<strong>Infrastructure</strong>ConnectivityGreatest potential toconnect wildlife habitats& cultural/historicassets alongsustainable transportroutesSUSTRANS data,ecologically designatedsites/areasof natural essenceand cultural/historicassets (variousdata sources)63
APPENDIX ONEPhotograph © River Nene Regional ParkTHEMEOBJECTIVEGREEN INFRASTRUCTUREBENEFITMAP THEMERANKING / SCORINGDATASETS8. To manageprudently thenatural resourcesof the regionincluding water,air quality, soiland mineralsWater quality improvementsthrough buffering and goodland management.Map 19: WaterQuality (% of riversof low chemical &biological waterquality & NitrateVulnerable Zones)Scale based on waterquality and nitrate vulnerabilityArea Profiles (AuditCommission)General River QualityAssessments andNitrate VulnerableZones (EnvironmentAgency)Air quality management,especially of particulatesthrough canopy interceptionMap 20: Air QualityScale based onair qualityIndices ofDeprivation AirQuality Indicator(ODPM 2004)Environmental(continued)9. To minimiseenergy usage andto develop theregion’srenewable energyresource, reducingdependency onnon-renewableresourcesScope for fuel production onproductive landMap 21: RenewableEnergy Potential(biomassScale based onAgricultural LandClassification gradesALC & Ecologicaldesignations10. To involvepeople throughchanges tolifestyles and atwork inpreventing andminimisingadverse local,regional andglobalenvironmentalimpacts<strong>Green</strong>space, particularly inurban areas, contributes toclimate change adaptationand flood managementSee Map 1764
APPENDIX ONEPhotograph © Nathalie HeuberTHEMEOBJECTIVEGREEN INFRASTRUCTUREBENEFITMAP THEMERANKING / SCORINGDATASETSEconomic11. To create highquality employmentopportunitiesand to developa culture of ongoingengagementand excellence inlearning andskills, giving theregion a competitiveedge in howwe acquire andexploit knowledge<strong>Green</strong> infrastructure canprovide opportunities forlearning and training, givingexcluded people opportunitiesto enter the world ofwork.The natural environmentalinheritance of the region canstimulate tourismMap 22:Unemployment (JSAClaimants & NewDeal participants)Map 23: AdultQualification LevelsMap 24:EnvironmentalTourism AssetsScale based on highernumbers of unemployedScale based on levelof adult qualificationsWithin 500m fromeach assetIndices ofDeprivationun-employment andnew deal indicator(ODPM 2004)Indices ofDeprivation workingadults with low orno qualificationsindicator (ODPM2004)Various12. To develop astrong culture ofenterprise andinnovation, creatinga climate withinwhich entrepreneursand worldclass businessescan flourishHigh quality environmentsare critical to sustaining aknowledge-based economywith retention of higherskills and high-value sectorsMap 25: BusinessDensity (number ofVAT-registeredbusinesses)Map 26: EconomicRegenerationInitiativesScale prioritisingareas of highestbusiness densityScale for prioritisingareas with mostregeneration initiativesVAT registered localunits andenterprisesNeighbourhoodRenewal Fund,Objective 2 wards(ODPM), LaggingRural Areas (Defra) &UrbanRegenerationCompanies &DevelopmentCorporations (various)13. To provide thephysical conditionsfor a moderneconomic structure,includinginfrastructure tosupport the use ofnew technologies<strong>Green</strong> infrastructureprovides a setting forinvestment, reversing blightand negative perceptionMap 27: Gateways toEconomic AreasScale based on distanceto, and importance ofcorridor, together withnumber of intersectionsof key corridors as aproxy for gatewaysMotorways,Primary Roads,Railways (StrategicSites & Derelictland would beaspirational)65
APPENDIX ONETHEMEOBJECTIVEGREEN INFRASTRUCTUREBENEFITMAP THEMERANKING / SCORINGDATASETSSpatial14. To ensurethat the locationof developmentmakes efficientuse of existingphysical infrastructureandhelps to reducethe need to travelN/AN/A15. To promoteand ensure highstandards of sustainabledesignand construction,optimising theuse of previouslydeveloped landand buildings<strong>Green</strong> approaches toredevelopment of urbanareas are critical to avoidnegative effects ofdensificationSee Map 7 –identifies existingdense areasSee notes for IRS 3See notes for IRS 316. To minimisewaste and toincrease there-use andrecycling ofwaste materialsN/AN/A17. To improveaccessibility tojobs and servicesby increasing theuse of publictransport, cyclingand walking andreduce trafficgrowth and congestion<strong>Green</strong>spaces can encourageadoption of cycling andwalking as a lifestyle choiceSee Maps 5 & 18See notes for IRS2 & 7See notes for IRS2 & 766
APPENDIX TWONOTES FROM THE PRESENTATION OF THEINTERIM REPORT AT A REGIONAL SPATIALSTRATEGY STAKEHOLDER WORKSHOPENVIRONMENTAL INFRASTRUCTURESEMINAR 31 MAY 2006,MELTON MOWBRAY REPORT OF SEMINAR DISCUSSIONSALISON MILLWARD, ALISON MILLWARD ASSOCIATES1 INTRODUCTIONEAST MIDLANDS REGIONAL ASSEMBLY (EMRA) HELD ASEMINAR ON 31MAY 2006 TO:• Update delegates on the Review of the RegionalSpatial Strategy (RSS)• Update delegates on the development of<strong>Green</strong> <strong>Infrastructure</strong> policy• Update delegates on the results of the <strong>Public</strong> <strong>Benefit</strong>Assessment (PBA) of <strong>Green</strong> <strong>Infrastructure</strong> (GI) in the region• Explore the possible uses of the PBA results and itssignificance to the RSS Review and other key agendas.This is a report of the panel discussion that followedpresentations on the emerging results of a recent consultationon the Options for Change for the RSS Review and the <strong>Public</strong><strong>Benefit</strong>s Assessment of GI across the whole region.The second part of the report summarises the points raisedduring roundtable discussions on the PBA.2 PANEL DISCUSSIONQ: Mick McGrath, Big Lottery Fund - what level of space sizedid you go down to, because if it was a minimum of 1ha itprobably would not have included many small but importantand valuable community green spaces, which BLF fund aswell as large spaces; and how accessible will the informationbe that you have collected to other organisations to help themprioritise funding?A: Francis Hesketh, TEP – every green space parcel from 1 sqm upwards was factored into the equation (rather thandiscreet green spaces) and then we compared those findingsto where the people were and what those communitiesneeded in terms of green space eg access to green spaceA: Francis Hesketh, TEP - all the datasets are already publiclyavailable – but you do need a GIS system to access them.Please see TEP’s final report for the individual maps and forfurther information about how to access the datasets.The report has been prepared by the independent facilitator ofthe seminar Alison Millward of Alison Millward Associates.Members of the consultants’ team from TEP, who carried outthe <strong>Public</strong> <strong>Benefit</strong> Assessment of GI in the region, andmembers of EMRA’s Environment Group, acted as facilitatorsfor the group discussions. The report is based on a taperecording of the panel discussion and notes taken by thegroup discussion facilitators.67
APPENDIX TWOPhotograph © Nathalie HeuberQ: Richard Austin, Boston, Lincolnshire – GI is often furtheraway than 300m from established housing estates, whichpeople will still want to see retained rather than bedeveloped - will this be an issue [if trying to influence theplanning system]: secondly, we need to stop speculative landbanking which is undermining efforts to acquire land for GI (ashas happened recently re Boston Woods project); thirdly, I amrather concerned that a potato field counts as green space justas much as a woodland for public access – is this a problem withthe PBA system?A: Francis Hesketh, TEP - PPG 17 tool is already available toassess the quality and quantity of open space in an area, butPBA evidence can be used to challenge developers about futureGI provision as part of new developments for new and existingresidents – we need to retro-fit new GI into new and existingcommunities where there is a deficit.A: Mary Beasley, EMRA – Local authorities can also usesection106 agreement negotiations with developers to provideGI, as well as other types of transport and retail infrastructurefor new communities.A: Regarding the potato field issue, the Generalised Land UseDatabase (GLUD) does not disaggregate typologies of greenspace. Under the PBA we have datasets which do provide anecological value rating for the green space and in relation toneighbouring land. A potato field on its own would probablyonly score on one of our attributes as green space, but if it hadancient woodland on either side, it would score more highlybecause it has the potential to link the ancient woodlands. If itwas close to a large number of people, it would score morehighly and if those people were older or younger it would scoreyet more highly. A: Mary Beasley, EMRA – it is difficult toaddress the banking issue at regional level. Local DevelopmentFrameworks should identify land to be protected and be builtinto GI.Q: David Lepper, Countryside Agency – there is additionalregional policy to be considered other than the RSS, which hasjust gone out to consultation - the Rural Action Plan and theRegional Rural Delivery Framework – which have both gotseven key priorities one of which is about improving andenhancing GI in the region: secondly, people should also look atthe Milton Keynes and South Midlands document on PlanningSustainable Communities and the recently published CentralLeicestershire GI strategy.A: Alison Hepworth, EMRA – there are many more strategies inplay – at regional level we need to hold it all together and addvalue to them.Q: Peter Winstanley, CPRE – has the PBA work had anyinfluence on the RSS housing option decisions and if not, howwill the PBA information be fed into refining that decision and soinfluence the work that is being done at a sub-regional levelbetween now and September 2006?A: Mary Beasley, EMRA - figures for annual growth in the housingmarket areas are just benchmarks at the moment. Moredetailed work to divide the figures up between districts isunderway – this will be related to other factors eg flood risk andother policy assumptions – the PBA results will be utilised inthis work. Other current work will also feed into the revised figureseg water management and soils projects.The Sustainability Appraisal will also make use of the PBAresults and EMRA will be promoting the results to the RSS subregionalworkshops during the summer.Q: Cllr Lucy Care, Derby City – the three cities and <strong>North</strong>amptonwere highlighted as being in need of GI but where to findadditional land for GI in Derby – we just have too many homesalready – so how can we apply these findings of need andpotential in urban areas? We may need to identify existing GIthat does not contribute to quality of life at the moment and thenidentify the positive opportunities to add social value to that GI.Can we strengthen the guidance of PPG13 on mixed land uses?Because of the brownfield use targets we are being pushedmore and more to say this piece of under used land can go tohousing and we are losing our PPG13 mix and we are adding tothe density of people, making it even more difficult to achieveour 2ha of natural green space within 300m of all homes. Theother side is to do with the opportunity to improve biodiversity –how can we apply more pressure to developers and localauthorities to say that green roofs matter and should be part ofsustainable construction?A: Francis Hesketh, TEP – PBA mapping does show thattargets may be undeliverable but that does not mean that weshould drop the targets, but use them to raise the bar for newdevelopments, especially given the pressures of densification –and promote greater multi-functionality for the GI we alreadyhave. We can also look at delivering alternative targets per 1000head of population eg for 20ha of accessible green space within2 kms of homes.68
APPENDIX TWOA: Mary Beasley, EMRA - In urban areas we do recognise thepotential of brownfield land for GI and other uses - policies inRegional Plan should help us resolve these tensions. Newbrownfield land will be created in the future and these couldbe used for GI. A: Ian Paterson, English Nature re green roofs– we must seek to influence the design of new buildings andtheir settings – see Biodiversity by Design (TCPA)http://www.tcpa.org.uk/downloads/TCPA_biodiversity_guide_lowres.pdf3 PUBLIC BENEFITS ASSESSMENT OF GI IN THEEAST MIDLANDSWhere a number of asterisks appear at the end of a point (**),these signify the number of tables (out of a total of 9) wherethe same point was made in the group discussions.3.1 PBA RESULTSProviding this type of evidence is valuable – it confirms whatwe think we already know is valuable (**). It must be kept upto date and used on a regular basis to inform changes toagendas eg EMDA’s economic regeneration agenda. It mustnot be allowed to ‘sit on a shelf’. There is a degree of trust inthe data, partly because it seems to confirm what we feel weknow and because it has not thrown up any surprises oranomalies (**). Happy to “take it down” to the local level. Canit be scaled down for local use?More detail on how the public benefits have been defined andclarification between needs and economic benefits, anddetails about the underlying assumptions, would all bewelcomed (***). There was also still some confusion about thedifferences between the definitions of ‘environmentalinfrastructure’ and ‘green infrastructure’.Does the scale of the assets affect their weighting in theanalysis of need and potential eg in the Peak District? Doesthe methodology undermine the importance of GI that onlyrequires protection and conservation eg in the Peak Districtwhich is already highly accessible, high quality and fulfillingits multi-functional potential, or GI that provides just one ortwo (but highly critical) functions such as flood control or rarespecies protection (**)?Why was only ANGST used to assess access standards?PPG17 encourages local authorities to develop localapproaches to assessing access standards. These standardsmay also be less relevant in areas with fewer buildings andtherefore no deficit in quantity although access may still bedifficult or quality poor. District green space audits, districtlandscape character assessments and habitat surveys wouldbe valuable data sets to use in PBA. The model needs tocapture local knowledge and community values if it is to beeffective at justifying need for local investment.The inclusion of the historic environment in the assessmentwas welcomed.The evidence should be usable by a wide range of organisationsand they should be able to compare the PBA results withevidence of their own (**) eg CPRE’s work on mapping areasof tranquillity. How can elements be extracted and used?Is the focus on quantity of provision of GI correct? Newmulti-functional GI can be provided on land which may alreadyhave high value for different functions of GI, which may evenbe destroyed eg where a children’s play area may be built onland in a high quality heritage landscape. Alternatively anarea with GI deficiency may be supplied with some GI of veryhigh quality and multi-functional GI which in partcompensates for the quantitative deficiency.Will this evidence deliver public benefit? Can the connectionbetween the choice of indicators and the differenceinvestment in GI will make to those indicators be demonstrated?What is it really telling use? What is the message to the lowpriority areas – business as usual?Can the results be used to express the environmental capacity ofthe region and local areas?The large scale of the mapping tends to mask the many smallerinitiatives that are under way and making a contribution (**).Is there a need for an agreed methodology for all GI work?Is the cost benefit analysis included in the scoring, becauseenvironmental asset creation costs vary?69
APPENDIX TWO3.2 SIGNIFICANCE OF PBA RESULTSLINKS TO THE INTEGRATED REGIONAL STRATEGY (IRS)There is a clear link to the IRS, so the PBA is rooted there.However, the use of 27 indicator datasets means that there willbe some conflict between desired outcomes, thus allowinggreen space needs to be played off against economic and socialneeds. This would mean that the outcomes of the PBA modelmight become muddied.PBA offers a useful tool to influence delivery through theplanning system. Will it influence provision of section 106 gainsoutside local authority areas? How can it be incorporated as a‘front loading’ mechanism for Development Control planning?<strong>Green</strong> space tends to do less well through application of section106 agreements than other community gain. More policy isrequired to link GI to other benefits such as affordable housing,renewable energy etc.INFLUENCING ALL PARTS OF THE RSS REVIEWThe results need to be used to challenge all parts of the RSSReview (***) eg all employment land (not just that required tobuild more big sheds); global warming; flood risk; andrenewable energy. GI policy should be embedded in all parts ofthe RSS and the policy wording needs to incorporate the views,knowledge and experience of local practitioners.The RSS should assert that Local Development Frameworks(LDFs) must include strongly worded x, y and z policies on GI(**). The evidence can be used to inform and resolve conflictingpolicy tensions, as in the case of <strong>North</strong>amptonshire’s growthagenda. There needs to be more emphasis in the RSS on GI, notjust jobs.Planners well understand the concepts of networks and accessbut find it more difficult to judge affects on biodiversity.GI must be designed in at the beginning in new towns.INFLUENCING THE REGENERATION AGENDAWill the results be used to ensure that we get better quality GIprovided on EMDA’s regeneration sites? A protocol for goodpractice would be useful not just for EMDA funded projects, butfor all developers. Was this something the Land RestorationTrust could help with?Could brownfield sites be developed as green buffer zones? Exemplarprojects are needed to support the decision-making process.Can the results be used to generate targets (**)? The wordingused on GI in the RSS Review will be crucial. Influencing thechoice of criteria used in the RSS for the application of thesequential approach re PPS3 will be crucial. How will thisbe done?As much evidence as possible will be needed eg on the uplift inland values, job creation possibilities and the like, to release fundsfrom economic development pots for GI improvements.Information about the Environmental Economy in the region wouldalso be useful (as has been collected for the <strong>West</strong> Midlands).INFLUENCING PLANNINGThere was a degree of uncertainty about how the results wouldbe used to influence policy development (***). Was it byidentifying particular locations for development or byDevelopment Control? Was it more for prioritising investmentdecisions? It would certainly provide stronger arguments forinfluencing and justifying planning decisions to developers.Local plans would only be influenced once the regional policyhad been updated.How can this type of methodology and the evidence it producesbe converted into a planning tool that could be taken to appeal?Could GI be seen as a land use designation and so protect itfrom further development (or speculative land banking followedby deliberate lack of management) or is it best to be able to usethe assessment of quantity and quality as a bargaining tool withdevelopers in defining mitigation measures?Should be able to use the evidence to define targets for theHigher Level Environmental Stewardship Scheme (**)PROTECTING AFFORDABLE HOUSINGIt was acknowledged that investment in the areas of GI deficitand greatest potential identified by the PBA would help to raisethe quality of the environment in the worst parts of the regionand across the region as a whole. However it was also notedthat this would cause house prices to rise which would make itmore difficult to protect affordable housing in the region. Thequestion was asked as to whether there was anything in theassessment methodology that could prevent this effect. Whilstno one knew the answer to this question, someone commentedthat the RSS would include a policy to help protect affordablehousing. Others felt that links should be made between policiesto embed the need for GI and the need to protect affordablehousing in Local Development Frameworks (LDFs).70
APPENDIX TWOPROTECTING GEMS OR EMPHASISING THE NEED FOR LINKAGEThere was a need to shift the focus away from protecting thegems of designated sites and landscapes (which the naturalassets mapping had concentrated on), and towards the widercountryside, the corridors and linkages between places, andareas of deprivation. This was of particular relevance giventhe proposed widening of the M1 which would destroy land ofvalue to wildlife within a corridor, some of which was alsodesignated.Developing the concept of spatial GI networks (****) atregional level would be crucial for delivery at the local leveland to persuade landowners of the significance of investing intheir part of the network. GI maps have been used successfullyin <strong>North</strong>amptonshire to influence land owners to convert tomore positive methods of land management, although carehas to be taken when using maps to avoid raising fears thatthat their land is going to be taken over by others.Developing local GI network maps would also be significantand should include hedgerows. These should be included inLDFs (***).Evidence could also be used to prioritise elements of theBiodiversity Action Plan. Linking the BAP to multi-functional benefitdelivery will generate momentum for action.PROMOTING THE CONCEPTRegional priorities must be identified. There was a need totake the GI agenda out to wider audiences (***) and to engagedistrict authorities in particular. Hard copies of maps and thelike must be available, not just the GIS versions.Political champions will be needed to ensure that new GI ismaintained.3.3 APPLICATION OF PBA RESULTS AT THE LOCAL LEVELLINKAGE BETWEEN DIFFERENT LEVELS OF POLICYTo be applicable at the local level (and therefore to make apractical difference to local communities), it was felt thatthere needed to be strong linkages between GI policy at theregional, sub-regional and local level, and the priorities ofexternal funders (**). This would be essential for local bodiesto be able to successfully tap in to regionally-decided fundingpriorities. The linkages needed to be strong and to fit well withlocal policies, but allow for some flexible interpretation,weightings and boundary adjustments at the local level.What will be the significance of Local Area Agreements to GI?Where does GI fit in with the business of Local StrategicPartnerships?There was a particular interest in being able to compare theresults of green space audits (as eg in Leicester, Ashfield)with the PBA results. The question was how could this bedone? Some case study material would be useful to illustratehow this can be done. Leicester City Council offered to assistwith this.DANGER OF FOCUSING ON THE WORST AREASThe regional picture had highlighted a number of priorityareas or hot spots requiring investment in GI, but there was afeeling that focusing efforts on these areas alone would bewrong (***). It would be better to look comprehensively at theneeds of discreet local areas, not just the regional hotspots.To do this would require more detailed information at the locallevel than seemed to be available from the PBA results as theywere presented. We need a more sophisticated way of targetingenvironmental intervention to patchy areas where a smallinvestment might actually link up a series of small patchesinto a proper network.People must understand that GI is about more than ecology.The PBA results should be a very useful tool in encouragingpartnership working at the regional, local and even internationallevel. It would be useful to establish a GI partnership ornetwork to share good practice and set firm targets. It shouldnot become dominated by specialists. It should be focused ondelivery (**) and the information needs of practitioners.It could adopt more of a task force approach to focus on thetarget areas.71
APPENDIX TWOSIGNIFICANCE OF MULTI-FUNCTIONALITY OF GREEN SPACEAT THE LOCAL LEVELAll people, rich and poor, will have to resist getting in their cars(if they have one) to travel long distances to places like the PeakDistrict in the future, therefore improving the multi-functionality of GI in all local areas, not just in the deprived areas willbe important. Whilst broad categories of function can beassigned at a regional level, it should be up to local authoritiesto refine those definitions at the local level and resolve theinevitable conflicts that arise eg between protecting LocalNature Reserve land and widening a road beside it to attractmore tourists into an area.FOCUSING ON IMPROVING QUALITYImproving the quality of existing GI, especially in areas withoutthe potential to add to the asset base will be important.PROVIDING SUB-REGIONAL AND DISTRICT PBA MAPSSeveral delegates would be keen to have a version of the PBAmap results defined by district authority boundaries to be ableto compare the potential with the current destination ofregional funding and therefore any mismatch between the two.The region should prioritise which districts have the greatestneed for GI investment (***) and which districts should progressswiftly with GI audits and strategies.Funding for ongoing management is an issue everywhere (****)including places already well provided for with GI eg Peak Park.We need a toolkit of how to do this and the various mechanismsthat could be used to maintain GI eg endowments, compulsorypurchase, establishment of friends groups, and tax breaks forpartners engaging in research and development on behalf of GIpartnerships (as in <strong>North</strong>amptonshire), as sustainability of GI iscrucial for the future (*****).We wll not be able to deliver all GI on the back of developmentusing section 106 monies (***), and especially not outside thegrowth areas and in areas of low quality housing (**).We will still need small scale funding opportunities and to getfarmers onside.Managed retreat on the Lincolnshire coast offers majoropportunity to create multi-functional GI.Discreet district wide PBA maps would also be appreciated(****) and at a smaller scale (**).DELIVERY AND LONG TERM MANAGEMENTFunding and delivery will have to happen through manydifferent organisations and departments within them. Jointworking and partnership approaches will be essential andshould allow for a more pro-active approach. This will bechallenging for many local authorities, not used to working oncross boundary issues.We must emphasise the need for multi-functional delivery.What about designing in climate change benefits? We need toencourage people to go beyond the minimum.Funding for GI may be available in the growth areas but notnecessarily elsewhere. This is why clear priorities are required.The PBA evidence should be useful in getting money.72
APPENDIX THREEEAST MIDLANDSPUBLIC BENEFITMAPPING PROJECTPhotograph © Nathalie Heuber73
APPENDIX THREE74
Photograph © River Nene Regional ParkEast Midlands Regional AssemblyThe Belvoir SuiteCouncil OfficesNottingham RoadMelton MowbrayLeicestershireLE13 0ULt: 01664 502555f: 01664 568201e: info@emra.gov.ukw: www.emra.gov.uk