Sediment accumulation and Holocene - OzCoasts
Sediment accumulation and Holocene - OzCoasts
Sediment accumulation and Holocene - OzCoasts

Create successful ePaper yourself
Turn your PDF publications into a flip-book with our unique Google optimized e-Paper software.
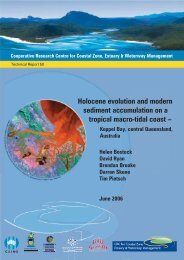
<strong>Sediment</strong> <strong>accumulation</strong> <strong>and</strong> <strong>Holocene</strong><br />
evolution of the Fitzroy River lower<br />
floodplain, central Queensl<strong>and</strong>, Australia<br />
Helen Bostock 1 , David Ryan 1 , Brendan Brooke 1 , Bob Packett 2 , Gary<br />
Hancock 3 Tim Pietsch 3 , Andy Revill 4 , Rhys Leeming 4 , Patrick Moss 5 <strong>and</strong> Kate<br />
Harle 6<br />
1 Petroleum <strong>and</strong> Marine Division, Geoscience Australia, Canberra, ACT<br />
2 Queensl<strong>and</strong> Department of Natural Resources, Mines <strong>and</strong> Water,<br />
Rockhampton, QLD<br />
3 CSIRO L<strong>and</strong> <strong>and</strong> Water, Black Mountain Laboratories, Canberra, ACT<br />
4 CSIRO Marine Research, Hobart, TAS<br />
5 Department of Geography, University of Queensl<strong>and</strong>, Brisbane, QLD<br />
6 CSIRO, Sustainable Ecosystems, Canberra, ACT<br />
2006
<strong>Sediment</strong> <strong>accumulation</strong> <strong>and</strong> <strong>Holocene</strong> evolution of the Fitzroy River lower floodplain<br />
<strong>Sediment</strong> <strong>accumulation</strong> <strong>and</strong> <strong>Holocene</strong> evolution of the Fitzroy River lower floodplain, central Queensl<strong>and</strong>, Australia<br />
Copyright © 2006:<br />
Cooperative Research Centre for Coastal Zone, Estuary <strong>and</strong> Waterway Management<br />
Written by:<br />
Helen Bostock<br />
David Ryan<br />
Brendan Brooke<br />
Bob Packett<br />
Gary Hancock<br />
Tim Pietsch<br />
Andy Revill<br />
Rhys Leeming<br />
Patrick Moss<br />
Kate Harle<br />
Published by the Cooperative Research Centre for Coastal Zone, Estuary<br />
<strong>and</strong> Waterway Management (Coastal CRC)<br />
Indooroopilly Sciences Centre<br />
80 Meiers Road<br />
Indooroopilly Qld 4068<br />
Australia<br />
www.coastal.crc.org.au<br />
The text of this publication may be copied <strong>and</strong> distributed for research <strong>and</strong> educational purposes with proper<br />
acknowledgement.<br />
Disclaimer:<br />
The information contained in this report was current at the time of publication. While the report was prepared with<br />
care by the authors, the Coastal CRC <strong>and</strong> its partner organisations accept no liability for any matters arising from its<br />
contents.<br />
National Library of Australia Cataloguing-in-Publication data<br />
<strong>Sediment</strong> <strong>accumulation</strong> <strong>and</strong> <strong>Holocene</strong> evolution of the Fitzroy River lower floodplain, central Queensl<strong>and</strong>, Australia<br />
QNRM06297<br />
ISBN 1 921017 52 X (print)<br />
ISBN 1 921017 53 8 (online)
<strong>Sediment</strong> <strong>accumulation</strong> <strong>and</strong> <strong>Holocene</strong> evolution of the Fitzroy River lower floodplain<br />
Acknowledgements<br />
This has been a collaborative project with contributions from people across the Fitzroy<br />
Agricultural Contaminants subproject <strong>and</strong> many others.<br />
Field work – Participants during field work included Brendan Brooke, Darren Skene, David<br />
Ryan (Geoscience Australia); Mio Kuhnen (Australian National University); Bob Packett, Bob<br />
Noble, Peter Verwey, John Ross, Ian Hall (Queensl<strong>and</strong> Department of Natural Resources,<br />
Mines <strong>and</strong> Water); Frank Titmus (Fitzroy Vale Pastoral Company); Alan Marks (CSIRO).<br />
Laboratory work – A considerable amount of laboratory work on the Crescent Lagoon cores<br />
was undertaken by Mio Kuhnen for her honours thesis. Other sedimentary laboratory work<br />
was undertaken by Darren Skene, David Ryan, Helen Bostock <strong>and</strong> the Geoscience Australia<br />
Palaeontology <strong>and</strong> <strong>Sediment</strong>ology laboratory staff, including the preparation of pollen slides.<br />
The analyses of pollen slides was undertaken by Kate Harle (CSIRO) <strong>and</strong> Patrick Moss<br />
(University of Queensl<strong>and</strong>). Biomarkers <strong>and</strong> stable isotopes were run by Andy Revill <strong>and</strong><br />
Rhys Leeming (CSIRO) <strong>and</strong> also in the Geoscience Australia Geochemistry Laboratory <strong>and</strong><br />
Environmental Isotopes Ltd. Geochronological analyses were undertaken at the Christian<br />
Laboratories at CSIRO Black Mountain by Gary Hancock ( 137 Cs/excess 210 Pb) <strong>and</strong> Tim<br />
Pietsch (OSL), <strong>and</strong> also at the Waikato Radiocarbon Laboratories.<br />
Other data – Previous borehole data was provided by John Ross (Qld DNRMW), the<br />
Queensl<strong>and</strong> Department of Mines, Queensl<strong>and</strong> Geological Survey <strong>and</strong> by Cheetham Salt Ltd.
<strong>Sediment</strong> <strong>accumulation</strong> <strong>and</strong> <strong>Holocene</strong> evolution of the Fitzroy River lower floodplain
<strong>Sediment</strong> <strong>accumulation</strong> <strong>and</strong> <strong>Holocene</strong> evolution of the Fitzroy River lower floodplain<br />
Table of contents<br />
List of figures ............................................................................................................................ vii<br />
List of tables...............................................................................................................................ix<br />
Non-technical summary............................................................................................................. 1<br />
Mass <strong>accumulation</strong> of sediment............................................................................................ 2<br />
Introduction ................................................................................................................................ 3<br />
Geography <strong>and</strong> geology........................................................................................................ 3<br />
Climate <strong>and</strong> hydrology........................................................................................................... 5<br />
Estuarine sedimentary environments.................................................................................... 8<br />
Methods <strong>and</strong> data.................................................................................................................... 11<br />
Field work ............................................................................................................................ 11<br />
Laboratory work................................................................................................................... 11<br />
<strong>Sediment</strong>s .......................................................................................................................11<br />
Stable isotope analyses.................................................................................................. 11<br />
<strong>Sediment</strong> biomarkers...................................................................................................... 12<br />
Pollen .............................................................................................................................. 13<br />
Geochronology .................................................................................................................... 13<br />
210 Pb <strong>and</strong> 137 Cs dating..................................................................................................... 13<br />
OSL dating ......................................................................................................................14<br />
Radiocarbon dating......................................................................................................... 15<br />
<strong>Sediment</strong> volume <strong>and</strong> <strong>accumulation</strong> rates .......................................................................... 15<br />
Data analysis <strong>and</strong> mapping................................................................................................. 15<br />
Results..................................................................................................................................... 16<br />
Floodplain............................................................................................................................ 16<br />
<strong>Sediment</strong>s .......................................................................................................................16<br />
Stable isotopes ............................................................................................................... 19<br />
Pollen .............................................................................................................................. 20<br />
Geochronology................................................................................................................ 22<br />
Core data from previous studies..................................................................................... 22<br />
<strong>Sediment</strong> budget for the floodplain ................................................................................. 30<br />
Tidal creeks ......................................................................................................................... 31<br />
<strong>Sediment</strong>s .......................................................................................................................32<br />
Stable isotopes ............................................................................................................... 32<br />
Geochronology................................................................................................................ 33<br />
Lagoons............................................................................................................................... 36<br />
<strong>Sediment</strong>s .......................................................................................................................37<br />
Stable isotopes ............................................................................................................... 38<br />
Biomarkers......................................................................................................................40<br />
Pollen .............................................................................................................................. 41<br />
v
<strong>Sediment</strong> <strong>accumulation</strong> <strong>and</strong> <strong>Holocene</strong> evolution of the Fitzroy River lower floodplain<br />
Geochemistry.................................................................................................................. 42<br />
Geochronology................................................................................................................ 45<br />
Discussion ............................................................................................................................... 49<br />
Stratigraphic framework ...................................................................................................... 49<br />
Fine sediment deposition <strong>and</strong> trapping efficiency ............................................................... 50<br />
Changing sedimentation rates............................................................................................. 51<br />
Conclusions ............................................................................................................................. 53<br />
References .............................................................................................................................. 54<br />
Appendix.................................................................................................................................. 61<br />
vi
<strong>Sediment</strong> <strong>accumulation</strong> <strong>and</strong> <strong>Holocene</strong> evolution of the Fitzroy River lower floodplain<br />
List of figures<br />
Figure 1: Location of areas covered in this report..................................................................... 4<br />
Figure 2: Aerial photo mosaic of the 1991 flood around the south of Rockhampton.. .............. 6<br />
Figure 3: Flow discharge past Rockhampton for the last 30 years.. ......................................... 6<br />
Figure 4: <strong>Sediment</strong>ary environments of the Fitzroy River. ........................................................ 9<br />
Figure 5: Digital elevation model of the Fitzroy River estuary................................................. 10<br />
Figure 6: Location of the geoprobe cores <strong>and</strong> the exposed facies.. ...................................... 17<br />
Figure 7: Geoprobe core logs with sediment grainsize of the various facies identified in the<br />
cores................................................................................................................................. 18<br />
Figure 8: Photographs of sediment facies from bank exposures adjacent to the Fitzroy River<br />
.......................................................................................................................................... 19<br />
Figure 9: Stable isotope <strong>and</strong> TOC <strong>and</strong> TN results for the
<strong>Sediment</strong> <strong>accumulation</strong> <strong>and</strong> <strong>Holocene</strong> evolution of the Fitzroy River lower floodplain<br />
Figure 22: Rates of modern sediment <strong>accumulation</strong> between Rockhampton <strong>and</strong> Keppel Bay.<br />
.......................................................................................................................................... 51<br />
viii
<strong>Sediment</strong> <strong>accumulation</strong> <strong>and</strong> <strong>Holocene</strong> evolution of the Fitzroy River lower floodplain<br />
List of tables<br />
Table 1: Estimates of modern average annual suspended load from the Fitzroy River ........... 7<br />
Table 2: Geoprobe cores collected on the floodplain.............................................................. 16<br />
Table 3: Summary of floodplain core facies ............................................................................ 17<br />
Table 4: Data from pollen slides. Number of pollen grains for each plant group .................... 20<br />
Table 5: Radiocarbon dating results for samples from the Geoprobe floodplain cores. ......... 23<br />
Table 6: OSL ages for samples from the Geoprobe floodplain cores. ................................... 23<br />
Table 7: Thickness of upper clays in the northern <strong>and</strong> southern floodplain............................ 27<br />
Table 8: Calculation of sediment <strong>accumulation</strong> in the different areas of the floodplain. ......... 30<br />
Table 9: Summary of main sediment facies evident in the tidal creek cores. ......................... 32<br />
Table 10: Gamma spectrometry data for Casuarina Creek core FK408A. ............................. 34<br />
Table 11: Gamma Spectrometry data for core FK413A, Kamiesh Passage........................... 35<br />
Table 12: OSL ages for pushcore FK413A, Kamiesh Passage. ............................................. 35<br />
Table 13: Summary of main sediment facies evident in the lagoon cores.............................. 38<br />
Table 14: Gamma spectrometry data for Crescent Lagoon core FK406B.............................. 45<br />
Table 15: OSL ages for FK406B <strong>and</strong> FK406D. ....................................................................... 47<br />
Table 16: Gamma spectrometry data for Frogmore Lagoon core FK407E............................. 48<br />
ix
<strong>Sediment</strong> <strong>accumulation</strong> <strong>and</strong> <strong>Holocene</strong> evolution of the Fitzroy River lower floodplain<br />
x
<strong>Sediment</strong> <strong>accumulation</strong> <strong>and</strong> <strong>Holocene</strong> evolution of the Fitzroy River lower floodplain<br />
Non-technical summary<br />
We examined a suite of sediment cores from across the Fitzroy River floodplain,<br />
below Rockhampton, to determine the evolution of the estuary <strong>and</strong> the record of<br />
sediment <strong>accumulation</strong> over the last 8000 years. Three different depositional<br />
environments were targeted during this study; the floodplain, the tidal creeks <strong>and</strong><br />
the freshwater lagoons. Cores collected from each of these environments were<br />
logged <strong>and</strong> sub-sampled for sedimentary analyses, including grainsize, total<br />
organic carbon, total nitrogen, carbon <strong>and</strong> nitrogen stable isotopes <strong>and</strong> pollen.<br />
The cores were also dated using 137 Cs, excess 210 Pb <strong>and</strong> optically stimulated<br />
luminescence (OSL) methods to look into modern sediment <strong>accumulation</strong> (last<br />
120 years) <strong>and</strong> OSL <strong>and</strong> radiocarbon to study the <strong>Holocene</strong> record.<br />
The floodplain cores <strong>and</strong> river-bank exposures display three main sedimentary<br />
units; an upper layer of clay <strong>and</strong> silt, commonly known as ‘cracking clays’,<br />
overlying a thick layer of heavy clay <strong>and</strong> a basal layer of sticky muds interbedded<br />
with poorly sorted coarse s<strong>and</strong>s. The coarse s<strong>and</strong>s at the base of the floodplain<br />
cores provide evidence of the migration of the Fitzroy River across the floodplain<br />
during the <strong>Holocene</strong>. The mud at the base of the cores displays marine/estuarine<br />
isotopic signatures, whilst pollen samples from this unit show evidence of<br />
mangroves close to Rockhampton around 5000 years ago. The core data<br />
suggest that there was a greater marine <strong>and</strong> estuarine influence near<br />
Rockhampton during the mid <strong>Holocene</strong>. The majority of the accommodation<br />
space in the estuarine basin has now been infilled; therefore, there is relatively<br />
little modern sediment being trapped on the floodplain.<br />
In contrast to these <strong>Holocene</strong> records, two cores were taken from feeder arms of<br />
mangrove lined tidal creeks in the lower estuary, Casuarina Creek <strong>and</strong> Kamiesh<br />
Passage, to gain insights into estuary sedimentation over the last 100 years. The<br />
137 Cs/excess 210 Pb data for these cores combined with OSL ages suggest that<br />
these localities are presently experiencing rapid sediment <strong>accumulation</strong><br />
(approximately 1.42 to 3.3 cm yr -1 ). This is a typical <strong>accumulation</strong> rate for<br />
mangrove environments.<br />
Two freshwater lagoons close to Rockhampton were also cored to look for<br />
sedimentary records of flood events <strong>and</strong> any downstream impacts of l<strong>and</strong> use<br />
changes in the catchment. High-resolution sampling of several cores from<br />
Crescent Lagoon have provided an important record of variations in sediment<br />
loads resulting from historical changes in catchment l<strong>and</strong> use. Carbon <strong>and</strong><br />
nitrogen stable isotopes provide evidence of marked changes in the sediment<br />
cores most likely related to large-scale clearance of native vegetation. Biomarker<br />
<strong>and</strong> pollen results also support an increase in burial rates <strong>and</strong> catchment<br />
1
<strong>Sediment</strong> <strong>accumulation</strong> <strong>and</strong> <strong>Holocene</strong> evolution of the Fitzroy River lower floodplain<br />
sediment flux since the early 1960s, which coincides with the onset of the<br />
Brigalow Development Scheme, a major l<strong>and</strong> clearing initiative. <strong>Sediment</strong> tracing<br />
studies highlight alternating sources of sediment in Crescent Lagoon over the<br />
last 120 years (Kuhnen, 2004; Douglas et al., in prep). The core records indicate<br />
that since European settlement there has been an increase in the rate of<br />
sediment <strong>accumulation</strong>.<br />
Mass <strong>accumulation</strong> of sediment<br />
Calculations of sediment mass <strong>accumulation</strong> in the estuarine basin were<br />
undertaken to determine the amount of sediment from the Fitzroy River that has<br />
been trapped <strong>and</strong> stored in the floodplain <strong>and</strong> estuary since the mid <strong>Holocene</strong>.<br />
These calculations have many assumptions, including a uniform thickness of<br />
<strong>Holocene</strong> sediment across the floodplain, a constant sediment density <strong>and</strong><br />
porosity <strong>and</strong> a constant <strong>accumulation</strong> rate. Estimates for the average annual<br />
suspended sediment load in the Fitzroy River range from 2000 to 10 000<br />
kilotonnes yr -1 . We have used an estimate of 8800 kilotonnes yr -1 of bulk<br />
suspended sediment estimated using sediment rating curves for the last 30<br />
years (Kelly <strong>and</strong> Wong, 1996) <strong>and</strong> 4575 kilotonnes yr -1 of fine sediment (
<strong>Sediment</strong> <strong>accumulation</strong> <strong>and</strong> <strong>Holocene</strong> evolution of the Fitzroy River lower floodplain<br />
Introduction<br />
Enhanced delivery of sediments <strong>and</strong> nutrients to the coast <strong>and</strong> the Great Barrier<br />
Reef Marine Park (GBRMP) are potentially detrimental to marine ecosystems<br />
<strong>and</strong> therefore a key issue in the conservation of the park is reducing the<br />
sediment <strong>and</strong> nutrient loads from coastal catchments. A major aim of the Fitzroy<br />
Agricultural Contaminants (AC) project is to better underst<strong>and</strong> the sources, sinks<br />
<strong>and</strong> pathways of nutrients <strong>and</strong> sediments within the Fitzroy River estuary <strong>and</strong><br />
Keppel Bay <strong>and</strong> their impact on the southern GBRMP. This report examines the<br />
geomorphology <strong>and</strong> sedimentology of the Fitzroy River lower floodplain, south of<br />
Rockhampton, <strong>and</strong> the Fitzroy River estuary. Here we summarise previous<br />
milestone reports AC40 (Ryan et al., 2004) <strong>and</strong> ACsupp 6 (Bostock et al.,<br />
2005a), an honours thesis (Kuhnen, 2004) <strong>and</strong> present new data that was<br />
unavailable for the earlier reports. We integrate the results to provide a<br />
comprehensive quantitative conceptual description of this large coastal<br />
sedimentary system.<br />
The main aims of this report are to describe the stratigraphy <strong>and</strong> evolution for the<br />
lower floodplain <strong>and</strong> investigate the rate of sediment mass <strong>accumulation</strong>. The<br />
results are split into three sections that focus on different sedimentary<br />
environments. We start with the overall floodplain stratigraphy, then focus on the<br />
mangrove-lined tidal creeks <strong>and</strong> finally the freshwater lagoons (Figure 1). Each<br />
area has distinct sedimentary characteristics <strong>and</strong> rates of sediment <strong>accumulation</strong><br />
that provide insights into the evolution of the estuary at different spatial <strong>and</strong><br />
temporal scales.<br />
Geography <strong>and</strong> geology<br />
The Fitzroy River catchment is the second largest in Australia, covering an area<br />
of approximately 144 000 km 2 . The catchment stretches from Carnarvon Gorge<br />
National Park in the west, to Rockhampton on the central coast of Queensl<strong>and</strong>. It<br />
is topographically <strong>and</strong> geologically diverse, containing over 100 different rock<br />
types, <strong>and</strong> includes the Thompson Fold Belt, the New Engl<strong>and</strong> Fold Belt, the<br />
Bowen Basin, the Surat Basin <strong>and</strong> Tertiary basalts (Douglas et al., 2005). L<strong>and</strong><br />
use in the catchment is dominated by agriculture, primarily grazing (90%), but<br />
also dry l<strong>and</strong> cropping, irrigated cotton <strong>and</strong> horticulture. There are a number of<br />
mines in the catchment, mainly coal, magnesite, nickel <strong>and</strong> historically gold. The<br />
large catchment was extensively vegetated with Brigalow scrub (Acacia<br />
harpophylla) before European settlement in the mid 19 th century. There were<br />
several major l<strong>and</strong> clearing initiatives during the 19 th <strong>and</strong> 20 th centuries which<br />
replaced much of the woodl<strong>and</strong> with grassl<strong>and</strong>s that are now used for cattle<br />
3
<strong>Sediment</strong> <strong>accumulation</strong> <strong>and</strong> <strong>Holocene</strong> evolution of the Fitzroy River lower floodplain<br />
grazing. The largest clearing event, the Brigalow Development Scheme, was<br />
initiated in 1962 <strong>and</strong> continued until 1976.<br />
Figure 1: Location of areas covered in this report. The area of floodplain examined is outlined by red, the<br />
tidal creeks are highlighted in blue <strong>and</strong> the area containing the freshwater lagoons is shown in yellow.<br />
The lower floodplain is confined by several mountain ranges, including the<br />
Berserker <strong>and</strong> Flat Top Ranges to the north <strong>and</strong> the Rundle, Mount Larcon,<br />
Redan <strong>and</strong> Dee Ranges to the south. The southern portion of the study area is<br />
bordered by the bedrock hills of Curtis Isl<strong>and</strong> <strong>and</strong> expansive low gradient salt<br />
flats, mangroves <strong>and</strong> tidal creek networks in the Port Alma region, which form<br />
the Casuarina Basin (Murray, 1980). Significant brine deposits occur below the<br />
extensive mudflats <strong>and</strong> supratidal lowl<strong>and</strong>s near Port Alma, Casuarina Isl<strong>and</strong><br />
<strong>and</strong> Balaclava Isl<strong>and</strong> (Laycock, 1976). To the north of the entrance of the Fitzroy<br />
4
<strong>Sediment</strong> <strong>accumulation</strong> <strong>and</strong> <strong>Holocene</strong> evolution of the Fitzroy River lower floodplain<br />
River, the coast features an elongate beach <strong>and</strong> beach ridge plain that extends<br />
northwards to the rocky headl<strong>and</strong>s at Keppel S<strong>and</strong>s.<br />
Climate <strong>and</strong> hydrology<br />
The Fitzroy River estuary is located in the dry subtropics, lying on the Tropic of<br />
Capricorn. Annual temperatures range from 32ºC (summer maximum) to 9ºC<br />
(winter minimum) in central Queensl<strong>and</strong>. The Fitzroy River catchment is located<br />
between the boundaries of the temperate <strong>and</strong> tropical convergence zones. The<br />
mean annual rainfall for the west of the catchment is 640 mm (Emerald), whilst<br />
for Rockhampton it is approximately 950 mm <strong>and</strong> on the coast at Yeppoon it is<br />
as much as 1300 mm (Bureau of Meteorology). The majority of the rainfall (60–<br />
80%) occurs during the summer monsoon (December to March), with intense<br />
rainfall events often associated with cyclonic depressions. Flood events are<br />
highly variable in magnitude <strong>and</strong> recurrence, with 51 floods of greater than six<br />
metres recorded since white settlement in 1856, but only three major floods of<br />
greater than nine metres (Duke et al., 2003; Webster <strong>and</strong> Mullins, 2003). During<br />
the major floods, large areas of the floodplain are submerged by the water, which<br />
takes several days to weeks to drain away (Figure 2). It is during the summer<br />
flood discharge that the majority of sediment is transported from the catchment<br />
to the lower floodplain, estuary <strong>and</strong> Keppel Bay. The nutrient <strong>and</strong> sediment loads<br />
are especially high for the first major flood following a significant dry period in the<br />
dry subtropics (Amos et al., 2004).<br />
During much of the year many of the streams <strong>and</strong> rivers from the major subbasins<br />
consist of isolated water holes except during summer flows. Annual mean<br />
runoff of the Fitzroy River, past Rockhampton, is 4.6 million megalitres (DNRM)<br />
although this varies considerably between years <strong>and</strong> decades (Figure 3).<br />
5
<strong>Sediment</strong> <strong>accumulation</strong> <strong>and</strong> <strong>Holocene</strong> evolution of the Fitzroy River lower floodplain<br />
Figure 2: Aerial photo mosaic of the 1991 flood around the south of Rockhampton. Picture courtesy of<br />
Peter Verwey, DNRM, Rockhampton.<br />
Figure 3: Flow discharge past Rockhampton for the last 30 years (data from Qld DNRMW).<br />
6
<strong>Sediment</strong> <strong>accumulation</strong> <strong>and</strong> <strong>Holocene</strong> evolution of the Fitzroy River lower floodplain<br />
Estimates for average total suspended sediment load range considerably from<br />
2000 to 10 000 kilotonnes yr -1 , depending on the size of the flood event/events<br />
studied <strong>and</strong> the method used to estimate the total suspended sediment load<br />
(Table 1; Dougall et al., 2005). Several studies have used sediment rating curves<br />
<strong>and</strong> simple models. Kelly <strong>and</strong> Wong (1996) used a sediment rating curve to<br />
calculate that between 1965 <strong>and</strong> 1994 approximately 264 million tonnes of<br />
sediment was exported from the Fitzroy River basin. The annual sediment load<br />
varied considerably over this time period with several years of very minor<br />
discharge (1965–1967, 1969, 1984–1987, 1992–1993) <strong>and</strong> several years of very<br />
high discharge (1983 – 30 million tonnes <strong>and</strong> 1991 – 60 million tonnes). However<br />
over this 30- year period Kelly <strong>and</strong> Wong (1996) estimate that approximately<br />
8800 kilotonnes per year of suspended sediment was transported past<br />
Rockhampton. Horn et al. (1998), who studied three minor floods in 1994, 1996<br />
<strong>and</strong> 1997, calculated a total suspended sediment load of 4330 kilotonnes per<br />
year, <strong>and</strong> that a bed load of 3370 tonnes per year passes Laurel Bank near<br />
Rockhampton. Initial studies using the SedNet model provided a load of<br />
approximately 2500 kilotonnes yr -1 . More recent work using improved estimates<br />
of hillslope, gully <strong>and</strong> bank erosion have increased this SedNet estimate<br />
considerably to an average of 4575 kilotonnes yr -1 over the last 100 years<br />
(Dougall et al., 2005).<br />
Table 1: Estimates of modern average annual suspended load from the Fitzroy River<br />
Modern Annual Suspended<br />
Study<br />
<strong>Sediment</strong> Load (kilotonnes yr -1 )<br />
Belperio (1983) 2 500<br />
Moss et al. (1992) 1 861<br />
Neil <strong>and</strong> Yu (1996) 10 466<br />
Kelly <strong>and</strong> Wong (1996) 8 800<br />
Horn et al. (1998) 4 330<br />
Franz <strong>and</strong> Piorewicz (2003) 5 270<br />
Furnas (2003) 2 230<br />
Joo et al. (2005) 3 090<br />
Prosser et al. (2001) 2 640<br />
McKergow et al. (2005) 2 911<br />
Dougall et al. (2005) 4 575<br />
7
<strong>Sediment</strong> <strong>accumulation</strong> <strong>and</strong> <strong>Holocene</strong> evolution of the Fitzroy River lower floodplain<br />
The tides in Keppel Bay are semi-diurnal <strong>and</strong> feature a spring tidal range of 5 m<br />
(macrotidal), with a neap tidal range of approximately 2.5 m. Although the tidal<br />
limit of the Fitzroy Estuary once extended more than 100 km upstream from the<br />
mouth, the upper limit of the estuary is today defined by the barrage located at<br />
Rockhampton, 50 km inl<strong>and</strong>, which has modified the flushing characteristics of<br />
the river since its construction in 1970 (Connell et al., 1981; Hekel, 1980).<br />
Estuarine sedimentary environments<br />
A map of the broad-scale surficial sedimentary environments of the Fitzroy River<br />
estuary is presented in Figure 4 (Heap et al., 2001). The estuarine related<br />
habitats in the Fitzroy Estuary cover an area of 630 km 2 . This includes intertidal<br />
flats (13 km 2 ), mangroves (130 km 2 ), saltflats (275 km 2 ), s<strong>and</strong> banks (18 km 2 )<br />
<strong>and</strong> estuarine water area (or channel) (196 km 2 ). The majority of the low lying<br />
estuarine habitats occur to the south of the main river channel between the ‘Cut-<br />
Through’/loop <strong>and</strong> Port Alma <strong>and</strong> chiefly comprise salt flats. Mangrove<br />
vegetation is restricted to within 2 km of the channel networks which are complex<br />
in the south of the estuary (Ryan et al., 2004).<br />
The extent of these estuarine habitats has changed over time, due to both<br />
human <strong>and</strong> natural influences, such as climate <strong>and</strong> sea level changes. The<br />
historical coastline study (Duke et al., 2003) used aerial photographs from 1941<br />
to 1999 to assess these changes. They found that in the estuary mouth the area<br />
of saltpan/saltmarsh decreased over this time, whilst there was a net increase in<br />
mangroves related to areas of sediment deposition. This deposition was primarily<br />
in the lower reaches of the estuary. A significant change in hydrology has also<br />
occurred, related to the sediment deposition, probably caused by increased<br />
sediment loads from l<strong>and</strong> clearing in the catchment or changes in river flow.<br />
These changes in river flow may have been caused by dredging of the channels,<br />
the construction of training walls or the installation of the barrage at<br />
Rockhampton. Duke et al. (2003) also studied the changes on Balaclava Isl<strong>and</strong><br />
over the same time period (1941–1999) to assess changes related to climate<br />
<strong>and</strong> sea level, rather than anthropogenic influences. On Balaclava Isl<strong>and</strong> they<br />
observed a decrease in mangroves <strong>and</strong> an increase in saltpan <strong>and</strong> suggest this<br />
may be related to climate change, with a progressive decline in rainfall over the<br />
last 130 years (Duke et al., 2003).<br />
8
<strong>Sediment</strong> <strong>accumulation</strong> <strong>and</strong> <strong>Holocene</strong> evolution of the Fitzroy River lower floodplain<br />
Figure 4: <strong>Sediment</strong>ary environments of the Fitzroy River, after Heap et al. (2001).<br />
A Digital Elevation Model (DEM) of the lower floodplain (Figure 5) displays an<br />
elongate, flat area between sea level <strong>and</strong> the 10 m contour that extends inl<strong>and</strong> to<br />
a short distance upstream of Rockhampton <strong>and</strong> broadens to approximately 20<br />
km wide in the vicinity of Port Alma (Figure 5). The area also extends north from<br />
Cattle Point to Keppel S<strong>and</strong>s, forming a 2–3 km wide zone of beach ridges<br />
(Brooke et al., 2004). Rockhampton is considered to be the present limit of<br />
estuarine facies (Heap et al., 2001).<br />
9
<strong>Sediment</strong> <strong>accumulation</strong> <strong>and</strong> <strong>Holocene</strong> evolution of the Fitzroy River lower floodplain<br />
Figure 5: Digital elevation model of the Fitzroy River estuary.<br />
10
<strong>Sediment</strong> <strong>accumulation</strong> <strong>and</strong> <strong>Holocene</strong> evolution of the Fitzroy River lower floodplain<br />
Methods <strong>and</strong> data<br />
Field work<br />
Laboratory work<br />
Several field surveys were undertaken to collect sediment surface samples <strong>and</strong><br />
cores from the different study areas. A geoprobe percussion coring system (Qld<br />
DNRMW drill rig) was used to collect cores from the floodplain in 2003 (Ryan<br />
<strong>and</strong> Brooke, 2003; Skene et al., 2004). This kind of coring system is ideal for the<br />
floodplain clay rich sediments. Sample sites were constrained, to some degree<br />
by accessibility, but were chosen to provide a good spatial coverage <strong>and</strong> insight<br />
into the historical <strong>and</strong> geological evolution of the floodplain. Samples were also<br />
collected for analyses from river bank exposures <strong>and</strong> floodplain pit samples<br />
along the Fitzroy River. These eroded banks <strong>and</strong> other exposures reveal<br />
examples of the sediment facies observed in floodplain cores. To build a more<br />
comprehensive stratigraphy for the lower floodplain these data are combined<br />
with borehole logs previously compiled for Queensl<strong>and</strong> Geological Survey <strong>and</strong><br />
Department of Mines.<br />
Push cores were also acquired from Crescent Lagoon, Frogmore Lagoon,<br />
Casuarina Creek <strong>and</strong> Kamiesh Passage during September 2003 <strong>and</strong> August<br />
2004, to gain an insight into some of the historical changes in the catchment <strong>and</strong><br />
<strong>and</strong> sediment <strong>accumulation</strong> rates in different estuarine environments. The<br />
lagoons were chosen as they were the only lagoons that have not dried out, but<br />
are inundated by large floods (Figure 2). One of the cores from Crescent Lagoon<br />
was studied by Mio Kuhnen for her honours thesis (Kuhnen, 2004). The tidal<br />
creeks, Casuarina Creek <strong>and</strong> Kamiesh Passage, were chosen for coring due to<br />
their proximity to the termination of a feeder channel with relatively low tidal<br />
currents. These core sites are therefore more likely to be depositional<br />
environments. The tidal range in both tidal creek locations was approximately 3–<br />
5 m.<br />
<strong>Sediment</strong>s<br />
In order to characterise the facies identified in the geoprobe <strong>and</strong> push cores,<br />
sub-samples from cores were analysed in the lab for grainsize using the Malvern<br />
laser grainsize analyser. The data was converted to ratios of s<strong>and</strong>:silt:clay using<br />
Gradistat software (Blott <strong>and</strong> Pye, 2001).<br />
Stable isotope analyses<br />
As a means of characterising the organic sediment component, total organic<br />
carbon, total nitrogen <strong>and</strong> stable isotopes were measured on the bulk sediment,<br />
11
<strong>Sediment</strong> <strong>accumulation</strong> <strong>and</strong> <strong>Holocene</strong> evolution of the Fitzroy River lower floodplain<br />
<strong>and</strong> in some instances on the
<strong>Sediment</strong> <strong>accumulation</strong> <strong>and</strong> <strong>Holocene</strong> evolution of the Fitzroy River lower floodplain<br />
capillary column; hydrogen was the carrier gas. Sterol <strong>and</strong> fatty acid fractions<br />
were analysed using a flame ionisation detector, with 5β(H)-cholan-24-ol (Chiron<br />
AS, Norway) as the internal st<strong>and</strong>ard for sterols <strong>and</strong> the C 23 fatty acid methyl<br />
ester as the injection st<strong>and</strong>ard for fatty acid analysis. Peak identifications were<br />
based on retention times relative to authentic <strong>and</strong> laboratory st<strong>and</strong>ards <strong>and</strong><br />
subsequent GCMS analysis.<br />
Verification of the identity of individual sterols by GC-MS analyses was<br />
performed on a Thermoquest/Finigan GCQ-Plus benchtop mass spectrometer<br />
fitted with a direct capillary inlet <strong>and</strong> a split/splitless injector. Data were acquired<br />
in scan acquisition or selective ion monitoring <strong>and</strong> processed using Xcalibur<br />
software supplied with the instrument. The nonpolar column (HP5) <strong>and</strong> operating<br />
conditions were similar to that described above for GC-FID analyses, but helium<br />
was used as the carrier gas.<br />
Pollen<br />
To better identify past environments of deposition, several sub-samples were<br />
analysed for pollen. The pollen samples from the floodplain cores were primarily<br />
used to determine the presence or absence of mangrove pollen. For Crescent<br />
Lagoon, pollen was analysed to look for evidence of the major vegetation<br />
changes related to historical l<strong>and</strong>clearing events, which can also be compared<br />
with the geochronological data. Three different methods were used for pollen<br />
recovery: st<strong>and</strong>ard palynology preparation with no potassium hydroxide (KOH)<br />
wash; with KOH wash; <strong>and</strong> the modern palynology preparation. Initially the<br />
samples were dried, subjected to acid digestion by HCl <strong>and</strong> HF, neutralised <strong>and</strong><br />
sieved through a 5 µm sieve. They were then oxidised in hot HNO 3 , (followed by<br />
a wash in KOH) before a final sieving <strong>and</strong> slide preparation. The slides were<br />
prepared by the Geoscience Australia sedimentology laboratory following their<br />
st<strong>and</strong>ard operating procedures.<br />
Geochronology<br />
Chronologies <strong>and</strong> sediment <strong>accumulation</strong> rates for the cores were determined by<br />
14 C, optically stimulated luminescence (OSL) <strong>and</strong> 210 Pb/ 137 Cs methods. Gamma<br />
spectrometry was used to measure 137 Cs <strong>and</strong> 210 Pb <strong>and</strong> to assess historical<br />
sediment <strong>accumulation</strong> along with overlapping OSL measurements, whilst OSL<br />
<strong>and</strong> radiocarbon were utilised to identify the <strong>Holocene</strong> sedimentation rates.<br />
210 Pb <strong>and</strong> 137 Cs dating<br />
<strong>Sediment</strong> core samples were analysed for 210 Pb, 226 Ra <strong>and</strong> 137 Cs by gamma-ray<br />
spectrometry (Murray et al., 1987). The dry sediment from each depth section<br />
was mixed with mixed with a polyester resin <strong>and</strong> cast into a known geometry.<br />
13
<strong>Sediment</strong> <strong>accumulation</strong> <strong>and</strong> <strong>Holocene</strong> evolution of the Fitzroy River lower floodplain<br />
Pb-210 <strong>and</strong> 137 Cs were determined from their direct decay lines, whereas 226 Ra<br />
was determined its daughter products after allowing 3 weeks for ingrowth of<br />
222 Rn.<br />
The nuclides 137 Cs <strong>and</strong> excess 210 Pb provide chronological information over the<br />
last 45 years <strong>and</strong> 100 years respectively. Both these chronometers originate in<br />
the atmosphere <strong>and</strong> become attached to soil <strong>and</strong> sediment particles as a result<br />
of fallout in association with dust <strong>and</strong> rainfall. 137 Cs is a man-made nuclide, <strong>and</strong><br />
when applied to sediment chronology it acts a marker of the onset of testing of<br />
atmospheric nuclear weapons in the mid-1950s. 210 Pb (half-life 22.3 years) is<br />
naturally-occurring, <strong>and</strong> exists in the atmosphere due to the radioactive decay of<br />
222 Rn gas emanating from the earth’s surface. The fundamentals of 210 Pb<br />
geochronology are described in Robbins (1978). Briefly, 210 Pb is continually<br />
deposited from the atmosphere in association with rainfall <strong>and</strong> dust, <strong>and</strong> is seen<br />
as ‘excess’ 210 Pb in surface soils <strong>and</strong> sediments; the excess component being<br />
determined by the difference between the activities 210 Pb <strong>and</strong> 226 Ra in the<br />
soil/sediment. In water bodies the <strong>accumulation</strong> of sediment with excess 210 Pb<br />
results in high activities at the surface sediment. Under ideal conditions the 210 Pb<br />
activity decreases with depth as a result of radioactive decay. Providing certain<br />
assumptions are met, the decay profile of excess 210 Pb can be modelled to<br />
provide estimates of sediment <strong>accumulation</strong> <strong>and</strong> sediment age over a time frame<br />
corresponding to 4–5 210 Pb half-lives (90–110 years).<br />
OSL dating<br />
This work was carried out at the CSIRO OSL Laboratory Canberra. Samples<br />
were taken from the vibracores in a dark laboratory. The OSL samples were<br />
prepared <strong>and</strong> analysed using the modified single–aliquot regenerative dose<br />
protocol outlined in Olley et al., (2004b). Lithogenic radionuclide concentrations<br />
were measured on the dried samples <strong>and</strong> dose rates calculated using the<br />
conversion factors of Stokes et al. (2003). The central age model was used to<br />
calculate the OSL age taking into account the spread in the D e distribution using<br />
the over-dispersion parameter, ‘σ d ’. This parameter is calculated as the relative<br />
st<strong>and</strong>ard deviation of the single-grain D e distribution after taking into account the<br />
measurement uncertainty for each grain (Galbraith et al., 1999). If measurement<br />
uncertainty were the only source of spread in a distribution then σ d would be 0%.<br />
Olley et al. (2004a) suggest a σ d value < ~22% to be indicative of uniform<br />
bleaching prior to deposition, <strong>and</strong> for such samples they recommend use of the<br />
central age model to calculate a D b .<br />
14
<strong>Sediment</strong> <strong>accumulation</strong> <strong>and</strong> <strong>Holocene</strong> evolution of the Fitzroy River lower floodplain<br />
Radiocarbon dating<br />
AMS 14 C dating was undertaken at Waikato Radiocarbon Laboratory. Dates were<br />
analysed on organic carbon preserved within the cores, primarily unidentified fine<br />
organic matter, but also wood <strong>and</strong> mangrove leaves. Calibration of the<br />
radiocarbon dates was achieved using Calib 5.0.2 <strong>and</strong> the terrestrial southern<br />
hemisphere calibration curve of McCormac et al. (2004).<br />
<strong>Sediment</strong> volume <strong>and</strong> <strong>accumulation</strong> rates<br />
To estimate the mass of both fine <strong>and</strong> coarse terrestrial sediment that has<br />
accumulated in Keppel Bay during the <strong>Holocene</strong> <strong>and</strong> historical period, the total<br />
volume of these deposits was estimated using the sub-bottom profiles <strong>and</strong> the<br />
lithological <strong>and</strong> geochronological data obtained from vibracores. The proportion<br />
of fine (mud) <strong>and</strong> coarse (s<strong>and</strong>) material derived from the Fitzroy River within the<br />
bay fill was calculated based on grain-size measurements on sediment samples<br />
from the vibracores.<br />
Data analysis <strong>and</strong> mapping<br />
The sediment grainsize data were plotted <strong>and</strong> converted into ratios of<br />
s<strong>and</strong>:silt:clay using Gradistat software (Blott <strong>and</strong> Pye, 2001). Mapping of sample<br />
locations (Figure 3) <strong>and</strong> sediment volume calculations was performed using<br />
ESRI TM ArcGIS 8.3 software.<br />
15
<strong>Sediment</strong> <strong>accumulation</strong> <strong>and</strong> <strong>Holocene</strong> evolution of the Fitzroy River lower floodplain<br />
Results<br />
Floodplain<br />
The drill sites for this part of the project were primarily concentrated on the<br />
floodplain close to Rockhampton <strong>and</strong> to the north of the Fitzroy River. Drill sites<br />
were at the Fitzroy Commons <strong>and</strong> adjacent to Yeppen Yeppen Lagoon in order<br />
to determine the l<strong>and</strong>ward extend of the estuary during the <strong>Holocene</strong> sea level<br />
highst<strong>and</strong>; <strong>and</strong> three sites were selected in a transect across the Fitzroy Vale<br />
property to look at the stratigraphy of the floodplain (Table 2.; Figure 6).<br />
Table 2: Geoprobe cores collected on the floodplain.<br />
Core Latitude (ºS) Longitude (ºE) Site Length (m)<br />
FK400 -23.434400 150.680167 Fitzroy Vale, Thompson’s Point Rd. 3.6<br />
FK401 -23.457550 150.675933 Fitzroy Vale, Ponded pasture 3.4<br />
FK402 -23.461583 150.646900 Grassy woodl<strong>and</strong> 5.9<br />
FK403 -23.390500 150.532050 Commons area, adjacent to Fitzroy River 3.2<br />
FK404 -23.405946 150.491090 Northern bank of Yeppen Yeppen Lagoon 7.2<br />
FK405 -23.403690 150.490030 Murrays Lagoon, Botanical Gardens 3.6<br />
<strong>Sediment</strong>s<br />
The geoprobe core logs are provided in Figure 7, with each core log drawn<br />
relative to the Australian Height Datum (derived from the Rockhampton<br />
1:100,000 topographic sheet <strong>and</strong> the digitial elevation model). The floodplain<br />
cores comprise approximately half a metre of dark brown mud (mainly silt),<br />
commonly called ‘black cracking clay’, followed by 3–5 m of heavy olive greygreen<br />
plastic clay, with basal sticky grey muds interbedded or overlying poorly<br />
sorted coarse channel s<strong>and</strong>s (Table 3).<br />
Figure 8 provides examples of the floodplain facies that can be seen in riverbank<br />
exposures near the ‘Cut through’, where the river has eroded into the<br />
floodplain, <strong>and</strong> in an excavation at Fitzroy Vale (Figure 6). The exposures<br />
provide relatively large-scale examples of deposits emplaced by channel<br />
avulsion <strong>and</strong> overbank flow during flood events (Ryan et al., 2004).<br />
16
<strong>Sediment</strong> <strong>accumulation</strong> <strong>and</strong> <strong>Holocene</strong> evolution of the Fitzroy River lower floodplain<br />
Table 3: Summary of floodplain core facies<br />
Facies Grainsize Sorting S<strong>and</strong>:Silt:Clay Facies<br />
Dark brown clay 4–6 µm Bimodal 1:74:25 Mud<br />
Olive grey clay 3–6 µm Bimodal 2:71:28 Mud<br />
Grey basal clays 5–10 µm Bimodal 4:78:18 Mud<br />
Coarse s<strong>and</strong>s <strong>and</strong> gravel 500–600 µm Unimodal 90:7:3 S<strong>and</strong><br />
Dark brown clay 4–6 µm Bimodal 1:74:25 Mud<br />
Figure 6: Location of the geoprobe cores (red triangles) <strong>and</strong> the exposed facies displayed in Figure 8<br />
(yellow dots). The extent of the floodplain is highlighted by the red line, based on the 10 m contour.<br />
17
<strong>Sediment</strong> <strong>accumulation</strong> <strong>and</strong> <strong>Holocene</strong> evolution of the Fitzroy River lower floodplain<br />
0%<br />
20%<br />
40%<br />
60%<br />
80%<br />
100%<br />
FK400 FK401 FK402 FK403 FK404<br />
0%<br />
20%<br />
40%<br />
60%<br />
80%<br />
100%<br />
0%<br />
20%<br />
40%<br />
60%<br />
80%<br />
100%<br />
0%<br />
20%<br />
40%<br />
60%<br />
80%<br />
100%<br />
3.0<br />
3.0<br />
<br />
3.0<br />
0%<br />
20%<br />
40%<br />
60%<br />
80%<br />
100%<br />
0%<br />
20%<br />
40%<br />
60%<br />
80%<br />
100%<br />
2.0<br />
2.0<br />
2.0<br />
2.0<br />
2.0<br />
<br />
1.0<br />
1.0<br />
1.0<br />
1.0<br />
1.0<br />
4723 +/- 50 BP<br />
6548 +/- 53 BP<br />
<br />
AHD 0.0<br />
AHD 0.0<br />
AHD 0.0<br />
AHD 0.0<br />
AHD 0.0<br />
3098 +/- 55 BP<br />
EOH 3.2m<br />
EOH 3.6m<br />
-1.0<br />
-1.0<br />
OSL<br />
3996 +/- 48 BP<br />
-1.0<br />
-1.0<br />
EOH 3.4m<br />
5672 +/- 47 BP<br />
-2.0<br />
-2.0<br />
-2.0<br />
<br />
<br />
-3.0<br />
OSL<br />
4614 +/- 44 BP<br />
7639 +/- 41 BP<br />
-3.0<br />
7292 +/- 43 BP<br />
OSL<br />
EOH 5.7m<br />
-4.0<br />
-4.0<br />
EOH 7.2m<br />
ROCKHAMPTON<br />
FK405<br />
FK404<br />
Billabongs<br />
FK403<br />
FK400<br />
Long Beach<br />
Core Lithology<br />
.<br />
Dark brown to black, massive organic-rich clay with numerous<br />
rootlets <strong>and</strong> heavy dessication cracks.<br />
Grainsize Bar Charts<br />
(Folk et al ., 1970)<br />
0 2.5 5 10<br />
Kilometres<br />
"Fitzroy Vale"<br />
FK402<br />
FK401<br />
Casuarina Creek<br />
Thompsons Pt<br />
Light olive grey-green to dark grey plastic clay with numerous<br />
rootlets <strong>and</strong> sparse s<strong>and</strong>- to gravel-fraction inclusions.<br />
Dense light olive grey to dark grey clay with extensive orange<br />
to brown mottling, numerous rootlets <strong>and</strong> sparse s<strong>and</strong>- to<br />
gravel-fraction inclusions<br />
Light brown to fawn coloured, poorly sorted gravelly muddy<br />
s<strong>and</strong>, comprising various rounded quartz <strong>and</strong> lithic grains.<br />
Soft, sticky dark grey to grey-green heavyclay, with rare<br />
bedding <strong>and</strong> organic material (mangrove leaves).<br />
Percentage S<strong>and</strong><br />
(63 um to 2 mm)<br />
Percentage Silt<br />
(3.9 to 63 um)<br />
Percentage Clay<br />
(0.06 to 3.9 um)<br />
Clay<br />
10%<br />
FK405<br />
3.0<br />
2.0<br />
1.0<br />
AHD 0.0<br />
90%<br />
S<strong>and</strong><br />
S<strong>and</strong><br />
Grainsize,<br />
all core samples<br />
Clayey<br />
Silty<br />
S<strong>and</strong><br />
S<strong>and</strong> %<br />
S<strong>and</strong><br />
Muddy S<strong>and</strong><br />
50%<br />
S<strong>and</strong>y Clay S<strong>and</strong>y Mud S<strong>and</strong>y Silt<br />
Clay Mud Silt<br />
1:2 2:1<br />
Silt<br />
Figure 7: Geoprobe core logs with sediment grainsize of the various facies identified in the cores is<br />
shown in the bar chart that indicate the proportions of s<strong>and</strong>, silt <strong>and</strong> clay (Folk et al., 1970; Blott <strong>and</strong><br />
Pye, 2001).<br />
18
<strong>Sediment</strong> <strong>accumulation</strong> <strong>and</strong> <strong>Holocene</strong> evolution of the Fitzroy River lower floodplain<br />
Figure 8: Photographs of sediment facies from bank exposures adjacent to the Fitzroy River. A) Inclined<br />
parallel beds of mud, a point-bar deposit exposed near the Cut-Through (site FK412A); B) Coarse s<strong>and</strong><br />
layer (approx. 50 cm thick) overlaying clay (site FK411A); C) Coarse cross-bedded s<strong>and</strong> overlain by<br />
dense clay, exposed in a pit on the Fitzroy Vale (site FK462A, B); D) Laminated clay <strong>and</strong> silt floodplain<br />
deposit (site FK411B); E) Mangrove mud deposit (Casuarina Creek core site); F) Channel bed gravely<br />
s<strong>and</strong> (site FK410A).<br />
Stable isotopes<br />
Stable isotopes were analysed on the
<strong>Sediment</strong> <strong>accumulation</strong> <strong>and</strong> <strong>Holocene</strong> evolution of the Fitzroy River lower floodplain<br />
displayed the whole sequence of floodplain facies (Figure 7). The stable isotopes<br />
clearly show at least three changes down core (Figure 9A; B). It was not possible<br />
to analyse the coarse s<strong>and</strong>s <strong>and</strong> gravels at the base of the core as there was<br />
insufficient
<strong>Sediment</strong> <strong>accumulation</strong> <strong>and</strong> <strong>Holocene</strong> evolution of the Fitzroy River lower floodplain<br />
Figure 9: Stable isotope <strong>and</strong> TOC <strong>and</strong> TN results for the
<strong>Sediment</strong> <strong>accumulation</strong> <strong>and</strong> <strong>Holocene</strong> evolution of the Fitzroy River lower floodplain<br />
Geochronology<br />
Several samples were taken for 14 C <strong>and</strong> OSL dating to provide a chronology for<br />
the floodplain cores. Age inversions in the radiocarbon data (Table 5) suggest<br />
that some of the samples contain reworked older carbon from further up in the<br />
catchment, as speculated by Ford et al. (2005). Therefore these 14 C ages do not<br />
provide a reliable chronology for the cores <strong>and</strong> need to be compared with other<br />
independent age data to test their validity. FK402 5.02–5.03 m has a much<br />
higher δ 13 C value (-28.4%) than the majority of the other samples, which is<br />
indicative of mangrove vegetation (Fry <strong>and</strong> Smith, 2002). This suggests that the<br />
organic carbon measured in this sample was likely estuarine derived rather than<br />
reworked carbon from the catchment. Although no mangrove pollen was found in<br />
this core close to this depth, evidence of mangrove leaves <strong>and</strong> wood was found<br />
in the estuarine muds of the geoprobe cores. It is likely, therefore, that the<br />
radiocarbon age at the base of FK404, measured on mangrove leaves, is<br />
reliable, providing an approximate age of 8000 ± 150 years BP at 6.21–6.22<br />
m.The OSL ages at the base of FK402 agree with the 14 C age from the base of<br />
this core (Table 6). This provides a reliable age for this unit of approximately<br />
5500 ± 500 years (CLW-37/4).<br />
Core data from previous studies<br />
To increase the coverage of stratigraphic information for the floodplain, data from<br />
previous drilling projects were integrated into this study. Recently, Ross (2002)<br />
undertook a shallow coring program to determine the presence <strong>and</strong> extent of<br />
acid sulfate soils in the Rockhampton region. The data from the short cores<br />
drilled by Ross (2002) complements the Geoprobe core data from this study.<br />
Ross (2002) described three major sediment units in the floodplain subsurface,<br />
similar to the geoprobe cores, however, the lower two units tend to be<br />
interbedded in some cores. The upper unit includes modern deposits <strong>and</strong><br />
comprises floodplain clays <strong>and</strong> silty clays. This clay is dense <strong>and</strong> organic rich,<br />
<strong>and</strong> often features significant desiccation cracks. These clays accumulate on the<br />
floodplain during floods with inclusions of coarse s<strong>and</strong> rich strata indicating<br />
higher-energy flood events. The sub-surface clays are often mottled due to<br />
weathering processes (Ross, 2002). Grey to olive coloured dense sticky clays<br />
occur below this unit <strong>and</strong> appear to represent estuarine to subtidal shallow<br />
marine deposits, with the potential for acid sulfate formation. This material is<br />
highly bioturbated <strong>and</strong> contains fragments of well preserved plant material in well<br />
bedded horizons, typical of the intertidal zone. Thick s<strong>and</strong> <strong>and</strong> gravel beds,<br />
which represent channel deposits, typically underlie the grey clays, or are<br />
22
<strong>Sediment</strong> <strong>accumulation</strong> <strong>and</strong> <strong>Holocene</strong> evolution of the Fitzroy River lower floodplain<br />
interbedded with shallow marine muds. These channel s<strong>and</strong>s are found at<br />
various thicknesses <strong>and</strong> depths across the floodplain recording the migration of<br />
the Fitzroy River channel during infilling of the floodplain.<br />
Table 5: Radiocarbon dating results for samples from the Geoprobe floodplain cores.<br />
Sample<br />
Lab δ 13 C ‰ Radiocarbon Calibrated<br />
Sample<br />
description number (pdb) Age (yrs) Age (yrs BP)<br />
FK401 1.44–1.47m<br />
FK401 2.00–2.03m<br />
FK401 3.20–3.22m<br />
FK402 1.6–1.63m<br />
FK402 3.69–3.71m<br />
FK402 5.02–5.03m<br />
FK404 5.82–5.84m<br />
FK404 6.21–6.22m<br />
Fine organic<br />
material<br />
Fine organic<br />
material<br />
Organic<br />
material<br />
Fine organic<br />
material<br />
Fine organic<br />
material<br />
Unidentified<br />
wood<br />
Fine organic<br />
material<br />
Mangrove<br />
leaves<br />
Wk14972 -20.7 ± 0.2 4723 ± 50 5302–5485<br />
Wk14973 -22.3 ± 0.2 3098 ± 55 3074–3380<br />
Wk14974 -24.1 ± 0.2 3996 ± 48 4235–4525<br />
Wk14975 -22.9 ± 0.2 6548 ± 53 7276–7502<br />
Wk14976 -22.4 ± 0.2 5672 ± 47 6299–6493<br />
Wk14977 -28.4 ± 0.2 4614 ± 44 5043–5326<br />
Wk14978 -27.0 ± 0.2 7639 ± 41 8317–8462<br />
Wk14979 -27.5 ± 0.2 7292 ± 43 7968–8165<br />
Table 6: OSL ages for samples from the Geoprobe floodplain cores.<br />
Sample Lab number D e (Gy) σ d (%) Age (yrs)<br />
FK401 3.10–3.20m CLW-37/2 3.96 ± 0.19 15 1400 ± 140<br />
FK402 5.00–5.10m CLW-37/3 4.87 ± 0.35 66 4840 ± 520<br />
FK402 5.50–5.60m CLW-37/4 2.54 ± 0.08 8 5440 ± 600<br />
Many boreholes have also been drilled in the south of the floodplain to map <strong>and</strong><br />
exploit the brine in these deposits. The occurrence of brine at Port Alma <strong>and</strong> on<br />
Casuarina Isl<strong>and</strong> has been known since 1914 (Dunstan, 1914). Three bores<br />
were drilled on Casuarina Isl<strong>and</strong> to a depth of 39 m <strong>and</strong> in all bores very strong<br />
23
<strong>Sediment</strong> <strong>accumulation</strong> <strong>and</strong> <strong>Holocene</strong> evolution of the Fitzroy River lower floodplain<br />
brine was encountered. These bores penetrated clay, s<strong>and</strong> <strong>and</strong> gravel, with<br />
b<strong>and</strong>s of lignite <strong>and</strong> peat (Dunstan, 1920). Many more bores have been sunk<br />
since then to use the brine in the production of salt in the Port Alma area.<br />
Although two companies are presently producing salt in the area, very little brine<br />
is currently being pumped from the boreholes.<br />
Several drilling surveys were undertaken in the late 1960s <strong>and</strong> 1970s (Coffey<br />
<strong>and</strong> Hollingsworth 1966a; b; Laycock, 1976; Noon, 1980) to determine the<br />
stratigraphy <strong>and</strong> hydrogeology of the region <strong>and</strong> the depth <strong>and</strong> extent of the s<strong>and</strong><br />
<strong>and</strong> gravel layers which contain the concentrated brine, which is up to twice the<br />
concentration of sea water. The location of the bore holes drilled by Laycock<br />
(1976), Coffey <strong>and</strong> Hollingsworth (1966a; 1966b) <strong>and</strong> Cheetham Salt Ltd are<br />
shown in Figure 10.<br />
The Department of Mines, Geological Survey of Queensl<strong>and</strong>, drilled GSQ<br />
Rockhampton 1 (-23º32’18’’S, 150º38’12’’E) in 1978 (Noon, 1980). The bore was<br />
located approximately 10 km east of Midgee, near the Bruce Highway, 26 km<br />
from Rockhampton (Figure 10). The drill hole was designed to provide a<br />
reference section of Quaternary <strong>and</strong> Tertiary strata <strong>and</strong> test for oil shale within a<br />
gravity low on Casuarina Isl<strong>and</strong>. The top 44 m were classified as Quaternary<br />
sediments, which were not logged, but descriptions were made from cuttings<br />
samples. The sediments were described as “composed of mainly very fine to<br />
coarse-grained, poorly sorted, sub-rounded to rounded s<strong>and</strong>…. deposited under<br />
fluvial conditions following the rejuvenation of the Fitzroy River system in the late<br />
to post-Tertiary time” (Noon, 1980).<br />
Further data on the Quaternary sedimentary sequence in this southern area is<br />
provided by Coffey <strong>and</strong> Hollingsworth (1966a;b) Laycock (1976), <strong>and</strong> borehole<br />
data from Cheetham Salt Ltd. Drilling by Laycock (1976) suggest that there is an<br />
upper layer of clay, overlying a sequence of s<strong>and</strong>s <strong>and</strong> gravel, interbedded with<br />
layers of muds, before finally reaching bedrock, usually the Tertiary shale beds<br />
of the Casuarina Group (Noon, 1980). Laycock (1976) estimated that the<br />
bedrock at Casuarina Isl<strong>and</strong> varied from 40 m below the present in the<br />
southwest surface to 65 m in the northeast of the isl<strong>and</strong>. There are normally two<br />
to four brine aquifers which occur in the permeable beds of s<strong>and</strong> <strong>and</strong> gravel.<br />
24
<strong>Sediment</strong> <strong>accumulation</strong> <strong>and</strong> <strong>Holocene</strong> evolution of the Fitzroy River lower floodplain<br />
Figure 10: Location of boreholes <strong>and</strong> cores from previous studies. Ross (2002) – yellow squares,<br />
Laycock (1976) – black circles, Coffey <strong>and</strong> Hollingsworth (1966a:b) – blue squares, Noon (1980) – red<br />
triangle. The floodplain area is delineated by the red line. The study are is split into north <strong>and</strong> south<br />
areas (Tables 7 <strong>and</strong> 8). The approximate location of two cross sections are highlighted by black dotdash<br />
lines (Figure 11).<br />
There appears to be no connection between the brine reservoirs <strong>and</strong> present sea<br />
water. It has also not been possible to reliably correlate the permeable<br />
sediments between the different boreholes. This is probably because the locus of<br />
s<strong>and</strong> deposition has shifted laterally over time. Further stratigraphic data is<br />
provided by the Cheetham Ltd borehole logs, which show a further change from<br />
the upper clay layer approximately 1 m thick to an underlying blue/grey clay<br />
25
<strong>Sediment</strong> <strong>accumulation</strong> <strong>and</strong> <strong>Holocene</strong> evolution of the Fitzroy River lower floodplain<br />
layer. This lower clay probably represents mangrove deposits, given the location<br />
of the boreholes adjacent to the present tidal creeks.<br />
Unfortunately these previous studies did not involve any dating of the cores or<br />
cuttings. Therefore, it is not possible to establish the thickness of the <strong>Holocene</strong><br />
sequence. However, we can assume that the upper clays are the primary<br />
<strong>Holocene</strong> deposit, based on the ages for the Geoprobe cores (FK402 <strong>and</strong><br />
FK404). The depth of clays in all the floodplain cores is given in Table 7. We<br />
have used this data to determine the average thickness of floodplain sediments<br />
in order to calculate the mass of sediment that has accumulated during the<br />
<strong>Holocene</strong>. The thickness of the floodplain sediments varies considerably<br />
between the north of the river <strong>and</strong> the south, therefore the floodplain is split into<br />
two regions for the sediment <strong>accumulation</strong> calculations (Figure 10).<br />
The thickness of the floodplain clay near Rockhampton is 5.5 m, <strong>and</strong> in the other<br />
northern floodplain sites it ranges from 3–6 m, with the average thickness of 4 m<br />
in cores that penetrated the unit. However, some cores did not penetrate through<br />
this clay. Therefore, 4 m must be a minimum value <strong>and</strong> we assume an overall<br />
average thickness of 5 m for the northern area (Table 7). In the south, the<br />
thickness varies from 5–22 m, with an average thickness of 13.5 m (Table 7).<br />
The borehole data also provide details on the stratigraphic succession of facies<br />
within the floodplain. Two simplified cross sections that integrate all the bore <strong>and</strong><br />
core data are shown in Figure 11<br />
26
<strong>Sediment</strong> <strong>accumulation</strong> <strong>and</strong> <strong>Holocene</strong> evolution of the Fitzroy River lower floodplain<br />
Table 7: Thickness of upper clays in the northern <strong>and</strong> southern floodplain.<br />
Cores in northern<br />
floodplain<br />
Depth of<br />
muds<br />
Cores in southern<br />
floodplain<br />
Depth of<br />
muds<br />
FK400 >3.6 m FK400 >3.6 m<br />
FK401 3.0 m D1^ 15 m<br />
FK402 4.5 m D2^ 19 m<br />
FK403 2.3 m D3^ 10 m<br />
FK404 5.7 m D4^ 15 m<br />
FK405 >3.5 m D5^ 18 m<br />
YAS33* > 5 m D6^ 14.5 m<br />
YAS34* 3.5 m D7^ 12.5 m<br />
YAS35* > 5 m D8^ 12 m<br />
YAS36* 2.5 m D9^ 12 m<br />
YAS37* 3.5 m D11^ 18 m<br />
YAS38* 3.5 m D12^ 5 m<br />
YAS39* 6 m D13^ 11 m<br />
YAS40* 3 m D14^ 10 m<br />
Site 484* 5.5 m D17^ 18 m<br />
Site 485* 6 m D19^ 22 m<br />
Site 486* 3.5 m X1 + 12.5 m<br />
Site 487* 1 m X3 + 9 m<br />
Site 488* > 5.5 m X4 + 12.5 m<br />
Site 490* 6.5 m X8A + 15 m<br />
D15^ 7 m X9 + 14 m<br />
Average for north 4 m X11 + 13 m<br />
X14 +<br />
X15 +<br />
X16 +<br />
X17 +<br />
Site 1 +<br />
Site 2 +<br />
Site 3 +<br />
Site 4 +<br />
PB1 #<br />
15.5 m<br />
16 m<br />
17 m<br />
12 m<br />
13 m<br />
12 m<br />
15 m<br />
12.5 m<br />
12 m<br />
27
<strong>Sediment</strong> <strong>accumulation</strong> <strong>and</strong> <strong>Holocene</strong> evolution of the Fitzroy River lower floodplain<br />
Cores in northern<br />
Depth of<br />
Cores in southern<br />
Depth of<br />
floodplain<br />
muds<br />
floodplain<br />
muds<br />
PB4 #<br />
10 m<br />
PB5 #<br />
12 m<br />
Average for south<br />
13.5 m<br />
*Data from Ross (2002) ^ Laycock (1976),+ Coffey <strong>and</strong> Hollingsworth (1966a;b), # borehole<br />
data provide by Cheetham Salt (Appendix).<br />
.<br />
28
<strong>Sediment</strong> <strong>accumulation</strong> <strong>and</strong> <strong>Holocene</strong> evolution of the Fitzroy River lower floodplain<br />
Figure 11: Simplified cross-sections of the stratigraphy of the floodplain. A) cross section A-A’ in the northern floodplain <strong>and</strong> B) cross section B-B’ in the southern area of the<br />
floodplain (shown on Figure 10). The location of bore holes <strong>and</strong> geoprobe cores are shown.<br />
29
<strong>Sediment</strong> <strong>accumulation</strong> <strong>and</strong> <strong>Holocene</strong> evolution of the Fitzroy River lower floodplain<br />
<strong>Sediment</strong> budget for the floodplain<br />
Using the average thickness for the different areas of floodplain it is possible to<br />
estimate an average annual <strong>accumulation</strong> rate of fine sediment for the early<br />
<strong>Holocene</strong> to present. The surface area of each region was determined using<br />
ArcGIS (Figure 10) <strong>and</strong> the average thickness of <strong>Holocene</strong> sediment determined<br />
from the cores <strong>and</strong> borehole data (Tables 7). The mass of sediment is calculated<br />
assuming a constant density of 2.5 g cm -3 <strong>and</strong> a porosity of 50%, over a time<br />
period of 8000 years. To determine the fine fraction that has accumulated, we<br />
use the average proportion of mud determined from the grainsize analyses for<br />
each region (Table 8).<br />
These calculations give a total of 1992 kilotonnes yr -1 of sediment <strong>and</strong> 1636<br />
kilotonnes yr -1 of fine sediment deposited on the floodplain over the last 8000 yrs.<br />
Using the estimate of 8800 kilotonnes yr -1 for suspended sediment discharge<br />
past Rockhampton (Kelly <strong>and</strong> Wong, 1996), our results suggests that 23% of the<br />
fine sediment discharge is accumulating in the floodplain each year. This Figure<br />
represents 36% of the average annual fine suspended sediment load estimated<br />
by the SedNet model (4575 kilotonnes yr -1 ; Dougall et al., 2005).<br />
Table 8: Calculation of sediment <strong>accumulation</strong> in the different areas of the floodplain.<br />
Mass<br />
Surface<br />
Thickness Volume Total Mass <strong>accumulation</strong> Average<br />
Region Area<br />
(m) (m 3 ) (kg) (kilotonnes % mud<br />
(km 2 )<br />
yr -1 )<br />
Mass of fines<br />
accumulating<br />
(kilotonnes<br />
yr -1 )<br />
North 324 5 1.62 x 10 9 2.03 x 10 12 254 97 246<br />
South 820 13.5 1.11x 10 10 1.39 x 10 13 1738 80 1390<br />
Total 1144 1.27 x 10 10 2.54 x 10 13 1992 1636<br />
30
<strong>Sediment</strong> <strong>accumulation</strong> <strong>and</strong> <strong>Holocene</strong> evolution of the Fitzroy River lower floodplain<br />
Tidal creeks<br />
The tidal creeks were extensively sampled using a sediment grab sampler<br />
(Radke et al., 2005) <strong>and</strong> sub-bottom profiles were also run up the tidal channels.<br />
Only two sites were chosen for coring; one in Casuarina Creek <strong>and</strong> one in<br />
Kamiesh Passage (Figure 12).<br />
Both core sites were located in mangrove-lined channels with soft greyish brown<br />
muds. The Casuarina Creek site (FK408) was difficult to anchor at <strong>and</strong> core, <strong>and</strong><br />
therefore several relatively short cores were retrieved here. The channel banks<br />
at the Casuarina Creek site were relatively steep compared to those at the<br />
Kamiesh Passage core site (FK413A).<br />
Figure 12: Location of the tidal creek cores in side creeks of Casuarina Creek (FK408) <strong>and</strong> Kamiesh<br />
Passage (FK413A). Location of push core sites is highlighted by purple squares.<br />
31
<strong>Sediment</strong> <strong>accumulation</strong> <strong>and</strong> <strong>Holocene</strong> evolution of the Fitzroy River lower floodplain<br />
<strong>Sediment</strong>s<br />
The cores collected at these sites consisted primarily of mud with visible organic<br />
material. Some bioturbation is evident in the upper sections of the cores,<br />
suggesting good oxygenation. Below this zone there are faint laminations that<br />
suggest little bioturbation. The base of FK413A comprises a poorly sorted shell<br />
bed with broken <strong>and</strong> disorientated shells in a mud matrix. A large rock fragment<br />
was also encountered in the core base <strong>and</strong> probably prevented the core from<br />
penetrating any further into the sediment.<br />
The sediments in Casuarina Creek display a bimodal grainsize distribution, with<br />
peaks at 2 µm <strong>and</strong> 40 µm. There are several s<strong>and</strong>y layers present in the top of<br />
core FK408A, giving a trimodal distribution in grainsize, with a minor peak at 450<br />
µm, but the sediment is still predominantly composed of clay <strong>and</strong> silt. Kamiesh<br />
Passage also shows down core fluctuations in s<strong>and</strong> content <strong>and</strong> a bimodal to<br />
trimodal grainsize distribution with prominent peaks at 4, 50 <strong>and</strong> 400 µm. This<br />
predominantly bimodal distribution of grainsizes is typical of tidally influenced<br />
channels (Table 9).<br />
Table 9: Summary of main sediment facies evident in the tidal creek cores.<br />
Core Facies Mean Sorting S<strong>and</strong>:Silt:Clay<br />
FK408A Mud <strong>and</strong> fine silt 7 µm Bimodal 7:69:24<br />
S<strong>and</strong> <strong>and</strong> silt <strong>and</strong> mud 10 µm Trimodal 15:64:21<br />
FK413A Mud <strong>and</strong> fine silt 15 µm Bimodal to trimodal 24:63:13<br />
Basal s<strong>and</strong> 40 µm Trimodal (10% gravel) 34:43:13<br />
Stable isotopes<br />
Stable isotopes, total organic carbon, <strong>and</strong> total nitrogen analyses were run on<br />
the
<strong>Sediment</strong> <strong>accumulation</strong> <strong>and</strong> <strong>Holocene</strong> evolution of the Fitzroy River lower floodplain<br />
vegetation, but the other values are very similar. These tidal creek sediment<br />
stable isotope values are all similar to those measured in vibracores from Keppel<br />
Bay (Bostock et al., 2005c).<br />
Figure 13: Stable isotope, total nitrogen (N) <strong>and</strong> total organic carbon (C) results for the
<strong>Sediment</strong> <strong>accumulation</strong> <strong>and</strong> <strong>Holocene</strong> evolution of the Fitzroy River lower floodplain<br />
cm. Thus the sediment <strong>accumulation</strong> rate in Kamiesh Passage is constrained to<br />
lie between 2.0 <strong>and</strong> 3.3 cm yr -1 for the last 47 years. A slightly lower<br />
<strong>accumulation</strong> rate of 1.42 cm yr -1 is calculated from the OSL age of 115 ± 20<br />
years at 158–160 cm (CLW- 49/6; Table 12). The OSL age from 26.5 cm (CLW-<br />
49/4) in FK413A, unfortunately has a large uncertainty, possibly related to<br />
bioturbation, but suggests an <strong>accumulation</strong> rate of 3.4 cm yr -1 for the top of the<br />
core.<br />
Table 10: Gamma spectrometry data for Casuarina Creek core FK408A.<br />
Depth (m)<br />
137 Cs<br />
226 Ra<br />
210 Pb Excess 210 Pb<br />
0.02–0.05 2.01 ±0.37 16.3 ±0.7 30.6 ±4.3 14.3 ±4.3<br />
0.07–0.10 2.21 ±0.31 17.8 ±0.5 31.7 ±3.1 14.0 ±3.2<br />
0.13–0.15 1.78 ±0.25 17.5 ±0.5 39.9 ±3.6 22.4 ±3.6<br />
0.19–0.21 2.05 ±0.29 18.6 ±0.6 30.6 ±3.9 12.0 ±4.0<br />
0.30–0.33 1.11 ±0.39 17.3 ±0.7 31.0 ±4.0 13.8 ±4.1<br />
0.41–0.44 1.23 ±0.33 17.8 ±0.6 36.4 ±3.8 18.6 ±3.9<br />
0.55–0.58 2.01 ±0.38 19.4 ±0.7 28.3 ±3.8 8.9 ±3.9<br />
0.65–0.67 1.43 ±0.25 18.3 ±0.5 28.6 ±3.5 10.3 ±3.6<br />
0.71–0.72 1.44 ±0.31 19.2 ±0.5 21.1 ±3.1 2.0 ±3.1<br />
0.75–0.78 0.83 ±0.35 18.8 ±0.7 26.9 ±3.7 8.0 ±3.7<br />
34
<strong>Sediment</strong> <strong>accumulation</strong> <strong>and</strong> <strong>Holocene</strong> evolution of the Fitzroy River lower floodplain<br />
Table 11: Gamma Spectrometry data for core FK413A, Kamiesh Passage.<br />
Depth (m)<br />
137 Cs<br />
226 Ra<br />
210 Pb Excess 210 Pb<br />
0.00–0.03 1.42 ±0.39 19.0 ±0.8 32.0 ±5.5 12.9 ±5.6<br />
0.05–0.08 1.21 ±0.32 16.4 ±0.6 23.8 ±5.2 7.4 ±5.3<br />
0.10–0.13 1.76 ±0.33 15.4 ±0.6 30.2 ±4.5 14.8 ±4.6<br />
0.155–0.185 1.98 ±0.33 15.2 ±0.6 31.4 ±4.3 16.2 ±4.3<br />
0.25–0.28 1.16 ±0.29 17.0 ±0.6 29.8 ±4.1 12.8 ±4.1<br />
0.35–0.38 1.29 ±0.30 16.5 ±0.6 19.0 ±3.7 2.5 ±3.8<br />
0.40–0.43 1.43 ±0.29 16.0 ±0.6 24.7 ±4.0 8.8 ±4.1<br />
0.50–0.53 1.51 ±0.35 17.6 ±0.6 21.3 ±3.9 3.7 ±3.9<br />
0.60–0.63 2.08 ±0.34 17.0 ±0.6 21.6 ±3.8 4.6 ±3.8<br />
0.70–0.73 1.42 ±0.26 15.8 ±0.5 25.8 ±3.4 10.0 ±3.4<br />
0.90–0.93 1.66 ±0.32 15.9 ±0.6 18.1 ±3.6 2.2 ±3.7<br />
1.55–1.58 0.17 ±0.37 14.8 ±0.7 16.8 ±4.6 1.9 ±4.6<br />
Table 12: OSL ages for pushcore FK413A, Kamiesh Passage.<br />
Sample Lab number D e (Gy) σ d (%) Age (yrs)<br />
FK413A 0.25–0.29 m CLW-49/4 0.01 ± 0.04 N/A 8 ± 35<br />
FK413A 1.58–1.62 m CLW-49/6 0.13 ± 0.01 N/A 115 ± 20<br />
35
<strong>Sediment</strong> <strong>accumulation</strong> <strong>and</strong> <strong>Holocene</strong> evolution of the Fitzroy River lower floodplain<br />
Lagoons<br />
Two lagoons were sampled in this study. These are oxbow lakes which appear<br />
to have formed when tributary channels of the Fitzroy River were cut off.<br />
Crescent Lagoon <strong>and</strong> Frogmore Lagoon were chosen as they are permanent<br />
bodies of water. Water levels vary considerably, determined by local rainfall, run<br />
off <strong>and</strong> inundation during Fitzroy River flood events. The lagoons are situated<br />
close to Rockhampton <strong>and</strong> were formerly used as sources of freshwater (Figure<br />
14).<br />
Crescent Lagoon is located on the southern side of Rockhampton, is 2 km long<br />
<strong>and</strong> approximately 250 m wide (Figure 14). The maximum water depth was 4.5<br />
m in 2003 <strong>and</strong> 2004. Frogmore Lagoon is similar in morphology but significantly<br />
longer <strong>and</strong> narrower than Crescent Lagoon (Figure 14). The lagoon is connected<br />
to the Fitzroy River via Gavial Creek during floods <strong>and</strong> is connected by a small<br />
channel to Woolwash Lagoon (also known as Serpentine Creek; Figure 14).<br />
Figure 14: Location of Crescent Lagoon <strong>and</strong> Frogmore Lagoon close to Rockhampton. Core sites are<br />
highlighted by a yellow triangle.<br />
36
<strong>Sediment</strong> <strong>accumulation</strong> <strong>and</strong> <strong>Holocene</strong> evolution of the Fitzroy River lower floodplain<br />
<strong>Sediment</strong>s<br />
The Crescent Lagoon cores (FK406) consist of olive green brown mud with<br />
organic-rich material. There are light <strong>and</strong> dark laminations within the beds, with<br />
mottles <strong>and</strong> rootlets evident in some sections. The laminations suggest variable<br />
source material or depositional conditions for the lagoon. Several of the black<br />
organic-rich beds can be correlated between cores collected at the core site.<br />
During the second field survey longer cores were collected which penetrated<br />
through a dark organic rich mud into a layer of hard, grey-blue clay.<br />
In Frogmore Lagoon, cores, (FK407) also exhibits light <strong>and</strong> dark laminations <strong>and</strong><br />
some visible organic matter. There is a decrease in the darker layers down core,<br />
however, suggesting that the organic matter has been degraded or that there<br />
has been an increase in organic matter entering the lagoon more recently. The<br />
presence of laminations at both core sites suggests little bioturbation. This<br />
interpretation is supported by evidence from a comparable nearby lagoon,<br />
Yeppen Yeppen Lagoon (Figure 14), which has a warm monomictic pattern of<br />
thermal stratification, with a hypolimnion that remains anoxic for much of the year<br />
(Mackey, 1991).<br />
Crescent Lagoon cores show a gradual decrease in grainsize down core,<br />
although there are several distinct s<strong>and</strong>y intervals evident at depth in the core.<br />
The grainsize distribution for grab samples of surface sediment from the bed of<br />
the lagoons is very similar to the muds sampled down core. There are two facies<br />
present in the FK406 cores (Table 13). Most of the sediment comprises unimodal<br />
fine silts <strong>and</strong> mud (
<strong>Sediment</strong> <strong>accumulation</strong> <strong>and</strong> <strong>Holocene</strong> evolution of the Fitzroy River lower floodplain<br />
Table 13: Summary of main sediment facies evident in the lagoon cores.<br />
Core Facies Mean Sorting S<strong>and</strong>:Silt:Clay<br />
FK406 (Crescent) Mud <strong>and</strong> fine silt 5 µm Unimodal 3:71:26<br />
S<strong>and</strong> <strong>and</strong> silt 15 µm Bimodal to trimodal 22:65:13<br />
FK407 (Frogmore) Mud <strong>and</strong> fine silt 5 µm Unimodal 3:75:22<br />
S<strong>and</strong> <strong>and</strong> silt 10 µm Bimodal 7:80:12<br />
Both lagoons deposits comprise large proportions of silt, suggesting that the<br />
majority of the sediment was probably suspended sediment transported <strong>and</strong><br />
deposited during floods (Figure 2). <strong>Sediment</strong>s from Frogmore Lagoon are slightly<br />
better sorted, with a smaller mean grain size. This difference is probably related<br />
to the local topography <strong>and</strong> variations in the influx of sediment during a flood at<br />
these two sites. Crescent Lagoon is closer to the main Fitzroy Channel <strong>and</strong><br />
therefore probably receives a larger sediment fraction in a flood.<br />
Stable isotopes<br />
Carbon <strong>and</strong> nitrogen isotopes were run on the organic component of 10–63 µm<br />
size fraction of samples from core FK406B (reported in Kuhnen, 2004; Figure<br />
15). Stable isotopes were also run on bulk samples from FK406F <strong>and</strong> on a<br />
couple of bulk samples from FK406E <strong>and</strong> FK407E. The results for the 10–63 µm<br />
fraction from FK406B show considerable variation down core (Kuhnen, 2004).<br />
Bulk stable isotopes from FK406F show similar trends to those on the 10–63 µm<br />
fraction, though possibly with a more pronounced excursion to more depleted<br />
values around a depth of 60 cm (Figure 16). These fluctuations have been<br />
attributed to large l<strong>and</strong> clearing events in the 1960s causing a change in organic<br />
material being exported from the catchment, from grassl<strong>and</strong>/savannah (δ 13 C ca -<br />
23‰) to eucalypt woodl<strong>and</strong> (δ 13 C ca -29‰). However in the top 20 cm of the<br />
cores the δ 13 C, measured on both the 10–63 µm size fraction <strong>and</strong> the bulk<br />
sediments, changes back to values more typical of those below 60 cm, (-22 to -<br />
24‰).<br />
A plot of δ 13 C v C:N shows that the data for Crescent Lagoon <strong>and</strong> Frogmore<br />
Lagoon primarily plot in the regions indicative of soil <strong>and</strong> terrestrial plants, with a<br />
couple of exceptions that reflect values typical of freshwater algae box (Figure<br />
17). One surface sediment sample with high δ 13 C <strong>and</strong> C:N is similar to flood<br />
samples analysed by Ford et al. (2005).<br />
38
<strong>Sediment</strong> <strong>accumulation</strong> <strong>and</strong> <strong>Holocene</strong> evolution of the Fitzroy River lower floodplain<br />
Figure 15: Stable isotopes <strong>and</strong> total nitrogen <strong>and</strong> total organic carbon in core FK406B analysed on the<br />
10–63 µm size fraction (Kuhnen, 2004).<br />
Figure 16: Bulk carbon <strong>and</strong> nitrogen stable isotope data for Crescent lagoon core FK406F. Vertical axis<br />
is depth down core in cm.<br />
39
<strong>Sediment</strong> <strong>accumulation</strong> <strong>and</strong> <strong>Holocene</strong> evolution of the Fitzroy River lower floodplain<br />
Figure 17: δ 13 C v C:N ratio for surface samples <strong>and</strong> push cores from Crescent Lagoon <strong>and</strong> Frogmore<br />
Lagoon.<br />
Biomarkers<br />
A variety of biomarkers were analysed, but all gave a similar distribution to<br />
stigmasterol (a typical terrestrial marker) shown in Figure 18, which is a typical<br />
biomarker degradation curve. When biomarkers are deposited in sediments they<br />
can undergo a variety of transformations. One conversion is from a sterol to a<br />
stanol due to anaerobic reducing conditions. Thus the ratio of the stanol to sterol<br />
can be used to gain an insight into sediment deposition rates. With constant<br />
deposition there should be little change in this ratio with depth. However an<br />
increase in the ratio signifies an increase in burial rate as the sterol has less time<br />
to be aerobically degraded <strong>and</strong> is subjected to anaerobic conditions. Figure 19<br />
shows the stigmastanol:stigmasterol ratio down the Crescent Lagoon core. It is<br />
clear that above the 60 cm marker there is evidence for enhanced burial rates.<br />
The top 5 cm are more similar to the values below 60 cm (around 0.3),<br />
suggesting that sedimentation rates have reduced in the last few years, which is<br />
consistent with the flood record.<br />
40
<strong>Sediment</strong> <strong>accumulation</strong> <strong>and</strong> <strong>Holocene</strong> evolution of the Fitzroy River lower floodplain<br />
Stigmasterol (ug/g dry wt)<br />
0 10 20 30 40 50 60 70 80 90<br />
0<br />
20<br />
40<br />
Depth<br />
60<br />
80<br />
100<br />
120<br />
Figure 18: Down core profile of stigmasterol in the Crescent Lagoon core FK406F. Depth in cm.<br />
Stanol:Sterol<br />
0.0 0.2 0.4 0.6 0.8 1.0<br />
0<br />
20<br />
40<br />
Depth<br />
60<br />
80<br />
100<br />
120<br />
Figure 19: Stigmastanol:stigmasterol values down the Crescent lagoon core FK406F. Depth in cm.<br />
Pollen<br />
Six sub-samples from Crescent Lagoon core FK406E were analysed for pollen<br />
type <strong>and</strong> abundance. There are a few variations evident within the core (Figure<br />
20). The majority of the samples are dominated by sclerophyll herbs <strong>and</strong><br />
41
<strong>Sediment</strong> <strong>accumulation</strong> <strong>and</strong> <strong>Holocene</strong> evolution of the Fitzroy River lower floodplain<br />
sclerophyll arboreal taxa, although there is some influx from aquatics, <strong>and</strong><br />
minimal input from gymnosperms, rainforest taxa, pteridophytes <strong>and</strong> mangroves.<br />
There is a reduction in the concentration of grains between 40 <strong>and</strong> 50 cm, which<br />
appears to correlate with the time of Brigalow clearing in the catchment (Kuhnen,<br />
2004) <strong>and</strong> possibly indicates an increase in total sediment, which may have<br />
diluted the concentration of pollen grains. At the base of the core the<br />
concentration of pollen grains is very small, but there is a large concentration of<br />
mangrove pollen compared with the rest of the samples. This significant change<br />
in mangrove pollen correlates with the distinct change in facies to a grey clay. It<br />
is possible that this grey clay is a relict surface, which was once part of the tidal<br />
system <strong>and</strong> there were mangroves proximal to what is now the position of the<br />
lagoon. An alternative hypothesis is that the mangrove pollen was transported<br />
into the lagoon during a flood, prior to the barrage, when mangroves colonized<br />
further upstream from Rockhampton.<br />
Geochemistry<br />
Geochemical analysis of samples from core FK406B was originally undertaken<br />
by Kuhnen (2004) <strong>and</strong> then extended by Smith et al. (2005) <strong>and</strong> Douglas et al.<br />
(2005). Using Bayesian statistical techniques it has been possible to determine<br />
the contributions of sediments from different rock types in the Fitzroy River<br />
catchment to the lagoon deposit (Kuhnen, 2004; Douglas et al., 2005).<br />
<strong>Sediment</strong>s are deposited in Crescent Lagoon during flood events when the river<br />
flow is greater than 6 000 000 megalitres. Results for FK406B suggest that under<br />
high flow conditions the majority of the sediment deposited in Crescent Lagoon is<br />
from the Bowen <strong>and</strong> Surat Basins in the catchment (Figure 21). The other main<br />
contribution of sediment is from the New Engl<strong>and</strong> Fold Belt, with some<br />
contribution also from the Tertiary basalts (
<strong>Sediment</strong> <strong>accumulation</strong> <strong>and</strong> <strong>Holocene</strong> evolution of the Fitzroy River lower floodplain<br />
Figure 20: Pollen data from 6 sub-samples from FK406E.<br />
43
<strong>Sediment</strong> <strong>accumulation</strong> <strong>and</strong> <strong>Holocene</strong> evolution of the Fitzroy River lower floodplain<br />
Figure 21: Graph to show the correlation between flood events <strong>and</strong> Surat <strong>and</strong> Bowen Basin sediment<br />
contribution to Crescent Lagoon core FK406B.<br />
44
<strong>Sediment</strong> <strong>accumulation</strong> <strong>and</strong> <strong>Holocene</strong> evolution of the Fitzroy River lower floodplain<br />
Geochronology<br />
Depth profile radionuclide activities are shown in Table 14 (Crescent lagoon) <strong>and</strong><br />
Table 16 (Frogmore lagoon). Three OSL dates were also determined on the<br />
Crescent lagoon sediment (Table 15). The detection of 137 Cs in the 56–60 cm<br />
depth section indicates a post-1958 age. The maximum 137 Cs activity occurs in<br />
the 52–56 cm interval, <strong>and</strong> may correspond to the years of peak 137 Cs fallout In<br />
Australia (1963–1965), although a direct correlation between fallout <strong>and</strong><br />
sediment activity cannot be assumed. This is due to fact that 137 Cs fluxes to the<br />
lagoon are likely controlled not just by direct fallout into the lagoon, but also by<br />
the transport of 137 Cs-labelled sediment from the Fitzroy catchment. The<br />
transport of this sediment will, in turn, be controlled by the erosion processes <strong>and</strong><br />
have a finite delay time.<br />
Table 14: Gamma spectrometry data for Crescent Lagoon core FK406B. CRS – Constant rate of supply.<br />
Depth (m)<br />
137 Cs<br />
226 Ra<br />
210 Pb Excess 210 Pb CRS<br />
0.00–0.02 1.9 ± 0.25 23.4 ± 0.4 49.0 ± 4.7 25.5 ± 4.8 0.0 ± 0.0<br />
0.08–0.11 1.0 ± 0.24 22.7 ± 0.4 50.7 ± 2.3 28.0 ± 2.3 3.2 ± 0.5<br />
0.24–0.28 2.6 ± 0.17 26.6 ± 0.4 52.1 ± 2.3 25.5 ± 2.4 13.0 ± 1.3<br />
0.36–0.40 3.4 ± 0.17 24.1 ± 0.3 47.2 ± 2.1 23.1 ± 2.1 24.0 ± 2.1<br />
0.48–0.52 4.8 ± 0.26 26.4 ± 0.4 34.7 ± 2.1 8.3 ± 2.1 35.9 ± 2.4<br />
0.52–0.56 7.5 ± 0.33 25.1 ± 0.5 36.0 ± 3.1 10.9 ± 3.1 37.7 ± 2.4<br />
0.56–0.60 5.2 ± 0.42 23.5 ± 0.6 39.7 ± 3.6 16.2 ± 3.7 40.0 ± 2.3<br />
0.60–0.64 0.3 ± 0.17 25.7 ± 0.3 28.7 ± 1.9 3.0± 1.9 45.1 ± 2.0<br />
0.64–0.68 -0.1 ± 0.18 29.9 ± 0.4 32.5 ± 1.4 2.6 ± 1.5<br />
0.72–0.76 -0.2 ± 0.17 28.8 ± 0.3 31.6 ± 1.8 2.8 ± 1.8<br />
0.80–0.84 -0.1 ± 0.17 27.2 ± 0.3 27.1 ± 1.5 -0.1 ± 1.5<br />
0.96–1.00 -0.2 ± 0.18 26.4 ± 0.3 29.4 ± 1.4 3.0 ± 1.4<br />
1.12–1.16 -0.1 ± 0.17 25.6 ± 0.3 28.2 ± 1.4 2.6 ± 1.4<br />
1.185–1.225 0 ± 0.18 27.9 ± 0.3 25.2 ± 1.5 -2.7 ± 1.5<br />
1.24–1.25 0 ± 0.23 26.5 ± 0.5 30.5 ± 2.5 4.0 ± 2.5<br />
1.25–1.31 0.1 ± 0.16 25.6 ± 0.2 37.5 ± 1.0 11.9 ± 1.1<br />
The excess 210 Pb profile in the upper 60 cm provides some chronological<br />
information, especially when considered in association with the 137 Cs profile, but<br />
the lack of detectable excess 210 Pb in the 60–125 cm interval does not provide a<br />
45
<strong>Sediment</strong> <strong>accumulation</strong> <strong>and</strong> <strong>Holocene</strong> evolution of the Fitzroy River lower floodplain<br />
detailed chronology prior to 1958. A variation on the constant rate of supply<br />
(CRS) model (Appleby, 2001) has been chosen to model excess 210 Pb in the<br />
upper 60 cm. The chronology is established by fixing the age of sediment at 60<br />
cm at 45 years, based on the 137 Cs profile, <strong>and</strong> assuming constant excess 210 Pb<br />
flux since that time. Given the sporadic nature of flows required to deliver<br />
sediment to the lagoon the assumption of constant excess 210 Pb flux is<br />
questionable. However, inaccuracies in ages introduced by this assumption are<br />
likely to be limited to just a few years, <strong>and</strong> longer-term (decadal) <strong>accumulation</strong><br />
rates are likely to be approximately correct. The calculated ages for the 0–60 cm<br />
depth interval are listed in Table 14. The average <strong>accumulation</strong> rate over the 45-<br />
year period since 1958 is 1.3 cm yr -1 (60 cm/45 years).<br />
As noted above, distinct laminations are seen in the sediment profile, especially<br />
in the interval spanning 46–60 cm. This interval also contains sections with<br />
distinctly higher mean grain sizes. The 210 Pb- 137 Cs chronology dates these layers<br />
as post 1958, <strong>and</strong> it is likely they span the period from the mid-1950s to the mid-<br />
1970s, also coinciding with the Brigalow Development Scheme. This period<br />
included a series of large floods in the lower Fitzroy River, <strong>and</strong> it is possible<br />
these floods are responsible for the variable character of the sediment deposited<br />
in this depth interval.<br />
An interesting <strong>and</strong> important feature of the excess 210 Pb profile is the<br />
reappearance of detectable excess 210 Pb at the base of the core in the region of<br />
high organic matter (125–131 cm interval). The non-detection of excess 210 Pb in<br />
the 60–125 cm interval probably represents the effects of high sediment fluxes<br />
diluting excess 210 Pb activities below detection, rather than indicating that the<br />
sediment is older than 120 years or so, the usual dating limit for 210 Pb. The fact<br />
that significant activities of excess 210 Pb reappear at 125 cm suggests the age of<br />
the base of the core is less than approximately 120 years, the maximum period<br />
of time over which one would expect to be able to detect fallout 210 Pb.<br />
OSL dating confirms the scenario described above (Table 16). The sediment just<br />
below the first appearance of 137 Cs (64–69 cm) is dated at less than 70 years<br />
(CLW-49/1, 45 ± 25 years), <strong>and</strong> the sediment in the organic rich layer that<br />
contains detectable excess 210 Pb is dated at 120 ± 28 years (CLW-49/3).<br />
<strong>Sediment</strong> at 120–125 cm is dated at 87 ± 10 years (CLW-49/2). Using this latter<br />
date <strong>and</strong> the 137 Cs age of 45 years at 60 cm gives a sediment <strong>accumulation</strong> rate<br />
of approximately 1.5 cm yr -1 for the first half of the 20 th century. This is similar to<br />
the rate for the second half determined from 137 Cs, 1.3 cm yr -1 , based on 60 cm<br />
of sediment <strong>accumulation</strong> in 45 years.<br />
46
<strong>Sediment</strong> <strong>accumulation</strong> <strong>and</strong> <strong>Holocene</strong> evolution of the Fitzroy River lower floodplain<br />
Table 15: OSL ages for FK406B <strong>and</strong> FK406D.<br />
Core Lab number Depth (m) Age<br />
FK406B CLW-49/1 0.64–0.69 45 ± 25 years<br />
FK406B CLW-49/2 1.20–1.25 87 ± 10 years<br />
FK406D CLW-49/3 135–137 cm 120 ± 28 years<br />
Dating of the dark organic-rich layer at around 120 years indicates a different<br />
sedimentation scenario in the mid 1800’s compared to that of the recent<br />
decades. The presence of residual activity of excess 210 Pb in the organic-rich<br />
layer suggests a lagoon environment conducive to <strong>accumulation</strong> of organic-rich<br />
sediment. The apparent rapid change from the <strong>accumulation</strong> of pale grey<br />
sediment, to the deposition of the organic rich layer, <strong>and</strong> then to grey sediment<br />
low in organic carbon, indicates drastic changes in the ecology of the lagoon.<br />
Such changes may represent the effects of the onset of clearing in the<br />
catchment by early European settlers. The time frame for these actions (the midlate<br />
1800’s) is consistent with our proposed chronology.<br />
47
<strong>Sediment</strong> <strong>accumulation</strong> <strong>and</strong> <strong>Holocene</strong> evolution of the Fitzroy River lower floodplain<br />
Table 16: Gamma spectrometry data for Frogmore Lagoon core FK407E. CRS – Constant rate of<br />
supply.<br />
Depth (m)<br />
137 Cs<br />
226 Ra<br />
210 Pb Excess 210 Pb CRS<br />
0.00–0.02 1.04 ± 0.21 20.3 ± 0.5 43.9 ± 3.1 23.6 ±3.1 0.0 ± 0.0<br />
0.05–0.07 1.41 ± 0.27 19.5 ± 0.6 55.3 ± 3.7 35.8 ±3.8 3.4 ± 0.4<br />
0.10–0.12 1.56 ± 0.26 19.5 ± 0.5 48.0 ± 3.4 28.6 ±3.4 6.9 ± 0.8<br />
0.20–0.22 1.80 ± 0.28 21.4 ± 0.6 41.0 ± 3.4 19.6 ± 3.5 13.1 ± 1.7<br />
0.40–0.42 1.93 ± 0.27 20.2 ± 0.5 31.1 ± 3.0 10.9 ± 3.1 23.1 ± 2.9<br />
0.50–0.53 2.48 ± 0.28 19.0 ± 0.5 29.7 ± 3.2 10.7 ± 3.2 28.2 ± 2.6<br />
0.60–0.62 6.26 ± 0.39 18.0 ± 0.6 27.8 ± 3.5 9.8 ± 3.5 32.8 ± 2.2<br />
0.66–0.69 10.28 ± 0.52 19.2 ± 0.6 30.6 ± 3.4 11.4 ± 3.5 37.2 ± 2.0<br />
0.71–0.73 6.46 ± 0.42 17.8 ± 0.6 30.2 ± 3.7 12.3 ± 3.7 40.3 ± 1.8<br />
0.76–0.79 3.75 ± 0.29 19.4 ± 0.5 29.7 ± 2.8 10.3 ± 2.8 45.0 ± 1.5<br />
0.80–0.82 0.08 ± 0.25 22.2 ± 0.6 22.6 ± 3.2 0.3 ± 3.3<br />
1.02–1.04 -0.21 ± 0.15 18.5 ± 0.4 19.4 ± 2.4 0.9 ± 2.5<br />
1.30–1.32 -0.05 ± 0.20 20.3 ± 0.5 19.5 ± 2.9 -0.8 ± 2.9<br />
1.50–1.52 -0.25 ± 0.22 15.5 ± 0.5 14.4 ±2.6 -1.1 ± 2.6<br />
The results from core FK407E show that 137 Cs first appears at a depth of 79 cm<br />
(Table 16), which represents approximately 1958 (47 years ago). This gives an<br />
<strong>accumulation</strong> rate of 1.75 cm yr -1 for the top 80 cm, which is slightly greater than<br />
Crescent Lagoon <strong>accumulation</strong> rates in the upper part of FK40B. As with the<br />
Crescent lagoon core, excess 210 Pb is not detected immediately below the 1958<br />
horizon, but unlike the Crescent core there is no reappearance of excess 210 Pb<br />
further down (total depth 1.52 m). This difference, however, may simply be due<br />
to the fact the Frogmore core did not penetrate deep enough to recover sediment<br />
equivalent to the dark organic rich layer seen in Crescent lagoon, or the light<br />
grey sediment seen immediately underneath. Overall, the chronologies of both<br />
lagoons indicate they are accumulating sediment at a rate of approximately 1.5<br />
cm yr -1 over the last 120 years.<br />
48
<strong>Sediment</strong> <strong>accumulation</strong> <strong>and</strong> <strong>Holocene</strong> evolution of the Fitzroy River lower floodplain<br />
Discussion<br />
Stratigraphic framework<br />
A stratigraphic framework for the floodplain of the Fitzroy River estuary was<br />
developed by cross-correlating geological features in sediment cores <strong>and</strong><br />
borehole logs. The stratigraphic record for the estuarine floodplain displays a<br />
typical <strong>Holocene</strong> coastal sequence of transgressive shallow-marine <strong>and</strong><br />
estuarine units capped by fluvial <strong>and</strong> estuarine deposits that were emplaced as<br />
the Fitzroy River estuary prograded to its present position at the southern end of<br />
Keppel Bay, during the last 6000 yrs of high, stable sea level. The cores clearly<br />
demonstrate that the estuary infilled an area that sat several meters lower the<br />
the present floodplain, providing accommodation space for the estuarine<br />
sediment. Radiocarbon <strong>and</strong> OSL ages for the base of the Geoprobe cores,<br />
supported by stable isotope data, show that by around 8000 years ago the<br />
marine transgression extended up the <strong>Holocene</strong> valley of the Fitzroy River to the<br />
present location of Rockhampton. This estuarine reach of the Fitzroy River<br />
migrated across the basin as it deposited estuarine <strong>and</strong> fluvial sediments. The<br />
industry boreholes in the south of the floodplain reveal relatively thick<br />
<strong>accumulation</strong>s of estuarine sediments that sit on a succession of channel/marine<br />
s<strong>and</strong> beds. These coarse sediments are similar to modern s<strong>and</strong> bar deposits in<br />
the south of Keppel Bay.<br />
It is difficult to determine the spatial extent of estuarine facies through time<br />
without more detailed, <strong>and</strong> expensive, coring. Nonetheless, our core data<br />
provides a useful stratigraphic framework for the estuary <strong>and</strong> floodplain.<br />
Mangrove pollen in several of the Geoprobe cores indicates that mangroves<br />
covered a large area of the floodplain in the middle <strong>Holocene</strong>. During this period,<br />
as sea level rose to reach its present level, a large area of what is now the lower<br />
floodplain would have been inundated by the sea. These areas were then rapidly<br />
infilled with estuarine deposits, similar to the ‘Big Swamp’ phase of coastal<br />
floodplain development that has been identified for macrotidal estuaries in<br />
northern Australia (Woodroffe et al., 1985; Woodroffe <strong>and</strong> Chappell, 1993). In the<br />
Fitzroy River estuary in the <strong>Holocene</strong>, mangroves initially developed in the area<br />
around Rockhampton <strong>and</strong> then across the basin. Over time, mangroves have<br />
become more restricted to the margins of the creeks <strong>and</strong> main channel as fluvial<br />
sediments built up the floodplain, <strong>and</strong> have shifted seawards as the mouth of the<br />
estuary prograded into Keppel Bay.<br />
49
<strong>Sediment</strong> <strong>accumulation</strong> <strong>and</strong> <strong>Holocene</strong> evolution of the Fitzroy River lower floodplain<br />
Fine sediment deposition <strong>and</strong> trapping efficiency<br />
Calculations of sediment mass <strong>accumulation</strong> show that a considerable proportion<br />
of the suspended sediment load of the Fitzroy River was trapped <strong>and</strong> stored in<br />
the floodplain during the middle <strong>and</strong> late <strong>Holocene</strong>. The proportion trapped<br />
ranges from 23% of the modern average annual suspended sediment load of the<br />
river as calculated by Kelly <strong>and</strong> Wong (1996), to 36% using the recent SedNet<br />
modelled loads of Dougall et al. (2005). However, the annual suspended<br />
sediment load is extremely variable (Kelly <strong>and</strong> Wong, 1996) <strong>and</strong> the modern<br />
<strong>accumulation</strong> rates in the northern lower floodplain are very low, in the order of 1<br />
mm yr -1 due to the present limited sediment accommodation space.<br />
The main depo-centre for modern sediment appears to be around the mouth of<br />
the Fitzroy River <strong>and</strong> the tidal creeks. Cores from the mangrove areas in<br />
Casuarina Creek <strong>and</strong> Kamiesh Passage reveal rapid <strong>accumulation</strong> of modern<br />
sediment in these environments (~1.5 cm yr -1 ). This finding is also supported by<br />
historical studies which show a rapid growth of bars <strong>and</strong> isl<strong>and</strong>s in the river<br />
mouth since 1941 <strong>and</strong> an expansion of mangroves (Duke et al., 2003).<br />
Mangroves act as an effective trap for sediment (Furukawa et al., 1997). They<br />
presently make up 130 km 2 of the Fitzroy Estuary (Heap et al., 2001). If we<br />
assume an average <strong>accumulation</strong> rate in these areas of 1.5 cm yr -1 then there<br />
has been approximately 1706 kilotonnes yr -1 of sediment accumulating in the<br />
mangrove areas. This is similar to the long-term (<strong>Holocene</strong>) annual fine sediment<br />
load that accumulated in the floodplain (Table 8), or approximately 19% of the<br />
total modern load estimated by Kelly <strong>and</strong> Wong (1996; 8800 kilotonnes yr -1 ) or<br />
30% of the SedNet estimate (Dougall et al., 2005; 4575 kilotonnes yr -1 ). This is<br />
likely to be an overestimate for the mangroves because higher tidal energy in<br />
some of the channels will prevent sediment deposition. Although flood flows of<br />
the Fitzroy River tend to bypass the tidal creeks initially, hydrodynamic models<br />
show that fine sediment is reworked by the tidal currents <strong>and</strong> transported into the<br />
tidal creeks <strong>and</strong> mangrove areas, especially Casuarina <strong>and</strong> Connor Creeks<br />
(Margvelashvili, pers comm.). In the Gulf of Papua it has been suggested that<br />
mangroves trap up to 14% of the total sediment load from the Kikori <strong>and</strong> Purari<br />
Rivers, with a sedimentation rate of 1.5 to 4.4 cm yr -1 (Walsh <strong>and</strong> Nittrouer,<br />
2004).<br />
A more accurate method of determining the rate of sediment mass <strong>accumulation</strong><br />
in the estuary would be to measure <strong>accumulation</strong> rates within each of the<br />
different estuarine facies areas (Figure 4). An overview of sediment<br />
<strong>accumulation</strong> in the floodplain <strong>and</strong> estuary is provided in Figure 22.<br />
50
<strong>Sediment</strong> <strong>accumulation</strong> <strong>and</strong> <strong>Holocene</strong> evolution of the Fitzroy River lower floodplain<br />
Figure 22: Rates of modern sediment <strong>accumulation</strong> between Rockhampton <strong>and</strong> Keppel Bay. A<br />
maximum rate of >1.5 cm yr -1 occurs in the tidal creeks/mangroves. The floodplain presently<br />
experiences very low rates of <strong>accumulation</strong> as there is a lack of accommodation space, except in the<br />
small freshwater lagoons which accumulate sediment during floods.<br />
Changing sedimentation rates<br />
It has been suggested that rates of sediment erosion in the catchment, transport<br />
<strong>and</strong> <strong>accumulation</strong> in the estuary <strong>and</strong> Keppel Bay have increased since European<br />
settlement <strong>and</strong> subsequent large-scale l<strong>and</strong> clearing. Neil et al., (2002)<br />
estimated the Fitzroy River has experienced a four-fold increase due to human<br />
disturbance of the catchment. Evidence for a slight increase in post-European<br />
sedimentation is apparent in the cores from the lagoons near Rockhampton.<br />
Although the lagoons are not large sediment traps, the sedimentary evidence<br />
from Crescent Lagoon appears to provide a continuous history of flood events in<br />
the Fitzroy River since the early 1900s. The OSL <strong>and</strong> 137 Cs/excess 210 Pb age<br />
estimates from Crescent Lagoon indicate a sedimentation rate of 1.3–1.5 cm yr -1<br />
for the top 120 cm, <strong>and</strong> suggest that there has been a significant increase in<br />
sedimentation in the last 90 years. Age data also suggest that the base of the<br />
core had lower sediment <strong>accumulation</strong> rates, approximately 1 cm yr -1 . An<br />
increase in the rate of sedimentation is also indicated by the biomarker<br />
stanol:sterol ratio, which shows enhanced burial rates above a depth of 60 cm,<br />
<strong>and</strong> there is also a reduction in the pollen concentration around this depth,<br />
possibly diluted by increased sedimentation.<br />
Cores from Crescent Lagoon also provide a detailed record of changes in<br />
catchment l<strong>and</strong> use, which likely influenced this increase in sediment discharge<br />
<strong>and</strong> subsequent <strong>accumulation</strong> rate. A considerable change is evident in the<br />
stable isotopes in the lagoon core at 60 cm depth, in both the 10–63 µm <strong>and</strong> bulk<br />
size fractions. This depth also corresponds to the first appearance of 137 Cs <strong>and</strong><br />
therefore has an age of approximately 1958 (Kuhnen, 2004; Hancock et al.,<br />
51
<strong>Sediment</strong> <strong>accumulation</strong> <strong>and</strong> <strong>Holocene</strong> evolution of the Fitzroy River lower floodplain<br />
2004). The geochemical analyses also show evidence of a change in sediment<br />
source at around 60 cm depth, switching from dominantly the Bowen <strong>and</strong> Surat<br />
Basin soils to a more local source in the New Engl<strong>and</strong> Fold Belt (Douglas et al in<br />
prep). This switch in source continues until 40 cm depth. This period of major<br />
change in sediment, from 60 to 40 cm depth, occurred at around the time of<br />
major l<strong>and</strong> clearing as part of the Brigalow Development Scheme, which started<br />
in the early 1960s (Kuhnen, 2004). The carbon <strong>and</strong> nitrogen isotopes also show<br />
a dramatic change at 20 cm depth that likely records the 1991 flood, which<br />
engulfed both Crescent <strong>and</strong> Frogmore Lagoons (Figure 2; Kuhnen, 2004).<br />
52
<strong>Sediment</strong> <strong>accumulation</strong> <strong>and</strong> <strong>Holocene</strong> evolution of the Fitzroy River lower floodplain<br />
Conclusions<br />
This study of the estuarine basin of the Fitzroy River has provided new insights<br />
into the <strong>Holocene</strong> evolution of the estuarine reach of the river <strong>and</strong> the significant<br />
spatial <strong>and</strong> temporal changes that have occurred in rates of sediment mass<br />
<strong>accumulation</strong>. Our findings provide a broader underst<strong>and</strong>ing of sedimentary<br />
process in the various depositional environments of the estuary, new insights<br />
into the impacts on the estuary of changes in catchment l<strong>and</strong> use <strong>and</strong> provide an<br />
essential geological context for studies of modern biophysical processes. The<br />
main findings of this study are:<br />
1. The stratigraphy of the Fitzroy River floodplain reveals a<br />
transgressive/highst<strong>and</strong> sequence typical of a stable <strong>Holocene</strong> tide-dominated<br />
estuarine basin.<br />
2. Since the mid <strong>Holocene</strong>, 16 000 megatonnes of sediment has been trapped<br />
<strong>and</strong> stored in the floodplain below Rockhampton. This is equivalent to 1992<br />
kilotonnes yr -1 of bulk sediment <strong>and</strong> 1636 kilotonnes yr -1 of fine sediment,<br />
approximately 23% <strong>and</strong> 36% of the modern average annual discharge past<br />
Rockhampton (Kelly <strong>and</strong> Wong, 1996; Dougall et al., 2005). However, the<br />
majority of the accommodation space in the floodplain is now filled in; therefore,<br />
there is relatively little modern sediment accumulating in this area (1 mm yr -1 ).<br />
3. The present focus of sedimentation is the river mouth <strong>and</strong> the tidal creeks in<br />
southern Keppel Bay. The highest rates of modern sediment <strong>accumulation</strong> are in<br />
the mangrove lined tidal creeks, with sedimentation rates up to 3.3 cm yr -1 .<br />
These data indicate that approximately 1706 kilotonnes yr -1 of sediment is<br />
presently accumulating in this environment. This is approximately 19% (Kelly <strong>and</strong><br />
Wong, 1996; 8800 kilotonnes yr -1 ) to 30% (Dougall et al., 2005; 4575 kilotonnes<br />
yr -1 ) of the Fitzroy River’s average annual suspended sediment load.<br />
4. The freshwater lagoons receive sediment during flood events <strong>and</strong> provide a<br />
detailed sedimentary record of major historical hydrological events. Variations in<br />
sediment physical properties, chemistry <strong>and</strong> organic matter composition appear<br />
to reflect major changes in l<strong>and</strong> use of the Fitzroy River catchment. Significant<br />
changes occurred in sediments that accumulated in Crescent Lagoon around the<br />
1960’s that appear to have coincided with a phase of large-scale l<strong>and</strong> clearing<br />
associated with the Brigalow Development Scheme.<br />
53
<strong>Sediment</strong> <strong>accumulation</strong> <strong>and</strong> <strong>Holocene</strong> evolution of the Fitzroy River lower floodplain<br />
References<br />
Amos, K.J., Alex<strong>and</strong>er, J., Horn, A., Pocock, G.D. <strong>and</strong> Fielding, C.R. (2004).<br />
Supply limited sediment transport in a high discharge event of the tropical<br />
Burdekin River, North Queensl<strong>and</strong>, Australia. <strong>Sediment</strong>ology, 51, 145–<br />
162.<br />
Appleby, P.G. (2001). Chronostratigraphic techniques in recent sediments. In:<br />
W.M. Last <strong>and</strong> P. Smoll (eds), Tracking Environmental Change using<br />
Lake <strong>Sediment</strong>s. Volume 1: Basin Analysis, Coring <strong>and</strong> Chronological<br />
Techniques. Kluwer Academic Publishers, Dordrecht, The Netherl<strong>and</strong>s.<br />
Belperio, A. P. (1983). Terrigenous sedimentation in the centra Great Barrier<br />
Reef lagoon. A model from the Burdekin region. BMR Journal of<br />
Australian Geology <strong>and</strong> Geophysics, 8; 179–190.<br />
Bligh, E. G. <strong>and</strong> Dyer, W. J. (1959). A rapid method of total lipid extraction <strong>and</strong><br />
purification. Canadian Journal of Biochemistry <strong>and</strong> Physiology, 37, 912–<br />
917.<br />
Blott, S. J., <strong>and</strong> Pye, K. (2001). Gradistat: a grain size distribution <strong>and</strong> statistics<br />
package for the analysis of unconsolidated sediments. Earth Surface<br />
Process <strong>and</strong> L<strong>and</strong>forms, 26, 1237–1248.<br />
Bostock, H., Radke, L., Brooke, B. <strong>and</strong> Ryan, D. (2005a). Report on sediments in<br />
lagoons on the Fitzroy River lower floodplain <strong>and</strong> tidal creeks.<br />
Cooperative Research Centre for Coastal Zone, Estuary <strong>and</strong> Waterway<br />
Management, Milestone Report ACsupp.6.<br />
Bostock, H.C., Ryan, D.A., Brooke, B.P., Hancock, G., <strong>and</strong> Pietsch, T. (2005c).<br />
<strong>Sediment</strong> <strong>accumulation</strong> <strong>and</strong> <strong>Holocene</strong> evolution of Keppel Bay, southeast<br />
Queensl<strong>and</strong>, Australia. Draft Final Report, Cooperative Researach<br />
Centre for Coastal Zone, Estuary <strong>and</strong> Waterway Management, Milestone<br />
Report AC65.<br />
Brooke, B., Ryan, D., Skene, D., Olley, J., Pietsch, T., Douglas, G., Radke, L. <strong>and</strong><br />
Flood, P. (2004). Report on the Keppel Bay beach ridge plain.<br />
Cooperative Research Centre for Coastal Zone, Estuary <strong>and</strong> Waterway<br />
Management, Milestone Report AC42.<br />
Coffey <strong>and</strong> Hollingsworth (1966a). Assessment of Brine Availability Port Alma.<br />
Unpublished report. Geological Survey of Queensl<strong>and</strong> Library.<br />
Coffey <strong>and</strong> Hollingsworth (1966b). Assessment of Brine Availability Port Alma.<br />
Unpublished report. Geological Survey of Queensl<strong>and</strong> Library.<br />
54
<strong>Sediment</strong> <strong>accumulation</strong> <strong>and</strong> <strong>Holocene</strong> evolution of the Fitzroy River lower floodplain<br />
Connell, D. W., Bycroft, B. M., Miller, G. J. <strong>and</strong> Lather, P. (1981). Effects of a<br />
barrage on flushing <strong>and</strong> water quality in the Fitzroy River estuary,<br />
Queensl<strong>and</strong>. Australian Journal of Marine <strong>and</strong> Freshwater Research, 32,<br />
57–63.<br />
Dougall, C., Packett, R. <strong>and</strong> Carroll, C. (2005). Application of the SedNet model<br />
in partnership with the Fitzroy Basin community. In Zerger, A. <strong>and</strong> Argent,<br />
R.M. (eds) MODSIM 2005 International Congress on Modelling <strong>and</strong><br />
Simulation. Modelling <strong>and</strong> Simulation Society of Australia <strong>and</strong> New<br />
Zeal<strong>and</strong>, December 2005.<br />
Douglas et al. (in prep). <strong>Sediment</strong> sources <strong>and</strong> geochronology in Crescent<br />
Lagoon, Lower Fitzroy River basin, Queensl<strong>and</strong>, Australia. Chemical<br />
Geology.<br />
Douglas, G., Ford, P., Palmer, M. J., <strong>and</strong> Noble, R. (2005). Identification of<br />
sediment sources in the Fitzroy River Basin <strong>and</strong> Estuary, Queensl<strong>and</strong>,<br />
Australia. Cooperative Research Centre for Coastal Zone, Estuary <strong>and</strong><br />
Waterway Management, Technical Report, No. 13.<br />
Duke, N.C., Lawn, P.T., Roelfsema, C.M., Zahmel, K.N., Pedersen, D.K., Harris,<br />
C., Steggles, N. <strong>and</strong> Tack, C. (2003). Assessing historical change in<br />
coastal environments: Port Curtis, Fitzroy River Estuary <strong>and</strong> Moreton Bay<br />
regions. Cooperative Research Centre for Coastal Zone, Estuary <strong>and</strong><br />
Waterway Management, Milestone Report.<br />
Dunstan, B. (1914). Salt wells at Casuarina Isl<strong>and</strong>. Queensl<strong>and</strong> Government<br />
Mining Journal, 15, 498.<br />
Dunstan, B. (1920). Salt Article 1 in Industrial Minerals. Publication of the<br />
Geological Survey of Queensl<strong>and</strong>, 268.<br />
Folk, R. L., Andrews, P. B., <strong>and</strong> Lewis, D. W. (1970). Detrital sedimentary rock<br />
classification <strong>and</strong> nomenclature for use in New Zeal<strong>and</strong>. New Zeal<strong>and</strong><br />
Journal of Geology <strong>and</strong> Geophysics, 13, 937–968.<br />
Ford, P., Tillman, P., Robson, B. <strong>and</strong> I.T. Webster (2005). Organic carbon<br />
deliveries <strong>and</strong> their flow related dynamics in the Fitzroy estuary. Marine<br />
Pollution Bulletin, 51, 119–127.<br />
Franz J, <strong>and</strong> Piorewicz J. (2003). Evaluation of sediment transport in the lower<br />
part of the Fitzroy River, Queensl<strong>and</strong>. Australian Journal of Water<br />
Resources, IEAust, 6, 131–150. http://www.eng.newcastle.edu.au/~ncwe/<br />
55
<strong>Sediment</strong> <strong>accumulation</strong> <strong>and</strong> <strong>Holocene</strong> evolution of the Fitzroy River lower floodplain<br />
Fry, B. <strong>and</strong> Smith, T.J. (2002). Stable isotope studies of red mangroves <strong>and</strong> filter<br />
feeders from the shark river estuary, Florida. Bulletin of Marine Science,<br />
70, 871–890.<br />
Furnas, M. (2003). Catchments <strong>and</strong> Corals: Terrestrial Runoff to the Great Barrier<br />
Reef. Australian Institute of Marine Science <strong>and</strong> CRC Reef Research<br />
Centre, Townville, 334 pp.<br />
Furukawa, K., Wolanski, E. <strong>and</strong> Mueller, H. (1997). Currents <strong>and</strong> sediment<br />
transport in mangrove forests. Estuarine, Coastal <strong>and</strong> Shelf Science, 44,<br />
301–310.<br />
Galbraith, R.F., Roberts, R.G., Laslett, G.M., Yoshida, H. <strong>and</strong> Olley, J.M. (1999).<br />
Optical dating of single <strong>and</strong> multiple grains of quartz from Jinmium rock<br />
shelter, northern Australia, part 1, Experimental design <strong>and</strong> statistical<br />
models. Archaeometry, 41: 339–364.<br />
Hancock, G.J., Kuhnen, M., Radke, L., Brooke, B., Skene, D. <strong>and</strong> Ryan, D.<br />
(2004). <strong>Sediment</strong>ation history of the floodplain of the upper Fitzroy River<br />
estuary as determined from sediment cores from Crescent Lagoon.<br />
Cooperative Research Centre for Coastal Zone, Estuary <strong>and</strong> Waterway<br />
Management, Milestone Report AC39.<br />
Heap, A. D., Bryce, S., Ryan, D., Radke, L., Smith, C., Smith, R., Harris, P., <strong>and</strong><br />
Heggie, D. (2001). Australian estuaries <strong>and</strong> coastal waterways: a<br />
geoscience perspective for improved <strong>and</strong> integrated resource<br />
management. AGSO Record 2001/07. 118 pp.<br />
Hekel, H. (1980). Quaternary <strong>and</strong> marine geology of the Capricorn Coast. In<br />
Hofmann, G. W. (Ed) Mount Morgan Rundle Range Yeppoon Area, 1980<br />
Field Conference. Geological Society of Australia, Inc., Queensl<strong>and</strong><br />
Division. pp. 66–71.<br />
Horn, A., Joo, M. <strong>and</strong> Poplawski, W (1998). Queensl<strong>and</strong> riverine sediment<br />
transport rates – A progress report. Department of Natural Resources,<br />
Queensl<strong>and</strong>, Water Quality Group Report No.2/98.<br />
Joo, M., Yu, B., Fentie, B. <strong>and</strong> Caroll, C. (2005). Estimation of long-term sediment<br />
loads in the Fitzroy catchment, Queensl<strong>and</strong>, Australia. In: Zerger, A. <strong>and</strong><br />
Argent, R.M. (eds) MODSIM 2005 International Congress on Modelling<br />
<strong>and</strong> Simulation. Modelling <strong>and</strong> Simulation Society of Australia <strong>and</strong> New<br />
Zeal<strong>and</strong>, December 2005.<br />
http://www.mssanz.org.au/modsim05/papers/joo.pdf<br />
Kelly, J. N. <strong>and</strong> Wong, W. T. (1996). <strong>Sediment</strong> transport in the Fitzroy River<br />
during flood events. In: I. Rutherford <strong>and</strong> M. Walker, (Eds) Proceedings<br />
56
<strong>Sediment</strong> <strong>accumulation</strong> <strong>and</strong> <strong>Holocene</strong> evolution of the Fitzroy River lower floodplain<br />
of the 1st National Conference of Stream Management in Australia ( pp.<br />
19–21). Merrijig: IEA.<br />
Kuhnen, M. (2004). Constraining the source areas <strong>and</strong> nutrient transport of<br />
sediments entering the Fitzroy Estuary since European arrival.<br />
Department of Earth <strong>and</strong> Marine Sciences, The Australian National<br />
University. Unpublished honours thesis.<br />
Laycock, J.W.(1976). Brine occurrences in Queensl<strong>and</strong> – Assessment of Port<br />
Alma brine fields. Queensl<strong>and</strong> Department of Mines Record 1976/24.<br />
Mackey, A.P. (1991). Aspects of the limnology of Yeppen Yeppen Lagoon,<br />
Central Queensl<strong>and</strong>. Australian Journal of Marine <strong>and</strong> Freshwater<br />
Research, 42, 309–325.<br />
McCormac, F.G., Hogg, A.G., Blackwell, P.G., Buck, C.E., Higham, T.F.G. <strong>and</strong><br />
Reimer, P.J. (2004). SHCal04 Southern Hemisphere Calibration 0 - 11.0<br />
cal kyr BC. Radiocarbon, 46, 1087–1092<br />
McKergow, L.A., Prosser, I.P., Hughes, A.O., Brodie, J. (2005). Sources of<br />
sediment to the Great Barrier Reef World Heritage Area. Marine Pollution<br />
Bulletin, 51, 200–211.<br />
Moss, A.J., Rayment, G.E., Reilly, N. <strong>and</strong> Best, E.K. (1992). A preliminary<br />
assessment of sediment <strong>and</strong> nutrient exports from Queensl<strong>and</strong> coastal<br />
catchments. Queensl<strong>and</strong> Department of Environment <strong>and</strong> Heritage<br />
Report, Brisbane.<br />
Moss, P.T., Kershaw, A.P. <strong>and</strong> Grindrod, J. (2005). Pollen transport <strong>and</strong><br />
deposition in riverine <strong>and</strong> marine environments within the humid tropics<br />
of northeastern Australia. Review of Palaeobotany <strong>and</strong> Palynology, 134,<br />
55–69.<br />
Murray, A.S., Marten, R., Johnson, A. <strong>and</strong> Martin, P. (1987). Analysis for naturally<br />
occurring radionuclides at environmental concentrations by gamma<br />
spectrometry. Radioanalytical <strong>and</strong> Nuclear Chemistry Articles, 115, 263–<br />
268.<br />
Murray, C. G. (1980). General geology of the Rockhampton area. In Hofmann, G.<br />
W. (Ed) Mount Morgan Rundle Range Yeppoon Area, 1980 Field<br />
Conference. Geological Society of Australia, Inc., Queensl<strong>and</strong> Division.<br />
pp. 4–24.<br />
Neil, D.T. <strong>and</strong> Yu, B. (1996). Fluvial sediment yield to the Great Barrier Reef<br />
lagoon: spatial patterns <strong>and</strong> the effect of l<strong>and</strong> use. In: Hunter, H.M.,<br />
57
<strong>Sediment</strong> <strong>accumulation</strong> <strong>and</strong> <strong>Holocene</strong> evolution of the Fitzroy River lower floodplain<br />
Eyles, A.G. <strong>and</strong> Rayment, G.E. (eds) Downstream effects of l<strong>and</strong> use.<br />
Department of Natural Resources, Brisbane, pp. 281–286.<br />
Neil, D.T., Orpin, A.R., Ridd, P.V. <strong>and</strong> Bofu, Y. (2002). <strong>Sediment</strong> yield <strong>and</strong><br />
impacts from river catchments to the Great Barrier Reef lagoon.<br />
Australian Journal of Marine <strong>and</strong> Freshwater Research, 53, 733–752.<br />
Noon, T.A. (1980). Stratigraphic drilling report – GSQ Rockhampton 1.<br />
Queensl<strong>and</strong> Government Mining Journal, 81, 261–266.<br />
Olley, J.M., De Deckker, P., Roberts, R.G., Fifield, L.K., Yoshida, H. <strong>and</strong><br />
Hancock, G. (2004a). Optical dating of deep-sea sediments using single<br />
grains of quartz: a comparison with radiocarbon. <strong>Sediment</strong>ary Geology,<br />
169(3–4): 175–189.<br />
Olley, J.M., Pietsch, T. <strong>and</strong> Roberts, R.G., (2004b). Optical dating of <strong>Holocene</strong><br />
sediments from a variety of geomorphic settings using single grains of<br />
quartz. Geomorphology, 60(3–4): 337–358.<br />
Prosser, I., Young, B., Rustomji, P., Moran, C. <strong>and</strong> Hughes, A. (2001).<br />
Constructing river basin sediment budgets for the National L<strong>and</strong> <strong>and</strong><br />
Water Resources Audit. CSIRO L<strong>and</strong> <strong>and</strong> Water Technical Report 15/01,<br />
Canberra. http://www.clw.csiro.au/publication/techical2001/tr15-01.pdf<br />
Radke, L.C., Ford, P.W., Webster, I.T., Douglas, G., Oubelkheir, K., Atkinson, I.,<br />
Robson, B., Verwey, P., MacKenzie, K. <strong>and</strong> L. Clementson (2005).<br />
Results of two dry season surveys of Keppel Bay <strong>and</strong> Casuarina Creek:<br />
biogeochemical properties of the water column <strong>and</strong> underlying<br />
sediments. Cooperative Research Centre for Coastal Zone, Estuary <strong>and</strong><br />
Waterway Management, CRC Milestone AC49.<br />
Radke, L.C., Prosser, I., Robb, M., Brooke, B., Fredericks, D., Douglas, G.B. <strong>and</strong><br />
Skemstad, J. (2004). The relationship between sediment <strong>and</strong> water<br />
quality <strong>and</strong> riverine sediment loads in the wave-dominated estuaries of<br />
southwest Western Australia. Journal of Marine <strong>and</strong> Freshwater<br />
Research, 55, 1–16.<br />
Robbins, J.A. (1978). Geochemical <strong>and</strong> geophysical applications of radioactive<br />
lead. Elsevier.<br />
Ross, D. J. (2002). Acid Sulphate Soils, Tannum S<strong>and</strong>s to St Lawrence, Central<br />
Queensl<strong>and</strong> Coast. Department of Natural Resources <strong>and</strong> Mines,<br />
QNRM02008, 70 pp.<br />
Ryan, D.A., Skene, D., Brooke, B., Kuhnen, M. <strong>and</strong> Radke, L. (2004). Report on<br />
floodplain <strong>and</strong> estuarine sediment data. Cooperative Research Centre for<br />
58
<strong>Sediment</strong> <strong>accumulation</strong> <strong>and</strong> <strong>Holocene</strong> evolution of the Fitzroy River lower floodplain<br />
Coastal Zone, Estuary <strong>and</strong> Waterway Management, Milestone Report<br />
AC40.<br />
Ryan, D. <strong>and</strong> B. Brooke (2003). Report on the 1 st floodplain <strong>and</strong> estuary<br />
sediments field survey, September 2003. Cooperative Research Centre<br />
for Coastal Zone, Estuary <strong>and</strong> Waterway Management, Milestone Report.<br />
Skene, D., Brooke, B. <strong>and</strong> Ryan, D. (2004). Sub-bottom profiling, surface<br />
sediment sampling <strong>and</strong> vibracoring in the Fitzroy River Estuary <strong>and</strong><br />
Keppel Bay, Central Queensl<strong>and</strong> Coast. Cooperative Research Centre<br />
for Coastal Zone, Estuary <strong>and</strong> Waterway Management, Milestone Report<br />
CG04.01, 36 pp.<br />
Smith, J., Douglas, G., Radke, L., Palmer, M. <strong>and</strong> Brooke, B. (2005). Identifying<br />
sources of catchment-derived sediment to Keppel Bay <strong>and</strong> the Fitzroy<br />
River floodplain in tropical Queensl<strong>and</strong>, Australia. Draft Final Report,<br />
Cooperative Research Centre for Coastal Zone, Estuary <strong>and</strong> Waterway<br />
Management, Milestone Report AC65.<br />
Stalker, L., Bryce, A.J., <strong>and</strong> Andrew, A.S. (2005). A re-evaluation of the carbon<br />
isotopic composition of organic reference materials. Organic<br />
Geochemistry, 36, 827–834.<br />
Stokes, S., Ingram, S., Aitken, M.J., Sirocko, F., Anderson, R., <strong>and</strong> Leuschner, D.<br />
(2003). Alternative chronologies for Late Quaternary (Last Interglacial –<br />
<strong>Holocene</strong>) deep sea sediment via optical dating of silt-size quartz.<br />
Quaternary Science Reviews, 22, 925–941.<br />
Verardo, D.J., Froelich, P.N., <strong>and</strong> Mcintyre, A. (1990). Determination of Organic-<br />
Carbon <strong>and</strong> Nitrogen in Marine-<strong>Sediment</strong>s Using the Carlo-Erba-Na-1500<br />
Analyzer. Deep-Sea Research I, 37, 157–165.<br />
Walsh, J.P. <strong>and</strong> Nittrouer, C.A. (2004). Mangrove-bank sedimentation in a<br />
mesotidal environment with large sediment supply, Gulf of Papua. Marine<br />
Geology, 208, 225–248.<br />
Webster, B. <strong>and</strong> Mullins, S. (2003).. Nature, Progress <strong>and</strong> the 'Disorderly' Fitzroy:<br />
The Vain Quest for Queensl<strong>and</strong>'s 'Noblest Navigable River', 1865-1965.<br />
Environment <strong>and</strong> History, 9, 275–299<br />
Woodroffe, C. D. <strong>and</strong> Chappell, J. (1993). <strong>Holocene</strong> emergence <strong>and</strong> evolution of<br />
the McArthur River delta, southwestern Gulf of Carpenteria, Australia.<br />
<strong>Sediment</strong>ary Geology, 83, 303–317.<br />
59
<strong>Sediment</strong> <strong>accumulation</strong> <strong>and</strong> <strong>Holocene</strong> evolution of the Fitzroy River lower floodplain<br />
Woodroffe, C. D., Thom, B. G., <strong>and</strong> Chappell, J. (1985). Development of<br />
widespread mangrove swamps in mid-<strong>Holocene</strong> times in northern<br />
Australia. Nature, 317, 711–713.<br />
60
<strong>Sediment</strong> <strong>accumulation</strong> <strong>and</strong> <strong>Holocene</strong> evolution of the Fitzroy River lower floodplain<br />
Appendix<br />
Stable isotopes <strong>and</strong> TN <strong>and</strong> TOC for
<strong>Sediment</strong> <strong>accumulation</strong> <strong>and</strong> <strong>Holocene</strong> evolution of the Fitzroy River lower floodplain<br />
Facies Thickness (m) Cumulative thickness (m)<br />
Clay 10.06 10.06<br />
S<strong>and</strong> 4.88 14.94<br />
Clay <strong>and</strong> stone 1.524 16.464<br />
Clay 6.1 22.564<br />
Fine s<strong>and</strong> 1.524 24.088<br />
Clay <strong>and</strong> s<strong>and</strong> 1.22 25.308<br />
S<strong>and</strong> 0.91 26.218<br />
Stone <strong>and</strong> s<strong>and</strong> 0.61 26.828<br />
Clay <strong>and</strong> stone 0.91 27.738<br />
S<strong>and</strong> 1.98 29.718<br />
Gravel 0.15 29.868<br />
S<strong>and</strong> <strong>and</strong> soil 1.22 31.088<br />
Stone 0.15 31.238<br />
S<strong>and</strong> <strong>and</strong> soil 0.91 32.148<br />
Clay <strong>and</strong> stone 0.3 32.448<br />
S<strong>and</strong> <strong>and</strong> gravel 3.05 35.498<br />
Clay 1.83 37.328<br />
Borehole PB5<br />
Facies Thickness (m) Cumulative Thickness (m)<br />
Top soil 0.45 0.45<br />
Yellow <strong>and</strong> red clay 0.76 1.21<br />
Blue clay 3.66 4.87<br />
Whitish green clay 2.74 7.61<br />
Yellow s<strong>and</strong> <strong>and</strong> clay 4.57 12.18<br />
Coarse s<strong>and</strong> 0.61 12.79<br />
Clay <strong>and</strong> s<strong>and</strong> 3.66 16.45<br />
Sticky yellow clay 2.44 18.89<br />
S<strong>and</strong> 1.22 20.11<br />
Clay 0.61 20.72<br />
S<strong>and</strong> <strong>and</strong> gravel 7.92 28.64<br />
Clay 0.3 28.94<br />
Coarse s<strong>and</strong> <strong>and</strong> gravel with<br />
3.35 32.29<br />
stones<br />
Coarse s<strong>and</strong> 1.83 34.12<br />
62