Green Infrastructure for the East Midlands - River Nene Regional Park
Green Infrastructure for the East Midlands - River Nene Regional Park
Green Infrastructure for the East Midlands - River Nene Regional Park

You also want an ePaper? Increase the reach of your titles
YUMPU automatically turns print PDFs into web optimized ePapers that Google loves.
GREEN<br />
INFRASTRUCTURE<br />
FOR THE<br />
EAST MIDLANDS<br />
A PUBLIC BENEFIT MAPPING PROJECT
GREEN<br />
INFRASTRUCTURE<br />
FOR THE<br />
EAST MIDLANDS<br />
A PUBLIC BENEFIT MAPPING PROJECT<br />
ENVIRONMENTAL INFRASTRUCTURE<br />
CONSISTS OF THE PHYSICAL FEATURES AND NATURAL RESOURCES OF THE ENVIRONMENT<br />
(WATER, AIR, MINERALS, SOIL) THAT PROVIDE SERVICES OR SUPPORT TO SOCIETY. PHYSICAL<br />
FEATURES INCLUDE FLOODPLAINS AND COASTLINES. THE CAPACITY OF NATURAL<br />
RESOURCES TO PROVIDE SERVICES CAN BE EXCEEDED, IN TERMS OF EITHER QUALITY OR<br />
QUANTITY. IN ORDER TO DELIVER SUSTAINABLE DEVELOPMENT, THESE RESOURCES MUST<br />
BE MANAGED SUSTAINABLY TO CONTINUE TO MEET FUTURE NEEDS OF SOCIETY, TAKING<br />
INTO ACCOUNTPARTICULARLY THE EFFECTS OF CLIMATE CHANGE.<br />
GREEN INFRASTRUCTURE<br />
IS A NETWORK OF MULTI -FUNCTIONAL GREENSPACE WHICH SITS WITHIN, AND CONTRIBUTES<br />
TO, THE TYPE OF HIGH QUALITY NATURAL AND BUILT ENVIRONMENT REQUIRED TO DELIVER<br />
‘SUSTAINABLE COMMUNITIES’. DELIVERING, PROTECTING AND ENHANCING THIS NETWORK<br />
REQUIRES THE CREATION OF NEW ASSETS TO LINK WITH RIVER CORRIDORS, WOODLANDS,<br />
NATURE RESERVES AND URBAN GREENSPACE AND OTHER EXISTING ASSETS. IF PROPERLY<br />
PLANNED AND MANAGED, GREEN INFRASTRUCTURE SHOULD ALSO CONTRIBUTE TO WIDER<br />
ENVIRONMENTAL INFRASTRUCTURE THROUGH LOCAL CLIMATE AND AIR QUALITY<br />
AMELIORATION, FLOODPLAIN MANAGEMENT, AND COASTAL SEA DEFENCES.<br />
1
FORWARD<br />
Ensuring <strong>the</strong> delivery of green infrastructure is one of five key priorities in <strong>the</strong> Integrated<br />
<strong>Regional</strong> Strategy, which is <strong>the</strong> <strong>East</strong> <strong>Midlands</strong> sustainable development framework.<br />
The <strong>Regional</strong> Assembly's Environment group has been working with partners to link<br />
regional environmental policy to <strong>the</strong> delivery mechanisms at regional, sub-regional and<br />
local levels. This document; <strong>Green</strong> <strong>Infrastructure</strong> <strong>for</strong> <strong>the</strong> <strong>East</strong> <strong>Midlands</strong> - a Public<br />
Benefit Mapping Project [title in italics] maps <strong>the</strong> multiple public benefits that green<br />
infrastructure can deliver across <strong>the</strong> region. These benefits include adapting to climate<br />
change, improving health and biodiversity.<br />
THIS PROVIDES THE STRATEGIC FRAMEWORK FOR ALL PARTNERS TO DELIVER THE "GREEN" BIT OF<br />
SUSTAINABLE COMMUNITIES IN THE EAST MIDLANDS. WE HOPE THIS PROVIDES A GREAT STARTING<br />
POINT FOR ALL PARTNERS TO PLAY A VITAL ROLE IN ENSURING A BETTER QUALITY OF LIFE FOR ALL.<br />
MATT DORAN<br />
Chair of <strong>the</strong><br />
Environment Group<br />
JOHN FREEMAN<br />
Chair of <strong>the</strong> <strong>Regional</strong> and<br />
Communities Policy Board.<br />
Funding Partners:<br />
2
A PUBLIC<br />
BENEFIT MAPPING<br />
PROJECT<br />
CONTENTS<br />
PAGE<br />
1.0 INTRODUCTION 5<br />
1.1 BACKGROUND TO THE STUDY 5<br />
1.2 GREEN INFRASTRUCTURE – DEFINITIONS AND BENEFITS 5<br />
1.3 THE PUBLIC BENEFIT RECORDING SYSTEM (PBRS) APPROACH 6<br />
2.0 AIMS AND OBJECTIVES 6<br />
3.0 METHODOLOGY 7<br />
3.1 STAKEHOLDER DATABASE 7<br />
3.2 REGIONAL STRATEGY REVIEW 7<br />
3.3 GEOGRAPHIC AND DEMOGRAPHIC BASELINE MAPPING 7<br />
3.4 PUBLIC BENEFIT MAPPING 7<br />
3.5 CONSULTATION 8<br />
4.0 GEOGRAPHIC AND DEMOGRAPHIC BASELINE MAPS 9<br />
5.0 PUBLIC BENEFIT MAPS – THE EVIDENCE BASE 14<br />
6.0 COMBINING THE EVIDENCE – TOWARDS A PUBLIC 42<br />
BENEFIT ASSESSMENT<br />
7.0 SUMMARY AND CONCLUSIONS 53<br />
8.0 RECOMMENDATIONS FOR FUTURE WORK 55<br />
8.1 DEVELOPING INDICATORS FOR GREEN INFRASTRUCTURE 55<br />
8.2 GREEN INFRASTRUCTURE RESOURCE MAPPING 55<br />
8.3 DEFINING A GREEN INFRASTRUCTURE SKELETON FOR THE REGION 56<br />
8.4 MULTI-FUNCTIONALITY AND SCALE 57<br />
8.5 CREATING A GREEN INFRASTRUCTURE GUIDE 57<br />
8.6 DEVELOPING A GREEN INFRASTRUCTURE PLANNING TOOLKIT 58<br />
8.7 PROMOTING A REGIONAL GREEN INFRASTRUCTURE NETWORK 58<br />
9.0 KEY REFERENCES 59<br />
ACKNOWLEDGEMENTS 60<br />
APPENDIX 1<br />
GREEN INFRASTRUCTURE RESPONSE TO THE OBJECTIVES OF 61<br />
THE EAST MIDLANDS INTEGRATED REGIONAL STRATEGY<br />
APPENDIX 2<br />
NOTES OF THE STAKEHOLDER CONSULTATION WORKSHOP 67<br />
31ST MAY 2006.<br />
APPENDIX THREE<br />
EAST MIDLANDSPUBLIC BENEFIT MAPPING PROJECT 73<br />
3
EXECUTIVE SUMMARY<br />
28TH JULY 2006<br />
The purpose of this study was to identify whe<strong>the</strong>r <strong>the</strong> Public<br />
Benefit Recording System (PBRS) technique could be applied<br />
to <strong>the</strong> <strong>East</strong> <strong>Midlands</strong> region to identify where <strong>the</strong> greatest public<br />
benefit could be derived from investments in <strong>Green</strong><br />
<strong>Infrastructure</strong> (GI).<br />
The Integrated <strong>Regional</strong> Strategy (IRS) outlines 17 key<br />
objectives <strong>for</strong> <strong>the</strong> region across social, economic and<br />
environmental <strong>the</strong>mes. The provision or enhancement of GI<br />
can contribute significantly to <strong>the</strong> achievement of most of <strong>the</strong>se.<br />
Geographical In<strong>for</strong>mation Systems (GIS) were used to spatially<br />
and <strong>the</strong>matically map where GI could contribute to <strong>the</strong> IRS<br />
objectives. Appropriate indicator datasets, ranging in scale<br />
from neighbourhood to local authority level, were identified to<br />
enable <strong>the</strong>se assessments. Data was benchmarked and<br />
ranked in order to provide a robust regional focus and to<br />
account <strong>for</strong> urban, rural and national contexts where appropriate.<br />
Twenty seven ‘public benefit’ maps were produced, each relating<br />
to a separate <strong>the</strong>me of <strong>the</strong> IRS (eg. health, housing, cultural<br />
assets etc.), to identify where <strong>the</strong>re is greatest need and/or<br />
opportunity <strong>for</strong> GI to contribute to IRS objectives. The maps<br />
are presented, each with a narrative, outlining areas of particular<br />
priority <strong>for</strong> GI, toge<strong>the</strong>r with a short discussion on <strong>the</strong><br />
limitations of <strong>the</strong> data.<br />
The greatest depth of public benefit will generally be derived<br />
where greatest need and opportunity coincide and where multiple<br />
objectives may be delivered in parallel. A simple scoring<br />
system was devised to represent <strong>the</strong> depth of public benefit<br />
potentially attainable from GI <strong>for</strong> each of <strong>the</strong> objectives,<br />
spatially across <strong>the</strong> region. Public benefit scores were <strong>the</strong>n<br />
combined within and across <strong>the</strong> social, economic and<br />
environmental <strong>the</strong>mes to create maps highlighting <strong>the</strong><br />
potential <strong>for</strong> multiple public benefits.<br />
THE RESULTING MULTIPLE PUBLIC<br />
BENEFITS MAPS REVEALED:<br />
The greatest opportunity <strong>for</strong> social uplift occurs within <strong>the</strong><br />
Three Cities Areas, <strong>the</strong> Derbyshire and North Nottinghamshire<br />
coalfields, <strong>the</strong> Lincolnshire coast and <strong>the</strong> Northamptonshire<br />
Growth Areas.<br />
The greatest opportunity <strong>for</strong> environmental uplift occurs<br />
around areas of existing environmental assets (particularly<br />
around Strategic <strong>River</strong> Corridors) and in areas of poor<br />
environmental quality.<br />
The greatest opportunity <strong>for</strong> economic uplift occurs mainly<br />
within <strong>the</strong> Three Cities Area and around strategic economic<br />
gateways. Northampton, <strong>the</strong> Lincolnshire Coast, some rural<br />
areas and key natural assets also show potential <strong>for</strong> tourism<br />
and environmental economy benefits.<br />
The Combined Multiple Public Benefits Map revealed <strong>the</strong><br />
greatest opportunity <strong>for</strong> uplift around <strong>the</strong> Strategic <strong>River</strong><br />
Corridors, <strong>the</strong> Three Cities sub area, <strong>the</strong> Northamptonshire<br />
Growth Area centres, <strong>the</strong> Nor<strong>the</strong>rn sub area and <strong>the</strong><br />
Lincolnshire coast. Cross-reference with <strong>the</strong> Environmental<br />
Public Benefits Map confirmed that most of <strong>the</strong> areas of<br />
greatest environmental priority are included within <strong>the</strong><br />
multiple benefits map.<br />
The implications of <strong>the</strong> results are discussed in terms of<br />
priorities <strong>for</strong> <strong>the</strong> delivery of GI and <strong>the</strong> implications <strong>for</strong> <strong>the</strong><br />
region’s spatial strategy, population growth, quality of life and<br />
sustainable development.<br />
The study shows at a regional scale that it is possible to map<br />
<strong>the</strong> potential public benefit GI can bring. Fur<strong>the</strong>r, it provides a<br />
firm evidence base <strong>for</strong> strategic investment in GI to deliver<br />
regional objectives in an integrated manner. It substantiates GI<br />
investments in <strong>the</strong> <strong>River</strong> <strong>Nene</strong> <strong>Regional</strong> <strong>Park</strong> and o<strong>the</strong>r<br />
Northamptonshire Growth Areas but also emphasises that<br />
equal, and in some cases greater, public benefit can be<br />
achieved by GI investments elsewhere in <strong>the</strong> region.<br />
It is recognised that <strong>the</strong> PBRS is a ‘top-down’ approach – it is<br />
an aid to strategic planning and investment. The spatial<br />
insights it brings must be combined with local knowledge and<br />
community values in order to deliver GI and its benefits on<br />
<strong>the</strong> ground.<br />
To facilitate <strong>the</strong> realisation of enhanced GI in <strong>the</strong> region, a<br />
database of stakeholders was developed through correspondence<br />
with regional and local Government and Non<br />
Governmental Organisations. This will <strong>for</strong>m <strong>the</strong> basis of a<br />
<strong>Green</strong> <strong>Infrastructure</strong> Network (GIN) <strong>for</strong> <strong>the</strong> coordinated<br />
delivery of GI across <strong>the</strong> region.<br />
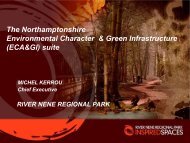
A seminar was held in Melton Mowbray (May 2006) and a<br />
public in<strong>for</strong>mation leaflet was created (opposite) to increase<br />
awareness of <strong>the</strong> study throughout <strong>the</strong> region.<br />
4
1.0<br />
INTRODUCTION<br />
1.1 BACKGROUND TO THE STUDY<br />
1.1.1 In 2005 <strong>the</strong> <strong>East</strong> <strong>Midlands</strong> <strong>Regional</strong> Assembly(EMRA)<br />
and a number of its regional partners 1 commissioned a scoping<br />
study of <strong>Green</strong> <strong>Infrastructure</strong> (GI) in <strong>the</strong> <strong>East</strong> <strong>Midlands</strong>. This<br />
study investigated <strong>the</strong> potential <strong>for</strong> mapping <strong>the</strong> functionality of<br />
open spaces in a number of study areas across <strong>the</strong> region.<br />
These study areas were located in existing economic and social<br />
regeneration initiative areas.<br />
1.1.2 The purpose of <strong>the</strong> study was to identify whe<strong>the</strong>r GI<br />
provision and deficit could be mapped and assessed spatially.<br />
Fur<strong>the</strong>r, it proposed to identify a technique <strong>for</strong> assessing <strong>the</strong><br />
multiple-functionality of greenspaces in <strong>the</strong>ir existing<br />
condition, and <strong>the</strong> potential to derive additional functionality<br />
through management interventions.<br />
1.1.3 The study has achieved significant success in embedding<br />
<strong>the</strong> concept of GI as a component in successful regeneration<br />
and as an integral part of “Environmental <strong>Infrastructure</strong>” -<br />
central to <strong>the</strong> region’s strategy <strong>for</strong> growth. The study has also<br />
succeeded in promoting <strong>the</strong> concept of multifunctional use of<br />
green spaces and green networks.<br />
1.1.4 However, <strong>the</strong> EMRA Environment Group recognised that<br />
it is important to prioritise delivery of GI in those areas where it<br />
is most needed. Whilst <strong>the</strong> pilot-study areas will undoubtedly be<br />
good examples of where GI provision will be beneficial, <strong>the</strong>re<br />
may be o<strong>the</strong>r areas in <strong>the</strong> region with significant deficits in GI<br />
and/or significant needs <strong>for</strong> <strong>the</strong> benefits that GI can bring.<br />
1.1.5 The Environment Group thus commissioned this, <strong>the</strong><br />
<strong>East</strong> <strong>Midlands</strong> Public Benefit Mapping Project, as a second<br />
stage to that earlier work, examining whe<strong>the</strong>r <strong>the</strong> Public<br />
Benefit Recording System (PBRS) technique could be applied<br />
to <strong>the</strong> region to identify areas of greatest public benefit from<br />
investments in GI.<br />
1.2 GREEN INFRASTRUCTURE – DEFINITION AND BENEFITS<br />
1.2.1 <strong>Green</strong> <strong>Infrastructure</strong> (GI) is a term which has evolved in<br />
recent years within Governmental social and regeneration<br />
policies to describe <strong>the</strong> network of greenspaces and natural<br />
elements that intersperse and connect our cities, villages and<br />
towns. In urban situations GI complements and balances <strong>the</strong><br />
built environment; in rural settings it provides a framework <strong>for</strong><br />
sustainable economies and biodiversity; in-between it links<br />
town and country and interconnects wider environmental<br />
processes. GI is an holistic approach to viewing <strong>the</strong> natural environment<br />
which acknowledges <strong>the</strong> multiple benefits and vital<br />
functions it provides <strong>for</strong> <strong>the</strong> economy, wildlife, local people,<br />
communities and cultural assets alike.<br />
1.2.2 Governmental commitment to economic and population<br />
growth in <strong>the</strong> South <strong>East</strong> and South <strong>Midlands</strong> is accompanied by<br />
a commitment to infrastructure improvements including GI.<br />
There are examples from Milton Keynes and Northamptonshire<br />
of direct Government funding intervention to support GI creation<br />
and encourage GI benefits from planning gain.<br />
1.2.3 This is of course not a new trend. Initiatives such as <strong>the</strong><br />
Community Forests and <strong>the</strong> National Forest have shown how<br />
<strong>for</strong>merly private or degraded land can be regenerated and<br />
brought into <strong>the</strong> public domain so that greenspaces can<br />
per<strong>for</strong>m many more functions of benefit to neighbourhoods.<br />
Through such contributions to healthier and sustainable<br />
lifestyles it is increasingly being recognised as a key factor<br />
central to <strong>the</strong> agendas of sustainable communities,<br />
development and growth.<br />
1.2.4 There are numerous national policy priorities that may<br />
be delivered through GI 2 ., and at <strong>the</strong> regional level it is now<br />
firmly recognised as being a core component of <strong>Regional</strong> Spatial<br />
Strategies, and is featured within <strong>Regional</strong> Rural Development<br />
Frameworks and Economic Strategies. It is implicitly recognised<br />
in numerous o<strong>the</strong>r regional level strategy and policy documents<br />
concerning planning, health, sport, biodiversity, culture etc.<br />
1.2.5 There is now a need <strong>for</strong> strategic overview of where <strong>the</strong><br />
most significant public benefit can be secured through investment<br />
in GI. Given a situation of limited resources and a desire<br />
to maximise <strong>the</strong> cost cutting benefits of public investment;<br />
<strong>the</strong>re is an over-riding need in spatial strategy to identify areas;<br />
• which are undergoing social or environmental deficit<br />
(a ‘needs’ focussed approach) and/or;<br />
• where <strong>the</strong> sustainable development opportunities<br />
arising from a high quality environment can be captured<br />
(an ‘opportunity’ focussed approach).<br />
1.2.6 There is also a need <strong>for</strong> this to be firmly evidence-based<br />
and to be driven by integrated sustainable objectives –<br />
combining social, environmental and economic outcomes.<br />
1 The Countryside Agency, Environment Agency, The National Trust, <strong>East</strong> <strong>Midlands</strong> Development Agency, English Nature, English Heritage, Groundwork,<br />
Defra, Sport England, Government Office <strong>for</strong> <strong>the</strong> <strong>East</strong> <strong>Midlands</strong>, The Wildlife Trusts and <strong>the</strong> Institute <strong>for</strong> Sustainable Development in Business.<br />
5
1.0<br />
INTRODUCTION<br />
1.3 THE PUBLIC BENEFIT RECORDING SYSTEM (PBRS) APPROACH<br />
1.3.1 The PBRS is a strategic decision making tool initially<br />
conceived by <strong>the</strong> Forestry Commission and <strong>the</strong> North West<br />
Development Agency to assist in <strong>the</strong> prioritisation of derelict<br />
land sites <strong>for</strong> reclamation investment, based upon <strong>the</strong> site’s<br />
potential to generate public benefits.<br />
1.3.2 PBRS has an ethos to identify where greatest public<br />
benefit can be secured through policy/funding intervention –<br />
<strong>the</strong> benefit may be social, economic or environmental, but<br />
generally greater benefits will emerge where all three<br />
converge. It is also an approach which builds evidence from a<br />
wide range of data sources; using GIS to spatially analyse and<br />
map areas of significant need and opportunity.<br />
1.3.3 In <strong>the</strong> <strong>Green</strong>wood Forest area TEP (The Environment<br />
Partnership) were commissioned to undertake public benefit<br />
assessments relating to <strong>the</strong> priorities and objectives of <strong>the</strong> <strong>East</strong><br />
<strong>Midlands</strong> <strong>Regional</strong> Forestry Framework (hereafter RFF). A suite of<br />
maps was produced illustrating where strategic opportunities<br />
were aligned with RFF objectives. The maps were combined to<br />
produce 3 dimensional maps of multiple public benefit. This communicated<br />
quickly in a highly visual <strong>for</strong>mat <strong>the</strong> areas of <strong>Green</strong>wood<br />
Forest where <strong>the</strong> policies promoted in <strong>the</strong> <strong>Regional</strong> Forestry<br />
Framework were most needed. A similar approach is now proposed<br />
<strong>for</strong> <strong>the</strong> region.<br />
1.3.4 It is important that <strong>the</strong> PBRS is viewed as an aid to<br />
strategic planning and investment: <strong>the</strong> spatial insights it<br />
brings need to be tested and weighed alongside local<br />
knowledge and community values.<br />
2.0<br />
AIM & OBJECTIVES<br />
Photograph © Nathalie Heuber<br />
AIM<br />
THE AIM OF THE STUDY IS TO PRODUCE A SPATIAL<br />
FRAMEWORK SO THE POTENTIAL PUBLIC BENEFIT OF GI<br />
CAN BE ASSESSED FOR THE EAST MIDLANDS.<br />
In support of this aim, a series of maps are produced to<br />
identify those parts of <strong>the</strong> region where GI is a priority.<br />
The reasons why GI might be a priority include;<br />
• Provision of new or enhanced GI <strong>for</strong> areas of present and<br />
future deficit<br />
• Management of existing GI resources to increase <strong>the</strong>ir<br />
usefulness (multi- functionality)<br />
• Conservation of key GI resources which contribute to <strong>the</strong><br />
region’s environmental infrastructure<br />
• Improving connectivity of existing GI resources where <strong>the</strong>y<br />
are presently fragmented<br />
STUDY OBJECTIVES<br />
• To define <strong>the</strong> particular public benefits that GI gives (or<br />
could give) to <strong>the</strong> <strong>East</strong> <strong>Midlands</strong>, taking account of regional<br />
strategies and national policies <strong>for</strong> sustainability.<br />
6<br />
• To identify relevant indicators of need and opportunity by<br />
which public benefit can be assessed, and map <strong>the</strong>se<br />
indicators in GIS (Geographical In<strong>for</strong>mation Systems).<br />
• To identify those areas where needs and opportunities<br />
overlap to <strong>the</strong> greatest extent - in relation to social,<br />
economic and environmental benefits.<br />
• To compile a database of stakeholders within <strong>the</strong> region who<br />
will have most interest in <strong>the</strong> existing and future delivery of<br />
Environmental <strong>Infrastructure</strong>, particularly GI.<br />
• To disseminate findings to a relevant regional audience,<br />
through a consultative seminar and summary report.<br />
• To identify <strong>the</strong> need <strong>for</strong> fur<strong>the</strong>r work to improve <strong>the</strong> depth of<br />
<strong>the</strong> study and to intervene in particular areas to promote GI.<br />
At this point, it must be emphasised that this study is a regional<br />
overview. It responds to regional strategy and uses regional<br />
datasets as indicators of social, economic and environmental<br />
conditions. It is recognised that county and local level<br />
practitioners will want to consider fur<strong>the</strong>r priorities; and use<br />
local knowledge and o<strong>the</strong>r datasets to add depth to <strong>the</strong><br />
assessment of <strong>the</strong> potential benefit of GI.
3.0<br />
METHODOLOGY<br />
THERE WERE FIVE STRANDS OF WORK:<br />
I. STAKEHOLDER DATABASE<br />
II.<br />
III.<br />
IV.<br />
REGIONAL STRATEGY REVIEW<br />
GEOGRAPHIC & DEMOGRAPHIC<br />
BASELINE MAPPING<br />
PUBLIC BENEFIT MAPPING<br />
V. CONSULTATION<br />
3.1 STAKEHOLDER DATABASE<br />
To facilitate <strong>the</strong> realisation of strategic GI delivery a database<br />
of relevant regional stakeholders was developed through<br />
correspondence with regional and local Government and Non<br />
Governmental Organisations. The database is not included in<br />
this report – it has been provided separately to EMRA. This<br />
will <strong>for</strong>m <strong>the</strong> basis of <strong>the</strong> development of a <strong>Green</strong><br />
<strong>Infrastructure</strong> Network (GIN) <strong>for</strong> <strong>the</strong> region.<br />
3.2 REGIONAL STRATEGY REVIEW<br />
“England’s <strong>East</strong> <strong>Midlands</strong> Integrated <strong>Regional</strong> Strategy – our<br />
sustainable development strategy” (EMRA, 2005), known<br />
hereafter as <strong>the</strong> IRS, encapsulates <strong>the</strong> <strong>East</strong> <strong>Midlands</strong>’ key<br />
strategy and policy documents into a framework comprising<br />
four “<strong>the</strong>mes”; within which <strong>the</strong>re are seventeen objectives<br />
<strong>for</strong> <strong>the</strong> sustainable development of <strong>the</strong> region.<br />
On one hand, GI is itself a desired outcome of <strong>the</strong> IRS. Just as<br />
importantly, GI can contribute to most IRS objectives in<br />
indirect ways e.g. through providing a setting <strong>for</strong> healthier<br />
lifestyles, inward investment; as described in section 1.2.<br />
In essence, this is <strong>the</strong> potential “public benefit” that GI<br />
can deliver.<br />
For each of <strong>the</strong> 4 <strong>the</strong>mes and 17 objectives, <strong>the</strong> potential<br />
contribution of GI to IRS outcomes was considered – Appendix<br />
1 sets out in tabulated <strong>for</strong>m, <strong>the</strong> results of this exercise.<br />
3.3 GEOGRAPHIC AND DEMOGRAPHIC BASELINE MAPPING<br />
In order to provide a geographical context <strong>for</strong> <strong>the</strong> mapping of<br />
public benefit, various background maps were produced;<br />
showing administrative and cultural boundaries, along with<br />
population density in<strong>for</strong>mation. These maps are shown at<br />
Chapter 4.<br />
development. For most of <strong>the</strong> IRS objectives, it is possible<br />
(using regionally- benchmarked indicators), to map areas of<br />
greatest need <strong>for</strong> intervention.<br />
A 4-STEP APPROACH TO MAPPING PUBLIC<br />
BENEFIT WAS ADOPTED.<br />
• Identifying how GI can deliver public benefit<br />
• Identifying appropriate indicator datasets<br />
• Benchmarking and ranking indicators in order to provide a<br />
robust regional focus<br />
• Identifying where <strong>the</strong>re is greatest need <strong>for</strong> GI and/or<br />
greatest opportunity <strong>for</strong> GI to deliver IRS objectives<br />
STEP 1 – IDENTIFYING THE PUBLIC BENEFIT OF GI –<br />
was carried out using <strong>the</strong> IRS as a guide. The process is<br />
described above and is tabulated in detail at Appendix 1, in<br />
<strong>the</strong> first 4 columns. Thus <strong>for</strong> example, IRS has a social <strong>the</strong>me,<br />
within which objective 1 is to ensure that <strong>the</strong> existing and<br />
future housing stock meets <strong>the</strong> needs of all communities. For<br />
people without independent means of travel (often <strong>the</strong> very<br />
young and <strong>the</strong> very old), <strong>the</strong>re is a particular need <strong>for</strong><br />
doorstep greenspace.<br />
Thus it may be concluded that GI will have particular public<br />
benefit to neighbourhoods with particularly high numbers of<br />
<strong>the</strong> very young or old.<br />
STEP 2 – IDENTIFYING APPROPRIATE INDICATOR DATASETS –<br />
was carried out in dialogue with <strong>the</strong> project Steering Group,<br />
but also used <strong>the</strong> consultants’ previous experience of mapping<br />
in <strong>the</strong> <strong>East</strong> <strong>Midlands</strong> and elsewhere. Datasets were used<br />
where <strong>the</strong>y fulfilled most of <strong>the</strong> following criteria;<br />
• Relevance to <strong>the</strong> particular public benefit being mapped<br />
• Available consistently across <strong>the</strong> region<br />
• Available in digital <strong>for</strong>mat<br />
• Available at a fine-grain, preferably more focussed than<br />
Local Authority boundaries<br />
• Capable of benchmarking against national datasets<br />
• Available as “public domain” material<br />
3.4 PUBLIC BENEFIT MAPPING<br />
The <strong>Regional</strong> Strategy Review described above, and tabulated<br />
at Appendix 1, led to various conclusions about how GI can<br />
contribute directly or indirectly to regional<br />
7
3.0<br />
METHODOLOGY<br />
Datasets were available to map GI’s potential contribution to<br />
most IRS objectives – <strong>the</strong>re has been considerable investment<br />
in mapping and data collection over <strong>the</strong> past few years, which<br />
means that <strong>for</strong> most objectives, directly relevant datasets are<br />
available; or at least good “proxies” can be found.<br />
In <strong>the</strong> example cited above re GI contributing to sustainable<br />
housing, Census 2001 statistics were used to identify Super<br />
Output Areas 3 where proportions of <strong>the</strong> very young and/or very<br />
old were significantly higher than <strong>the</strong> regional average.<br />
Column 4 (Map Theme) of Appendix 1 lists <strong>the</strong> various <strong>the</strong>mes<br />
which were mapped. Column 6 identifies <strong>the</strong> sources of data<br />
used <strong>for</strong> each map.<br />
Inevitably <strong>the</strong>re are limitations imposed by <strong>the</strong> geographic<br />
focus of <strong>the</strong> data, and in some cases, time has passed since<br />
data was collected. Significant areas <strong>for</strong> future development<br />
are discussed in relation to each map; and are summarised at<br />
<strong>the</strong> end of this study.<br />
STEP 3 - BENCHMARKING AND RANKING INDICATORS –<br />
was carried out to identify regional “hotspots” of need or<br />
opportunity. As far as possible, data was benchmarked around<br />
regional (ra<strong>the</strong>r than national) means; although national<br />
benchmarks were borne in mind to ensure only<br />
genuine need was prioritised.<br />
It was also found useful, <strong>for</strong> many social datasets, to provide<br />
parallel benchmarks <strong>for</strong> urban and rural neighbourhoods;<br />
specifically to ensure that pockets of rural disadvantage are not<br />
ignored or obscured due to <strong>the</strong> ra<strong>the</strong>r urban-centric nature of<br />
Index of Deprivation statistics. This process of urban – rural<br />
benchmarking used <strong>the</strong> Defra rural classification (see Map B).<br />
Once datasets had been assembled and benchmarked to <strong>the</strong><br />
region, a process of ranking occurred in order to identify <strong>the</strong><br />
areas of greatest need and / or opportunity.<br />
In some cases <strong>the</strong> maps simply identify areas of need /<br />
opportunity. In o<strong>the</strong>r cases, <strong>the</strong> maps illustrate <strong>the</strong> “depth” of<br />
need / opportunity, using a ranking. This process required<br />
sensitivity testing in order to ensure that only genuine need /<br />
opportunity was ranked highly.<br />
75, 76-100). However, if an <strong>East</strong> <strong>Midlands</strong> neighbourhood<br />
ranked 51 is in fact significantly healthier than <strong>the</strong> English<br />
median, a weighting may be set to give priority only to those<br />
areas of genuine health need.<br />
Column 5 of Appendix 1 lists how <strong>the</strong> ranking was carried out,<br />
showing <strong>for</strong> each map, which areas are of greatest need /<br />
opportunity – and how this translates into “scores”.<br />
A simple scoring system, from 0 to 3, was adopted <strong>for</strong> each<br />
indicator dataset. Areas which scored 3 indicating, <strong>for</strong> that<br />
specific dataset, that ei<strong>the</strong>r;<br />
There is a significant need, at regional level, <strong>for</strong> GI uplift to<br />
address social, environmental or economic problem areas; or<br />
that GI makes, or could make, a significant contribution to <strong>the</strong><br />
economy, environment or society’s needs.<br />
STEP 4 – IDENTIFYING WHERE THERE IS GREATEST NEED<br />
FOR GI AND/OR GREATEST OPPORTUNITY FOR GI TO<br />
DELIVER IRS OBJECTIVES –<br />
resulted in <strong>the</strong> production of 27 <strong>the</strong>med Public Benefits maps:<br />
13 in relation to <strong>the</strong> IRS’s 5 social outcomes, 8 in respect of <strong>the</strong><br />
5 environmental outcomes; and 6 illustrating contribution to<br />
<strong>the</strong> 3 economic outcomes. Of course, a number of <strong>the</strong> maps<br />
are cross-cutting e.g. Map 13 (Index of Multiple Deprivation)<br />
which falls into <strong>the</strong> “social” <strong>the</strong>me also has an<br />
economic purpose.<br />
Appendix 1 (in column 4) lists <strong>the</strong> 27 maps, in relation to <strong>the</strong>ir<br />
IRS <strong>the</strong>me.<br />
A series of Multiple Public Benefit maps were <strong>the</strong>n produced<br />
by combining <strong>the</strong> 27 <strong>the</strong>med maps to demonstrate where GI<br />
provision would have <strong>the</strong> greatest public benefit potential<br />
towards social, environmental, economic and combined agendas.<br />
3.5 STAKEHOLDER CONSULTATION<br />
A seminar and workshop was held at Pera Innovation <strong>Park</strong>,<br />
Melton Mowbray on May 31st to present <strong>the</strong> interim findings,<br />
discuss <strong>the</strong> project and promote <strong>the</strong> <strong>for</strong>mation of a regional GI<br />
network. Results of a questions and answer session and<br />
interactive workshop are included at Appendix 2.<br />
For example, a map outlining health may rank areas across<br />
<strong>the</strong> region from 1 (best) to 100 (worst). One might impose a<br />
four point scoring scale based on quartiles (1- 25, 26-50, 51-<br />
3 Demographic units <strong>for</strong> <strong>the</strong> purposes of census and social mapping – typically 1/3rd of an electoral ward, comprising 3 to 4,000 people.<br />
8
4.0<br />
GEOGRAPHIC AND<br />
DEMOGRAPHIC<br />
BASELINE MAPS<br />
Photograph © <strong>River</strong> <strong>Nene</strong> <strong>Regional</strong> <strong>Park</strong><br />
MAP A: COUNTY & DISTRICT BOUNDARIES IN THE EAST MIDLANDS<br />
*Based upon data compiled prior to 21st July 2006<br />
*Based upon data compiled prior to 21st July 2006<br />
MAPS A-E PROVIDE BACKGROUND INFORMATION ON<br />
THE GEOGRAPHIC, DEMOGRAPHIC AND LANDSCAPE<br />
CHARACTER OF THE REGION. THESE MAPS PROVIDE<br />
CONTEXTUAL INFORMATION, BUT ARE NOT USED FOR<br />
PUBLIC BENEFIT SCORING.<br />
Map A: County & District Boundaries in <strong>the</strong> <strong>East</strong> <strong>Midlands</strong><br />
Map B: Urban & Rural Area Classifications<br />
Map C: Percentage of ‘Non-Built’ Land by Super Output Area<br />
Map D: Population Density by Super Output Area<br />
Map E: Joint Character Areas<br />
9
4.0<br />
GEOGRAPHIC AND<br />
DEMOGRAPHIC<br />
BASELINE MAPS<br />
Photograph © Nathalie Heuber<br />
MAP B: URBAN AND RURALAREA CLASSIFICATION<br />
10
4.0<br />
GEOGRAPHIC AND<br />
DEMOGRAPHIC<br />
BASELINE MAPS<br />
MAP C: PERCENTAGE OF ‘NON-BUILT’ LAND<br />
11
4.0<br />
GEOGRAPHIC AND<br />
DEMOGRAPHIC<br />
BASELINE MAPS<br />
MAP D: POPULATION DENSITY IN THE EAST MIDLANDS<br />
*Based upon data compiled prior to 21st July 2006<br />
12
4.0<br />
GEOGRAPHIC AND<br />
DEMOGRAPHIC<br />
BASELINE MAPS<br />
Photograph © Nathalie Heuber<br />
MAP E: JOINT CHARACTER AREAS<br />
*Based upon data compiled prior to 21st July 2006<br />
13