MATH 2011 General Statistics Lec. 3 Lab 0 Cr. 3 Effective Date ...
MATH 2011 General Statistics Lec. 3 Lab 0 Cr. 3 Effective Date ...
MATH 2011 General Statistics Lec. 3 Lab 0 Cr. 3 Effective Date ...

Create successful ePaper yourself
Turn your PDF publications into a flip-book with our unique Google optimized e-Paper software.
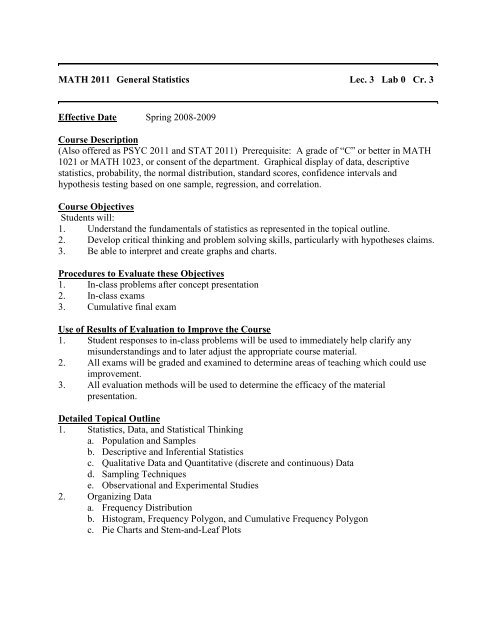
<strong>MATH</strong> <strong>2011</strong> <strong>General</strong> <strong>Statistics</strong> <strong>Lec</strong>. 3 <strong>Lab</strong> 0 <strong>Cr</strong>. 3<br />
<strong>Effective</strong> <strong>Date</strong> Spring 2008-2009<br />
Course Description<br />
(Also offered as PSYC <strong>2011</strong> and STAT <strong>2011</strong>) Prerequisite: A grade of “C” or better in <strong>MATH</strong><br />
1021 or <strong>MATH</strong> 1023, or consent of the department. Graphical display of data, descriptive<br />
statistics, probability, the normal distribution, standard scores, confidence intervals and<br />
hypothesis testing based on one sample, regression, and correlation.<br />
Course Objectives<br />
Students will:<br />
1. Understand the fundamentals of statistics as represented in the topical outline.<br />
2. Develop critical thinking and problem solving skills, particularly with hypotheses claims.<br />
3. Be able to interpret and create graphs and charts.<br />
Procedures to Evaluate these Objectives<br />
1. In-class problems after concept presentation<br />
2. In-class exams<br />
3. Cumulative final exam<br />
Use of Results of Evaluation to Improve the Course<br />
1. Student responses to in-class problems will be used to immediately help clarify any<br />
misunderstandings and to later adjust the appropriate course material.<br />
2. All exams will be graded and examined to determine areas of teaching which could use<br />
improvement.<br />
3. All evaluation methods will be used to determine the efficacy of the material<br />
presentation.<br />
Detailed Topical Outline<br />
1. <strong>Statistics</strong>, Data, and Statistical Thinking<br />
a. Population and Samples<br />
b. Descriptive and Inferential <strong>Statistics</strong><br />
c. Qualitative Data and Quantitative (discrete and continuous) Data<br />
d. Sampling Techniques<br />
e. Observational and Experimental Studies<br />
2. Organizing Data<br />
a. Frequency Distribution<br />
b. Histogram, Frequency Polygon, and Cumulative Frequency Polygon<br />
c. Pie Charts and Stem-and-Leaf Plots
<strong>MATH</strong> <strong>2011</strong> Page 2<br />
3. Descriptive <strong>Statistics</strong><br />
a. Parameter and Statistic<br />
b. Measures of Central Tendency (mean, median, mode and midrange)<br />
c. Measures of Variation (range, variance and standard deviation)<br />
d. Chebyshev’s Theorem and Empirical Rule<br />
e. Measures of Position (percentiles and quartiles)<br />
4. Fundamentals of Probability<br />
5. Discrete Probability Distributions<br />
a. Probability Distribution of a Random Variable<br />
b. Expected Value (Mean), Variance, and Standard Deviation<br />
c. Binomial Probability Distribution<br />
d. Other Discrete Distributions (Multinomial, Poisson, Hypergeometric)<br />
6. Normal Probability Distribution<br />
a. Graph and properties of a Normal Curve<br />
b. Finding Probabilities when z-scores or x-values are given<br />
c. Finding z-scores or x-values when Probabilities are given<br />
d. Central Limit Theorem (finding probabilities when mean and standard deviation are<br />
given)<br />
e. Normal Approximation to the Binomial<br />
7. Confidence Intervals<br />
a. Confidence Intervals that contain the Population Mean using z-scores and t-values<br />
b. Confidence Intervals for Variances and Standard Deviations<br />
8. Inferences Based on a Single Sample<br />
a. Tests of Significance<br />
b. Testing a Population Mean (z-test and t-test)<br />
c. Chi-Square Test for a Variance or Standard Deviation<br />
d. Additional topics regarding hypothesis testing<br />
9. Simple Linear Regression<br />
a. Correlation and Linear Regression equations<br />
b. Testing significance of a sample correlation at 5 percent and 1 percent level of<br />
significance