Primarily Math - Center for Science, Mathematics & Computer ...
Primarily Math - Center for Science, Mathematics & Computer ...
Primarily Math - Center for Science, Mathematics & Computer ...

Create successful ePaper yourself
Turn your PDF publications into a flip-book with our unique Google optimized e-Paper software.
<strong>Math</strong> participants and in the classrooms<br />
of a comparison group of K-3 teachers in<br />
three partner districts (LPS, OPS and PLSD).<br />
After randomly selecting students from each<br />
classroom in the fall, those same students are<br />
tested in the spring of that school year. Each<br />
participating classroom also gives students a<br />
Child Competence Beliefs Survey both in the<br />
fall and spring.<br />
The TEMA-3 calculates a standardized<br />
score called the <strong>Math</strong> Ability Score, which<br />
calculates a child’s overall mathematical<br />
ability based on both age and raw score.<br />
Thus, students making expected growth in<br />
mathematical knowledge over time would<br />
have the same TEMA-3 score each time they<br />
were tested. The TEMA-3 has a mean of 100<br />
and a standard deviation of 15. Scores from<br />
90 to 110 are considered average.<br />
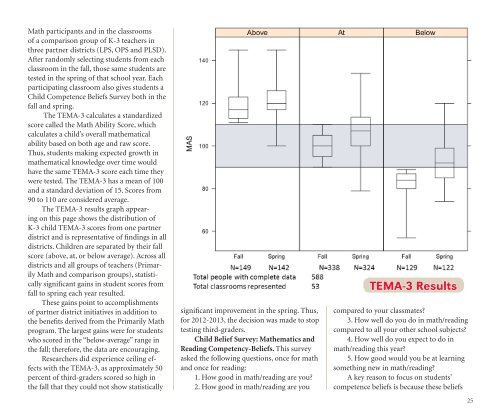
The TEMA-3 results graph appearing<br />
on this page shows the distribution of<br />
K-3 child TEMA-3 scores from one partner<br />
district and is representative of findings in all<br />
districts. Children are separated by their fall<br />
score (above, at, or below average). Across all<br />
districts and all groups of teachers (<strong>Primarily</strong><br />
<strong>Math</strong> and comparison groups), statistically<br />
significant gains in student scores from<br />
fall to spring each year resulted.<br />
These gains point to accomplishments<br />
of partner district initiatives in addition to<br />
the benefits derived from the <strong>Primarily</strong> <strong>Math</strong><br />
program. The largest gains were <strong>for</strong> students<br />
who scored in the “below-average” range in<br />
the fall; there<strong>for</strong>e, the data are encouraging.<br />
Researchers did experience ceiling effects<br />
with the TEMA-3, as approximately 50<br />
percent of third-graders scored so high in<br />
the fall that they could not show statistically<br />
significant improvement in the spring. Thus,<br />
<strong>for</strong> 2012-2013, the decision was made to stop<br />
testing third-graders.<br />
Child Belief Survey: <strong>Math</strong>ematics and<br />
Reading Competency-Beliefs. This survey<br />
asked the following questions, once <strong>for</strong> math<br />
and once <strong>for</strong> reading:<br />
1. How good in math/reading are you<br />
2. How good in math/reading are you<br />
TEMA-3 Results<br />
compared to your classmates<br />
3. How well do you do in math/reading<br />
compared to all your other school subjects<br />
4. How well do you expect to do in<br />
math/reading this year<br />
5. How good would you be at learning<br />
something new in math/reading<br />
A key reason to focus on students’<br />
competence beliefs is because these beliefs<br />
25