Primarily Math - Center for Science, Mathematics & Computer ...
Primarily Math - Center for Science, Mathematics & Computer ...
Primarily Math - Center for Science, Mathematics & Computer ...

You also want an ePaper? Increase the reach of your titles
YUMPU automatically turns print PDFs into web optimized ePapers that Google loves.
positive changes. The shaded period corresponds<br />
to the period of intense professional<br />
development <strong>for</strong> the teachers in Cohort 2. In<br />
the comparison group of Papillion teachers,<br />
some increases parallel <strong>Primarily</strong> <strong>Math</strong><br />
teachers’ increases and can be attributed to<br />
the intense focus on mathematics instruction<br />
the district has provided in the past two<br />
years, including the studio classroom studies.<br />
Fennema-Sherman <strong>Math</strong>ematics Attitude<br />
Scales <strong>for</strong> Teachers (FSMAS-T). The<br />
results from the FSMAS-T test also showed<br />
positive results: decreases in <strong>Primarily</strong> <strong>Math</strong><br />
teachers’ levels of anxiety and increases<br />
in their confidence and motivation with<br />
respect to teaching and learning mathematics.<br />
Given the recent literature about anxiety,<br />
and how “contagious” teachers’ anxiety is,<br />
especially <strong>for</strong> young girls, it is encouraging<br />
that <strong>Primarily</strong> <strong>Math</strong> seems to decrease<br />
teachers’ levels of mathematical anxiety. The<br />
comparison group teachers start off statistically<br />
equivalent to <strong>Primarily</strong> <strong>Math</strong> teachers<br />
in all categories except motivation, in which<br />
<strong>Primarily</strong> <strong>Math</strong> teachers start significantly<br />
higher. This makes sense, since the <strong>Primarily</strong><br />
<strong>Math</strong> teachers have voluntarily applied to<br />
participate in a program about mathematics,<br />
and the comparison group teachers have not.<br />
<strong>Math</strong>ematical Knowledge <strong>for</strong> Teaching<br />
(MKT). The MKT assessment measures<br />
K-6 teachers’ knowledge of mathematics as<br />
it relates to teaching elementary math within<br />
three subscales: Numbers and Operations;<br />
Patterns, Function, and Algebra; and Geometry.<br />
The items include questions about<br />
teaching knowledge, such as choosing the<br />
best examples or representations to illustrate<br />
specific mathematical ideas, and items that<br />
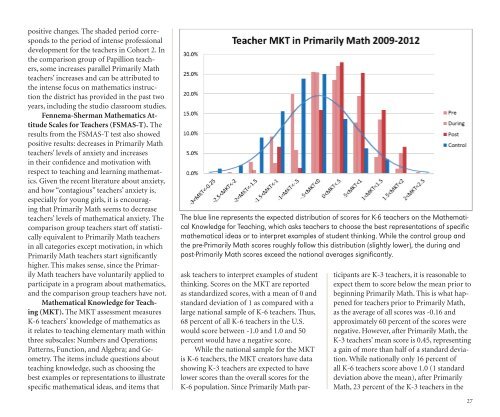
The blue line represents the expected distribution of scores <strong>for</strong> K-6 teachers on the <strong>Math</strong>ematical<br />
Knowledge <strong>for</strong> Teaching, which asks teachers to choose the best representations of specific<br />
mathematical ideas or to interpret examples of student thinking. While the control group and<br />
the pre-<strong>Primarily</strong> <strong>Math</strong> scores roughly follow this distribution (slightly lower), the during and<br />
post-<strong>Primarily</strong> <strong>Math</strong> scores exceed the national averages significantly.<br />
ask teachers to interpret examples of student<br />
thinking. Scores on the MKT are reported<br />
as standardized scores, with a mean of 0 and<br />
standard deviation of 1 as compared with a<br />
large national sample of K-6 teachers. Thus,<br />
68 percent of all K-6 teachers in the U.S.<br />
would score between -1.0 and 1.0 and 50<br />
percent would have a negative score.<br />
While the national sample <strong>for</strong> the MKT<br />
is K-6 teachers, the MKT creators have data<br />
showing K-3 teachers are expected to have<br />
lower scores than the overall scores <strong>for</strong> the<br />
K-6 population. Since <strong>Primarily</strong> <strong>Math</strong> participants<br />
are K-3 teachers, it is reasonable to<br />
expect them to score below the mean prior to<br />
beginning <strong>Primarily</strong> <strong>Math</strong>. This is what happened<br />
<strong>for</strong> teachers prior to <strong>Primarily</strong> <strong>Math</strong>,<br />
as the average of all scores was -0.16 and<br />
approximately 60 percent of the scores were<br />
negative. However, after <strong>Primarily</strong> <strong>Math</strong>, the<br />
K-3 teachers’ mean score is 0.45, representing<br />
a gain of more than half of a standard deviation.<br />
While nationally only 16 percent of<br />
all K-6 teachers score above 1.0 (1 standard<br />
deviation above the mean), after <strong>Primarily</strong><br />
<strong>Math</strong>, 23 percent of the K-3 teachers in the<br />
27