Climate and Land Degradation - WMO
Climate and Land Degradation - WMO
Climate and Land Degradation - WMO

Create successful ePaper yourself
Turn your PDF publications into a flip-book with our unique Google optimized e-Paper software.
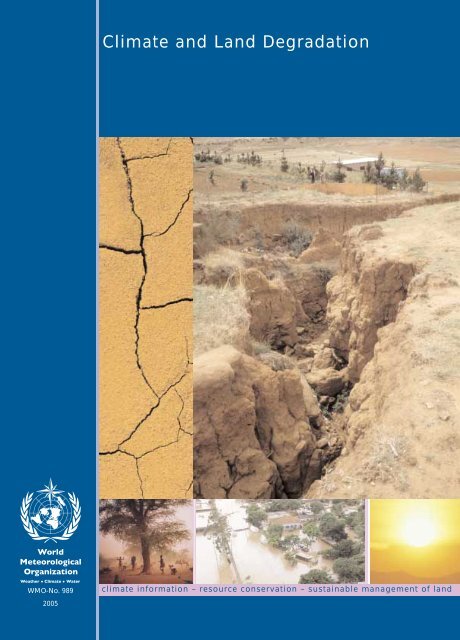
<strong>Climate</strong> <strong>and</strong> L<strong>and</strong> <strong>Degradation</strong><br />
<strong>WMO</strong>-No. 989<br />
climate information – resource conservation – sustainable management of l<strong>and</strong><br />
2005
<strong>Climate</strong> <strong>and</strong> L<strong>and</strong> <strong>Degradation</strong><br />
<strong>WMO</strong>-No. 989<br />
climate information – resource conservation – sustainable management of l<strong>and</strong>
<strong>WMO</strong>-No. 989<br />
© 2005, World Meteorological Organization<br />
ISBN 92-63-10989-3<br />
NOTE<br />
The designations employed <strong>and</strong> the presentation of<br />
material in this publication do not imply the expression of<br />
any opinion whatsoever on the part of the Secretariat of the<br />
World Meteorological Organization concerning the legal<br />
status of any country, territory, city or area, or of its<br />
authorities, or concerning the delimitations of its frontiers<br />
or boundaries.<br />
2
CONTENTS<br />
Foreword . . . . . . . . . . . . . . . . . . . . . . . . . . . . . . . . . . . . . . . . . . . . . . . . . . . . . . . . . . 4<br />
Introduction . . . . . . . . . . . . . . . . . . . . . . . . . . . . . . . . . . . . . . . . . . . . . . . . . . . . . . . . 6<br />
Extent <strong>and</strong> rate of l<strong>and</strong> degradation . . . . . . . . . . . . . . . . . . . . . . . . . . . . . . . . . . . . . 6<br />
L<strong>and</strong> degradation - causes . . . . . . . . . . . . . . . . . . . . . . . . . . . . . . . . . . . . . . . . . . . . . 8<br />
Climatic consequences of l<strong>and</strong> degradation . . . . . . . . . . . . . . . . . . . . . . . . . . . . . . . 9<br />
Climatic factors in l<strong>and</strong> degradation . . . . . . . . . . . . . . . . . . . . . . . . . . . . . . . . . . . . . 10<br />
Rainfall . . . . . . . . . . . . . . . . . . . . . . . . . . . . . . . . . . . . . . . . . . . . . . . . . . . . . . . . . 12<br />
Floods . . . . . . . . . . . . . . . . . . . . . . . . . . . . . . . . . . . . . . . . . . . . . . . . . . . . . . . . . . 15<br />
Droughts . . . . . . . . . . . . . . . . . . . . . . . . . . . . . . . . . . . . . . . . . . . . . . . . . . . . . . . . 15<br />
Solar radiation, temperature <strong>and</strong> evaporation . . . . . . . . . . . . . . . . . . . . . . . . . . 19<br />
Wind . . . . . . . . . . . . . . . . . . . . . . . . . . . . . . . . . . . . . . . . . . . . . . . . . . . . . . . . . . . 20<br />
Causes of wind erosion . . . . . . . . . . . . . . . . . . . . . . . . . . . . . . . . . . . . . . . . . . . . 21<br />
Climatic implications of duststorms . . . . . . . . . . . . . . . . . . . . . . . . . . . . . . . . . . 23<br />
Wildfires, l<strong>and</strong> degradation <strong>and</strong> atmospheric emissions . . . . . . . . . . . . . . . . . . . . . 24<br />
<strong>Climate</strong> change <strong>and</strong> l<strong>and</strong> degradation . . . . . . . . . . . . . . . . . . . . . . . . . . . . . . . . . . . . 24<br />
Carbon sequestration to mitigate climate change <strong>and</strong> combat l<strong>and</strong> degradation . 27<br />
Underst<strong>and</strong>ing the interactions between climate <strong>and</strong> l<strong>and</strong> degradation—<br />
role of <strong>WMO</strong> . . . . . . . . . . . . . . . . . . . . . . . . . . . . . . . . . . . . . . . . . . . . . . . . . . . . . . . . 27<br />
Future perspectives . . . . . . . . . . . . . . . . . . . . . . . . . . . . . . . . . . . . . . . . . . . . . . . . . . 32<br />
3
FOREWORD<br />
The United Nations Convention to Combat<br />
Desertification (UNCCD) entered into force<br />
on 26 December 1996 <strong>and</strong> over 179 countries<br />
were Parties as at March 2002. The<br />
Convention defines desertification as “l<strong>and</strong><br />
degradation in the arid, semi-arid <strong>and</strong> dry<br />
sub-humid areas resulting from various<br />
factors, including climatic variations <strong>and</strong><br />
human activities”.<br />
Over 250 million people are directly affected<br />
by desertification. In addition, some one<br />
billion people in over 100 countries are at<br />
risk. These people include many of the<br />
world's poorest, most marginalized, <strong>and</strong><br />
politically weak citizens. Hence combating<br />
desertification is an urgent priority in global<br />
efforts to ensure food security <strong>and</strong> the livelihoods<br />
of millions of people who inhabit the<br />
dryl<strong>and</strong>s of the world.<br />
Sustainable development of countries<br />
affected by drought <strong>and</strong> desertification can<br />
only come about through concerted efforts<br />
based on a sound underst<strong>and</strong>ing of the<br />
different factors that contribute to l<strong>and</strong><br />
degradation around the world. Climatic variations<br />
are recognized as one of the major<br />
factors contributing to l<strong>and</strong> degradation, as<br />
defined in the Convention. It is more important<br />
to address climate, an underlying driver<br />
of l<strong>and</strong> degradation, than try to address only<br />
the consequenses of l<strong>and</strong> degradation. For<br />
example, development <strong>and</strong> adoption of<br />
sustainable l<strong>and</strong> management practices is<br />
one of the major solutions to combat the<br />
problem over the vast dryl<strong>and</strong>s around the<br />
world, but to accurately assess sustainable<br />
l<strong>and</strong> management practices, the climate<br />
resources <strong>and</strong> the risk of climate-related or<br />
induced natural disasters in a region must<br />
be known.<br />
Six sessions of the Conference of Parties<br />
(COP) have been held to date, at which<br />
several important issues related to the problems<br />
of drought <strong>and</strong> desertification have<br />
been addressed. Article 5 of the Convention<br />
calls on the affected country parties to<br />
address the underlying causes of desertification<br />
<strong>and</strong> it is timely that more efforts be<br />
devoted to better underst<strong>and</strong> the role of<br />
climatic factors in l<strong>and</strong> degradation. It is<br />
also important to note that Article 16 on<br />
Information Collection, Analysis <strong>and</strong><br />
Exchange emphasizes the importance of<br />
integrating <strong>and</strong> coordinating the collection,<br />
analysis <strong>and</strong> exchange of relevant shortterm<br />
<strong>and</strong> long-term data <strong>and</strong> information to<br />
ensure systematic observation of l<strong>and</strong><br />
degradation in affected areas <strong>and</strong> to underst<strong>and</strong><br />
better <strong>and</strong> assess the processes <strong>and</strong><br />
effects of drought <strong>and</strong> desertification.<br />
Research into the causes <strong>and</strong> effects of<br />
climate variations <strong>and</strong> long-term climate<br />
predictions with a view to providing early<br />
warning is essential. These issues require<br />
the attention of the Committee on Science<br />
<strong>and</strong> Technology (CST) of the COP.<br />
4
The World Meteorological Organization<br />
(<strong>WMO</strong>), as a specialized agency of the<br />
United Nations, furthers the applications of<br />
meteorology <strong>and</strong> hydrology to several<br />
sectors, including agriculture <strong>and</strong> other<br />
human activities. In this respect, <strong>WMO</strong> will<br />
promote systematic observation, collection,<br />
analysis <strong>and</strong> exchange of meteorological,<br />
climatological <strong>and</strong> hydrological data <strong>and</strong><br />
information; drought planning, preparedness<br />
<strong>and</strong> management; research on climatic<br />
variations <strong>and</strong> climate predictions; <strong>and</strong><br />
capacity building <strong>and</strong> transfer of knowledge<br />
<strong>and</strong> technology. <strong>WMO</strong>'s programmes, in<br />
particular the Agricultural Meteorology<br />
Programme <strong>and</strong> the Hydrology <strong>and</strong> Water<br />
Resources Programme, will support these<br />
efforts.<br />
Given the importance of the interactions<br />
between climate <strong>and</strong> desertification, <strong>WMO</strong><br />
accorded a major priority to this area <strong>and</strong> its<br />
action plan to combat desertification was<br />
first adopted in 1978 at the thirteenth<br />
session of the Executive Council of <strong>WMO</strong><br />
<strong>and</strong> has gone through several revisions.<br />
<strong>WMO</strong> will continue to encourage the<br />
increased involvement of the National<br />
Meteorological <strong>and</strong> Hydrological Services<br />
(NMHSs) <strong>and</strong> regional <strong>and</strong> subregional<br />
meteorological <strong>and</strong> hydrological centres in<br />
addressing the issues of relevance to the<br />
CCD, especially those stipulated in Articles<br />
10, <strong>and</strong> 16 to 19, of the Convention.<br />
On the occasion of the Seventh session of<br />
the COP, <strong>WMO</strong> has prepared this brochure<br />
which explains the role of different climatic<br />
factors in l<strong>and</strong> degradation <strong>and</strong> <strong>WMO</strong>'s<br />
contribution in addressing this important<br />
subject. We hope that this document will<br />
help enhance the underst<strong>and</strong>ing of the<br />
Parties to some of the issues involved so<br />
that they can be addressed knowledgeably.<br />
(M. Jarraud)<br />
Secretary-General<br />
5
Introduction<br />
Desertification is now defined in the UNCCD<br />
as “l<strong>and</strong> degradation in the arid, semi-arid <strong>and</strong><br />
dry sub-humid areas resulting from various<br />
factors, including climatic variations <strong>and</strong><br />
human activities” (this definition excludes the<br />
hyper-arid l<strong>and</strong>s). Furthermore, UNCCD<br />
defines l<strong>and</strong> degradation as a "reduction or<br />
loss, in arid, semi-arid, <strong>and</strong> dry sub-humid<br />
areas, of the biological or economic productivity<br />
<strong>and</strong> complexity of rain-fed cropl<strong>and</strong>,<br />
irrigated cropl<strong>and</strong>, or range, pasture, forest,<br />
<strong>and</strong> woodl<strong>and</strong>s resulting from l<strong>and</strong> uses or<br />
from a process or combination of processes,<br />
including processes arising from human activities<br />
<strong>and</strong> habitation patterns, such as: (i) soil<br />
erosion caused by wind <strong>and</strong>/or water; (ii) deterioration<br />
of the physical, chemical, <strong>and</strong><br />
biological or economic properties of soil; <strong>and</strong><br />
(iii) long-term loss of natural vegetation."<br />
According to UNCCD, over 250 million<br />
people are directly affected by l<strong>and</strong> degradation.<br />
In addition, some one billion people in<br />
over 100 countries are at risk. These people<br />
include many of the world's poorest, most<br />
marginalized, <strong>and</strong> politically weak citizens.<br />
The l<strong>and</strong> degradation issue for world food<br />
security <strong>and</strong> the quality of the environment<br />
assumes a major significance when one<br />
considers that only about 11 per cent of the<br />
global l<strong>and</strong> surface can be considered as<br />
prime or Class I l<strong>and</strong>, <strong>and</strong> this must feed the<br />
6.3 billion people today <strong>and</strong> the 8.2 billion<br />
expected by the year 2020. Hence l<strong>and</strong><br />
degradation will remain high on the international<br />
agenda in the 21st century.<br />
Sustainable l<strong>and</strong> management practices<br />
are needed to avoid l<strong>and</strong> degradation.<br />
L<strong>and</strong> degradation typically occurs because<br />
of l<strong>and</strong> management practices or human<br />
development that is not sustainable over a<br />
period of time. To accurately assess<br />
sustainable l<strong>and</strong> management practices,<br />
the climate resources <strong>and</strong> the risk of<br />
climate-related or induced natural disasters<br />
in a region must be known. Only when<br />
climate resources are paired with potential<br />
management or development practices can<br />
the l<strong>and</strong> degradation potential be assessed<br />
<strong>and</strong> appropriate mitigation technology<br />
considered. The use of climate information<br />
must be applied in developing sustainable<br />
practices as climatic variation is one of the<br />
major factors contributing to or even a trigger<br />
to l<strong>and</strong> degradation <strong>and</strong> there is a clear<br />
need to consider carefully how climate<br />
induces <strong>and</strong> influences l<strong>and</strong> degradation.<br />
Extent <strong>and</strong> rate of l<strong>and</strong> degradation<br />
Global assessment of l<strong>and</strong> degradation is<br />
not an easy task, <strong>and</strong> a wide range of methods<br />
are used, including expert judgement,<br />
remote sensing <strong>and</strong> modeling. Because of<br />
different definitions <strong>and</strong> terminology, there<br />
also exists a large variation in the available<br />
statistics on the extent <strong>and</strong> rate of l<strong>and</strong><br />
degradation. Further, most statistics refer to<br />
the risks of degradation or desertification<br />
(based on climatic factors <strong>and</strong> l<strong>and</strong> use)<br />
rather than to the current state of the l<strong>and</strong>.<br />
Different processes of l<strong>and</strong> degradation<br />
also confound the available statistics on<br />
soil <strong>and</strong>/or l<strong>and</strong> degradation. Principal<br />
processes of l<strong>and</strong> degradation include<br />
erosion by water <strong>and</strong> wind, chemical<br />
degradation (comprising acidification,<br />
salinization, fertility depletion, <strong>and</strong><br />
decrease in cation retention capacity),<br />
physical degradation (comprising crusting,<br />
compaction, hard-setting, etc.) <strong>and</strong> biological<br />
degradation (reduction in total <strong>and</strong><br />
biomass carbon, <strong>and</strong> decline in l<strong>and</strong> biodiversity).<br />
The latter comprises important<br />
concerns related to eutrophication of<br />
surface water, contamination of ground<br />
water, <strong>and</strong> emissions of trace gases (CO 2 ,<br />
CH 4 , N 2 O, NO x ) from terrestrial/aquatic<br />
ecosystems to the atmosphere. Soil structure<br />
is the important property that affects<br />
all degradative processes. Factors that<br />
determine the kind of degradative<br />
6
processes include l<strong>and</strong> quality as affected<br />
by the intrinsic properties of climate,<br />
terrain <strong>and</strong> l<strong>and</strong>scape position, climax<br />
vegetation <strong>and</strong> biodiversity, especially soil<br />
biodiversity.<br />
In an assessment of population levels in the<br />
world's dryl<strong>and</strong>s, the Office to Combat<br />
Desertification <strong>and</strong> Drought (UNSO) of the<br />
United Nations Development Programme<br />
(UNDP) showed that globally 54 million km 2<br />
or 40 per cent of the l<strong>and</strong> area is occupied<br />
by dryl<strong>and</strong>s. About 29.7 per cent of this area<br />
falls in the arid region, 44.3 per cent in the<br />
semi-arid region <strong>and</strong> 26 per cent in the dry<br />
sub-humid region. A large majority of the<br />
dryl<strong>and</strong>s are in Asia (34.4 per cent) <strong>and</strong><br />
Africa (24.1 per cent), followed by the<br />
Americas (24 per cent), Australia (15 per<br />
cent) <strong>and</strong> Europe (2.5 per cent).<br />
Figure 1 indicates that the areas of the world<br />
vulnerable to l<strong>and</strong> degradation cover about<br />
33 per cent of the global l<strong>and</strong> surface. At the<br />
global level, it is estimated that the annual<br />
income foregone in the areas immediately<br />
affected by desertification amounts to<br />
approximately US$ 42 billion each year.<br />
The semi-arid to weakly aridic areas of<br />
Africa are particularly vulnerable, as they<br />
have fragile soils, localized high population<br />
densities, <strong>and</strong> generally a low-input form of<br />
agriculture. About 25 per cent of l<strong>and</strong> in<br />
Asian countries is vulnerable.<br />
Long-term food productivity is threatened<br />
by soil degradation, which is now severe<br />
enough to reduce yields on approximately<br />
16 per cent of the agricultural l<strong>and</strong>, especially<br />
cropl<strong>and</strong> in Africa, Central America<br />
<strong>and</strong> pastures in Africa. Sub-Saharan Africa<br />
has the highest rate of l<strong>and</strong> degradation. It is<br />
estimated that losses in productivity of cropping<br />
l<strong>and</strong> in sub-Saharan Africa are in the<br />
order of 0.5-1 per cent annually, suggesting<br />
productivity loss of at least 20 per cent over<br />
the last 40 years.<br />
Africa is particularly threatened because the<br />
l<strong>and</strong> degradation processes affect about 46<br />
per cent of the continent. The significance of<br />
Figure 1. Areas<br />
vulnerable to<br />
desertification in<br />
different parts of the<br />
world (Source: U.S.<br />
Department of<br />
Agriculture, Natural<br />
Resources<br />
Conservation Service).<br />
Vulnerability<br />
Low<br />
Moderate<br />
High<br />
Very high<br />
Other regions<br />
Dry<br />
Cold<br />
Humid/not vulnerable<br />
Ice/Glacier<br />
7
this large area becomes evident when one<br />
considers that about 43 per cent of Africa is<br />
characterized as extreme desert (the desert<br />
margins represent the areas with very high<br />
vulnerability). There is only about 11 per<br />
cent of the l<strong>and</strong> mass which is humid <strong>and</strong><br />
which by definition is excluded from desertification<br />
processes. There is about 2.5 million<br />
km 2 of l<strong>and</strong> under low risk, 3.6 million km 2<br />
under moderate risk, 4.6 million km 2 under<br />
high risk, <strong>and</strong> 2.9 million km 2 under very<br />
high risk. The region with the highest<br />
propensity is located along the desert<br />
margins <strong>and</strong> occupies about 5 per cent of the<br />
l<strong>and</strong>mass. It is estimated that about 22<br />
million people (2.9 per cent of the total population)<br />
live in this area. The low, moderate<br />
<strong>and</strong> high vulnerability classes occupy 14, 16,<br />
<strong>and</strong> 11 per cent respectively <strong>and</strong> together<br />
impact about 485 million people.<br />
L<strong>and</strong> degradation is also a serious problem<br />
in Australia with over 68 per cent of the l<strong>and</strong><br />
estimated to have been degraded (Table 1).<br />
According to UNCCD, the consequences of<br />
l<strong>and</strong> degradation include undermining of<br />
food production, famine, increased social<br />
costs, decline in the quantity <strong>and</strong> quality of<br />
fresh water supplies, increased poverty <strong>and</strong><br />
political instability, reduction in the l<strong>and</strong>'s<br />
resilience to natural climate variability <strong>and</strong><br />
decreased soil productivity.<br />
L<strong>and</strong> degradation - causes<br />
L<strong>and</strong> degradation involves two interlocking,<br />
complex systems: the natural ecosystem <strong>and</strong><br />
the human social system. Natural forces,<br />
through periodic stresses of extreme <strong>and</strong><br />
persistent climatic events, <strong>and</strong> human use<br />
<strong>and</strong> abuse of sensitive <strong>and</strong> vulnerable dry<br />
l<strong>and</strong> ecosystems, often act in unison,<br />
creating feedback processes, which are not<br />
fully understood. Interactions between the<br />
two systems determine the success or failure<br />
of resource management programmes.<br />
Causes of l<strong>and</strong> degradation are not only<br />
biophysical, but also socioeconomic (e.g.<br />
l<strong>and</strong> tenure, marketing, institutional support,<br />
income <strong>and</strong> human health) <strong>and</strong> political (e.g.<br />
incentives, political stability).<br />
High population density is not necessarily<br />
related to l<strong>and</strong> degradation. Rather, it is what<br />
a population does to the l<strong>and</strong> that determines<br />
the extent of degradation. People can<br />
be a major asset in reversing a trend<br />
towards degradation. Indeed, mitigation of<br />
l<strong>and</strong> degradation can only succeed if l<strong>and</strong><br />
users have control <strong>and</strong> commitment to<br />
maintain the quality of the resources.<br />
However, they need to be healthy <strong>and</strong> politically<br />
<strong>and</strong> economically motivated to care for<br />
the l<strong>and</strong>, as subsistence agriculture, poverty<br />
<strong>and</strong> illiteracy can be important causes of<br />
l<strong>and</strong> <strong>and</strong> environmental degradation.<br />
Type Area (000 km 2 )<br />
Total 443<br />
Not degraded 142<br />
Degraded 301<br />
i) Water erosion 206<br />
ii) Wind erosion 52<br />
iii) Combined water <strong>and</strong> wind erosion 42<br />
iv) Salinity <strong>and</strong> water erosion 0.9<br />
v) Others 0.5<br />
Table 1. L<strong>and</strong> degradation<br />
on cropl<strong>and</strong> in Australia<br />
(Source: Woods, 1983;<br />
Mabbutt, 1992).<br />
8
There are many, usually confounding,<br />
reasons why l<strong>and</strong> users permit their l<strong>and</strong> to<br />
degrade. Many of these reasons are related<br />
to societal perceptions of l<strong>and</strong> <strong>and</strong> the<br />
values placed on it. The absence of l<strong>and</strong><br />
tenure <strong>and</strong> the resulting lack of stewardship<br />
is a major constraint to adequate care for<br />
the l<strong>and</strong> in some countries. <strong>Degradation</strong> is<br />
also a slow, imperceptible process, meaning<br />
that many people are not aware that their<br />
l<strong>and</strong> is degrading.<br />
Loss of vegetation can propagate further<br />
l<strong>and</strong> degradation via l<strong>and</strong> surface-atmosphere<br />
feedback. This occurs when a<br />
decrease in vegetation reduces evaporation<br />
<strong>and</strong> increases the radiation reflected back<br />
to the atmosphere (albedo), consequently<br />
reducing cloud formation. Large-scale<br />
experiments in which numerical models of<br />
the general circulation have been run with<br />
artificially high albedo over dryl<strong>and</strong>s, have<br />
suggested that large increases in the<br />
albedo of subtropical areas could reduce<br />
rainfall.<br />
Climatic consequences of l<strong>and</strong><br />
degradation<br />
L<strong>and</strong> surface is an important part of the<br />
climate system (Figure 2). The interaction<br />
between l<strong>and</strong> surface <strong>and</strong> the atmosphere<br />
involves multiple processes <strong>and</strong> feedbacks,<br />
all of which may vary simultaneously. It is<br />
frequently stressed that the changes of<br />
vegetation type can modify the characteristics<br />
of the regional atmospheric circulation<br />
<strong>and</strong> the large-scale external moisture fluxes.<br />
Changes in surface energy budgets resulting<br />
from l<strong>and</strong> surface change can have a<br />
profound influence on the Earth's climate.<br />
Following deforestation, surface evapotranspiration<br />
<strong>and</strong> sensible heat flux are related to<br />
the dynamic structure of the low-level<br />
atmosphere. These changes in fluxes within<br />
the atmospheric column could influence the<br />
regional, <strong>and</strong> potentially, global-scale<br />
atmospheric circulation. For example,<br />
changes in forest cover in the Amazon basin<br />
affect the flux of moisture to the atmosphere,<br />
regional convection, <strong>and</strong> hence<br />
regional rainfall. More recent work shows<br />
that these changes in forest cover have<br />
consequences far beyond the Amazon basin.<br />
Fragmentation of l<strong>and</strong>scape can affect<br />
convective flow regimes <strong>and</strong> rainfall<br />
patterns locally <strong>and</strong> globally. El Niño<br />
events <strong>and</strong> l<strong>and</strong> surface change simulations<br />
with climate models suggest that in<br />
equatorial regions where towering thunderstorms<br />
are frequent, disturbing areas<br />
hundreds of kilometres wide may yield<br />
global impacts.<br />
Use of a numerical simulation model to<br />
study the interactions between convective<br />
clouds, the convective boundary layer <strong>and</strong> a<br />
forested surface showed that surface<br />
parameters such as soil moisture, forest<br />
coverage, <strong>and</strong> transpiration <strong>and</strong> surface<br />
roughness may affect the formation of<br />
convective clouds <strong>and</strong> rainfall through their<br />
effect on boundary-layer growth.<br />
An atmospheric general circulation model<br />
with realistic l<strong>and</strong>-surface properties was<br />
Figure 2. L<strong>and</strong> surface<br />
is an important part of<br />
the climate system <strong>and</strong><br />
l<strong>and</strong> surface parameters<br />
could affect<br />
rainfall.<br />
9
Figure 3. L<strong>and</strong> use is<br />
an important factor in<br />
determining the<br />
vulnerability of<br />
ecosystems.<br />
employed to investigate the climatic effect<br />
of doubling the extent of the Earth's deserts<strong>and</strong>.<br />
It showed a notable correlation<br />
between decreases in evapotranspiration<br />
<strong>and</strong> resulting precipitation. It was shown<br />
that Northern Africa suffers a strong yearround<br />
drought while Southern Africa has a<br />
somewhat weaker year-round drought.<br />
Some regions, particularly the Sahel,<br />
showed an increase in surface temperature<br />
caused by decreased soil moisture <strong>and</strong><br />
latent-heat flux.<br />
L<strong>and</strong> use <strong>and</strong> l<strong>and</strong> cover changes influence<br />
carbon fluxes <strong>and</strong> greenhouse gas (GHG)<br />
emissions which directly alter atmospheric<br />
composition <strong>and</strong> radiative forcing properties.<br />
They also change l<strong>and</strong>-surface<br />
characteristics <strong>and</strong>, indirectly, climatic<br />
processes. Observations during the HAPEX-<br />
Sahel project suggested that a large-scale<br />
transformation of fallow savannah into<br />
arable crops like millet, may lead to a<br />
decrease in evaporation. L<strong>and</strong> use <strong>and</strong> l<strong>and</strong><br />
cover change is an important factor in<br />
determining the vulnerability of ecosystems<br />
(Figure 3) <strong>and</strong> l<strong>and</strong>scapes to<br />
environmental change.<br />
Since the industrial revolution, global emissions<br />
of carbon (C) are estimated at 270±30<br />
gigatons (Gt) due to fossil fuel combustion<br />
<strong>and</strong> 136±5 Gt due to l<strong>and</strong> use change <strong>and</strong><br />
soil cultivation. Emissions due to l<strong>and</strong> use<br />
change include those by deforestation,<br />
biomass burning, conversion of natural to<br />
agricultural ecosystems, drainage of<br />
wetl<strong>and</strong>s <strong>and</strong> soil cultivation. Depletion of<br />
the soil organic C (SOC) pool has<br />
contributed 78±12 Gt of C to the atmosphere,<br />
of which about one-third is attributed<br />
to soil degradation <strong>and</strong> accelerated erosion<br />
<strong>and</strong> two-thirds to mineralization.<br />
L<strong>and</strong> degradation aggravates CO 2 -induced<br />
climate change through the release of CO 2<br />
from cleared <strong>and</strong> dead vegetation <strong>and</strong><br />
through the reduction of the carbon sequestration<br />
potential of degraded l<strong>and</strong>.<br />
Climatic factors in l<strong>and</strong> degradation<br />
<strong>Climate</strong> exerts a strong influence over<br />
dryl<strong>and</strong> vegetation type, biomass <strong>and</strong> diversity.<br />
Precipitation <strong>and</strong> temperature<br />
determine the potential distribution of<br />
terrestrial vegetation <strong>and</strong> constitute the<br />
principal factors in the genesis <strong>and</strong> evolution<br />
of soil. Precipitation also influences<br />
vegetation production, which in turn<br />
controls the spatial <strong>and</strong> temporal occurrence<br />
of grazing <strong>and</strong> favours nomadic<br />
lifestyle. Vegetation cover becomes<br />
progressively thinner <strong>and</strong> less continuous<br />
with decreasing annual rainfall. Dryl<strong>and</strong><br />
plants <strong>and</strong> animals display a variety of physiological,<br />
anatomical <strong>and</strong> behavioural<br />
adaptations to moisture <strong>and</strong> temperature<br />
stresses brought about by large diurnal <strong>and</strong><br />
seasonal variations in temperature, rainfall<br />
<strong>and</strong> soil moisture.<br />
The generally high temperatures <strong>and</strong> low<br />
precipitation in the dryl<strong>and</strong>s lead to poor<br />
organic matter production <strong>and</strong> rapid oxidation.<br />
Low organic matter leads to poor<br />
aggregation <strong>and</strong> low aggregate stability<br />
leading to a high potential for wind <strong>and</strong><br />
water erosion. For example, wind <strong>and</strong><br />
water erosion is extensive in many parts of<br />
Africa. Excluding the current deserts, which<br />
occupy about 46 per cent of the l<strong>and</strong>mass,<br />
about 25 per cent of the l<strong>and</strong> is prone to<br />
water erosion <strong>and</strong> about 22 per cent, to<br />
wind erosion.<br />
Structural crusts/seals are formed by raindrop<br />
impact which could decrease<br />
infiltration, increase runoff <strong>and</strong> generate<br />
overl<strong>and</strong> flow <strong>and</strong> erosion. The severity,<br />
frequency, <strong>and</strong> extent of erosion are likely to<br />
be altered by changes in rainfall amount<br />
<strong>and</strong> intensity <strong>and</strong> changes in wind.<br />
L<strong>and</strong> management will continue to be the<br />
principal determinant of the soil organic<br />
matter (SOM) content <strong>and</strong> susceptibility to<br />
erosion during the next few decades, but<br />
changes in vegetation cover resulting from<br />
10
L<strong>and</strong> stresses<br />
Inherent l<strong>and</strong> quality<br />
Stress<br />
class<br />
Area<br />
Area Area<br />
Kinds of stress<br />
Class<br />
(1,000 km 2 ) (1,000 km 2 ) (%)<br />
1 Few constraints 118.1 I 118.1 0.4<br />
2 High shrink/swell 107.6 II<br />
3 Low organic matter 310.9 II<br />
4 High soil temperatures 901.0 II 1,319.6 4.5<br />
5 Seasonal excess water 198.9 III<br />
6 Minor root restrictions 566.5 III<br />
7 Short duration low temperatures .014 III 765.4 2.6<br />
8 Low structural stability 333.7 IV<br />
9 High anion exchange capacity 43.8 IV<br />
10 Impeded drainage 520.5 IV 898.0 3.1<br />
11 Seasonal moisture stress 3,814.9 V<br />
12 High aluminium 1,573.2 V<br />
13 Calcareous, gypseous 434.2 V<br />
14 Nutrient leaching 109.9 V 5,932.3 20.2<br />
15 Low nutrient holding capacity 2,141.0 VI<br />
16 High P, N retention 932.2 VI<br />
17 Acid sulphate 16.6 VI<br />
18 Low moisture <strong>and</strong> nutrient status 0 VI<br />
19 Low water holding capacity 2,219.5 VI 5,309.3 18.1<br />
20 High organic matter 17.0 VII<br />
21 Salinity/alkalinity 360.7 VII<br />
22 Shallow soils 1,016.9 VII 1,394.7 4.8<br />
23 Steep l<strong>and</strong>s 20.3 VIII<br />
24 Extended low temperatures 0 VIII 20.3 0.1<br />
25 Extended moisture stress 13,551.4 IX 13,551.4 46.2<br />
L<strong>and</strong> Area 29,309.1<br />
Water bodies 216.7<br />
Total area 29,525.8<br />
Table 2. Major l<strong>and</strong><br />
resources stresses<br />
<strong>and</strong> l<strong>and</strong> quality<br />
assessment of Africa<br />
(Source: Reich, P.F.,<br />
S.T. Numben, R.A.<br />
Almaraz, <strong>and</strong> H.<br />
Eswaran, 2001. L<strong>and</strong><br />
resource stresses <strong>and</strong><br />
desertification in<br />
Africa. In: Eds. Bridges,<br />
E.M., I.D. Hannam,<br />
F.W.T. Penning de<br />
Vries, S.J. Scherr, <strong>and</strong><br />
S. Sombatpanit. 2001.<br />
Response to L<strong>and</strong><br />
<strong>Degradation</strong>. Sci.<br />
Publishers, Enfield,<br />
USA. 101-114)<br />
short-term changes in weather <strong>and</strong> nearterm<br />
changes in climate are likely to affect<br />
SOM dynamics <strong>and</strong> erosion, especially in<br />
semi-arid regions.<br />
From the assessment of the l<strong>and</strong> resource<br />
stresses <strong>and</strong> desertification in Africa, which<br />
was carried out by the Natural Resources<br />
Conservation Service of the United States<br />
Department of Agriculture, utilizing information<br />
from the soil <strong>and</strong> climate resources<br />
of Africa, it can be concluded (Table 2) that<br />
climatic stresses account for 62.5 per cent<br />
of all the stresses on l<strong>and</strong> degradation in<br />
Africa. These climatic stresses include high<br />
soil temperature, seasonal excess water,<br />
short duration low temperatures, seasonal<br />
moisture stress <strong>and</strong> extended moisture<br />
11
Figure 4. Global<br />
distribution of natural<br />
disasters (1993-2002)<br />
Windstorms 28%<br />
Volcanic<br />
eruptions 2%<br />
Forest/scrub<br />
fires 5%<br />
stress, <strong>and</strong> affect 18.5 million km 2 of the<br />
l<strong>and</strong> in Africa. This study clearly exemplifies<br />
the importance of the need to give<br />
more careful consideration to climatic<br />
factors in l<strong>and</strong> degradation.<br />
According to the database of the Belgian<br />
Centre for Research on the Epidemiology of<br />
Disasters (CRED), weather, climate <strong>and</strong><br />
water-related hazards that occurred<br />
between 1993-2002 were responsible for 63<br />
per cent of the US$ 654 billion damage<br />
caused by all natural disasters. These natural<br />
hazards are therefore the most frequent<br />
<strong>and</strong> extensively observed ones (Figure 4)<br />
<strong>and</strong> they all have a major impact on l<strong>and</strong><br />
degradation.<br />
Rainfall<br />
Rainfall is the most important climatic factor<br />
in determining areas at risk of l<strong>and</strong> degradation<br />
<strong>and</strong> potential desertification. Rainfall<br />
plays a vital role in the development <strong>and</strong><br />
distribution of plant life, but the variability<br />
<strong>and</strong> extremes of rainfall can lead to soil<br />
erosion <strong>and</strong> l<strong>and</strong> degradation (Figure 5). If<br />
unchecked for a period of time, this l<strong>and</strong><br />
degradation can lead to desertification. The<br />
interaction of human activity on the distribution<br />
of vegetation through l<strong>and</strong><br />
management practices <strong>and</strong> seemingly<br />
benign rainfall events can make l<strong>and</strong> more<br />
Avalanches <strong>and</strong><br />
l<strong>and</strong>slides 6% Droughts <strong>and</strong> famines 9%<br />
Floods 37%<br />
Earthquakes 8%<br />
Extreme<br />
Temperatures 5%<br />
vulnerable to degradation. These vulnerabilities<br />
become more acute when the prospect<br />
of climate change is introduced.<br />
Rainfall <strong>and</strong> temperature are the prime<br />
factors in determining the world's climate<br />
<strong>and</strong> therefore the distribution of vegetation<br />
types. There is a strong correlation between<br />
rainfall <strong>and</strong> biomass since water is one of<br />
primary inputs to photosynthesis.<br />
Climatologists use an “aridity index” (the<br />
ratio of annual precipitation to potential<br />
evaporation) to help classify desert (arid) or<br />
semi-arid areas. Dryl<strong>and</strong>s exist because the<br />
annual water loss (evaporation) exceeds the<br />
annual rainfall; therefore these regions have<br />
a continual water deficit. Deserts are the<br />
ultimate example of a climate where annual<br />
evaporation far exceeds the annual rainfall.<br />
In cases where the annual water deficits are<br />
not so large, some plant life can take hold<br />
usually in the form of grassl<strong>and</strong>s or steppes.<br />
However, it is these dryl<strong>and</strong>s on the margins<br />
of the world's deserts that are most susceptible<br />
to desertification, <strong>and</strong> the most<br />
extreme example of l<strong>and</strong> degradation.<br />
Examples of these regions include the<br />
Pampas of South America, the Great<br />
Russian Steppes, the Great Plains of North<br />
America, <strong>and</strong> the Savannas of Southern<br />
Africa <strong>and</strong> Sahel region of west Africa. With<br />
normal climatic variability, in some years<br />
the water deficits can be greater than others<br />
but sometimes there can be a several<br />
consecutive years of water deficit or longterm<br />
drought. During this period, one can<br />
see examples of l<strong>and</strong> degradation as in the<br />
Dust Bowl years of the 1930s in the Great<br />
Plains or the nearly two-decade long<br />
drought in the Sahel in the 1970s <strong>and</strong> 1980s.<br />
It was this period of drought in the Sahel<br />
that created the current concern about<br />
desertification.<br />
For over a century, soil erosion data have<br />
been collected <strong>and</strong> analysed from soil scientists,<br />
agronomists, geologists, hydrologists,<br />
<strong>and</strong> engineers. From these investigations,<br />
scientists have developed a simple soil<br />
12
erosion relationship that incorporates the<br />
major soil erosion factors. The Universal<br />
Soil Loss Equation (USLE) was developed in<br />
the mid-1960s for underst<strong>and</strong>ing soil<br />
erosion for agricultural applications. In<br />
1985, it was updated <strong>and</strong> renamed the<br />
Revised Universal Soil Loss Equation<br />
(RUSLE) to incorporate the large amount of<br />
information that had accumulated since the<br />
original equation was developed <strong>and</strong> to<br />
address l<strong>and</strong> use applications besides agriculture,<br />
such as soil loss from mined l<strong>and</strong>s,<br />
construction sites, <strong>and</strong> reclaimed l<strong>and</strong>s. The<br />
RUSLE is derived from the theory of soil<br />
erosion <strong>and</strong> from more than 10,000 plotyears<br />
of data from natural rainfall plots <strong>and</strong><br />
numerous rainfall simulations.<br />
THE RUSLE IS DEFINED AS:<br />
A = R K L S C P<br />
where A is the soil loss per year (t/ha/year);<br />
R represents the rainfall-runoff erosivity<br />
factor; K is the soil erodibilty factor; L represents<br />
the slope length; S is the slope<br />
steepness; C represents the cover management,<br />
<strong>and</strong> P denotes the supporting<br />
practices factor. These factors illustrate the<br />
interaction of various climatic, geological,<br />
<strong>and</strong> human factors, <strong>and</strong> that smart l<strong>and</strong><br />
management practices can minimize soil<br />
erosion <strong>and</strong> even l<strong>and</strong> degradation.<br />
The extremes of either too much or too little<br />
rainfall can produce soil erosion that can<br />
lead to l<strong>and</strong> degradation (Figure 6).<br />
However, soil scientists consider rainfall the<br />
most important erosion factor among the<br />
many factors that cause soil erosion.<br />
Rainfall can erode soil by the force of<br />
raindrops, surface <strong>and</strong> subsurface runoff,<br />
<strong>and</strong> river flooding. The velocity of rain<br />
hitting the soil surface produces a large<br />
amount of kinetic energy, which can<br />
dislodge soil particles. Erosion at this microscale<br />
can also be caused by easily<br />
dissoluble soil material made watersoluble<br />
Rain<br />
L<strong>and</strong><br />
Surface runoff<br />
Flood<br />
River<br />
by weak acids in the rainwater. The breaking<br />
apart <strong>and</strong> splashing of soil particles due to<br />
raindrops is only the first stage of the<br />
process, being followed by the washing<br />
away of soil particles <strong>and</strong> further erosion<br />
caused by flowing water. However, without<br />
surface runoff, the amount of soil erosion<br />
caused by rainfall is relatively small.<br />
Once the soil particles have been dislodged<br />
they become susceptible to runoff. In<br />
general, the higher the intensity of the<br />
rainfall, the greater the quantity of soil<br />
available in runoff water. In the case of light<br />
rain for a long duration, most of the soil<br />
dislodgement takes place in the underwater<br />
environment <strong>and</strong> the soil particles are<br />
mostly fine. The greater the intensity of<br />
rainfall <strong>and</strong> subsequent surface runoff, the<br />
larger the soil particles that are carried<br />
away. A critical factor that determines soil<br />
erosion by rainfall is the permeability of the<br />
soil, which indirectly influences the total<br />
amount of soil loss <strong>and</strong> the pattern of<br />
erosion on slopes. One unfortunate byproduct<br />
of runoff is the corresponding<br />
transport of agricultural chemicals <strong>and</strong> the<br />
leaching of these chemicals into the<br />
groundwater.<br />
Sea<br />
Pollution<br />
Runoff/floodwater<br />
Sediment<br />
Figure 5. Schematic<br />
diagram of rainfallinduced<br />
processes<br />
involved in l<strong>and</strong><br />
degradation.<br />
13
Figure 6. The extremes<br />
of either too much or<br />
too little rainfall can<br />
produce soil erosion<br />
that can lead to l<strong>and</strong><br />
degradation.<br />
Rainfall intensity is the most important<br />
factor governing soil erosion caused by<br />
rain. Dryl<strong>and</strong> precipitation is inherently variable<br />
in amounts <strong>and</strong> intensities <strong>and</strong> so is the<br />
subsequent runoff. Surface runoff is often<br />
higher in dryl<strong>and</strong>s than in more humid<br />
regions due to the tendency of dry l<strong>and</strong> soils<br />
to form impermeable crusts under the<br />
impact of intense thunderstorms <strong>and</strong> in the<br />
absence of significant plant cover or litter. In<br />
these cases, soil transport may be an order<br />
of magnitude greater per unit momentum of<br />
falling raindrops than when the soil surface<br />
is well vegetated. The sparser the plant<br />
cover, the more vulnerable the topsoil is to<br />
dislodgement <strong>and</strong> removal by raindrop<br />
impact <strong>and</strong> surface runoff. Also, the timing<br />
of the rainfall can play a crucial role in soil<br />
erosion leading to l<strong>and</strong> degradation. An<br />
erratic start to the rainy season along with<br />
heavy rain will have a greater impact since<br />
the seasonal vegetation will not be available<br />
to intercept the rainfall or stabilize the soil<br />
with its root structure.<br />
An ongoing effort of scientists is to try to<br />
integrate all these factors into models that<br />
can be used to predict soil erosion. The<br />
Water Erosion Prediction Project (WEPP)<br />
model is a process-based, distributed<br />
parameter, continuous simulation, erosion<br />
prediction model for use on personal<br />
computers <strong>and</strong> can be applied at the field<br />
scale to simulate hillslope erosion or more<br />
complex watershed scale erosion. It mimics<br />
the natural processes that are important in<br />
soil erosion. It updates the everyday soil<br />
<strong>and</strong> crop conditions that affect soil erosion.<br />
When rainfall occurs, the plant <strong>and</strong> soil<br />
characteristics are used to determine if<br />
surface runoff will occur. The WEPP model<br />
includes a number of conceptual components<br />
that include: climate <strong>and</strong> weather<br />
(rainfall, temperature, solar radiation, wind,<br />
freeze - thaw, snow accumulation <strong>and</strong> melting),<br />
irrigation (stationary sprinkler, furrow),<br />
hydrology - (infiltration, depressional<br />
storage, runoff), water balance (evapotranspiration,<br />
percolation, drainage), soils<br />
(types <strong>and</strong> properties), crop growth - (cropl<strong>and</strong>,<br />
rangel<strong>and</strong>, forestl<strong>and</strong>), residue<br />
management <strong>and</strong> decomposition, tillage<br />
impacts on infiltration <strong>and</strong> erodibility,<br />
erosion - (interrill, rill, channel), deposition<br />
(rills, channels, <strong>and</strong> impoundments), sediment<br />
delivery, particle sorting <strong>and</strong><br />
enrichment.<br />
Of special note is the impact of other forms<br />
of precipitation on soil erosion. Hail has a<br />
severe effect on the soil surface because its<br />
kinetic energy is several times that of rain,<br />
resulting in much more soil surface being<br />
destroyed <strong>and</strong> a greater amount of material<br />
being washed away. And if hailstorms are<br />
accompanied by heavy rain, as is the case<br />
with some thunderstorms, large amounts of<br />
soil can be eroded, especially on agricultural<br />
l<strong>and</strong> before the crops can stabilize the<br />
soil surface. Snow-thaw erosion occurs<br />
when the soil freezes during the cold period<br />
<strong>and</strong> the freezing process dislodges the soil,<br />
so that when the spring thaw occurs, fine<br />
soil particles are released in the runoff. This<br />
14
kind of erosion can often produce greater<br />
erosion losses than rain. Also, when the soil<br />
freezes, the infiltration rate is greatly<br />
reduced so that when the thaw arrives, relatively<br />
intense soil erosion can take place<br />
even though the amount of snow-thaw is<br />
small. In this situation, the erosive<br />
processes can be multiplied by a combination<br />
of a heavy rain event <strong>and</strong> sudden influx<br />
of warm air. Leeward portions of mountainous<br />
areas are susceptible to this since they<br />
are typically drier <strong>and</strong> have less vegetation<br />
<strong>and</strong> are prone to katabatic winds (rapidly<br />
descending air from a mountain range<br />
warms very quickly).<br />
Floods<br />
Dryl<strong>and</strong> rivers have extremely variable<br />
flows <strong>and</strong> river discharge, <strong>and</strong> the amount<br />
of suspended sediments are highly sensitive<br />
to fluctuations in rainfall as well as any<br />
changes in the vegetation cover in the<br />
basins. The loss of vegetation in the headwaters<br />
of dryl<strong>and</strong> rivers can increase<br />
sediment load <strong>and</strong> can lead to dramatic<br />
change in the character of the river to a less<br />
stable, more seasonal river characterized by<br />
a rapidly shifting series of channels.<br />
However, rainfall can lead to l<strong>and</strong> degradation<br />
in other climates, including sub-humid<br />
ones. Excessive rainfall events either<br />
produced by thunderstorms, hurricanes <strong>and</strong><br />
typhoons, or mid-latitude low-pressure<br />
systems, can produce a large amount of<br />
water in a short period of time across local<br />
areas. This excess of water overwhelms the<br />
local watershed <strong>and</strong> produces river flooding<br />
(Figure 7). Of course, this is a natural<br />
phenomenon that has occurred for millions<br />
of years <strong>and</strong> continuously shapes the Earth.<br />
River flooding occurs in all climates, but it is<br />
in dryl<strong>and</strong> areas where the problem is most<br />
acute.<br />
Droughts<br />
Drought is a natural hazard originating from<br />
a deficiency of precipitation that results in a<br />
water shortage for some activities or<br />
groups. It is the consequence of a reduction<br />
in the amount of precipitation over an<br />
extended period of time, usually a season or<br />
more in length, often associated with other<br />
climatic factors - such as high temperatures,<br />
high winds <strong>and</strong> low relative humidity - that<br />
can aggravate the severity of the event. For<br />
example, the 2002-03 El Niño-related<br />
Australian drought, which lasted from<br />
March 2002 to January 2003, was arguably<br />
one of, if not the worst short-term drought<br />
in Australia's recorded meteorological<br />
Figure 7. Flooding of<br />
crop fields due to high<br />
intensity of rains is<br />
common in semi-arid<br />
regions.<br />
15
Flood forecasting<br />
Flooding occurs when rainwater or<br />
snowmelt accumulates faster than soils<br />
can absorb it or rivers carry it away.<br />
There are various types of floods from<br />
localized flash floods to widespread<br />
river flooding <strong>and</strong> they can be triggered<br />
by severe thunderstorms, tropical<br />
cyclones, monsoons, ice jams or melting<br />
snow. In coastal areas, storm surges<br />
caused by tropical cyclones, tsunamis,<br />
or rivers swollen by exceptionally high<br />
tides can cause flooding, while large<br />
lakes can flood when the rivers feeding<br />
them are carrying a lot of snowmelt.<br />
Therefore flooding can contribute to<br />
l<strong>and</strong> degradation in almost any climate<br />
but dryl<strong>and</strong> climates are especially<br />
vulnerable due to the limited amount of<br />
vegetation the roots of which hold the<br />
soil together.<br />
Flood forecasting is a complex process<br />
that must take into account many different<br />
factors at the same time, depending<br />
on the type <strong>and</strong> nature of the phenomenon<br />
that triggers the flooding. For<br />
example, widespread flash floods are<br />
often started off by heavy rain falling in<br />
one area within a larger area of lighter<br />
rain, a confusing situation that makes it<br />
difficult to forecast where the worst<br />
flood will occur. Forecasting floods<br />
caused by the heavy rain or storm<br />
surges that can sweep inl<strong>and</strong> as part of<br />
a tropical cyclone can also be a<br />
complex task, as predictions have to<br />
include where they will l<strong>and</strong>, the stage<br />
of their evolution <strong>and</strong> the physical characteristics<br />
of the coast.<br />
the auspices of the <strong>WMO</strong>, undertake<br />
flood forecasting based on quantitative<br />
precipitation forecasts (QPFs), which<br />
have become more accurate in recent<br />
years, especially for light <strong>and</strong> moderate<br />
amounts of precipitation, although high<br />
amounts <strong>and</strong> rare events are still difficult<br />
to predict. Setting up forecasting<br />
systems that integrate predictions for<br />
weather with those for water-related<br />
events is becoming more of a possibility<br />
every day, paving the way for a truly<br />
integrated approach.<br />
Forecasting also needs to be a cooperative<br />
<strong>and</strong> multidisciplinary effort. With<br />
the many issues <strong>and</strong> the complexity of<br />
factors surrounding floods, flood<br />
managers have to join forces with meteorologists,<br />
hydrologists, town planners,<br />
<strong>and</strong> civil defence authorities using available<br />
integrated models. Determining the<br />
socio-economic impacts of floods will<br />
mean taking a close look at construction<br />
or other activities in <strong>and</strong> around river<br />
channels. Up-to-date <strong>and</strong> accurate information<br />
is essential, through all the<br />
available channels: surface observation,<br />
remote sensing <strong>and</strong> satellite technology,<br />
as well as computer models.<br />
To make predictions as accurately as<br />
possible, National Meteorological <strong>and</strong><br />
Hydrological Services (NMHSs), under<br />
16
history. Analysis of rainfall records for this<br />
11-month period showed that 90 per cent of<br />
the country received rainfall below that of<br />
the long-term median, with 56 per cent of<br />
the country receiving rainfall in the lowest<br />
10 per cent (i.e. decile-1) of recorded totals<br />
(Australia-wide rainfall records commenced<br />
in 1900). During the 2002-03 drought<br />
Australia experienced widespread bushfires,<br />
severe dust storms <strong>and</strong> agricultural<br />
impacts that resulted in a drop in Australia's<br />
Gross Domestic Product of over 1 per cent.<br />
The first five months of 2005 were exceptionally<br />
dry for much of Australia (Figure 8),<br />
leading many to label this period a truly<br />
exceptional drought.<br />
Extended droughts in certain arid l<strong>and</strong>s<br />
have initiated or exacerbated l<strong>and</strong> degradation.<br />
Records show that extensive droughts<br />
have afflicted Africa, with serious episodes,<br />
in 1965-1966, 1972-1974, 1981-1984, 1986-<br />
1987, 1991-1992, <strong>and</strong> 1994-1995. The<br />
aggregate impact of drought on the<br />
economies of Africa can be large: 8-9 per<br />
cent of GDP in Zimbabwe <strong>and</strong> Zambia in<br />
1992, <strong>and</strong> 4-6 per cent of GDP in Nigeria <strong>and</strong><br />
Niger in 1984. In the past 25 years, the Sahel<br />
has experienced the most substantial <strong>and</strong><br />
sustained decline in rainfall recorded<br />
anywhere in the world within the period of<br />
instrumental measurements. The Sahelian<br />
droughts in the 1970s were unique in their<br />
severity <strong>and</strong> were characterized as “the<br />
quintessence of a major environmental<br />
emergency” <strong>and</strong> their long-term impacts<br />
are now becoming clearer (Figure 9).<br />
Sea surface temperature (SST) anomalies,<br />
often related to the El Niño Southern<br />
Oscillation (ENSO) or North Atlantic<br />
Oscillation (NAO), contribute to rainfall<br />
variability in the Sahel. Droughts in West<br />
Africa correlate with warm SST in the<br />
tropical South Atlantic. Examination of the<br />
oceanographic <strong>and</strong> meteorological data<br />
from the period 1901-1985 showed that<br />
persistent wet <strong>and</strong> dry periods in the Sahel<br />
were related to contrasting patterns of SST<br />
anomalies on a near-global scale. From<br />
1982 to 1990, ENSO-cycle SST anomalies<br />
<strong>and</strong> vegetative production in Africa were<br />
found to be correlated. Warmer eastern<br />
equatorial Pacific waters during ENSO<br />
episodes correlated with rainfall of
Drought preparedness <strong>and</strong> management<br />
Drought can be characterized as a<br />
normal, recurring feature of climate <strong>and</strong><br />
it occurs in almost all climatic<br />
regimes,in areas of high as well as low<br />
rainfall. It is a temporary anomaly, in<br />
contrast to aridity, which is a permanent<br />
feature of the climate <strong>and</strong> is restricted<br />
to areas of low rainfall. Drought is the<br />
consequence of a natural reduction in<br />
the amount of precipitation received<br />
over an extended period of time,<br />
usually a season or more in length.<br />
Drought is also related to the timing<br />
(i.e.main season of occurrence, delays<br />
in the start of the rainy season,<br />
occurrence of rains in relation to<br />
primary crop growth stages) <strong>and</strong> to the<br />
intensity <strong>and</strong> number of rainfall events.<br />
Thus, each drought is unique in its<br />
climatic characteristics <strong>and</strong> impacts.<br />
The absence of a precise <strong>and</strong><br />
universally accepted definition of<br />
drought contributes to the confusion<br />
about whether or not a drought exists<br />
<strong>and</strong>, if it does, its degree of severity.<br />
Realistically, definitions of drought must<br />
be made on a regional <strong>and</strong> impactspecific<br />
basis (agricultural, water<br />
resources, etc.). Drought impacts are<br />
spread over a larger geographical area<br />
than damages that result from other<br />
natural hazards such as the impacts of<br />
floods <strong>and</strong> hurricanes. For these<br />
reasons, the quantification of impacts<br />
<strong>and</strong> the provision of disaster relief are<br />
far more difficult tasks for drought than<br />
they are for other natural hazards.<br />
Early warning systems can reduce<br />
impacts by providing timely information<br />
about the onset of drought.<br />
Conventional surface observation<br />
stations within National Meteorological<br />
Services are one link in the chain,<br />
providing essential benchmark data <strong>and</strong><br />
time series necessary for improved<br />
monitoring of the climate <strong>and</strong><br />
hydrologic system. Tracking certain<br />
indicators such as stream flow or soil<br />
moisture can help in formulating<br />
drought index values - typically single<br />
numbers, far more useful than raw data<br />
for decision-making.<br />
Drought plans should contain three<br />
basic components: monitoring <strong>and</strong> early<br />
warning, risk assessment, <strong>and</strong><br />
mitigation <strong>and</strong> response. Because of the<br />
slow onset characteristics of droughts,<br />
monitoring <strong>and</strong> early warning systems<br />
provide the foundation for an effective<br />
drought mitigation plan. A plan must<br />
rely on accurate <strong>and</strong> timely<br />
assessments to trigger mitigation <strong>and</strong><br />
emergency response programmes.<br />
Various <strong>WMO</strong> programmes monitor<br />
extreme climate events associated with<br />
drought, while four monitoring centres -<br />
two in Africa, one in China <strong>and</strong> the<br />
Global Information <strong>and</strong> Early Warning<br />
System - provide weather advisories<br />
<strong>and</strong> one <strong>and</strong> three-month climate<br />
summaries. Among other African early<br />
warning systems, the Southern Africa<br />
Development Community (SADC)<br />
monitors the crop <strong>and</strong> food situation in<br />
the region <strong>and</strong> issues alerts during<br />
periods of impending crisis. Such<br />
networks can be the backbone of<br />
drought contingency planning <strong>and</strong><br />
coordinated plans for dealing with<br />
drought when it comes.<br />
18
Sahel drought of 1968-1973 — permanent<br />
loss of Sahel savannah vegetation would<br />
permit drought conditions to persist. The<br />
effect of drought, reducing soil moisture<br />
<strong>and</strong> thus evaporation <strong>and</strong> cloud cover, <strong>and</strong><br />
increasing surface albedo as plant cover is<br />
destroyed, is generally to increase ground<br />
<strong>and</strong> near-surface air temperatures while<br />
reducing the surface radiation balance <strong>and</strong><br />
exacerbating the deficit in the radiation<br />
balance of the local surface-atmosphere<br />
system. This entails increased atmospheric<br />
subsidence <strong>and</strong> consequently further<br />
reduced precipitation.<br />
Solar radiation, temperature <strong>and</strong><br />
evaporation<br />
The only source of energy for the Earth is<br />
the Sun but our world intercepts only a tiny<br />
amount of this energy (less than a tenth of<br />
one per cent) needed for the various biological<br />
(photosynthesis) <strong>and</strong> geophysical<br />
(weather <strong>and</strong> climate) processes that life<br />
depends on. The Earth system, based on<br />
fundamental rules of physics, must emit the<br />
same amount of radiation it receives.<br />
Therefore, the complex transfer of energy to<br />
satisfy this requirement is the basis for our<br />
weather <strong>and</strong> climate. Solar radiation is<br />
highly correlated with cloudiness, <strong>and</strong> in<br />
most dryl<strong>and</strong> climates where there are little<br />
or no clouds, solar radiation can be quite<br />
intense. In fact, some of the highest known<br />
values of solar radiation can be found in<br />
places like the Sahara desert. Solar heating<br />
of the l<strong>and</strong> surface is the main contribution<br />
to the air temperature.<br />
Along with rainfall, temperature is the main<br />
factor determining climate <strong>and</strong> therefore the<br />
distribution of vegetation <strong>and</strong> soil formation.<br />
Soil formation is the product of many<br />
factors that include: the parent material<br />
(rock), topography, climate, biological activity,<br />
<strong>and</strong> time. Temperature <strong>and</strong> rainfall cause<br />
different patterns of weathering <strong>and</strong> leaching<br />
in soils. Seasonal <strong>and</strong> daily changes in<br />
temperature can affect the soil moisture,<br />
biological activity, rates of chemical reactions,<br />
<strong>and</strong> the types of vegetation. Important<br />
chemical reactions in the soil include the<br />
nitrogen <strong>and</strong> carbon cycles.<br />
During the summer in the tropics, surface<br />
soil temperatures can exceed 55°C <strong>and</strong> this<br />
intense heat contributes to the cracking of<br />
highly-clay soils that expose not only the<br />
soil surface but also the soil subsurface to<br />
water or wind erosion. Of course, these high<br />
temperatures will also increase soil evaporation<br />
(Figure 10) <strong>and</strong> further reduce<br />
available soil moisture for plant growth.<br />
In temperate dry l<strong>and</strong>s, the freeze-thaw<br />
cycle can have a direct effect on the<br />
composition of the soil by the movement<br />
of rocks <strong>and</strong> stones from various depths to<br />
the surface. In high elevations, the freezethaw<br />
is one factor degrading rock<br />
structures, causing cracks <strong>and</strong> fissures<br />
which could lead to l<strong>and</strong>slides <strong>and</strong> rock<br />
avalanches.<br />
Evaporation is the conversion of water from<br />
the liquid or solid state into vapour, <strong>and</strong> its<br />
diffusion into the atmosphere. A vapour<br />
pressure gradient between the evaporating<br />
surface <strong>and</strong> the atmosphere <strong>and</strong> a source of<br />
energy are necessary for evaporation. Solar<br />
radiation is the dominant source of energy<br />
Figure 10. High soil<br />
temperatures on s<strong>and</strong>y<br />
soils can enhance soil<br />
evaporation.<br />
19
<strong>and</strong> sets the broad limits of evaporation.<br />
Solar radiation values in the tropics are<br />
high, modified by the cloud cover, which<br />
lead to a high evaporative dem<strong>and</strong> of the<br />
atmosphere. In the arid <strong>and</strong> semi-arid<br />
regions, considerable energy may be<br />
advected from the surrounding dry areas<br />
over irrigated zones. Transfer of energy<br />
downwards to the evaporating surface is<br />
often termed “the oasis effect” <strong>and</strong> in the<br />
cotton-growing areas of Gezira in Sudan,<br />
marked oasis effects have been shown to<br />
create water losses of up to twice those<br />
calculated using st<strong>and</strong>ard meteorological<br />
formulae.<br />
Climatic factors induce an evaporative<br />
dem<strong>and</strong> on the atmosphere, but the actual<br />
resulting evaporation will be influenced by<br />
the nature of the evaporating surfaces as<br />
well as by the availability of water. On<br />
degraded l<strong>and</strong>, the l<strong>and</strong> surface itself influences<br />
the evaporative dem<strong>and</strong> by the<br />
albedo <strong>and</strong> surface roughness, the latter<br />
affecting turbulence. In the arid <strong>and</strong> semiarid<br />
regions, the high evaporation which<br />
greatly exceeds precipitation leads to accumulation<br />
of salts on soil surface. Soils with<br />
natric horizon are easily dispersed <strong>and</strong> the<br />
low moisture levels lead to limited biological<br />
activity.<br />
Wind<br />
The dryl<strong>and</strong>s of the world are affected by<br />
moderate to severe l<strong>and</strong> degradation from<br />
wind erosion <strong>and</strong> there is evidence that the<br />
frequency of s<strong>and</strong> storms/dust storms in<br />
increasing. It has been estimated that in the<br />
arid <strong>and</strong> semi-arid zones of the world, 24 per<br />
cent of the cultivated l<strong>and</strong> <strong>and</strong> 41 per cent of<br />
the pasture l<strong>and</strong> are affected by moderate to<br />
severe l<strong>and</strong> degradation from wind erosion.<br />
The worldwide total annual production of<br />
dust by deflation of soils <strong>and</strong> sediments was<br />
estimated to be 61 to 366 million tonnes.<br />
Losses of desert soil due to wind erosion are<br />
Figure 11. The amount of dust arising from the Sahel zone<br />
is reported to be around 270 million tonnes per year.<br />
globally significant. The upper limit for<br />
global estimates of the long-range transport<br />
of desert dust is approximately 1 × 10 16 g<br />
year -1 .<br />
For Africa, it is estimated that more than 100<br />
million tonnes of dust per annum is blown<br />
westward over the Atlantic. The amount of<br />
dust arising from the Sahel zone has been<br />
reported to be around or above 270 million<br />
tonnes per year (Figure 11) which corresponds<br />
to a loss of 30 mm per m 2 per year<br />
or a layer of 20 mm over the entire area.<br />
Every year desert encroachment caused by<br />
wind erosion buries 210,000 hectares of<br />
productive l<strong>and</strong> in China. It was shown that<br />
the annual changes in the frequency of<br />
strong <strong>and</strong> extremely strong s<strong>and</strong>storms in<br />
China are as follows: five times in the 1950s,<br />
eight times in the 1960s, 13 times in the<br />
1970s, 14 times in the 1980s, <strong>and</strong> 20 times in<br />
the 1990s.<br />
20
S<strong>and</strong> <strong>and</strong> dust storms are hazardous<br />
weather <strong>and</strong> cause major agricultural <strong>and</strong><br />
environmental problems in many parts of<br />
the world. There is a high on-site as well as<br />
off-site cost due to the s<strong>and</strong> <strong>and</strong> dust<br />
storms. They can move forward like an<br />
overwhelming tide <strong>and</strong> strong winds take<br />
along drifting s<strong>and</strong>s to bury farml<strong>and</strong>s, blow<br />
out top soil, denude steppe, hurt animals,<br />
attack human settlements, reduce the<br />
temperature, fill up irrigation canals <strong>and</strong><br />
road ditches with sediments, cover the railroads<br />
<strong>and</strong> roads, cause household dust<br />
damage, affect the quality of water in rivers<br />
<strong>and</strong> streams, affect air quality, pollute the<br />
atmosphere <strong>and</strong> destroy mining <strong>and</strong><br />
communication facilities. They accelerate<br />
the process of l<strong>and</strong> degradation <strong>and</strong> cause<br />
serious environment pollution <strong>and</strong> huge<br />
destruction to ecology <strong>and</strong> the living environment.<br />
Atmospheric loading of dust<br />
caused by wind erosion also affects human<br />
health <strong>and</strong> environmental air quality.<br />
Wind erosion-induced damage includes<br />
direct damage to crops through the loss of<br />
plant tissue <strong>and</strong> reduced photosynthetic<br />
activity as a result of s<strong>and</strong>blasting, burial of<br />
seedlings under s<strong>and</strong> deposits, <strong>and</strong> loss of<br />
topsoil. The last process is particularly<br />
worrying since it potentially affects the soil<br />
resource base <strong>and</strong> hence crop productivity<br />
on a long-term basis, by removing the layer<br />
of soil that is inherently rich in nutrients <strong>and</strong><br />
organic matter. Wind erosion on light s<strong>and</strong>y<br />
soils can provoke severe l<strong>and</strong> degradation<br />
(Figure 12 left) <strong>and</strong> s<strong>and</strong> deposits on young<br />
seedlings can affect crop establishment<br />
(Figure 12 right).<br />
Calculations based on visibility <strong>and</strong> wind<br />
speed records for 100 km-wide dust plumes,<br />
centred on eight climate stations around<br />
South Australia, indicated that dust transport<br />
mass was as high as ten million tonnes.<br />
Thus dust entrainment during dust events<br />
leads to long-term soil degradation, which is<br />
essentially irreversible. The cost to productivity<br />
is difficult to measure but is likely to be<br />
quite substantial.<br />
Causes of wind erosion<br />
The occurrence of wind erosion at any place<br />
is a function of weather events interacting<br />
with soil <strong>and</strong> l<strong>and</strong> management through its<br />
effects on soil structure, tilth <strong>and</strong> vegetation<br />
Figure 12. Wind erosion<br />
on light s<strong>and</strong>y soils can<br />
provoke severe l<strong>and</strong><br />
degradation (left) <strong>and</strong><br />
s<strong>and</strong> deposits on<br />
young seedlings<br />
can affect crop<br />
establishment (right)<br />
21
cover. In regions where long dry periods<br />
associated with strong seasonal winds<br />
occur regularly, wind erosion usually is a<br />
serious problem, as the vegetative cover of<br />
the l<strong>and</strong> does not sufficiently protect the<br />
soil, <strong>and</strong> the soil surface is disturbed due to<br />
inappropriate management practices.<br />
At the southern fringe of the Sahara Desert,<br />
a special dry <strong>and</strong> hot wind, locally termed<br />
Harmattan, occurs. These Northeasterly or<br />
Easterly winds normally blow in the winter<br />
season under a high atmospheric pressure<br />
system. When the wind force of Harmattan<br />
is beyond the threshold value, s<strong>and</strong> particles<br />
<strong>and</strong> dust particles will be blown away<br />
from the l<strong>and</strong> surface <strong>and</strong> transported for<br />
several hundreds kilometres to the Atlantic<br />
Ocean.<br />
In Northwest India, the convection s<strong>and</strong>dust<br />
storm that occurs in the season<br />
preceding the monsoon is named Andhi. It<br />
is called Haboob in Africa <strong>and</strong> Arabic countries.<br />
It is titled “phantom” or “devil” in<br />
some regions.<br />
In general, two indicators, wind velocity <strong>and</strong><br />
visibility, are adopted to classify the grade<br />
of intensity of s<strong>and</strong>-dust storms. For<br />
instance, the s<strong>and</strong>-dust storms occurring in<br />
Northwest India are classified into three<br />
grades. Firstly, the feeble s<strong>and</strong>-dust storm<br />
develops when wind velocity is at force 6<br />
(Beaufort) <strong>and</strong> visibility varies between 500-<br />
1,000 m. The secondary strong s<strong>and</strong>-dust<br />
storm will occur when wind velocity is at<br />
force 8 <strong>and</strong> visibility varies between 200-500<br />
m. Strong s<strong>and</strong>-dust storms will take place<br />
when wind velocity is at force 9 <strong>and</strong> visibility<br />
is
Four definitions of the dust phenomenon<br />
are used by the Australian Bureau of<br />
Meteorology, which conforms to the<br />
worldwide st<strong>and</strong>ards of the <strong>WMO</strong>. SYNOP<br />
present weather [WW] codes are included:<br />
1. Dust storms (SYNOP WW code: 09) are<br />
the result of turbulent winds raising<br />
large quantities of dust into the air <strong>and</strong><br />
reducing visibility to less than 1,000 m.<br />
2. Blowing dust (SYNOP WW code: 07) is<br />
raised by winds to moderate heights<br />
above the ground reducing visibility at<br />
eye level (1.8 m), but not to less than<br />
1,000 m.<br />
3. Dust haze (SYNOP WW code: 06) is<br />
produced by dust particles in<br />
suspended transport which have been<br />
raised from the ground by a dust storm<br />
prior to the time of observation.<br />
4. Dust swirls (or dust devils) (SYNOP WW<br />
code: 08) are whirling columns of dust<br />
moving with the wind <strong>and</strong> usually less<br />
than 30 m high (but may extend to 300<br />
m or more). They usually dissipate after<br />
travelling a short distance.<br />
There have been several efforts to integrate<br />
all these wind erosion factors into a<br />
computer model. One such effort is the<br />
Wind Erosion Prediction System (WEPS)<br />
which is a process-based, daily time-step<br />
model that predicts soil erosion by simulation<br />
of the fundamental processes<br />
controlling wind erosion. WEPS can calculate<br />
soil movement, estimate plant damage,<br />
<strong>and</strong> predict PM-10 emissions when wind<br />
speeds exceed the erosion threshold. It also<br />
provides users with spatial information<br />
regarding soil flux, deposition, <strong>and</strong> loss<br />
from specific regions of a field over time.<br />
The structure of WEPS is modular <strong>and</strong><br />
consists of seven submodels <strong>and</strong> four databases.<br />
Most of the WEPS submodels use<br />
daily weather as the natural driving force<br />
for the physical processes that change field<br />
conditions. The other submodels focus on<br />
hydrology including the changes in temperature<br />
<strong>and</strong> water status of the soil; soil<br />
properties; growth of crop plants; crop<br />
plant decomposition; typical management<br />
practices such as tillage, planting, harvesting,<br />
<strong>and</strong> irrigation; <strong>and</strong> finally, the power of<br />
the wind on a subhourly basis.<br />
Climatic implications of dust storms<br />
The very fine fraction of soil-derived dust<br />
(Figure 13) has significant forcing effects on<br />
the radiative budget. Dust particles are<br />
thought to exert a radiative influence on<br />
climate directly through reflection <strong>and</strong><br />
absorption of solar radiation <strong>and</strong> indirectly<br />
through modifying the optical properties<br />
<strong>and</strong> longevity of clouds. Depending on their<br />
properties <strong>and</strong> in what part of the atmosphere<br />
they are found, dust particles can<br />
reflect sunlight back into space <strong>and</strong> cause<br />
cooling in two ways. Directly, they reflect<br />
sunlight back into space, thus reducing the<br />
amount of energy reaching the surface.<br />
threshold is exceeded <strong>and</strong> thus the<br />
frequency of erosion events.<br />
Figure 13. Soil derived<br />
dust can have significant<br />
forcing effects on<br />
the radiative budget.<br />
23
MECHANICS OF SAND AND DUST STORMS<br />
Wind erosion is possible when the wind<br />
velocity at the soil surface exceeds the<br />
threshold velocity required to move the<br />
least stable soil particle. The detached<br />
particle may move a few millimetres<br />
before finding a more protected site on<br />
the l<strong>and</strong>scape. The wind velocity required<br />
to move this least stable particle is called<br />
the static threshold. If the wind velocity<br />
increases, soil movement begins <strong>and</strong> if<br />
the velocity is sufficient, soil movement is<br />
sustained. This velocity is called the<br />
dynamic threshold.<br />
When the wind force reaches the<br />
threshold value a number of particles will<br />
begin to vibrate, Increasing the wind<br />
speed still further, <strong>and</strong> a number of<br />
particles will be ejected from the surface<br />
into the airflow. When these injected<br />
particles impact back on the surface,<br />
more particles are ejected, thus starting a<br />
chain reaction. Once ejected, these<br />
particles move in one of three modes of<br />
transport depending on particle size,<br />
shape <strong>and</strong> density of the particle. These<br />
three modes are designated suspension,<br />
saltation <strong>and</strong> creep. Their size <strong>and</strong><br />
density determine movement pattern of<br />
s<strong>and</strong>-dust particles.<br />
above 0.5 mm) are transported in the<br />
creep mode. These particles are too large<br />
to be ejected from the surface <strong>and</strong> are<br />
therefore rolled along by the wind <strong>and</strong><br />
impacting particles. Due to the nature of<br />
this mode, the heights carried are rarely<br />
more than 30 cm <strong>and</strong> the distance<br />
travelled rarely exceeds a few metres.<br />
During a storm, creep can move particles<br />
over distances from a few centimetres to<br />
several metres, saltating particles travel<br />
from a few metres to a few hundred<br />
metres, <strong>and</strong> suspension transport ranges<br />
from several tens of metres to thous<strong>and</strong>s<br />
of kilometres. In the s<strong>and</strong>-dust wall, the<br />
uplifting force produced by the rising air<br />
current is powerful. The s<strong>and</strong> grains at<br />
the lower stratum of the s<strong>and</strong>-dust wall<br />
are coarse particles, the s<strong>and</strong> particles in<br />
the middle stratum are the next in size<br />
<strong>and</strong> those in the upper stratum are<br />
mainly suspension dusts.<br />
S<strong>and</strong> particles, transported by saltation<br />
<strong>and</strong> by creep will accumulate to form new<br />
s<strong>and</strong> dunes when they are blown out,<br />
graded <strong>and</strong> transported for a distance.<br />
The suspension mode involves dust<br />
particles of less than 0.1 mm in diameter<br />
<strong>and</strong> clay particles of 0.002 mm in<br />
diameter i.e. small in size <strong>and</strong> light in<br />
density. These fine dust particles may be<br />
transported at altitudes of up to 6 km <strong>and</strong><br />
move over distances of up to 6,000 km.<br />
Saltating particles (i.e. those between<br />
0.01-0.5 mm in diameter) leave the<br />
surface, but are too large to be<br />
suspended. The remaining particles (i.e.<br />
24
Indirectly, they act as condensation nuclei,<br />
resulting in cloud formation. Clouds act as<br />
an “atmospheric blanket,” trapping longwave<br />
radiation within the atmosphere that<br />
is emitted from the Earth. Thus, dust storms<br />
have local, national <strong>and</strong> international implications<br />
concerning global warming.<br />
Climatic changes in turn can modify the<br />
location <strong>and</strong> strength of dust sources.<br />
Wildfires, l<strong>and</strong> degradation <strong>and</strong><br />
atmospheric emissions<br />
Uncontrolled wildfires occur in all vegetation<br />
zones of the world. It is estimated that<br />
fires annually affect 1,015 million hectares<br />
(m ha) of boreal <strong>and</strong> temperate forest <strong>and</strong><br />
other l<strong>and</strong>s, 2,040 m ha of tropical rain<br />
forests due to forest conversion activities<br />
<strong>and</strong> escaped agricultural fires, <strong>and</strong> up to 500<br />
m ha of tropical <strong>and</strong> subtropical savannas,<br />
woodl<strong>and</strong>s, <strong>and</strong> open forests. The extent of<br />
the soil organic carbon pool doubles that<br />
present in the atmosphere <strong>and</strong> is about two<br />
to three times greater than that accumulated<br />
in living organisms in all the Earth's<br />
terrestrial ecosystems. In such a scenario,<br />
one of the several ecological <strong>and</strong> environmental<br />
impacts of fires is that they are a<br />
significant source of greenhouse gases<br />
responsible for global warming.<br />
Globally, biomass burning (Figure 14), which<br />
includes wildfires, is estimated to produce<br />
40 per cent of the carbon dioxide, 32 per cent<br />
of the carbon monoxide, 20 per cent of the<br />
particulates, <strong>and</strong> 50 per cent of the highly<br />
carcinogenic poly-aromatic hydrocarbons<br />
produced by all sources. Current approaches<br />
for estimating global emissions are limited<br />
by accurate information on area burned <strong>and</strong><br />
fuel available for burning.<br />
Emissions from fires are considerable <strong>and</strong><br />
contribute significantly to gross global<br />
emissions of trace gases <strong>and</strong> particulates<br />
from all sources to the atmosphere. Natural<br />
emissions are responsible for a major<br />
Figure 14. Fires are a significant source of greenhouse<br />
gasses<br />
portion of the compounds, including nonmethane<br />
volatile organic compounds<br />
(NMVOC), carbon monoxide (CO) <strong>and</strong> nitric<br />
oxide (NO), which determine tropospheric<br />
oxidant concentrations. The total NMVOC<br />
flux is estimated to be about 84 × 10 12 g of<br />
carbon (Tg C) which is comprised primarily<br />
of isoprene (35 per cent), 19 other terpenoid<br />
compounds (25 per cent) <strong>and</strong> 17 nonterpenoid<br />
compounds (40 per cent).<br />
The influence of fire on soil characteristics<br />
(soil-water content, soil compaction, soil<br />
temperature, infiltration ability, soil properties<br />
especially organic matter, pH,<br />
exchangeable Ca, Mg, K, Na <strong>and</strong> extractable<br />
P) of a semi-arid southern African rangel<strong>and</strong><br />
was quantified over two growing seasons<br />
(2000/01-2001/02) following an accidental<br />
fire. The decrease in basal cover due to fire<br />
(head fires) exposed the soil more to the<br />
natural elements <strong>and</strong> therefore to higher<br />
soil temperatures <strong>and</strong> soil compaction in<br />
turn leading to lower soil-water content <strong>and</strong><br />
a decline in soil infiltrability.<br />
<strong>Climate</strong> change <strong>and</strong> l<strong>and</strong> degradation<br />
Human activities — primarily burning of<br />
fossil fuels <strong>and</strong> changes in l<strong>and</strong> cover — are<br />
modifying the concentration of atmospheric<br />
constituents or properties of the Earth's<br />
surface that absorb or scatter radiant energy.<br />
25
Figure 15. Comparing<br />
simulations of the<br />
Earth’s annual global<br />
mean surface temperatures<br />
with<br />
measurements can<br />
provide insight into<br />
the underlying causes<br />
of major changes;<br />
adding the calculated<br />
effects of humaninduced<br />
<strong>and</strong> natural<br />
forcings mimics actual<br />
observations<br />
(IPCC, 2001)<br />
In particular, increases in the concentrations<br />
of greenhouse gases (GHGs) <strong>and</strong> aerosols<br />
are strongly implicated as contributors to<br />
climatic changes observed during the 20th<br />
century (Figure 15), <strong>and</strong> are expected to<br />
contribute to further changes in climate in<br />
the 21st century <strong>and</strong> beyond. These changes<br />
in atmospheric composition are likely to<br />
alter temperatures precipitation patterns,<br />
sea level, extreme events, <strong>and</strong> other aspects<br />
of climate on which the natural environment<br />
<strong>and</strong> human systems depend.<br />
According to the Intergovernmental Panel<br />
on <strong>Climate</strong> Change (IPCC), established by<br />
<strong>WMO</strong> <strong>and</strong> UNEP, ecosystems are subject to<br />
many pressures (e.g. l<strong>and</strong>-use change,<br />
resource dem<strong>and</strong>s, population changes);<br />
their extent <strong>and</strong> pattern of distribution is<br />
changing, <strong>and</strong> l<strong>and</strong>scapes are becoming<br />
more fragmented. <strong>Climate</strong> change constitutes<br />
an additional pressure that could<br />
change or endanger ecosystems <strong>and</strong> the<br />
many goods <strong>and</strong> services they provide. Soil<br />
properties <strong>and</strong> processes — including<br />
organic matter decomposition, leaching,<br />
<strong>and</strong> soil water regimes — will be influenced<br />
by temperature increase. Soil erosion <strong>and</strong><br />
degradation are likely to aggravate the<br />
detrimental effects of a rise in air temperature<br />
on crop yields. <strong>Climate</strong> change may<br />
increase erosion in some regions, through<br />
heavy rainfall <strong>and</strong> through increased wind<br />
speed.<br />
CO 2 -induced climate change <strong>and</strong> l<strong>and</strong><br />
degradation remain inextricably linked<br />
because of feedbacks between l<strong>and</strong> degradation<br />
<strong>and</strong> precipitation. <strong>Climate</strong> change<br />
might exacerbate l<strong>and</strong> degradation through<br />
alteration of spatial <strong>and</strong> temporal patterns<br />
in temperature, rainfall, solar radiation, <strong>and</strong><br />
winds. Several climate models suggest that<br />
future global warming may reduce soil<br />
moisture over large areas of semi-arid<br />
grassl<strong>and</strong> in North America <strong>and</strong> Asia. This<br />
climate change is likely to exacerbate the<br />
degradation of semi-arid l<strong>and</strong>s that will be<br />
caused by rapidly exp<strong>and</strong>ing human populations<br />
during the next decade. It is<br />
predicted that there will be a 17 per cent<br />
increase in the world area of desert l<strong>and</strong> due<br />
to the climate change expected, with a<br />
doubling of atmospheric CO 2 content.<br />
Water resources are inextricably linked to<br />
climate, so the prospect of global climate<br />
change has serious implications for water<br />
resources <strong>and</strong> regional development.<br />
<strong>Climate</strong> change — especially changes in<br />
climate variability through droughts <strong>and</strong><br />
flooding — will make addressing these<br />
problems more complex. The greatest<br />
impact will continue to be felt by the poor,<br />
who have the most limited access to water<br />
resources. The impact of changes in precipitation<br />
<strong>and</strong> enhanced evaporation could<br />
have profound effects in some lakes <strong>and</strong><br />
reservoirs. Studies show that, in the paleoclimate<br />
of Africa <strong>and</strong> in the present climate,<br />
lakes <strong>and</strong> reservoirs respond to climate variability<br />
via pronounced changes in storage,<br />
leading to complete drying up in many<br />
cases. Furthermore, these studies also show<br />
that under the present climate regime<br />
several large lakes <strong>and</strong> wetl<strong>and</strong>s show a<br />
Temperature anomalies (°C)<br />
1.0<br />
0.5<br />
0.0<br />
-0.5<br />
Natural<br />
model<br />
observations<br />
-1.0<br />
1850 1900 1950 2000<br />
Temperature anomalies (°C)<br />
1.0<br />
0.5<br />
0.0<br />
-0.5<br />
Anthropogenic<br />
model<br />
observations<br />
-1.0<br />
1850 1900 1950 2000<br />
Temperature anomalies (°C)<br />
1.0<br />
0.5<br />
0.0<br />
-0.5<br />
All forcings<br />
model<br />
observations<br />
-1.0<br />
1850 1900 1950 2000<br />
26
delicate balance between inflow <strong>and</strong><br />
outflow, such that evaporative increases of<br />
40 per cent, for example, could result in<br />
much reduced outflow.<br />
The frequency of episodic transport by wind<br />
<strong>and</strong> water from arid l<strong>and</strong>s is also likely to<br />
increase in response to anticipated changes<br />
in global climate. Lower soil moisture <strong>and</strong><br />
sparser vegetative cover would leave soil<br />
more susceptible to wind erosion.<br />
Reduction of organic matter inputs <strong>and</strong><br />
increased oxidation of SOM could reduce<br />
the long-term water-retention capacity of<br />
soil, exacerbating desertification. Moreover,<br />
increased wind erosion increases windblown<br />
mineral dust, which may increase<br />
absorption of radiation in the atmosphere.<br />
Carbon sequestration to mitigate climate<br />
change <strong>and</strong> combat l<strong>and</strong> degradation<br />
The soil organic carbon (SOC) pool to 1m<br />
depth ranges from 30 tons ha -1 in the arid<br />
climates to 800 tons ha -1 in organic soils in<br />
cold regions. Conversion of natural to agricultural<br />
ecosystems causes depletion of the<br />
SOC pool by as much as 60 per cent in soils<br />
of temperate regions <strong>and</strong> 75 per cent or<br />
more in the cultivated soils of the tropics.<br />
The depletion is exacerbated when the<br />
output of carbon (C) exceeds the input <strong>and</strong><br />
when soil degradation is severe.<br />
Carbon sequestration implies transferring<br />
atmospheric CO 2 into long-lived pools <strong>and</strong><br />
storing it securely so it is not immediately<br />
re-emitted. Thus, soil C sequestration<br />
means increasing SOC <strong>and</strong> soil inorganic<br />
carbon stocks through judicious l<strong>and</strong> use<br />
<strong>and</strong> recommended management practices.<br />
Some of these practices include mulch<br />
farming, conservation tillage, agroforestry<br />
<strong>and</strong> diverse cropping systems, cover crops<br />
<strong>and</strong> integrated nutrient management,<br />
including the use of manure, compost,<br />
biosolids, improved grazing, <strong>and</strong> forest<br />
management.<br />
The potential carbon sink capacity of<br />
managed ecosystems approximately equals<br />
the cumulative historic C loss estimated at<br />
55 to 78 gigatons (Gt). Offsetting fossil-fuel<br />
emissions by achievable SOC potential<br />
provides multiple biophysical <strong>and</strong> societal<br />
benefits. An increase of 1 ton of soil carbon<br />
of degraded cropl<strong>and</strong> soils may increase<br />
crop yield by 20 to 40 kg ha -1 for wheat, 10<br />
to 20 kg ha -1 for maize, <strong>and</strong> 0.5 to 1 kg ha -1<br />
for cowpeas, <strong>and</strong> could enhance world food<br />
security.<br />
Underst<strong>and</strong>ing the interactions between<br />
climate <strong>and</strong> l<strong>and</strong> degradation - role of<br />
<strong>WMO</strong><br />
<strong>WMO</strong> is the United Nations specialized<br />
agency responsible for meteorology <strong>and</strong><br />
operational hydrology. <strong>WMO</strong> provides<br />
support to the National Meteorological <strong>and</strong><br />
Hydrological Services (NMHSs) of its 187<br />
Member States <strong>and</strong> Territories in their<br />
respective missions of observing <strong>and</strong><br />
underst<strong>and</strong>ing weather <strong>and</strong> climate <strong>and</strong><br />
providing meteorological <strong>and</strong> related services<br />
in support of national needs. These<br />
needs especially relate to protection of life<br />
<strong>and</strong> property, safeguarding the environment<br />
<strong>and</strong> contributing to sustainable<br />
development.<br />
The scientific programmes of <strong>WMO</strong> have<br />
been vital in exp<strong>and</strong>ing knowledge of the<br />
climate system. The systematic observations<br />
(Figure 16) carried out using<br />
st<strong>and</strong>ardized methods have provided worldwide<br />
data for analysis, research <strong>and</strong><br />
modeling of the atmosphere <strong>and</strong> its changing<br />
patterns of weather systems. <strong>WMO</strong><br />
coordinates a global network for the acquisition<br />
<strong>and</strong> exchange of observational data<br />
under the Global Observing System of its<br />
World Weather Watch Programme<br />
(Figure 17). The system comprises some<br />
10,000 stations on l<strong>and</strong>, 1,000 upper-air<br />
stations, 7,000 ships, some 3,000 aircraft<br />
providing over 150,000 observations daily<br />
27
10<br />
8<br />
6<br />
4<br />
2<br />
0<br />
Aug<br />
Sep<br />
Oct<br />
Nov<br />
AUTOMATIC<br />
STATION<br />
GEOSTATIONARY<br />
SATELLITE<br />
AIRCRAFT<br />
POLAR<br />
ORBITING<br />
SATELLITE<br />
surface <strong>and</strong> the cryosphere) <strong>and</strong> of climate<br />
variability <strong>and</strong> change.<br />
METEOROLOGICAL<br />
SATELLITE<br />
CENTRE<br />
SURFACE<br />
STATION<br />
NUMERICAL<br />
WEATHER FORECAST<br />
INTERPRETATION<br />
FORMULATION<br />
OF USER<br />
ORIENTED<br />
SPECIAL<br />
FORECASTS<br />
DISASTER<br />
PREVENTION<br />
ORGANIZATIONS<br />
INFORMATION<br />
MEDIA &<br />
GENERAL PUBLIC<br />
Figure 16. Basic<br />
systems of <strong>WMO</strong><br />
WEATHER<br />
SHIP<br />
AREA<br />
METEOROLOGICAL WATCH<br />
VERY SHORT<br />
RANGE<br />
FORECASTS<br />
NOWCASTS<br />
AND WARNINGS<br />
AGRICULTURE<br />
BUILDING<br />
TRANSPORT<br />
ENVIRONMENT<br />
& HEALTH<br />
OCEAN<br />
DATA<br />
BUOY<br />
SATELLITE<br />
GROUND<br />
STATION<br />
AUTOMATED DATA-EDITING<br />
AND SWITCHING SYSTEM<br />
CENTRAL<br />
COMPUTING<br />
NUMERICAL<br />
WEATHER<br />
PREDICTION<br />
RECREATION<br />
&<br />
TOURISM<br />
WATER<br />
RESOURCES<br />
WEATHER<br />
RADAR<br />
<strong>and</strong> a constellation of 16 meteorological,<br />
environmental, operational <strong>and</strong> research<br />
satellites (Figure 18). <strong>WMO</strong> also coordinates<br />
a network of three World Meteorological<br />
Centres, 35 Regional Specialized<br />
Meteorological Centres <strong>and</strong> 187 National<br />
Meteorological Centres. Specialized<br />
programmes of observations, including<br />
those for chemical constituents of the<br />
atmosphere <strong>and</strong> characteristics of the<br />
oceans <strong>and</strong> their circulations, have led to a<br />
better underst<strong>and</strong>ing of interactions<br />
between the domains of the climate system<br />
(the atmosphere, the oceans, the l<strong>and</strong><br />
10<br />
8<br />
6<br />
4<br />
2<br />
0<br />
Aug<br />
UPPER-AIR<br />
STATION<br />
ARCHIVES<br />
Sep<br />
Oct<br />
ELECTRICAL<br />
UTILITIES<br />
& ENERGY<br />
Nov<br />
CLIMATOLOGICAL<br />
DATA & ADVISORIES<br />
Specifically, <strong>WMO</strong> contributes to underst<strong>and</strong>ing<br />
the interactions between climate<br />
<strong>and</strong> l<strong>and</strong> degradation through dedicated<br />
observations of the climate system;<br />
improvements in the application of agrometeorological<br />
methods <strong>and</strong> the proper<br />
assessment <strong>and</strong> management of water<br />
resources; advances in climate science <strong>and</strong><br />
prediction; <strong>and</strong> promotion of capacity building<br />
in the application of meteorological <strong>and</strong><br />
hydrological data <strong>and</strong> information in<br />
drought preparedness <strong>and</strong> management. In<br />
this context, <strong>WMO</strong> will continue to address<br />
the issue of l<strong>and</strong> degradation through its<br />
Agricultural Meteorology Programme,<br />
Hydrology <strong>and</strong> Water Resources<br />
Programme, <strong>and</strong> other scientific <strong>and</strong> technical<br />
programmes by:<br />
(a)<br />
Advocating for enhanced observing<br />
systems at national, regional <strong>and</strong> international<br />
levels. <strong>WMO</strong> is committed to<br />
work with the Parties to the UNCCD to<br />
improve the observing systems for<br />
weather, climate <strong>and</strong> water resources in<br />
order to meet the needs of the<br />
Convention, <strong>and</strong> to assist developing<br />
countries to strengthen their participation<br />
in the collection <strong>and</strong> use of these<br />
observations to meet their commitments<br />
to the Convention. In this regard,<br />
it is quite relevant to examine the decisions<br />
of the Conference of Parties of the<br />
United Nations Framework Convention<br />
on <strong>Climate</strong> Change (UNFCCC) which<br />
address the issue of climate observing<br />
systems, <strong>and</strong> the regional workshop<br />
programme that has been developed<br />
<strong>and</strong> is being implemented in different<br />
parts of the world by the Global <strong>Climate</strong><br />
Observing System (GCOS) Secretariat<br />
co-sponsored by <strong>WMO</strong>.<br />
(b) Promoting effective early warning<br />
systems, which also serve as an essential<br />
<strong>and</strong> important alert mechanism for<br />
28
orbit<br />
combating l<strong>and</strong> degradation. As meteorological<br />
<strong>and</strong> hydrological hazards are<br />
linked with climate variability, regular<br />
assessments <strong>and</strong> authoritative statements<br />
on the interpretation <strong>and</strong><br />
applicability of observational data are<br />
needed for the study of climate variability<br />
<strong>and</strong> the implementation of a climate<br />
alert system to allow NMHSs to make<br />
early warnings on pending significant<br />
climate anomalies. Warnings of climaterelated<br />
disasters are becoming feasible<br />
from weeks to seasons in advance.<br />
<strong>WMO</strong>'s World <strong>Climate</strong> Programme will<br />
continue to issue routine statements on<br />
the state of El Niño or La Niña, which,<br />
through the NMHSs, can alert<br />
Governments to ensure preparedness<br />
against the impacts of El Niño-related<br />
anomalies, which can trigger various<br />
disasters. <strong>WMO</strong> played an active role in<br />
the activities of the ad hoc Panel on<br />
early warning systems established by<br />
the Committee on Science <strong>and</strong><br />
Technology (CST) of the UNCCD. High<br />
on the list of recommendations of the<br />
Panel is the need to undertake a critical<br />
analysis of the performance of early<br />
warning, monitoring <strong>and</strong> assessment<br />
systems; the improvement of methods<br />
for <strong>and</strong> approaches to the prediction of<br />
drought <strong>and</strong> monitoring of desertification;<br />
<strong>and</strong> the development of<br />
mechanisms to facilitate an exchange of<br />
information focusing in particular on<br />
national <strong>and</strong> subregional networks.<br />
<strong>WMO</strong>'s new major programme on<br />
Natural Disaster Prevention <strong>and</strong><br />
Mitigation will provide the focus for the<br />
Figure 17. Typical<br />
coverage of surface<br />
observations.<br />
Aqua<br />
QuickScat<br />
TRMM<br />
SUBSATELLITE<br />
POINT<br />
GOES-R<br />
(USA)<br />
75°W<br />
R & D orbit<br />
GEOSTATIONARY<br />
ORBIT<br />
850 km<br />
Polar<br />
FY-1/3 (China)<br />
METEOR 3M (Russian Federation)<br />
GOES-R<br />
(USA)<br />
135°W<br />
35 800 km<br />
Terra<br />
NPP<br />
Jason-1<br />
Okean series<br />
GMS-5/MTSAT-1R<br />
(Japan)<br />
140°E<br />
COMSAT-1<br />
(Republic of Korea)<br />
120°E<br />
ENVISAT/ERS-2<br />
METEOR 3M N1<br />
SPOT-5<br />
MSG<br />
(EUMETSAT)<br />
0°Longitude<br />
Other R & D<br />
oceanographic,<br />
l<strong>and</strong> use,<br />
atmospheric chemistry<br />
<strong>and</strong> hydrological missions<br />
METEOSAT<br />
(EUMETSAT)<br />
63°E<br />
NPOESS<br />
(USA)<br />
FY-2/4<br />
(China)<br />
105°E<br />
INSATs<br />
(India)<br />
GOMS 83°E<br />
(Russian Federation)<br />
76°E<br />
Metop<br />
(EUMETSAT)<br />
GPM<br />
ADEOS II<br />
GCOM<br />
Figure 18. Spacebased<br />
observing<br />
system<br />
29
Figure 19. A typical<br />
climate outlook<br />
produced by the<br />
<strong>WMO</strong>-supported IGAD<br />
<strong>Climate</strong> Prediction <strong>and</strong><br />
Applications Centre<br />
(ICPAC)<br />
(c)<br />
consolidation of its efforts in the area of<br />
early warnings <strong>and</strong> for taking new<br />
initiatives in this area in collaboration<br />
with other organizations.<br />
Further enhancing climate prediction<br />
capability through the <strong>Climate</strong> Variability<br />
(CLIVAR) project of the World <strong>Climate</strong><br />
Research Programme (WCRP). The<br />
prediction of El Niño <strong>and</strong> the associated<br />
impacts are becoming possible, with<br />
reasonable skill, up to a few seasons in<br />
advance. Related to this, <strong>WMO</strong> is broadening<br />
the implementation of the <strong>WMO</strong><br />
<strong>Climate</strong> Information <strong>and</strong> Prediction<br />
Services (CLIPS) project, which is<br />
designed to promote the use of climate<br />
information <strong>and</strong> prediction services,<br />
capacity building, multi-disciplinary<br />
research <strong>and</strong> the development of new<br />
applications. Consensus long-range forecasts<br />
on droughts, which were issued at<br />
several Regional <strong>Climate</strong> Outlook Fora,<br />
organized in different parts of the world<br />
with active support from <strong>WMO</strong>, provide<br />
good early warning information to<br />
national authorities (Figure 19).<br />
(d) Assessing vulnerability <strong>and</strong> analysing<br />
hazards by employing the knowledge of<br />
vulnerability at the local, national <strong>and</strong><br />
(e)<br />
regional levels, which is an important<br />
factor in evaluating the adequacy of<br />
early warnings. A good tool to assess<br />
these different vulnerabilities is the linkage<br />
between weather, climate <strong>and</strong><br />
disaster databases to the different type<br />
of meteorological or hydrological disasters.<br />
In this regard, a pilot project is<br />
ongoing in Chile linking climate with<br />
flood disaster databases with the<br />
support of <strong>WMO</strong> through the World<br />
<strong>Climate</strong> Programme, as part of the<br />
activities of the Inter-Agency Task Force<br />
for Disaster Reduction Working Groups<br />
on <strong>Climate</strong> <strong>and</strong> Disasters <strong>and</strong> on Risk<br />
Vulnerability <strong>and</strong> Impact Assessment.<br />
This is an important tool for risk<br />
communication among policy makers<br />
<strong>and</strong> communities. <strong>WMO</strong> will continue<br />
to assist in developing <strong>and</strong> managing<br />
the relevant climate databases through<br />
data rescue <strong>and</strong> climate database<br />
management projects.<br />
Implementing risk management applications<br />
to combat droughts <strong>and</strong><br />
mitigate floods. In this context, hazard<br />
mapping, suitable agroclimatic zoning<br />
<strong>and</strong> the establishment of partnerships<br />
are essential tools for l<strong>and</strong> use <strong>and</strong><br />
preparedness planning. Several expert<br />
teams established by the Commission<br />
for Agricultural Meteorology (CAgM) of<br />
<strong>WMO</strong> are examining these issues critically<br />
<strong>and</strong> are issuing guidance reports<br />
for the users. In the area of flood forecasting<br />
<strong>and</strong> management, <strong>WMO</strong>'s<br />
Hydrology <strong>and</strong> Water Resources<br />
Programme is implementing the<br />
Associated Programme for Flood<br />
Management (APFM) in collaboration<br />
with the Global Water Partnership, in<br />
the context of integrated water<br />
resources management. Several related<br />
projects are being developed in different<br />
parts of the world in order to<br />
provide guidance on the development<br />
of support systems for sustainable l<strong>and</strong><br />
management <strong>and</strong> agroclimatic zoning.<br />
30
Analytical tools for agroclimatic mapping<br />
In order to make quality assessments<br />
<strong>and</strong> decisions on the interactions<br />
between climate <strong>and</strong> such topics such<br />
as drought <strong>and</strong> desertification, natural<br />
disasters, deforestation, extreme events<br />
<strong>and</strong> for the assessment of their socioeconomic<br />
impacts, scientists need to<br />
analyse <strong>and</strong> integrate very different<br />
kinds of spatial <strong>and</strong> temporal data sets<br />
from many different disciplines. These<br />
disciplines range from the plant, crop,<br />
<strong>and</strong> soil sciences to meteorology with a<br />
broad range of knowledge <strong>and</strong><br />
techniques that have each developed<br />
over the past few decades. The data<br />
sets used can range from digitized areal<br />
maps of soil types, l<strong>and</strong> use, <strong>and</strong><br />
various remotely sensed data from<br />
satellites to data sets of point data of<br />
rainfall, temperature, <strong>and</strong> elevation.<br />
Agroclimatic mapping <strong>and</strong><br />
agroecological zoning are some<br />
methodologies that can be used to<br />
analyse these diverse data sets. Over<br />
the past decade, Geographic<br />
Information Systems (GIS) have been<br />
developed to aid in these kinds of<br />
analyses. GIS is a computer system<br />
designed to allow users to collect,<br />
manage, archive, analyse, <strong>and</strong><br />
manipulate large volumes of spatially<br />
referenced <strong>and</strong> associated attribute<br />
data. The data is referenced according<br />
to the geographic coordinates of its<br />
elements (latitude <strong>and</strong> longitude). It is<br />
useful to view GIS as a process rather<br />
than an object. GISs are frequently<br />
used in analysing remotely-sensed data<br />
from satellites.<br />
Efforts in adopting state-of-the-art tools<br />
<strong>and</strong> technologies such as remote<br />
sensing, GIS, ground measurements<br />
<strong>and</strong> modeling applications in<br />
generating combined agroclimatic<br />
maps already contribute to the<br />
development of sustainable <strong>and</strong> more<br />
efficient crop production systems in<br />
relation to local crops <strong>and</strong> human<br />
resources. Forecasts of vulnerability to<br />
climate variability <strong>and</strong> risk assessment<br />
are included in such analyses as<br />
important tools for farm management<br />
<strong>and</strong> decision taking. Research is<br />
underway in applying these<br />
methodologies for sustainable l<strong>and</strong><br />
management, biodiversity conservation<br />
<strong>and</strong> evaluation of the specific potentials<br />
of different agricultural realities.<br />
Environmentally sensitive areas to desertification in<br />
Sardinia (Montroni <strong>and</strong> Canu, 2005)<br />
31
(f)<br />
Contributing actively to the implementation<br />
of the UN system's International<br />
Strategy for Disaster Reduction (ISDR).<br />
It is to be noted that society's ability to<br />
cope with <strong>and</strong> adapt to, climate change<br />
will depend heavily on its ability to<br />
assess how <strong>and</strong> where weather <strong>and</strong><br />
climate patterns are likely to change, to<br />
predict the continuous fluctuations in<br />
risk <strong>and</strong> vulnerability to communities,<br />
<strong>and</strong> to develop adaptive strategies that<br />
will increase the community's resilience<br />
when the next potential disaster strikes.<br />
<strong>WMO</strong> leads the ISDR Working Group on<br />
<strong>Climate</strong> <strong>and</strong> Disasters.<br />
(g) Supporting the strengthening of the<br />
capabilities of the Parties <strong>and</strong> regional<br />
institutions with drought-related<br />
programmes <strong>and</strong> promoting collaboration<br />
with other institutions in drought<br />
<strong>and</strong> desertification-prone regions, with<br />
emphasis on Africa, Asia, Latin America<br />
<strong>and</strong> the Caribbean, <strong>and</strong> the northern<br />
Mediterranean region, which are all<br />
referred to in the Regional Annexes to<br />
the Convention. Examples of such institutions<br />
in Africa are the AGRHYMET<br />
Centre <strong>and</strong> the African Centre of<br />
Meteorological Applications for<br />
Development (ACMAD), both located in<br />
Niamey, Niger, <strong>and</strong> the <strong>WMO</strong>supported<br />
IGAD <strong>Climate</strong> Prediction <strong>and</strong><br />
Applications Centre (ICPAC) <strong>and</strong> the<br />
SACD Drought Monitoring Centres<br />
(DMC) for Eastern <strong>and</strong> Southern Africa<br />
located in Nairobi, Kenya <strong>and</strong> Harare,<br />
Zimbabwe, respectively. In order to<br />
enhance capacity building in the development<br />
of National Action Plans within<br />
the framework of the Convention, <strong>WMO</strong><br />
organized Roving Seminars on the<br />
Application of Climatic Data for<br />
Desertification Control, Drought<br />
Preparedness <strong>and</strong> Management of<br />
Sustainable Agriculture in Beijing,<br />
China in May 2001, <strong>and</strong> in Antigua <strong>and</strong><br />
Barbuda in April 2004.<br />
Future perspectives<br />
The definition of l<strong>and</strong> degradation adopted<br />
by UNCCD assigns a major importance to<br />
contributing climatic factors, but there is no<br />
concerted effort at the global level to<br />
systematically monitor the impacts of different<br />
climatic factors on l<strong>and</strong> degradation in<br />
different regions <strong>and</strong> for different classes of<br />
l<strong>and</strong> degradation. Hence there is an urgent<br />
need to monitor the interactions between<br />
climate <strong>and</strong> l<strong>and</strong> degradation. To better<br />
underst<strong>and</strong> these interactions, it is also<br />
important to identify the sources <strong>and</strong> sinks<br />
of dryl<strong>and</strong> carbon, aerosols <strong>and</strong> trace gases<br />
in dryl<strong>and</strong>s. This can be effectively done<br />
through regional climate monitoring<br />
networks. Such networks could also help<br />
enhance the application of seasonal climate<br />
forecasting for more effective dryl<strong>and</strong><br />
management.<br />
There are serious gaps in the basic meteorological<br />
network <strong>and</strong> observational facilities<br />
in many areas, some of them in regions with<br />
severe l<strong>and</strong> degradation problems. The<br />
most serious single <strong>and</strong> geographically<br />
widespread shortcoming is the lack of information<br />
on rainfall intensity. <strong>WMO</strong> is taking<br />
steps to facilitate the development of early<br />
warning systems by organizing the development<br />
of suitable instruments <strong>and</strong> statistical<br />
processing. Furthermore, <strong>WMO</strong> is coordinating<br />
efforts on the part of its Members to<br />
further investigations of using data from<br />
meteorological satellites to supplement<br />
knowledge of meteorological conditions<br />
influencing l<strong>and</strong> degradation, especially<br />
over areas inadequately covered by groundlevel<br />
observations. <strong>WMO</strong> through its 187<br />
Members is pleased to be part of the effort<br />
to better underst<strong>and</strong> the role of climate in<br />
l<strong>and</strong> degradation <strong>and</strong> work with various<br />
national, regional <strong>and</strong> international organizations<br />
<strong>and</strong> civil society in combating <strong>and</strong><br />
arresting l<strong>and</strong> degradation.<br />
32
World Meteorological Organization<br />
For information about <strong>WMO</strong>, please contact:<br />
Communications <strong>and</strong> Public Affairs Office<br />
World Meteorological Organization<br />
7bis, avenue de la Paix - P.O. Box 2300 - CH 1211 Geneva 2 - Switzerl<strong>and</strong><br />
Tel.: (+41-22) 730 83 14 - 730 83 15 - Fax: (+41-22) 730 80 27<br />
E-mail: cpa@wmo.int - Website: www.wmo.int<br />
For more information, please contact:<br />
World <strong>Climate</strong> Programme Department<br />
World Meteorological Organization<br />
7bis, avenue de la Paix - P.O. Box 2300 - CH 1211 Geneva 2 - Switzerl<strong>and</strong><br />
Tel.: (+41-22) 730 83 80 - Fax: (+41-22) 730 80 42<br />
E-mail: agm@wmo.int - Website: http://www.wmo.int/web/wcp/agm/agmp.html<br />
soil conservation – l<strong>and</strong> management – flood forecasting – food security


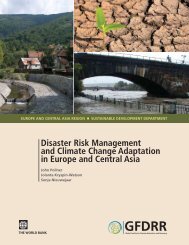
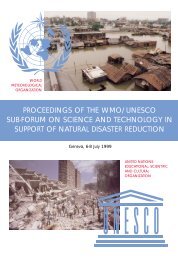

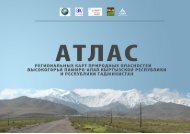
![View full document [PDF 988.55 KB] - PreventionWeb](https://img.yumpu.com/47733942/1/184x260/view-full-document-pdf-98855-kb-preventionweb.jpg?quality=85)
![View full document (in French) [PDF 4.96 MB] - PreventionWeb](https://img.yumpu.com/47223870/1/184x260/view-full-document-in-french-pdf-496-mb-preventionweb.jpg?quality=85)

![View full document [PDF 25.02 MB] - PreventionWeb](https://img.yumpu.com/44204570/1/190x234/view-full-document-pdf-2502-mb-preventionweb.jpg?quality=85)