WETLAND DETERMINATION DATA FORM ... - City of Pendleton
WETLAND DETERMINATION DATA FORM ... - City of Pendleton
WETLAND DETERMINATION DATA FORM ... - City of Pendleton

You also want an ePaper? Increase the reach of your titles
YUMPU automatically turns print PDFs into web optimized ePapers that Google loves.
<strong>WETLAND</strong> <strong>DETERMINATION</strong> <strong>DATA</strong> <strong>FORM</strong> – Arid West Region<br />
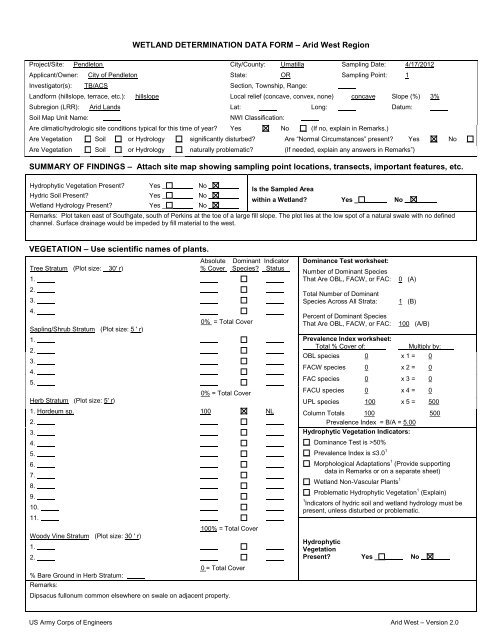
Project/Site: <strong>Pendleton</strong> <strong>City</strong>/County: Umatilla Sampling Date: 4/17/2012<br />
Applicant/Owner: <strong>City</strong> <strong>of</strong> <strong>Pendleton</strong> State: OR Sampling Point: 1<br />
Investigator(s): TB/ACS Section, Township, Range:<br />
Landform (hillslope, terrace, etc.): hillslope Local relief (concave, convex, none) concave Slope (%) 3%<br />
Subregion (LRR): Arid Lands Lat: Long: Datum:<br />
Soil Map Unit Name:<br />
NWI Classification:<br />
Are climatic/hydrologic site conditions typical for this time <strong>of</strong> year Yes No (If no, explain in Remarks.)<br />
Are Vegetation Soil or Hydrology significantly disturbed Are “Normal Circumstances” present Yes No<br />
Are Vegetation Soil or Hydrology naturally problematic (If needed, explain any answers in Remarks”)<br />
SUMMARY OF FINDINGS – Attach site map showing sampling point locations, transects, important features, etc.<br />
Hydrophytic Vegetation Present Yes No<br />
Hydric Soil Present Yes No<br />
Wetland Hydrology Present Yes No<br />
Is the Sampled Area<br />
within a Wetland Yes No<br />
Remarks: Plot taken east <strong>of</strong> Southgate, south <strong>of</strong> Perkins at the toe <strong>of</strong> a large fill slope. The plot lies at the low spot <strong>of</strong> a natural swale with no defined<br />
channel. Surface drainage would be impeded by fill material to the west.<br />
VEGETATION – Use scientific names <strong>of</strong> plants.<br />
Absolute Dominant Indicator<br />
Tree Stratum (Plot size: 30' r) % Cover Species Status<br />
1.<br />
2.<br />
3.<br />
4.<br />
0% = Total Cover<br />
Sapling/Shrub Stratum (Plot size: 5 ' r)<br />
1.<br />
2.<br />
3.<br />
4.<br />
5.<br />
0% = Total Cover<br />
Herb Stratum (Plot size: 5' r)<br />
1. Hordeum sp. 100 NL<br />
2.<br />
3.<br />
4.<br />
5.<br />
6.<br />
7.<br />
8.<br />
9.<br />
10.<br />
11.<br />
100% = Total Cover<br />
Woody Vine Stratum (Plot size: 30 ' r)<br />
1.<br />
2.<br />
0 = Total Cover<br />
% Bare Ground in Herb Stratum:<br />
Remarks:<br />
Dipsacus fullonum common elsewhere on swale on adjacent property.<br />
Dominance Test worksheet:<br />
Number <strong>of</strong> Dominant Species<br />
That Are OBL, FACW, or FAC:<br />
Total Number <strong>of</strong> Dominant<br />
Species Across All Strata:<br />
Percent <strong>of</strong> Dominant Species<br />
That Are OBL, FACW, or FAC:<br />
0 (A)<br />
1 (B)<br />
100 (A/B)<br />
Prevalence Index worksheet:<br />
Total % Cover <strong>of</strong>:<br />
Multiply by:<br />
OBL species 0 x 1 = 0<br />
FACW species 0 x 2 = 0<br />
FAC species 0 x 3 = 0<br />
FACU species 0 x 4 = 0<br />
UPL species 100 x 5 = 500<br />
Column Totals 100 500<br />
Prevalence Index = B/A = 5.00<br />
Hydrophytic Vegetation Indicators:<br />
Dominance Test is >50%<br />
Prevalence Index is ≤3.0 1<br />
Morphological Adaptations 1 (Provide supporting<br />
data in Remarks or on a separate sheet)<br />
Wetland Non-Vascular Plants 1<br />
Problematic Hydrophytic Vegetation 1 (Explain)<br />
1 Indicators <strong>of</strong> hydric soil and wetland hydrology must be<br />
present, unless disturbed or problematic.<br />
Hydrophytic<br />
Vegetation<br />
Present Yes No<br />
US Army Corps <strong>of</strong> Engineers Arid West – Version 2.0
SOIL Sampling Point: 1<br />
Pr<strong>of</strong>ile Description: (Describe to the depth needed to document the indicator or confirm the absence <strong>of</strong> indicators.)<br />
Depth Matrix Redox Features<br />
(inches) Color (moist) % Color (moist) % Type 1 Loc 2 Texture Remarks<br />
0-20 10YR 4/2+ 100 fine sandy loam<br />
1 Type: C=Concentration, D=Depletion, RM=Reduced Matrix, CS=Covered or Coated Sand Grains.<br />
2 Location: PL=Pore Lining, M=Matrix.<br />
Hydric Soil Indicators: (Applicable to all LRRs, unless otherwise noted.) Indicators for Problematic Hydric Soils 3 :<br />
Histosol (A1) Sandy Redox (S5) 1 cm Muck (A9) (LRR D)<br />
Histic Epipedon (A2) Stripped Matrix (S6) 2 cm Muck (A10)<br />
Black Histic (A3) Loamy Mucky Mineral (F1) (except MLRA 1) Reduced Vertic (F18)<br />
Hydrogen Sulfide (A4) Loamy Gleyed Matrix (F2) Red Parent Material (TF2)<br />
Stratified Layers (A5) (LRR C) Depleted Matrix (F3) Other (Explain in Remarks)<br />
1 cm Muck (A9) (LRR D) Redox Dark Surface (F6)<br />
Depleted Below Dark Surface (A11) Depleted Dark Surface (F7)<br />
Thick Dark Surface (A12)<br />
Redox Depressions (F8)<br />
3 Indicators <strong>of</strong> hydrophytic vegetation and<br />
Sandy Mucky Mineral (S1) Vernal Pools (F9) wetland hydrology must be present,<br />
Sandy Gleyed Matrix (S4)<br />
unless disturbed or problematic.<br />
Restrictive Layer (if present):<br />
Type:<br />
Depth (inches): Hydric Soil Present Yes No<br />
Remarks:<br />
Edge <strong>of</strong> disturbed area. Soil at plot is not fill material but some concrete is present at the surface in the plot and elsewhere near the toe <strong>of</strong> slope.<br />
Uniform soil color, texture throughout pr<strong>of</strong>ile.<br />
HYDROLOGY<br />
Wetland Hydrology Indicators:<br />
Primary Indicators (minimum <strong>of</strong> one required; check all that apply)<br />
Secondary Indicators (2 or more required)<br />
Surface Water (A1) Salt Crust (B11) Water Marks (B1) (Riverine)<br />
High Water Table (A2) Biotic Crust (B12) Sediment Deposits (B2) (Riverine)<br />
Saturation (A3) Aquatic Invertebrates (B13) Drift Deposits (B3) (Riverine)<br />
Water Marks (B1) (Nonriverine) Hydrogen Sulfide Odor (C1) Drainage Patterns (B10)<br />
Sediment Deposits (B2) (Nonriverine) Oxidized Rhizospheres along Living Roots (C3) Dry-Season Water Table (C2)<br />
Drift Deposits (B3) (Nonriverine) Presence <strong>of</strong> Reduced Iron (C4) Crayfish Burrows (C8)<br />
Surface Soil Cracks (B6) Recent Iron Reduction in Tilled Soils (C6) Saturation Visible on Aerial Imagery (C9)<br />
Inundation Visible on Aerial Imagery (B7) Thin Muck Surface (C7) Shallow Aquitard (D3)<br />
Water-Stained Leaves (B9) Other (Explain in Remarks) FAC-Neutral Test (D5)<br />
Field Observations:<br />
Surface Water Present Yes No Depth (inches):<br />
Water Table Present Yes No Depth (inches):<br />
Saturation Present Yes No Depth (inches):<br />
Wetland Hydrology Present Yes No<br />
(includes capillary fringe)<br />
Describe Recorded Data (stream gauge, monitoring well, aerial photos, previous inspections), if available:<br />
Remarks:<br />
No surface or subsurface indicators <strong>of</strong> saturation, surface flow, or ponding.<br />
US Army Corps <strong>of</strong> Engineers Arid West – Version 2.0
<strong>WETLAND</strong> <strong>DETERMINATION</strong> <strong>DATA</strong> <strong>FORM</strong> – Arid West Region<br />
Project/Site: <strong>Pendleton</strong> <strong>City</strong>/County: Umatilla Sampling Date: 4/17/2012<br />
Applicant/Owner: <strong>City</strong> <strong>of</strong> <strong>Pendleton</strong> State: OR Sampling Point: 2<br />
Investigator(s): TB/ACS Section, Township, Range:<br />
Landform (hillslope, terrace, etc.): terrace Local relief (concave, convex, none) none Slope (%) 3%<br />
Subregion (LRR): Arid Lands Lat: Long: Datum:<br />
Soil Map Unit Name: Hermiston silt loam, 0-3% NWI Classification:<br />
Are climatic/hydrologic site conditions typical for this time <strong>of</strong> year Yes No (If no, explain in Remarks.)<br />
Are Vegetation Soil or Hydrology significantly disturbed Are “Normal Circumstances” present Yes No<br />
Are Vegetation Soil or Hydrology naturally problematic (If needed, explain any answers in Remarks”)<br />
SUMMARY OF FINDINGS – Attach site map showing sampling point locations, transects, important features, etc.<br />
Hydrophytic Vegetation Present Yes No<br />
Hydric Soil Present Yes No<br />
Wetland Hydrology Present Yes No<br />
Is the Sampled Area<br />
within a Wetland Yes No<br />
Remarks: Tutuilla Creek is fully contained within bed and banks with no 2-year floodplain. Banks are high and vertical with no adjacent wetland. At this<br />
location, the channel is strongly trapezoidal with very steep sideslopes. This plot was taken within a Water <strong>of</strong> the State. Plot taken between Tutuilla Road<br />
and Highway 84, west <strong>of</strong> Marshall.<br />
VEGETATION – Use scientific names <strong>of</strong> plants.<br />
Absolute Dominant Indicator<br />
Tree Stratum (Plot size: 30' r) % Cover Species Status<br />
1.<br />
2.<br />
3.<br />
4.<br />
0% = Total Cover<br />
Sapling/Shrub Stratum (Plot size: 5' r)<br />
1.<br />
2.<br />
3.<br />
4.<br />
5.<br />
0% = Total Cover<br />
Herb Stratum (Plot size: 5' r)<br />
1. Phalaris arundinacea 100 FACW<br />
2. Conium maculatum T FACW<br />
3.<br />
4.<br />
5.<br />
6.<br />
7.<br />
8.<br />
9.<br />
10.<br />
11.<br />
100% = Total Cover<br />
Woody Vine Stratum (Plot size: 30' r)<br />
1.<br />
2.<br />
0 = Total Cover<br />
% Bare Ground in Herb Stratum:<br />
Dominance Test worksheet:<br />
Number <strong>of</strong> Dominant Species<br />
That Are OBL, FACW, or FAC:<br />
Total Number <strong>of</strong> Dominant<br />
Species Across All Strata:<br />
Percent <strong>of</strong> Dominant Species<br />
That Are OBL, FACW, or FAC:<br />
1 (A)<br />
1 (B)<br />
100 (A/B)<br />
Prevalence Index worksheet:<br />
Total % Cover <strong>of</strong>:<br />
Multiply by:<br />
OBL species x 1 =<br />
FACW species x 2 =<br />
FAC species x 3 =<br />
FACU species x 4 =<br />
UPL species x 5 =<br />
Column Totals<br />
Prevalence Index = B/A =<br />
Hydrophytic Vegetation Indicators:<br />
Dominance Test is >50%<br />
Prevalence Index is ≤3.0 1<br />
Morphological Adaptations 1 (Provide supporting<br />
data in Remarks or on a separate sheet)<br />
Wetland Non-Vascular Plants 1<br />
Problematic Hydrophytic Vegetation 1 (Explain)<br />
1 Indicators <strong>of</strong> hydric soil and wetland hydrology must be<br />
present, unless disturbed or problematic.<br />
Hydrophytic<br />
Vegetation<br />
Present Yes No<br />
US Army Corps <strong>of</strong> Engineers Arid West – Version 2.0
Remarks:<br />
Plot taken in Phalaris growing on channel sideslope.<br />
US Army Corps <strong>of</strong> Engineers Arid West – Version 2.0
SOIL Sampling Point: 2<br />
Pr<strong>of</strong>ile Description: (Describe to the depth needed to document the indicator or confirm the absence <strong>of</strong> indicators.)<br />
Depth Matrix Redox Features<br />
(inches) Color (moist) % Color (moist) % Type 1 Loc 2 Texture Remarks<br />
1 Type: C=Concentration, D=Depletion, RM=Reduced Matrix, CS=Covered or Coated Sand Grains.<br />
2 Location: PL=Pore Lining, M=Matrix.<br />
Hydric Soil Indicators: (Applicable to all LRRs, unless otherwise noted.) Indicators for Problematic Hydric Soils 3 :<br />
Histosol (A1) Sandy Redox (S5) 1 cm Muck (A9) (LRR D)<br />
Histic Epipedon (A2) Stripped Matrix (S6) 2 cm Muck (A10)<br />
Black Histic (A3) Loamy Mucky Mineral (F1) (except MLRA 1) Reduced Vertic (F18)<br />
Hydrogen Sulfide (A4) Loamy Gleyed Matrix (F2) Red Parent Material (TF2)<br />
Stratified Layers (A5) (LRR C) Depleted Matrix (F3) Other (Explain in Remarks)<br />
1 cm Muck (A9) (LRR D) Redox Dark Surface (F6)<br />
Depleted Below Dark Surface (A11) Depleted Dark Surface (F7)<br />
Thick Dark Surface (A12)<br />
Redox Depressions (F8)<br />
3 Indicators <strong>of</strong> hydrophytic vegetation and<br />
Sandy Mucky Mineral (S1) Vernal Pools (F9) wetland hydrology must be present,<br />
Sandy Gleyed Matrix (S4)<br />
unless disturbed or problematic.<br />
Restrictive Layer (if present):<br />
Type:<br />
Depth (inches): Hydric Soil Present Yes No<br />
Remarks:<br />
Plot location is below edge <strong>of</strong> flowing water. No pit was dug, and soil is considered hydric by definition.<br />
HYDROLOGY<br />
Wetland Hydrology Indicators:<br />
Primary Indicators (minimum <strong>of</strong> one required; check all that apply)<br />
Secondary Indicators (2 or more required)<br />
Surface Water (A1) Salt Crust (B11) Water Marks (B1) (Riverine)<br />
High Water Table (A2) Biotic Crust (B12) Sediment Deposits (B2) (Riverine)<br />
Saturation (A3) Aquatic Invertebrates (B13) Drift Deposits (B3) (Riverine)<br />
Water Marks (B1) (Nonriverine) Hydrogen Sulfide Odor (C1) Drainage Patterns (B10)<br />
Sediment Deposits (B2) (Nonriverine) Oxidized Rhizospheres along Living Roots (C3) Dry-Season Water Table (C2)<br />
Drift Deposits (B3) (Nonriverine) Presence <strong>of</strong> Reduced Iron (C4) Crayfish Burrows (C8)<br />
Surface Soil Cracks (B6) Recent Iron Reduction in Tilled Soils (C6) Saturation Visible on Aerial Imagery (C9)<br />
Inundation Visible on Aerial Imagery (B7) Thin Muck Surface (C7) Shallow Aquitard (D3)<br />
Water-Stained Leaves (B9) Other (Explain in Remarks) FAC-Neutral Test (D5)<br />
Field Observations:<br />
Surface Water Present Yes No Depth (inches):did not measure<br />
Water Table Present Yes No Depth (inches):<br />
Saturation Present Yes No Depth (inches):<br />
Wetland Hydrology Present Yes No<br />
(includes capillary fringe)<br />
Describe Recorded Data (stream gauge, monitoring well, aerial photos, previous inspections), if available:<br />
Remarks:<br />
Local slumping and small bank failures are common along Tutuilla Creek. These areas create small benches <strong>of</strong> wetland below the Ordinary High<br />
Water Mark. With the high periodic peak flows associated with heavy rainfall and/or snowmelt run<strong>of</strong>f events, small size, and erodability <strong>of</strong> the soil,<br />
these small features are likely transitory and were therefore not individually mapped. We included plots <strong>of</strong> this and similar features to characterize the<br />
respective stream corridors.<br />
US Army Corps <strong>of</strong> Engineers Arid West – Version 2.0
<strong>WETLAND</strong> <strong>DETERMINATION</strong> <strong>DATA</strong> <strong>FORM</strong> – Arid West Region<br />
Project/Site: <strong>Pendleton</strong> <strong>City</strong>/County: Umatilla Sampling Date: 4/17/2012<br />
Applicant/Owner: <strong>City</strong> <strong>of</strong> <strong>Pendleton</strong> State: OR Sampling Point: 3<br />
Investigator(s): TB/ACS Section, Township, Range:<br />
Landform (hillslope, terrace, etc.): terrace Local relief (concave, convex, none) none Slope (%) flat<br />
Subregion (LRR): Arid Lands Lat: Long: Datum:<br />
Soil Map Unit Name:<br />
NWI Classification:<br />
Are climatic/hydrologic site conditions typical for this time <strong>of</strong> year Yes No (If no, explain in Remarks.)<br />
Are Vegetation Soil or Hydrology significantly disturbed Are “Normal Circumstances” present Yes No<br />
Are Vegetation Soil or Hydrology naturally problematic (If needed, explain any answers in Remarks”)<br />
SUMMARY OF FINDINGS – Attach site map showing sampling point locations, transects, important features, etc.<br />
Hydrophytic Vegetation Present Yes No<br />
Hydric Soil Present Yes No<br />
Wetland Hydrology Present Yes No<br />
Is the Sampled Area<br />
within a Wetland Yes No<br />
Remarks: Tutuilla Creek is highly dynamic with high flows and extensive slumping and erosion <strong>of</strong> the fine soils. There are numerous tiny wetlands<br />
throughout the creek below bankfull stage/2 year flood elevation. However, due to the small size and heavy flows they are likely to be transitory features;<br />
their presence, location, and extent will change from year to year in most cases. All are less than 0.5 acre; most are less than 0.05 acre. This plot<br />
represents upland conditions adjacent to Plot 2.<br />
VEGETATION – Use scientific names <strong>of</strong> plants.<br />
Absolute Dominant Indicator<br />
Tree Stratum (Plot size: 30' r) % Cover Species Status<br />
1. Elaeagnus angustifolia 60 FAC<br />
2.<br />
3.<br />
4.<br />
60% = Total Cover<br />
Sapling/Shrub Stratum (Plot size: 5' r)<br />
1.<br />
2.<br />
3.<br />
4.<br />
5.<br />
0% = Total Cover<br />
Herb Stratum (Plot size: 5' r)<br />
1. Hordeum sp. 95 NI/FACU<br />
2. Lactuca communis 3 FAC<br />
3. Poa bulbosa 2 NL<br />
4.<br />
5.<br />
6.<br />
7.<br />
8.<br />
9.<br />
10.<br />
11.<br />
100% = Total Cover<br />
Woody Vine Stratum (Plot size: 30' r)<br />
1.<br />
2.<br />
0 = Total Cover<br />
% Bare Ground in Herb Stratum: 0<br />
Dominance Test worksheet:<br />
Number <strong>of</strong> Dominant Species<br />
That Are OBL, FACW, or FAC:<br />
Total Number <strong>of</strong> Dominant<br />
Species Across All Strata:<br />
Percent <strong>of</strong> Dominant Species<br />
That Are OBL, FACW, or FAC:<br />
1 (A)<br />
2 (B)<br />
50 (A/B)<br />
Prevalence Index worksheet:<br />
Total % Cover <strong>of</strong>:<br />
Multiply by:<br />
OBL species 0 x 1 = 0<br />
FACW species 0 x 2 = 0<br />
FAC species 63 x 3 = 189<br />
FACU species 95 x 4 = 380<br />
UPL species 2 x 5 = 10<br />
Column Totals 160 579<br />
Prevalence Index = B/A = 3.62<br />
Hydrophytic Vegetation Indicators:<br />
Dominance Test is >50%<br />
Prevalence Index is ≤3.0 1<br />
Morphological Adaptations 1 (Provide supporting<br />
data in Remarks or on a separate sheet)<br />
Wetland Non-Vascular Plants 1<br />
Problematic Hydrophytic Vegetation 1 (Explain)<br />
1 Indicators <strong>of</strong> hydric soil and wetland hydrology must be<br />
present, unless disturbed or problematic.<br />
Hydrophytic<br />
Vegetation<br />
Present Yes No<br />
US Army Corps <strong>of</strong> Engineers Arid West – Version 2.0
Remarks:<br />
US Army Corps <strong>of</strong> Engineers Arid West – Version 2.0
SOIL Sampling Point: 3<br />
Pr<strong>of</strong>ile Description: (Describe to the depth needed to document the indicator or confirm the absence <strong>of</strong> indicators.)<br />
Depth Matrix Redox Features<br />
(inches) Color (moist) % Color (moist) % Type 1 Loc 2 Texture Remarks<br />
0-20 10YR 4/2-3 100 fine sandy loam<br />
1 Type: C=Concentration, D=Depletion, RM=Reduced Matrix, CS=Covered or Coated Sand Grains.<br />
2 Location: PL=Pore Lining, M=Matrix.<br />
Hydric Soil Indicators: (Applicable to all LRRs, unless otherwise noted.) Indicators for Problematic Hydric Soils 3 :<br />
Histosol (A1) Sandy Redox (S5) 1 cm Muck (A9) (LRR D)<br />
Histic Epipedon (A2) Stripped Matrix (S6) 2 cm Muck (A10)<br />
Black Histic (A3) Loamy Mucky Mineral (F1) (except MLRA 1) Reduced Vertic (F18)<br />
Hydrogen Sulfide (A4) Loamy Gleyed Matrix (F2) Red Parent Material (TF2)<br />
Stratified Layers (A5) (LRR C) Depleted Matrix (F3) Other (Explain in Remarks)<br />
1 cm Muck (A9) (LRR D) Redox Dark Surface (F6)<br />
Depleted Below Dark Surface (A11) Depleted Dark Surface (F7)<br />
Thick Dark Surface (A12)<br />
Redox Depressions (F8)<br />
3 Indicators <strong>of</strong> hydrophytic vegetation and<br />
Sandy Mucky Mineral (S1) Vernal Pools (F9) wetland hydrology must be present,<br />
Sandy Gleyed Matrix (S4)<br />
unless disturbed or problematic.<br />
Restrictive Layer (if present):<br />
Type:<br />
Depth (inches): Hydric Soil Present Yes No<br />
Remarks:<br />
Loose, almost powdery texture. Highly erodible, well drained.<br />
HYDROLOGY<br />
Wetland Hydrology Indicators:<br />
Primary Indicators (minimum <strong>of</strong> one required; check all that apply)<br />
Secondary Indicators (2 or more required)<br />
Surface Water (A1) Salt Crust (B11) Water Marks (B1) (Riverine)<br />
High Water Table (A2) Biotic Crust (B12) Sediment Deposits (B2) (Riverine)<br />
Saturation (A3) Aquatic Invertebrates (B13) Drift Deposits (B3) (Riverine)<br />
Water Marks (B1) (Nonriverine) Hydrogen Sulfide Odor (C1) Drainage Patterns (B10)<br />
Sediment Deposits (B2) (Nonriverine) Oxidized Rhizospheres along Living Roots (C3) Dry-Season Water Table (C2)<br />
Drift Deposits (B3) (Nonriverine) Presence <strong>of</strong> Reduced Iron (C4) Crayfish Burrows (C8)<br />
Surface Soil Cracks (B6) Recent Iron Reduction in Tilled Soils (C6) Saturation Visible on Aerial Imagery (C9)<br />
Inundation Visible on Aerial Imagery (B7) Thin Muck Surface (C7) Shallow Aquitard (D3)<br />
Water-Stained Leaves (B9) Other (Explain in Remarks) FAC-Neutral Test (D5)<br />
Field Observations:<br />
Surface Water Present Yes No Depth (inches):<br />
Water Table Present Yes No Depth (inches):<br />
Saturation Present Yes No Depth (inches):<br />
Wetland Hydrology Present Yes No<br />
(includes capillary fringe)<br />
Describe Recorded Data (stream gauge, monitoring well, aerial photos, previous inspections), if available:<br />
Remarks:<br />
Plot taken at top <strong>of</strong> bank just above upper extent <strong>of</strong> waterborne debris. Water is currently about 4 vertical feet below the plot elevation. Soil is dry at<br />
20 inches.<br />
US Army Corps <strong>of</strong> Engineers Arid West – Version 2.0
<strong>WETLAND</strong> <strong>DETERMINATION</strong> <strong>DATA</strong> <strong>FORM</strong> – Arid West Region<br />
Project/Site: <strong>Pendleton</strong> <strong>City</strong>/County: Umatilla Sampling Date: 4/17/2012<br />
Applicant/Owner: <strong>City</strong> <strong>of</strong> <strong>Pendleton</strong> State: OR Sampling Point: 4<br />
Investigator(s): TB/ACS Section, Township, Range:<br />
Landform (hillslope, terrace, etc.): hillslope Local relief (concave, convex, none) concave Slope (%) 3%<br />
Subregion (LRR): Arid Lands Lat: Long: Datum:<br />
Soil Map Unit Name: 29A - Freewater very cobbly loam, 0-3% NWI Classification:<br />
Are climatic/hydrologic site conditions typical for this time <strong>of</strong> year Yes No (If no, explain in Remarks.)<br />
Are Vegetation Soil or Hydrology significantly disturbed Are “Normal Circumstances” present Yes No<br />
Are Vegetation Soil or Hydrology naturally problematic (If needed, explain any answers in Remarks”)<br />
SUMMARY OF FINDINGS – Attach site map showing sampling point locations, transects, important features, etc.<br />
Hydrophytic Vegetation Present Yes No<br />
Is the Sampled Area<br />
Hydric Soil Present Yes No<br />
within a Wetland Yes No<br />
Wetland Hydrology Present Yes No<br />
Remarks: Riparian wetland connected to McKay Creek. Located at the north end <strong>of</strong> 44 th and Kirk. Wetland MC-1<br />
VEGETATION – Use scientific names <strong>of</strong> plants.<br />
Absolute Dominant Indicator<br />
Tree Stratum (Plot size: 30' r) % Cover Species Status<br />
1.<br />
2.<br />
3.<br />
4.<br />
0% = Total Cover<br />
Sapling/Shrub Stratum (Plot size: 5' r)<br />
1. Populus balsamifera v. trichocarpa 5 FAC<br />
2.<br />
3.<br />
4.<br />
5.<br />
5% = Total Cover<br />
Herb Stratum (Plot size: 5' r)<br />
1. Iris pseudacorus 95 OBL<br />
2. Juncus sp. 5 FAC-W<br />
3.<br />
4.<br />
5.<br />
6.<br />
7.<br />
8.<br />
9.<br />
10.<br />
11.<br />
100% = Total Cover<br />
Woody Vine Stratum (Plot size: 30' r)<br />
1.<br />
2.<br />
0 = Total Cover<br />
% Bare Ground in Herb Stratum:<br />
Remarks:<br />
Dominance Test worksheet:<br />
Number <strong>of</strong> Dominant Species<br />
That Are OBL, FACW, or FAC:<br />
Total Number <strong>of</strong> Dominant<br />
Species Across All Strata:<br />
Percent <strong>of</strong> Dominant Species<br />
That Are OBL, FACW, or FAC:<br />
2 (A)<br />
2 (B)<br />
100 (A/B)<br />
Prevalence Index worksheet:<br />
Total % Cover <strong>of</strong>:<br />
Multiply by:<br />
OBL species x 1 =<br />
FACW species x 2 =<br />
FAC species x 3 =<br />
FACU species x 4 =<br />
UPL species x 5 =<br />
Column Totals<br />
Prevalence Index = B/A =<br />
Hydrophytic Vegetation Indicators:<br />
Dominance Test is >50%<br />
Prevalence Index is ≤3.0 1<br />
Morphological Adaptations 1 (Provide supporting<br />
data in Remarks or on a separate sheet)<br />
Wetland Non-Vascular Plants 1<br />
Problematic Hydrophytic Vegetation 1 (Explain)<br />
1 Indicators <strong>of</strong> hydric soil and wetland hydrology must be<br />
present, unless disturbed or problematic.<br />
Hydrophytic<br />
Vegetation<br />
Present Yes No<br />
US Army Corps <strong>of</strong> Engineers Arid West – Version 2.0
SOIL Sampling Point: 4<br />
Pr<strong>of</strong>ile Description: (Describe to the depth needed to document the indicator or confirm the absence <strong>of</strong> indicators.)<br />
Depth Matrix Redox Features<br />
(inches) Color (moist) % Color (moist) % Type 1 Loc 2 Texture Remarks<br />
0-6 10YR 3/1 100 silt loam lots <strong>of</strong> fibrous roots<br />
6-13 7.5YR 3/1 97 7.5YR 3/3 3 C M gravelly silt lm pea- to fist-sized rock<br />
1 Type: C=Concentration, D=Depletion, RM=Reduced Matrix, CS=Covered or Coated Sand Grains.<br />
2 Location: PL=Pore Lining, M=Matrix.<br />
Hydric Soil Indicators: (Applicable to all LRRs, unless otherwise noted.) Indicators for Problematic Hydric Soils 3 :<br />
Histosol (A1) Sandy Redox (S5) 1 cm Muck (A9) (LRR D)<br />
Histic Epipedon (A2) Stripped Matrix (S6) 2 cm Muck (A10)<br />
Black Histic (A3) Loamy Mucky Mineral (F1) (except MLRA 1) Reduced Vertic (F18)<br />
Hydrogen Sulfide (A4) Loamy Gleyed Matrix (F2) Red Parent Material (TF2)<br />
Stratified Layers (A5) (LRR C) Depleted Matrix (F3) Other (Explain in Remarks)<br />
1 cm Muck (A9) (LRR D) Redox Dark Surface (F6)<br />
Depleted Below Dark Surface (A11) Depleted Dark Surface (F7)<br />
Thick Dark Surface (A12)<br />
Redox Depressions (F8)<br />
3 Indicators <strong>of</strong> hydrophytic vegetation and<br />
Sandy Mucky Mineral (S1) Vernal Pools (F9) wetland hydrology must be present,<br />
Sandy Gleyed Matrix (S4)<br />
unless disturbed or problematic.<br />
Restrictive Layer (if present):<br />
Type: rock refusal<br />
Depth (inches): 13 inches Hydric Soil Present Yes No<br />
Remarks:<br />
Soil is very loose and unconsolidated. Soil saturates readily as water table rises seasonally.<br />
HYDROLOGY<br />
Wetland Hydrology Indicators:<br />
Primary Indicators (minimum <strong>of</strong> one required; check all that apply)<br />
Secondary Indicators (2 or more required)<br />
Surface Water (A1) Salt Crust (B11) Water Marks (B1) (Riverine)<br />
High Water Table (A2) Biotic Crust (B12) Sediment Deposits (B2) (Riverine)<br />
Saturation (A3) Aquatic Invertebrates (B13) Drift Deposits (B3) (Riverine)<br />
Water Marks (B1) (Nonriverine) Hydrogen Sulfide Odor (C1) Drainage Patterns (B10)<br />
Sediment Deposits (B2) (Nonriverine) Oxidized Rhizospheres along Living Roots (C3) Dry-Season Water Table (C2)<br />
Drift Deposits (B3) (Nonriverine) Presence <strong>of</strong> Reduced Iron (C4) Crayfish Burrows (C8)<br />
Surface Soil Cracks (B6) Recent Iron Reduction in Tilled Soils (C6) Saturation Visible on Aerial Imagery (C9)<br />
Inundation Visible on Aerial Imagery (B7) Thin Muck Surface (C7) Shallow Aquitard (D3)<br />
Water-Stained Leaves (B9) Other (Explain in Remarks) FAC-Neutral Test (D5)<br />
Field Observations:<br />
Surface Water Present Yes No Depth (inches):<br />
Water Table Present Yes No Depth (inches): 13 inches<br />
Saturation Present Yes No Depth (inches): surface<br />
Wetland Hydrology Present Yes No<br />
(includes capillary fringe)<br />
Describe Recorded Data (stream gauge, monitoring well, aerial photos, previous inspections), if available:<br />
Remarks:<br />
The lowest portion <strong>of</strong> this feature receives peak flows from McKay Creek, plus groundwater from the landward side seeping out near the toe <strong>of</strong> slope.<br />
Water was at least 14 inches deep based on highest extent <strong>of</strong> observed waterborne debris.<br />
US Army Corps <strong>of</strong> Engineers Arid West – Version 2.0
<strong>WETLAND</strong> <strong>DETERMINATION</strong> <strong>DATA</strong> <strong>FORM</strong> – Arid West Region<br />
Project/Site: <strong>Pendleton</strong> <strong>City</strong>/County: Umatilla Sampling Date: 4/17/2012<br />
Applicant/Owner: <strong>City</strong> <strong>of</strong> <strong>Pendleton</strong> State: OR Sampling Point: 5<br />
Investigator(s): TB/ACS Section, Township, Range:<br />
Landform (hillslope, terrace, etc.): berm Local relief (concave, convex, none) concave Slope (%) flat<br />
Subregion (LRR): Arid Lands Lat: Long: Datum:<br />
Soil Map Unit Name: 29A - Freewater very cobbly loam, 0-3% NWI Classification:<br />
Are climatic/hydrologic site conditions typical for this time <strong>of</strong> year Yes No (If no, explain in Remarks.)<br />
Are Vegetation Soil or Hydrology significantly disturbed Are “Normal Circumstances” present Yes No<br />
Are Vegetation Soil or Hydrology naturally problematic (If needed, explain any answers in Remarks”)<br />
SUMMARY OF FINDINGS – Attach site map showing sampling point locations, transects, important features, etc.<br />
Hydrophytic Vegetation Present Yes No<br />
Is the Sampled Area<br />
Hydric Soil Present Yes No<br />
within a Wetland Yes No<br />
Wetland Hydrology Present Yes No<br />
Remarks: Plot is paired with Plot 4, approximately 1 foot above the upper extent <strong>of</strong> inundation indicators. MC-1 upland plot.<br />
VEGETATION – Use scientific names <strong>of</strong> plants.<br />
Absolute Dominant Indicator<br />
Tree Stratum (Plot size: 30' r) % Cover Species Status<br />
1. Populus balsamifera v. trichocarpa 50 FAC<br />
2.<br />
3.<br />
4.<br />
50% = Total Cover<br />
Sapling/Shrub Stratum (Plot size: 5' r)<br />
1.<br />
2.<br />
3.<br />
4.<br />
5.<br />
0% = Total Cover<br />
Herb Stratum (Plot size: 5' r)<br />
1. Salsola kali 15 FACU<br />
2. Bromus rigidus 45 NI<br />
3. Poa bulbosa 20 NL<br />
4.<br />
5. Misc annuals 20 FAC<br />
6.<br />
7.<br />
8.<br />
9.<br />
10.<br />
11.<br />
100% = Total Cover<br />
Woody Vine Stratum (Plot size: 30' r)<br />
1.<br />
2.<br />
0 = Total Cover<br />
% Bare Ground in Herb Stratum:<br />
Remarks:<br />
Dominance Test worksheet:<br />
Number <strong>of</strong> Dominant Species<br />
That Are OBL, FACW, or FAC:<br />
Total Number <strong>of</strong> Dominant<br />
Species Across All Strata:<br />
Percent <strong>of</strong> Dominant Species<br />
That Are OBL, FACW, or FAC:<br />
2 (A)<br />
4 (B)<br />
50 (A/B)<br />
Prevalence Index worksheet:<br />
Total % Cover <strong>of</strong>:<br />
Multiply by:<br />
OBL species 0 x 1 = 0<br />
FACW species 0 x 2 = 0<br />
FAC species 70 x 3 = 210<br />
FACU species 15 x 4 = 60<br />
UPL species 65 x 5 = 325<br />
Column Totals 150 595<br />
Prevalence Index = B/A = 3.97<br />
Hydrophytic Vegetation Indicators:<br />
Dominance Test is >50%<br />
Prevalence Index is ≤3.0 1<br />
Morphological Adaptations 1 (Provide supporting<br />
data in Remarks or on a separate sheet)<br />
Wetland Non-Vascular Plants 1<br />
Problematic Hydrophytic Vegetation 1 (Explain)<br />
1 Indicators <strong>of</strong> hydric soil and wetland hydrology must be<br />
present, unless disturbed or problematic.<br />
Hydrophytic<br />
Vegetation<br />
Present Yes No<br />
US Army Corps <strong>of</strong> Engineers Arid West – Version 2.0
SOIL Sampling Point: 5<br />
Pr<strong>of</strong>ile Description: (Describe to the depth needed to document the indicator or confirm the absence <strong>of</strong> indicators.)<br />
Depth Matrix Redox Features<br />
(inches) Color (moist) % Color (moist) % Type 1 Loc 2 Texture Remarks<br />
0-10 7.5YR 3/2 100 gravelly loam<br />
1 Type: C=Concentration, D=Depletion, RM=Reduced Matrix, CS=Covered or Coated Sand Grains.<br />
2 Location: PL=Pore Lining, M=Matrix.<br />
Hydric Soil Indicators: (Applicable to all LRRs, unless otherwise noted.) Indicators for Problematic Hydric Soils 3 :<br />
Histosol (A1) Sandy Redox (S5) 1 cm Muck (A9) (LRR D)<br />
Histic Epipedon (A2) Stripped Matrix (S6) 2 cm Muck (A10)<br />
Black Histic (A3) Loamy Mucky Mineral (F1) (except MLRA 1) Reduced Vertic (F18)<br />
Hydrogen Sulfide (A4) Loamy Gleyed Matrix (F2) Red Parent Material (TF2)<br />
Stratified Layers (A5) (LRR C) Depleted Matrix (F3) Other (Explain in Remarks)<br />
1 cm Muck (A9) (LRR D) Redox Dark Surface (F6)<br />
Depleted Below Dark Surface (A11) Depleted Dark Surface (F7)<br />
Thick Dark Surface (A12)<br />
Redox Depressions (F8)<br />
3 Indicators <strong>of</strong> hydrophytic vegetation and<br />
Sandy Mucky Mineral (S1) Vernal Pools (F9) wetland hydrology must be present,<br />
Sandy Gleyed Matrix (S4)<br />
unless disturbed or problematic.<br />
Restrictive Layer (if present):<br />
Type: rock refusal - alluvial gravels and cobble<br />
Depth (inches): 10" Hydric Soil Present Yes No<br />
Remarks:<br />
HYDROLOGY<br />
Wetland Hydrology Indicators:<br />
Primary Indicators (minimum <strong>of</strong> one required; check all that apply)<br />
Secondary Indicators (2 or more required)<br />
Surface Water (A1) Salt Crust (B11) Water Marks (B1) (Riverine)<br />
High Water Table (A2) Biotic Crust (B12) Sediment Deposits (B2) (Riverine)<br />
Saturation (A3) Aquatic Invertebrates (B13) Drift Deposits (B3) (Riverine)<br />
Water Marks (B1) (Nonriverine) Hydrogen Sulfide Odor (C1) Drainage Patterns (B10)<br />
Sediment Deposits (B2) (Nonriverine) Oxidized Rhizospheres along Living Roots (C3) Dry-Season Water Table (C2)<br />
Drift Deposits (B3) (Nonriverine) Presence <strong>of</strong> Reduced Iron (C4) Crayfish Burrows (C8)<br />
Surface Soil Cracks (B6) Recent Iron Reduction in Tilled Soils (C6) Saturation Visible on Aerial Imagery (C9)<br />
Inundation Visible on Aerial Imagery (B7) Thin Muck Surface (C7) Shallow Aquitard (D3)<br />
Water-Stained Leaves (B9) Other (Explain in Remarks) FAC-Neutral Test (D5)<br />
Field Observations:<br />
Surface Water Present Yes No Depth (inches):<br />
Water Table Present Yes No Depth (inches):<br />
Saturation Present Yes No Depth (inches):<br />
Wetland Hydrology Present Yes No<br />
(includes capillary fringe)<br />
Describe Recorded Data (stream gauge, monitoring well, aerial photos, previous inspections), if available:<br />
Remarks:<br />
Soil is dry at 10 inches.<br />
US Army Corps <strong>of</strong> Engineers Arid West – Version 2.0
<strong>WETLAND</strong> <strong>DETERMINATION</strong> <strong>DATA</strong> <strong>FORM</strong> – Arid West Region<br />
Project/Site: <strong>Pendleton</strong> <strong>City</strong>/County: Umatilla Sampling Date: 4/17/2012<br />
Applicant/Owner: <strong>City</strong> <strong>of</strong> <strong>Pendleton</strong> State: OR Sampling Point: 6<br />
Investigator(s): TB/ACS Section, Township, Range:<br />
Landform (hillslope, terrace, etc.): floodplain Local relief (concave, convex, none) concave Slope (%) flat<br />
Subregion (LRR): Arid Lands Lat: Long: Datum:<br />
Soil Map Unit Name: 29A - Freewater very cobbly loam, 0-3% NWI Classification:<br />
Are climatic/hydrologic site conditions typical for this time <strong>of</strong> year Yes No (If no, explain in Remarks.)<br />
Are Vegetation Soil or Hydrology significantly disturbed Are “Normal Circumstances” present Yes No<br />
Are Vegetation Soil or Hydrology naturally problematic (If needed, explain any answers in Remarks”)<br />
SUMMARY OF FINDINGS – Attach site map showing sampling point locations, transects, important features, etc.<br />
Hydrophytic Vegetation Present Yes No<br />
Is the Sampled Area<br />
Hydric Soil Present Yes No<br />
within a Wetland Yes No<br />
Wetland Hydrology Present Yes No<br />
Remarks: Plot taken in the eastern portion <strong>of</strong> MC-1, upstream <strong>of</strong> the Iris pseudacorus-dominated section <strong>of</strong> the wetland.<br />
VEGETATION – Use scientific names <strong>of</strong> plants.<br />
Absolute Dominant Indicator<br />
Tree Stratum (Plot size: 30' r) % Cover Species Status<br />
1.<br />
2.<br />
3.<br />
4.<br />
0% = Total Cover<br />
Sapling/Shrub Stratum (Plot size: 5' r)<br />
1. Salix geyeriana 100 FACW<br />
2.<br />
3.<br />
4.<br />
5.<br />
100% = Total Cover<br />
Herb Stratum (Plot size: 5' r)<br />
1. Agrostis sp. 50 FAC-W<br />
2. Carex stipata 5 OBL<br />
3.<br />
4.<br />
5.<br />
6.<br />
7.<br />
8.<br />
9.<br />
10.<br />
11.<br />
55% = Total Cover<br />
Woody Vine Stratum (Plot size: 30' r)<br />
1.<br />
2.<br />
0 = Total Cover<br />
% Bare Ground in Herb Stratum: 50%<br />
Remarks:<br />
Thick shrub overstory has shaded out much <strong>of</strong> herbaceous stratum.<br />
Dominance Test worksheet:<br />
Number <strong>of</strong> Dominant Species<br />
That Are OBL, FACW, or FAC:<br />
Total Number <strong>of</strong> Dominant<br />
Species Across All Strata:<br />
Percent <strong>of</strong> Dominant Species<br />
That Are OBL, FACW, or FAC:<br />
2 (A)<br />
2 (B)<br />
100 (A/B)<br />
Prevalence Index worksheet:<br />
Total % Cover <strong>of</strong>:<br />
Multiply by:<br />
OBL species x 1 =<br />
FACW species x 2 =<br />
FAC species x 3 =<br />
FACU species x 4 =<br />
UPL species x 5 =<br />
Column Totals<br />
Prevalence Index = B/A =<br />
Hydrophytic Vegetation Indicators:<br />
Dominance Test is >50%<br />
Prevalence Index is ≤3.0 1<br />
Morphological Adaptations 1 (Provide supporting<br />
data in Remarks or on a separate sheet)<br />
Wetland Non-Vascular Plants 1<br />
Problematic Hydrophytic Vegetation 1 (Explain)<br />
1 Indicators <strong>of</strong> hydric soil and wetland hydrology must be<br />
present, unless disturbed or problematic.<br />
Hydrophytic<br />
Vegetation<br />
Present Yes No<br />
US Army Corps <strong>of</strong> Engineers Arid West – Version 2.0
SOIL Sampling Point: 6<br />
Pr<strong>of</strong>ile Description: (Describe to the depth needed to document the indicator or confirm the absence <strong>of</strong> indicators.)<br />
Depth Matrix Redox Features<br />
(inches) Color (moist) % Color (moist) % Type 1 Loc 2 Texture Remarks<br />
0-8" 10YR 3/1 100 sandy loam<br />
8-14" 10YR 3/1 95 7.5YR 3/4 5 C M sandy loam some gravel<br />
1 Type: C=Concentration, D=Depletion, RM=Reduced Matrix, CS=Covered or Coated Sand Grains.<br />
2 Location: PL=Pore Lining, M=Matrix.<br />
Hydric Soil Indicators: (Applicable to all LRRs, unless otherwise noted.) Indicators for Problematic Hydric Soils 3 :<br />
Histosol (A1) Sandy Redox (S5) 1 cm Muck (A9) (LRR D)<br />
Histic Epipedon (A2) Stripped Matrix (S6) 2 cm Muck (A10)<br />
Black Histic (A3) Loamy Mucky Mineral (F1) (except MLRA 1) Reduced Vertic (F18)<br />
Hydrogen Sulfide (A4) Loamy Gleyed Matrix (F2) Red Parent Material (TF2)<br />
Stratified Layers (A5) (LRR C) Depleted Matrix (F3) Other (Explain in Remarks)<br />
1 cm Muck (A9) (LRR D) Redox Dark Surface (F6)<br />
Depleted Below Dark Surface (A11) Depleted Dark Surface (F7)<br />
Thick Dark Surface (A12)<br />
Redox Depressions (F8)<br />
3 Indicators <strong>of</strong> hydrophytic vegetation and<br />
Sandy Mucky Mineral (S1) Vernal Pools (F9) wetland hydrology must be present,<br />
Sandy Gleyed Matrix (S4)<br />
unless disturbed or problematic.<br />
Restrictive Layer (if present):<br />
Type: rock refusal - alluvial gravels and cobble<br />
Depth (inches): 14" Hydric Soil Present Yes No<br />
Remarks:<br />
HYDROLOGY<br />
Wetland Hydrology Indicators:<br />
Primary Indicators (minimum <strong>of</strong> one required; check all that apply)<br />
Secondary Indicators (2 or more required)<br />
Surface Water (A1) Salt Crust (B11) Water Marks (B1) (Riverine)<br />
High Water Table (A2) Biotic Crust (B12) Sediment Deposits (B2) (Riverine)<br />
Saturation (A3) Aquatic Invertebrates (B13) Drift Deposits (B3) (Riverine)<br />
Water Marks (B1) (Nonriverine) Hydrogen Sulfide Odor (C1) Drainage Patterns (B10)<br />
Sediment Deposits (B2) (Nonriverine) Oxidized Rhizospheres along Living Roots (C3) Dry-Season Water Table (C2)<br />
Drift Deposits (B3) (Nonriverine) Presence <strong>of</strong> Reduced Iron (C4) Crayfish Burrows (C8)<br />
Surface Soil Cracks (B6) Recent Iron Reduction in Tilled Soils (C6) Saturation Visible on Aerial Imagery (C9)<br />
Inundation Visible on Aerial Imagery (B7) Thin Muck Surface (C7) Shallow Aquitard (D3)<br />
Water-Stained Leaves (B9) Other (Explain in Remarks) FAC-Neutral Test (D5)<br />
Field Observations:<br />
Surface Water Present Yes No Depth (inches):<br />
Water Table Present Yes No Depth (inches): 12"<br />
Saturation Present Yes No Depth (inches): 6"<br />
Wetland Hydrology Present Yes No<br />
(includes capillary fringe)<br />
Describe Recorded Data (stream gauge, monitoring well, aerial photos, previous inspections), if available:<br />
Remarks:<br />
Backwater area subject to occasional ponding, but apparently outside area inundated by high creek flows.<br />
Cowardin: PSS (western section is PEM)<br />
HGM: Riverine Flow-Through<br />
US Army Corps <strong>of</strong> Engineers Arid West – Version 2.0
<strong>WETLAND</strong> <strong>DETERMINATION</strong> <strong>DATA</strong> <strong>FORM</strong> – Arid West Region<br />
Project/Site: <strong>Pendleton</strong> <strong>City</strong>/County: Umatilla Sampling Date: 4/17/2012<br />
Applicant/Owner: <strong>City</strong> <strong>of</strong> <strong>Pendleton</strong> State: OR Sampling Point: 7<br />
Investigator(s): TB/ACS Section, Township, Range:<br />
Landform (hillslope, terrace, etc.): channel Local relief (concave, convex, none) none Slope (%) flat<br />
Subregion (LRR): Arid Lands Lat: Long: Datum:<br />
Soil Map Unit Name: Water NWI Classification:<br />
Are climatic/hydrologic site conditions typical for this time <strong>of</strong> year Yes No (If no, explain in Remarks.)<br />
Are Vegetation Soil or Hydrology significantly disturbed Are “Normal Circumstances” present Yes No<br />
Are Vegetation Soil or Hydrology naturally problematic (If needed, explain any answers in Remarks”)<br />
SUMMARY OF FINDINGS – Attach site map showing sampling point locations, transects, important features, etc.<br />
Hydrophytic Vegetation Present Yes No<br />
Hydric Soil Present Yes No<br />
Wetland Hydrology Present Yes No<br />
Is the Sampled Area<br />
within a Wetland Yes No<br />
Remarks: This plot was taken in a braided secondary channel <strong>of</strong> the Umatilla River above the main channel. The substrate is minimally vegetated bare<br />
rock. The cobbly substrate appears to comprise the islands between the channels as well. Consequently, drainage is rapid with the dropping <strong>of</strong> the water<br />
surface elevation after periods <strong>of</strong> high flow. This plot is jursidictional as a Water <strong>of</strong> the State. Plot taken south <strong>of</strong> Reith Road and railroad tracks, on<br />
Property 80. Paired with Plot 8.<br />
VEGETATION – Use scientific names <strong>of</strong> plants.<br />
Absolute Dominant Indicator<br />
Tree Stratum (Plot size: 30' r) % Cover Species Status<br />
1.<br />
2.<br />
3.<br />
4.<br />
0% = Total Cover<br />
Sapling/Shrub Stratum (Plot size: 5' r)<br />
1.<br />
2.<br />
3.<br />
4.<br />
5.<br />
0% = Total Cover<br />
Herb Stratum (Plot size: 5' r)<br />
1. Elymus glaucus 5 NL<br />
2.<br />
3. Misc annuals 10 FAC<br />
4.<br />
5.<br />
6.<br />
7.<br />
8.<br />
9.<br />
10.<br />
11.<br />
15% = Total Cover<br />
Woody Vine Stratum (Plot size: 30' r)<br />
1.<br />
2.<br />
0 = Total Cover<br />
% Bare Ground in Herb Stratum: 85%<br />
Dominance Test worksheet:<br />
Number <strong>of</strong> Dominant Species<br />
That Are OBL, FACW, or FAC:<br />
Total Number <strong>of</strong> Dominant<br />
Species Across All Strata:<br />
Percent <strong>of</strong> Dominant Species<br />
That Are OBL, FACW, or FAC:<br />
1 (A)<br />
2 (B)<br />
50 (A/B)<br />
Prevalence Index worksheet:<br />
Total % Cover <strong>of</strong>:<br />
Multiply by:<br />
OBL species 0 x 1 = 0<br />
FACW species 0 x 2 = 0<br />
FAC species 10 x 3 = 30<br />
FACU species x 4 =<br />
UPL species 5 x 5 = 25<br />
Column Totals 15 55<br />
Prevalence Index = B/A = 3.67<br />
Hydrophytic Vegetation Indicators:<br />
Dominance Test is >50%<br />
Prevalence Index is ≤3.0 1<br />
Morphological Adaptations 1 (Provide supporting<br />
data in Remarks or on a separate sheet)<br />
Wetland Non-Vascular Plants 1<br />
Problematic Hydrophytic Vegetation 1 (Explain)<br />
1 Indicators <strong>of</strong> hydric soil and wetland hydrology must be<br />
present, unless disturbed or problematic.<br />
Hydrophytic<br />
Vegetation<br />
Present Yes No<br />
US Army Corps <strong>of</strong> Engineers Arid West – Version 2.0
Remarks:<br />
High flow channel adjacent to main stream channel. Most vegetation scoured out. Water velocity precludes much vegetation except deeply rooted woody<br />
hydrophytes.<br />
US Army Corps <strong>of</strong> Engineers Arid West – Version 2.0
SOIL Sampling Point: 7<br />
Pr<strong>of</strong>ile Description: (Describe to the depth needed to document the indicator or confirm the absence <strong>of</strong> indicators.)<br />
Depth Matrix Redox Features<br />
(inches) Color (moist) % Color (moist) % Type 1 Loc 2 Texture Remarks<br />
1 Type: C=Concentration, D=Depletion, RM=Reduced Matrix, CS=Covered or Coated Sand Grains.<br />
2 Location: PL=Pore Lining, M=Matrix.<br />
Hydric Soil Indicators: (Applicable to all LRRs, unless otherwise noted.) Indicators for Problematic Hydric Soils 3 :<br />
Histosol (A1) Sandy Redox (S5) 1 cm Muck (A9) (LRR D)<br />
Histic Epipedon (A2) Stripped Matrix (S6) 2 cm Muck (A10)<br />
Black Histic (A3) Loamy Mucky Mineral (F1) (except MLRA 1) Reduced Vertic (F18)<br />
Hydrogen Sulfide (A4) Loamy Gleyed Matrix (F2) Red Parent Material (TF2)<br />
Stratified Layers (A5) (LRR C) Depleted Matrix (F3) Other (Explain in Remarks)<br />
1 cm Muck (A9) (LRR D) Redox Dark Surface (F6)<br />
Depleted Below Dark Surface (A11) Depleted Dark Surface (F7)<br />
Thick Dark Surface (A12)<br />
Redox Depressions (F8)<br />
3 Indicators <strong>of</strong> hydrophytic vegetation and<br />
Sandy Mucky Mineral (S1) Vernal Pools (F9) wetland hydrology must be present,<br />
Sandy Gleyed Matrix (S4)<br />
unless disturbed or problematic.<br />
Restrictive Layer (if present):<br />
Type: rock refusal at surface - river cobble<br />
Depth (inches): surface Hydric Soil Present Yes No<br />
Remarks:<br />
Mapped as Water in the Umatilla County Soil Survey. Geomorphic position - this area lies below the OHWM <strong>of</strong> the Umatilla River.<br />
HYDROLOGY<br />
Wetland Hydrology Indicators:<br />
Primary Indicators (minimum <strong>of</strong> one required; check all that apply)<br />
Secondary Indicators (2 or more required)<br />
Surface Water (A1) Salt Crust (B11) Water Marks (B1) (Riverine)<br />
High Water Table (A2) Biotic Crust (B12) Sediment Deposits (B2) (Riverine)<br />
Saturation (A3) Aquatic Invertebrates (B13) Drift Deposits (B3) (Riverine)<br />
Water Marks (B1) (Nonriverine) Hydrogen Sulfide Odor (C1) Drainage Patterns (B10)<br />
Sediment Deposits (B2) (Nonriverine) Oxidized Rhizospheres along Living Roots (C3) Dry-Season Water Table (C2)<br />
Drift Deposits (B3) (Nonriverine) Presence <strong>of</strong> Reduced Iron (C4) Crayfish Burrows (C8)<br />
Surface Soil Cracks (B6) Recent Iron Reduction in Tilled Soils (C6) Saturation Visible on Aerial Imagery (C9)<br />
Inundation Visible on Aerial Imagery (B7) Thin Muck Surface (C7) Shallow Aquitard (D3)<br />
Water-Stained Leaves (B9) Other (Explain in Remarks) FAC-Neutral Test (D5)<br />
Field Observations:<br />
Surface Water Present Yes No Depth (inches):<br />
Water Table Present Yes No Depth (inches): did not measure<br />
Saturation Present Yes No Depth (inches): did not measure Wetland Hydrology Present Yes No<br />
(includes capillary fringe)<br />
Describe Recorded Data (stream gauge, monitoring well, aerial photos, previous inspections), if available:<br />
Remarks:<br />
Plot taken 4 feet below upper extent <strong>of</strong> waterborne debris caught in trees. Sediment deposits, recent debris deposition and geomorphology indicate<br />
periodic high water at this location.<br />
US Army Corps <strong>of</strong> Engineers Arid West – Version 2.0
<strong>WETLAND</strong> <strong>DETERMINATION</strong> <strong>DATA</strong> <strong>FORM</strong> – Arid West Region<br />
Project/Site: <strong>Pendleton</strong> <strong>City</strong>/County: Umatilla Sampling Date: 4/17/2012<br />
Applicant/Owner: <strong>City</strong> <strong>of</strong> <strong>Pendleton</strong> State: OR Sampling Point: 8<br />
Investigator(s): TB/ACS Section, Township, Range:<br />
Landform (hillslope, terrace, etc.): terrace Local relief (concave, convex, none) none Slope (%) flat<br />
Subregion (LRR): Arid Lands Lat: Long: Datum:<br />
Soil Map Unit Name: Water NWI Classification:<br />
Are climatic/hydrologic site conditions typical for this time <strong>of</strong> year Yes No (If no, explain in Remarks.)<br />
Are Vegetation Soil or Hydrology significantly disturbed Are “Normal Circumstances” present Yes No<br />
Are Vegetation Soil or Hydrology naturally problematic (If needed, explain any answers in Remarks”)<br />
SUMMARY OF FINDINGS – Attach site map showing sampling point locations, transects, important features, etc.<br />
Hydrophytic Vegetation Present Yes No<br />
Is the Sampled Area<br />
Hydric Soil Present Yes No<br />
within a Wetland Yes No<br />
Wetland Hydrology Present Yes No<br />
Remarks: Paired with Plot 7. Taken on an upland bench above the Umatilla River, above the influence <strong>of</strong> flowing water.<br />
VEGETATION – Use scientific names <strong>of</strong> plants.<br />
Absolute Dominant Indicator<br />
Tree Stratum (Plot size: 30' r) % Cover Species Status<br />
1. Populus balsamifera v. trichocarpa 30 FAC<br />
2.<br />
3.<br />
4.<br />
30% = Total Cover<br />
Sapling/Shrub Stratum (Plot size: 15' r)<br />
1.<br />
2.<br />
3.<br />
4.<br />
5.<br />
0% = Total Cover<br />
Herb Stratum (Plot size: 5' r)<br />
1. Conium maculatum 35 FACW<br />
2. Lactuca communis 25 FAC<br />
3. Onopordum acanthium 5 NL<br />
4. Galium aparine 5 FACU<br />
5. Hordeum sp 5 FACU<br />
6. to NL<br />
7. Agrostis sp. 10 FAC to<br />
8. FACW<br />
9. Unid perennial 10 FAC<br />
10. Chenopodium album 5 FACU<br />
11.<br />
100% = Total Cover<br />
Woody Vine Stratum (Plot size: 15' r)<br />
1.<br />
2.<br />
0 = Total Cover<br />
% Bare Ground in Herb Stratum:<br />
Remarks:<br />
Dominance Test worksheet:<br />
Number <strong>of</strong> Dominant Species<br />
That Are OBL, FACW, or FAC:<br />
Total Number <strong>of</strong> Dominant<br />
Species Across All Strata:<br />
Percent <strong>of</strong> Dominant Species<br />
That Are OBL, FACW, or FAC:<br />
3 (A)<br />
3 (B)<br />
100 (A/B)<br />
Prevalence Index worksheet:<br />
Total % Cover <strong>of</strong>:<br />
Multiply by:<br />
OBL species x 1 =<br />
FACW species x 2 =<br />
FAC species x 3 =<br />
FACU species x 4 =<br />
UPL species x 5 =<br />
Column Totals<br />
Prevalence Index = B/A =<br />
Hydrophytic Vegetation Indicators:<br />
Dominance Test is >50%<br />
Prevalence Index is ≤3.0 1<br />
Morphological Adaptations 1 (Provide supporting<br />
data in Remarks or on a separate sheet)<br />
Wetland Non-Vascular Plants 1<br />
Problematic Hydrophytic Vegetation 1 (Explain)<br />
1 Indicators <strong>of</strong> hydric soil and wetland hydrology must be<br />
present, unless disturbed or problematic.<br />
Hydrophytic<br />
Vegetation<br />
Present Yes No<br />
US Army Corps <strong>of</strong> Engineers Arid West – Version 2.0
SOIL Sampling Point: 8<br />
Pr<strong>of</strong>ile Description: (Describe to the depth needed to document the indicator or confirm the absence <strong>of</strong> indicators.)<br />
Depth Matrix Redox Features<br />
(inches) Color (moist) % Color (moist) % Type 1 Loc 2 Texture Remarks<br />
1-20 10YR 3/2 100 fine sandy loam<br />
1 Type: C=Concentration, D=Depletion, RM=Reduced Matrix, CS=Covered or Coated Sand Grains.<br />
2 Location: PL=Pore Lining, M=Matrix.<br />
Hydric Soil Indicators: (Applicable to all LRRs, unless otherwise noted.) Indicators for Problematic Hydric Soils 3 :<br />
Histosol (A1) Sandy Redox (S5) 1 cm Muck (A9) (LRR D)<br />
Histic Epipedon (A2) Stripped Matrix (S6) 2 cm Muck (A10)<br />
Black Histic (A3) Loamy Mucky Mineral (F1) (except MLRA 1) Reduced Vertic (F18)<br />
Hydrogen Sulfide (A4) Loamy Gleyed Matrix (F2) Red Parent Material (TF2)<br />
Stratified Layers (A5) (LRR C) Depleted Matrix (F3) Other (Explain in Remarks)<br />
1 cm Muck (A9) (LRR D) Redox Dark Surface (F6)<br />
Depleted Below Dark Surface (A11) Depleted Dark Surface (F7)<br />
Thick Dark Surface (A12)<br />
Redox Depressions (F8)<br />
3 Indicators <strong>of</strong> hydrophytic vegetation and<br />
Sandy Mucky Mineral (S1) Vernal Pools (F9) wetland hydrology must be present,<br />
Sandy Gleyed Matrix (S4)<br />
unless disturbed or problematic.<br />
Restrictive Layer (if present):<br />
Type:<br />
Depth (inches): Hydric Soil Present Yes No<br />
Remarks:<br />
HYDROLOGY<br />
Wetland Hydrology Indicators:<br />
Primary Indicators (minimum <strong>of</strong> one required; check all that apply)<br />
Secondary Indicators (2 or more required)<br />
Surface Water (A1) Salt Crust (B11) Water Marks (B1) (Riverine)<br />
High Water Table (A2) Biotic Crust (B12) Sediment Deposits (B2) (Riverine)<br />
Saturation (A3) Aquatic Invertebrates (B13) Drift Deposits (B3) (Riverine)<br />
Water Marks (B1) (Nonriverine) Hydrogen Sulfide Odor (C1) Drainage Patterns (B10)<br />
Sediment Deposits (B2) (Nonriverine) Oxidized Rhizospheres along Living Roots (C3) Dry-Season Water Table (C2)<br />
Drift Deposits (B3) (Nonriverine) Presence <strong>of</strong> Reduced Iron (C4) Crayfish Burrows (C8)<br />
Surface Soil Cracks (B6) Recent Iron Reduction in Tilled Soils (C6) Saturation Visible on Aerial Imagery (C9)<br />
Inundation Visible on Aerial Imagery (B7) Thin Muck Surface (C7) Shallow Aquitard (D3)<br />
Water-Stained Leaves (B9) Other (Explain in Remarks) FAC-Neutral Test (D5)<br />
Field Observations:<br />
Surface Water Present Yes No Depth (inches):<br />
Water Table Present Yes No Depth (inches):<br />
Saturation Present Yes No Depth (inches):<br />
Wetland Hydrology Present Yes No<br />
(includes capillary fringe)<br />
Describe Recorded Data (stream gauge, monitoring well, aerial photos, previous inspections), if available:<br />
Remarks:<br />
Plot 2 feet above highest wrack line. No indicators <strong>of</strong> surface or subsurface hydrology.<br />
US Army Corps <strong>of</strong> Engineers Arid West – Version 2.0
<strong>WETLAND</strong> <strong>DETERMINATION</strong> <strong>DATA</strong> <strong>FORM</strong> – Arid West Region<br />
Project/Site: <strong>Pendleton</strong> <strong>City</strong>/County: Umatilla Sampling Date: 4/18/2012<br />
Applicant/Owner: <strong>City</strong> <strong>of</strong> <strong>Pendleton</strong> State: OR Sampling Point: 9<br />
Investigator(s): TB/ACS Section, Township, Range:<br />
Landform (hillslope, terrace, etc.): hillslope Local relief (concave, convex, none) none Slope (%) 5%<br />
Subregion (LRR): Arid Lands Lat: Long: Datum:<br />
Soil Map Unit Name: See Soil Remarks NWI Classification:<br />
Are climatic/hydrologic site conditions typical for this time <strong>of</strong> year Yes No (If no, explain in Remarks.)<br />
Are Vegetation Soil or Hydrology significantly disturbed Are “Normal Circumstances” present Yes No<br />
Are Vegetation Soil or Hydrology naturally problematic (If needed, explain any answers in Remarks”)<br />
SUMMARY OF FINDINGS – Attach site map showing sampling point locations, transects, important features, etc.<br />
Hydrophytic Vegetation Present Yes No<br />
Hydric Soil Present Yes No<br />
Wetland Hydrology Present Yes No<br />
Is the Sampled Area<br />
within a Wetland Yes No<br />
Remarks: Plot taken above a small tributary <strong>of</strong> a large wetland on the northern Umatilla River floodplain. The cross-section <strong>of</strong> the stream channel is<br />
sharply U-shaped with a low-flow channel that meanders back and forth across the bottom <strong>of</strong> the channel. Plot taken at PW 2, north <strong>of</strong> Westgate, east <strong>of</strong><br />
Airport Road on Property 18. Paired with Plot 10.<br />
VEGETATION – Use scientific names <strong>of</strong> plants.<br />
Absolute Dominant Indicator<br />
Tree Stratum (Plot size: 30' r) % Cover Species Status<br />
1.<br />
2.<br />
3.<br />
4.<br />
0% = Total Cover<br />
Sapling/Shrub Stratum (Plot size: 5' r)<br />
1.<br />
2.<br />
3.<br />
4.<br />
5.<br />
0% = Total Cover<br />
Herb Stratum (Plot size: 5' r)<br />
1. Leymus cinereus 60 FAC<br />
2. Conium maculatum 40 FACW<br />
3.<br />
4.<br />
5.<br />
6.<br />
7.<br />
8.<br />
9.<br />
10.<br />
11.<br />
100% = Total Cover<br />
Woody Vine Stratum (Plot size: 30' r)<br />
1.<br />
2.<br />
0 = Total Cover<br />
% Bare Ground in Herb Stratum: 0%<br />
Dominance Test worksheet:<br />
Number <strong>of</strong> Dominant Species<br />
That Are OBL, FACW, or FAC:<br />
Total Number <strong>of</strong> Dominant<br />
Species Across All Strata:<br />
Percent <strong>of</strong> Dominant Species<br />
That Are OBL, FACW, or FAC:<br />
2 (A)<br />
2 (B)<br />
100 (A/B)<br />
Prevalence Index worksheet:<br />
Total % Cover <strong>of</strong>:<br />
Multiply by:<br />
OBL species x 1 =<br />
FACW species x 2 =<br />
FAC species x 3 =<br />
FACU species x 4 =<br />
UPL species x 5 =<br />
Column Totals<br />
Prevalence Index = B/A =<br />
Hydrophytic Vegetation Indicators:<br />
Dominance Test is >50%<br />
Prevalence Index is ≤3.0 1<br />
Morphological Adaptations 1 (Provide supporting<br />
data in Remarks or on a separate sheet)<br />
Wetland Non-Vascular Plants 1<br />
Problematic Hydrophytic Vegetation 1 (Explain)<br />
1 Indicators <strong>of</strong> hydric soil and wetland hydrology must be<br />
present, unless disturbed or problematic.<br />
Hydrophytic<br />
Vegetation<br />
Present Yes No<br />
US Army Corps <strong>of</strong> Engineers Arid West – Version 2.0
Remarks:<br />
US Army Corps <strong>of</strong> Engineers Arid West – Version 2.0
SOIL Sampling Point: 9<br />
Pr<strong>of</strong>ile Description: (Describe to the depth needed to document the indicator or confirm the absence <strong>of</strong> indicators.)<br />
Depth Matrix Redox Features<br />
(inches) Color (moist) % Color (moist) % Type 1 Loc 2 Texture Remarks<br />
0-16 10YR 3/2 100 sandy loam gravel to fist-size rock occasional<br />
below 12 inches<br />
16-20 10YR 4/2 100 sandy loam very gradual color shift<br />
1 Type: C=Concentration, D=Depletion, RM=Reduced Matrix, CS=Covered or Coated Sand Grains.<br />
2 Location: PL=Pore Lining, M=Matrix.<br />
Hydric Soil Indicators: (Applicable to all LRRs, unless otherwise noted.) Indicators for Problematic Hydric Soils 3 :<br />
Histosol (A1) Sandy Redox (S5) 1 cm Muck (A9) (LRR D)<br />
Histic Epipedon (A2) Stripped Matrix (S6) 2 cm Muck (A10)<br />
Black Histic (A3) Loamy Mucky Mineral (F1) (except MLRA 1) Reduced Vertic (F18)<br />
Hydrogen Sulfide (A4) Loamy Gleyed Matrix (F2) Red Parent Material (TF2)<br />
Stratified Layers (A5) (LRR C) Depleted Matrix (F3) Other (Explain in Remarks)<br />
1 cm Muck (A9) (LRR D) Redox Dark Surface (F6)<br />
Depleted Below Dark Surface (A11) Depleted Dark Surface (F7)<br />
Thick Dark Surface (A12)<br />
Redox Depressions (F8)<br />
3 Indicators <strong>of</strong> hydrophytic vegetation and<br />
Sandy Mucky Mineral (S1) Vernal Pools (F9) wetland hydrology must be present,<br />
Sandy Gleyed Matrix (S4)<br />
unless disturbed or problematic.<br />
Restrictive Layer (if present):<br />
Type:<br />
Depth (inches): Hydric Soil Present Yes No<br />
Remarks:<br />
Soil Survey shows the ravine dividing map unit 114C - Walla Walla silt loam, 7 to 12% slopes (west) and 48E - Lickskillet very stony loam, 7 to 40%<br />
slopes. The plot was on the Lickskillet side.<br />
HYDROLOGY<br />
Wetland Hydrology Indicators:<br />
Primary Indicators (minimum <strong>of</strong> one required; check all that apply)<br />
Secondary Indicators (2 or more required)<br />
Surface Water (A1) Salt Crust (B11) Water Marks (B1) (Riverine)<br />
High Water Table (A2) Biotic Crust (B12) Sediment Deposits (B2) (Riverine)<br />
Saturation (A3) Aquatic Invertebrates (B13) Drift Deposits (B3) (Riverine)<br />
Water Marks (B1) (Nonriverine) Hydrogen Sulfide Odor (C1) Drainage Patterns (B10)<br />
Sediment Deposits (B2) (Nonriverine) Oxidized Rhizospheres along Living Roots (C3) Dry-Season Water Table (C2)<br />
Drift Deposits (B3) (Nonriverine) Presence <strong>of</strong> Reduced Iron (C4) Crayfish Burrows (C8)<br />
Surface Soil Cracks (B6) Recent Iron Reduction in Tilled Soils (C6) Saturation Visible on Aerial Imagery (C9)<br />
Inundation Visible on Aerial Imagery (B7) Thin Muck Surface (C7) Shallow Aquitard (D3)<br />
Water-Stained Leaves (B9) Other (Explain in Remarks) FAC-Neutral Test (D5)<br />
Field Observations:<br />
Surface Water Present Yes No Depth (inches):<br />
Water Table Present Yes No Depth (inches):<br />
Saturation Present Yes No Depth (inches):<br />
Wetland Hydrology Present Yes No<br />
(includes capillary fringe)<br />
Describe Recorded Data (stream gauge, monitoring well, aerial photos, previous inspections), if available:<br />
Remarks:<br />
Plot 4 feet above bottom <strong>of</strong> narrow incised stream channel.<br />
US Army Corps <strong>of</strong> Engineers Arid West – Version 2.0
<strong>WETLAND</strong> <strong>DETERMINATION</strong> <strong>DATA</strong> <strong>FORM</strong> – Arid West Region<br />
Project/Site: <strong>Pendleton</strong> <strong>City</strong>/County: Umatilla Sampling Date: 4/18/2012<br />
Applicant/Owner: <strong>City</strong> <strong>of</strong> <strong>Pendleton</strong> State: OR Sampling Point: 10<br />
Investigator(s): TB/ACS Section, Township, Range:<br />
Landform (hillslope, terrace, etc.): channel Local relief (concave, convex, none) none Slope (%) 5%<br />
Subregion (LRR): Arid Lands Lat: Long: Datum:<br />
Soil Map Unit Name: See Soil Remarks NWI Classification:<br />
Are climatic/hydrologic site conditions typical for this time <strong>of</strong> year Yes No (If no, explain in Remarks.)<br />
Are Vegetation Soil or Hydrology significantly disturbed Are “Normal Circumstances” present Yes No<br />
Are Vegetation Soil or Hydrology naturally problematic (If needed, explain any answers in Remarks”)<br />
SUMMARY OF FINDINGS – Attach site map showing sampling point locations, transects, important features, etc.<br />
Hydrophytic Vegetation Present Yes No<br />
Hydric Soil Present Yes No<br />
Wetland Hydrology Present Yes No<br />
Is the Sampled Area<br />
within a Wetland Yes No<br />
Remarks: Plot taken on a small bench in the channel <strong>of</strong> a small tributary <strong>of</strong> a large wetland on the northern Umatilla River floodplain. The cross-section <strong>of</strong><br />
the stream channel is sharply U-shaped with a low-flow channel that meanders back and forth across the bottom <strong>of</strong> the channel. Paired with Plot 9.<br />
Mapped as PW 2. Plot taken north <strong>of</strong> Westgate and east <strong>of</strong> Airport Road.<br />
VEGETATION – Use scientific names <strong>of</strong> plants.<br />
Absolute Dominant Indicator<br />
Tree Stratum (Plot size: 30' r) % Cover Species Status<br />
1.<br />
2.<br />
3.<br />
4.<br />
0% = Total Cover<br />
Sapling/Shrub Stratum (Plot size: 5' r)<br />
1.<br />
2.<br />
3.<br />
4.<br />
5.<br />
0% = Total Cover<br />
Herb Stratum (Plot size: 5' r)<br />
1. Solidago sp. 50 FAC-NL<br />
2. Conium maculatum 5 FACW<br />
3. Dipsacus fullonum 5 FAC<br />
4.<br />
5.<br />
6.<br />
7.<br />
8.<br />
9.<br />
10.<br />
11.<br />
60% = Total Cover<br />
Woody Vine Stratum (Plot size: 30' r)<br />
1.<br />
2.<br />
0 = Total Cover<br />
% Bare Ground in Herb Stratum: 0%<br />
Dominance Test worksheet:<br />
Number <strong>of</strong> Dominant Species<br />
That Are OBL, FACW, or FAC:<br />
Total Number <strong>of</strong> Dominant<br />
Species Across All Strata:<br />
Percent <strong>of</strong> Dominant Species<br />
That Are OBL, FACW, or FAC:<br />
1 (A)<br />
1 (B)<br />
100 (A/B)<br />
Prevalence Index worksheet:<br />
Total % Cover <strong>of</strong>:<br />
Multiply by:<br />
OBL species 0 x 1 =<br />
FACW species x 2 =<br />
FAC species x 3 =<br />
FACU species x 4 =<br />
UPL species x 5 =<br />
Column Totals<br />
Prevalence Index = B/A =<br />
Hydrophytic Vegetation Indicators:<br />
Dominance Test is >50%<br />
Prevalence Index is ≤3.0 1<br />
Morphological Adaptations 1 (Provide supporting<br />
data in Remarks or on a separate sheet)<br />
Wetland Non-Vascular Plants 1<br />
Problematic Hydrophytic Vegetation 1 (Explain)<br />
1 Indicators <strong>of</strong> hydric soil and wetland hydrology must be<br />
present, unless disturbed or problematic.<br />
Hydrophytic<br />
Vegetation<br />
Present Yes No<br />
US Army Corps <strong>of</strong> Engineers Arid West – Version 2.0
Remarks:<br />
Solidago were short seedlings; identification to species was not possible. Based on the observation <strong>of</strong> healthy seedlings growing in saturated soil well into<br />
the growing season, this species is adapted to grow in soil that experiences prolonged saturation and occasional inundation.<br />
US Army Corps <strong>of</strong> Engineers Arid West – Version 2.0
SOIL Sampling Point: 10<br />
Pr<strong>of</strong>ile Description: (Describe to the depth needed to document the indicator or confirm the absence <strong>of</strong> indicators.)<br />
Depth Matrix Redox Features<br />
(inches) Color (moist) % Color (moist) % Type 1 Loc 2 Texture Remarks<br />
0-20 10YR 3/2 100 sandy loam<br />
1 Type: C=Concentration, D=Depletion, RM=Reduced Matrix, CS=Covered or Coated Sand Grains.<br />
2 Location: PL=Pore Lining, M=Matrix.<br />
Hydric Soil Indicators: (Applicable to all LRRs, unless otherwise noted.) Indicators for Problematic Hydric Soils 3 :<br />
Histosol (A1) Sandy Redox (S5) 1 cm Muck (A9) (LRR D)<br />
Histic Epipedon (A2) Stripped Matrix (S6) 2 cm Muck (A10)<br />
Black Histic (A3) Loamy Mucky Mineral (F1) (except MLRA 1) Reduced Vertic (F18)<br />
Hydrogen Sulfide (A4) Loamy Gleyed Matrix (F2) Red Parent Material (TF2)<br />
Stratified Layers (A5) (LRR C) Depleted Matrix (F3) Other (Explain in Remarks)<br />
1 cm Muck (A9) (LRR D) Redox Dark Surface (F6)<br />
Depleted Below Dark Surface (A11) Depleted Dark Surface (F7)<br />
Thick Dark Surface (A12)<br />
Redox Depressions (F8)<br />
3 Indicators <strong>of</strong> hydrophytic vegetation and<br />
Sandy Mucky Mineral (S1) Vernal Pools (F9) wetland hydrology must be present,<br />
Sandy Gleyed Matrix (S4)<br />
unless disturbed or problematic.<br />
Restrictive Layer (if present):<br />
Type:<br />
Depth (inches): Hydric Soil Present Yes No<br />
Remarks:<br />
Observation <strong>of</strong> flowing water and saturation at surface in April suggests this area meets the definition <strong>of</strong> hydric soil. Moreover, this small bench may<br />
be <strong>of</strong> recent origin from collapse <strong>of</strong> the sideslope and thus may not have developed hydric soil indicators yet.<br />
HYDROLOGY<br />
Wetland Hydrology Indicators:<br />
Primary Indicators (minimum <strong>of</strong> one required; check all that apply)<br />
Secondary Indicators (2 or more required)<br />
Surface Water (A1) Salt Crust (B11) Water Marks (B1) (Riverine)<br />
High Water Table (A2) Biotic Crust (B12) Sediment Deposits (B2) (Riverine)<br />
Saturation (A3) Aquatic Invertebrates (B13) Drift Deposits (B3) (Riverine)<br />
Water Marks (B1) (Nonriverine) Hydrogen Sulfide Odor (C1) Drainage Patterns (B10)<br />
Sediment Deposits (B2) (Nonriverine) Oxidized Rhizospheres along Living Roots (C3) Dry-Season Water Table (C2)<br />
Drift Deposits (B3) (Nonriverine) Presence <strong>of</strong> Reduced Iron (C4) Crayfish Burrows (C8)<br />
Surface Soil Cracks (B6) Recent Iron Reduction in Tilled Soils (C6) Saturation Visible on Aerial Imagery (C9)<br />
Inundation Visible on Aerial Imagery (B7) Thin Muck Surface (C7) Shallow Aquitard (D3)<br />
Water-Stained Leaves (B9) Other (Explain in Remarks) FAC-Neutral Test (D5)<br />
Field Observations:<br />
Surface Water Present Yes No Depth (inches):2" deep nearby<br />
Water Table Present Yes No Depth (inches): 5 inches<br />
Saturation Present Yes No Depth (inches): surface<br />
Wetland Hydrology Present Yes No<br />
(includes capillary fringe)<br />
Describe Recorded Data (stream gauge, monitoring well, aerial photos, previous inspections), if available:<br />
Remarks:<br />
Water is flowing in the channel about 2 feet away, likely in response to recent rainfall. The channel is about 12 inches wide with water 2-3 inches<br />
deep during the site investigation. The property owner says the channel is dry by June in most years.<br />
US Army Corps <strong>of</strong> Engineers Arid West – Version 2.0
<strong>WETLAND</strong> <strong>DETERMINATION</strong> <strong>DATA</strong> <strong>FORM</strong> – Arid West Region<br />
Project/Site: <strong>Pendleton</strong> <strong>City</strong>/County: Umatilla Sampling Date: 4/18, 4/19/2012<br />
Applicant/Owner: <strong>City</strong> <strong>of</strong> <strong>Pendleton</strong> State: OR Sampling Point: 11<br />
Investigator(s): TB/ACS Section, Township, Range:<br />
Landform (hillslope, terrace, etc.): terrace at toe <strong>of</strong> slope Local relief (concave, convex, none) concave Slope (%) flat<br />
Subregion (LRR): Arid Lands Lat: Long: Datum:<br />
Soil Map Unit Name: 28A - Freewater gravelly silt loam, 0-3% NWI Classification:<br />
Are climatic/hydrologic site conditions typical for this time <strong>of</strong> year Yes No (If no, explain in Remarks.)<br />
Are Vegetation Soil or Hydrology significantly disturbed Are “Normal Circumstances” present Yes No<br />
Are Vegetation Soil or Hydrology naturally problematic (If needed, explain any answers in Remarks”)<br />
SUMMARY OF FINDINGS – Attach site map showing sampling point locations, transects, important features, etc.<br />
Hydrophytic Vegetation Present Yes No<br />
Hydric Soil Present Yes No<br />
Wetland Hydrology Present Yes No<br />
Is the Sampled Area<br />
within a Wetland Yes No<br />
Remarks: Large wetland complex in former river channel. Cut <strong>of</strong>f by I-84. Mostly palustrine emergent with some palustrine scrub-shrub, tree groves and a<br />
section <strong>of</strong> open water. Good interspersion <strong>of</strong> habitat types. Mapped as UR-1, south <strong>of</strong> Murietta Road. Paired with Plot 12.<br />
VEGETATION – Use scientific names <strong>of</strong> plants.<br />
Absolute Dominant Indicator<br />
Tree Stratum (Plot size: 30' r) % Cover Species Status<br />
1. Salix lucida v. lasiandra 10 FACW<br />
2. Populus balsamifera v. trichocarpa 60 FAC<br />
3.<br />
4.<br />
Sapling/Shrub Stratum (Plot size: 5' r)<br />
70% = Total Cover<br />
1. Salix geyeriana 30 FACW<br />
2.<br />
3.<br />
4.<br />
5.<br />
Herb Stratum (Plot size: 5' r)<br />
30% = Total Cover<br />
1. Typha latifolia 100 OBL<br />
2.<br />
3.<br />
4.<br />
5.<br />
6.<br />
7.<br />
8.<br />
9.<br />
10.<br />
11.<br />
Woody Vine Stratum (Plot size: 30' r)<br />
1.<br />
2.<br />
100% = Total Cover<br />
0 = Total Cover<br />
% Bare Ground in Herb Stratum: 0%<br />
Remarks:<br />
Some areas have up to 30% open water among the Typha. Treed and shrubby areas are scattered.<br />
Dominance Test worksheet:<br />
Number <strong>of</strong> Dominant Species<br />
That Are OBL, FACW, or FAC:<br />
Total Number <strong>of</strong> Dominant<br />
Species Across All Strata:<br />
Percent <strong>of</strong> Dominant Species<br />
That Are OBL, FACW, or FAC:<br />
3 (A)<br />
3 (B)<br />
100 (A/B)<br />
Prevalence Index worksheet:<br />
Total % Cover <strong>of</strong>:<br />
Multiply by:<br />
OBL species x 1 =<br />
FACW species x 2 =<br />
FAC species x 3 =<br />
FACU species x 4 =<br />
UPL species x 5 =<br />
Column Totals<br />
Prevalence Index = B/A =<br />
Hydrophytic Vegetation Indicators:<br />
Dominance Test is >50%<br />
Prevalence Index is ≤3.0 1<br />
Morphological Adaptations 1 (Provide supporting<br />
data in Remarks or on a separate sheet)<br />
Wetland Non-Vascular Plants 1<br />
Problematic Hydrophytic Vegetation 1 (Explain)<br />
1 Indicators <strong>of</strong> hydric soil and wetland hydrology must be<br />
present, unless disturbed or problematic.<br />
Hydrophytic<br />
Vegetation<br />
Present Yes No<br />
US Army Corps <strong>of</strong> Engineers Arid West – Version 2.0
SOIL Sampling Point: 11<br />
Pr<strong>of</strong>ile Description: (Describe to the depth needed to document the indicator or confirm the absence <strong>of</strong> indicators.)<br />
Depth Matrix Redox Features<br />
(inches) Color (moist) % Color (moist) % Type 1 Loc 2 Texture Remarks<br />
1 Type: C=Concentration, D=Depletion, RM=Reduced Matrix, CS=Covered or Coated Sand Grains.<br />
2 Location: PL=Pore Lining, M=Matrix.<br />
Hydric Soil Indicators: (Applicable to all LRRs, unless otherwise noted.) Indicators for Problematic Hydric Soils 3 :<br />
Histosol (A1) Sandy Redox (S5) 1 cm Muck (A9) (LRR D)<br />
Histic Epipedon (A2) Stripped Matrix (S6) 2 cm Muck (A10)<br />
Black Histic (A3) Loamy Mucky Mineral (F1) (except MLRA 1) Reduced Vertic (F18)<br />
Hydrogen Sulfide (A4) Loamy Gleyed Matrix (F2) Red Parent Material (TF2)<br />
Stratified Layers (A5) (LRR C) Depleted Matrix (F3) Other (Explain in Remarks)<br />
1 cm Muck (A9) (LRR D) Redox Dark Surface (F6)<br />
Depleted Below Dark Surface (A11) Depleted Dark Surface (F7)<br />
Thick Dark Surface (A12)<br />
Redox Depressions (F8)<br />
3 Indicators <strong>of</strong> hydrophytic vegetation and<br />
Sandy Mucky Mineral (S1) Vernal Pools (F9) wetland hydrology must be present,<br />
Sandy Gleyed Matrix (S4)<br />
unless disturbed or problematic.<br />
Restrictive Layer (if present):<br />
Type:<br />
Depth (inches): Hydric Soil Present Yes No<br />
Remarks:<br />
Developed areas extend right up to maximum extent <strong>of</strong> open water, which is several inches deep. Meets definition <strong>of</strong> hydric soil.<br />
HYDROLOGY<br />
Wetland Hydrology Indicators:<br />
Primary Indicators (minimum <strong>of</strong> one required; check all that apply)<br />
Secondary Indicators (2 or more required)<br />
Surface Water (A1) Salt Crust (B11) Water Marks (B1) (Riverine)<br />
High Water Table (A2) Biotic Crust (B12) Sediment Deposits (B2) (Riverine)<br />
Saturation (A3) Aquatic Invertebrates (B13) Drift Deposits (B3) (Riverine)<br />
Water Marks (B1) (Nonriverine) Hydrogen Sulfide Odor (C1) Drainage Patterns (B10)<br />
Sediment Deposits (B2) (Nonriverine) Oxidized Rhizospheres along Living Roots (C3) Dry-Season Water Table (C2)<br />
Drift Deposits (B3) (Nonriverine) Presence <strong>of</strong> Reduced Iron (C4) Crayfish Burrows (C8)<br />
Surface Soil Cracks (B6) Recent Iron Reduction in Tilled Soils (C6) Saturation Visible on Aerial Imagery (C9)<br />
Inundation Visible on Aerial Imagery (B7) Thin Muck Surface (C7) Shallow Aquitard (D3)<br />
Water-Stained Leaves (B9) Other (Explain in Remarks) FAC-Neutral Test (D5)<br />
Field Observations:<br />
Surface Water Present Yes No Depth (inches):3 inches at margin<br />
Water Table Present Yes No Depth (inches): did not measure<br />
Saturation Present Yes No Depth (inches): did not measure Wetland Hydrology Present Yes No<br />
(includes capillary fringe)<br />
Describe Recorded Data (stream gauge, monitoring well, aerial photos, previous inspections), if available:<br />
Remarks:<br />
US Army Corps <strong>of</strong> Engineers Arid West – Version 2.0
<strong>WETLAND</strong> <strong>DETERMINATION</strong> <strong>DATA</strong> <strong>FORM</strong> – Arid West Region<br />
Project/Site: <strong>Pendleton</strong> <strong>City</strong>/County: Umatilla Sampling Date: 4/18, 4/19/2012<br />
Applicant/Owner: <strong>City</strong> <strong>of</strong> <strong>Pendleton</strong> State: OR Sampling Point: 12<br />
Investigator(s): TB/ACS Section, Township, Range:<br />
Landform (hillslope, terrace, etc.): terrace above surface water Local relief (concave, convex, none) concave Slope (%) flat<br />
Subregion (LRR): Arid Lands Lat: Long: Datum:<br />
Soil Map Unit Name: 28A - Freewater gravelly silt loam, 0-3% NWI Classification:<br />
Are climatic/hydrologic site conditions typical for this time <strong>of</strong> year Yes No (If no, explain in Remarks.)<br />
Are Vegetation Soil or Hydrology significantly disturbed Are “Normal Circumstances” present Yes No<br />
Are Vegetation Soil or Hydrology naturally problematic (If needed, explain any answers in Remarks”)<br />
SUMMARY OF FINDINGS – Attach site map showing sampling point locations, transects, important features, etc.<br />
Hydrophytic Vegetation Present Yes No<br />
Hydric Soil Present Yes No<br />
Wetland Hydrology Present Yes No<br />
Is the Sampled Area<br />
within a Wetland Yes No<br />
Remarks: Uplands adjacent to large wetland complex in former river channel. Mapped as UR-1, south <strong>of</strong> Murietta Road. Uplands are generally filled areas<br />
in former floodplain. Surface elevations are built up sufficiently to allow year-round industrial uses unimpeded by fluctuations in surface elevation <strong>of</strong><br />
adjacent river and wetland. Paired with Plot 11.<br />
VEGETATION – Use scientific names <strong>of</strong> plants.<br />
Absolute Dominant Indicator<br />
Tree Stratum (Plot size: 30' r) % Cover Species Status<br />
1.<br />
2.<br />
3.<br />
4.<br />
0% = Total Cover<br />
Sapling/Shrub Stratum (Plot size: 5' r)<br />
1.<br />
2.<br />
3.<br />
4.<br />
5.<br />
0% = Total Cover<br />
Herb Stratum (Plot size: 5' r)<br />
1. Conyza canadensis 1 FACU<br />
2. Sisymbrium altissimum 1 FACU-<br />
3.<br />
4.<br />
5.<br />
6.<br />
7.<br />
8.<br />
9.<br />
10.<br />
11.<br />
2% = Total Cover<br />
Woody Vine Stratum (Plot size: 30' r)<br />
1.<br />
2.<br />
0 = Total Cover<br />
% Bare Ground in Herb Stratum: 98%<br />
Dominance Test worksheet:<br />
Number <strong>of</strong> Dominant Species<br />
That Are OBL, FACW, or FAC:<br />
Total Number <strong>of</strong> Dominant<br />
Species Across All Strata:<br />
Percent <strong>of</strong> Dominant Species<br />
That Are OBL, FACW, or FAC:<br />
0 (A)<br />
2 (B)<br />
0 (A/B)<br />
Prevalence Index worksheet:<br />
Total % Cover <strong>of</strong>:<br />
Multiply by:<br />
OBL species 0 x 1 = 0<br />
FACW species 0 x 2 = 0<br />
FAC species 0 x 3 = 0<br />
FACU species 2 x 4 = 8<br />
UPL species 0 x 5 = 0<br />
Column Totals 2 8<br />
Prevalence Index = B/A = 4.00<br />
Hydrophytic Vegetation Indicators:<br />
Dominance Test is >50%<br />
Prevalence Index is ≤3.0 1<br />
Morphological Adaptations 1 (Provide supporting<br />
data in Remarks or on a separate sheet)<br />
Wetland Non-Vascular Plants 1<br />
Problematic Hydrophytic Vegetation 1 (Explain)<br />
1 Indicators <strong>of</strong> hydric soil and wetland hydrology must be<br />
present, unless disturbed or problematic.<br />
Hydrophytic<br />
Vegetation<br />
Present Yes No<br />
US Army Corps <strong>of</strong> Engineers Arid West – Version 2.0
Remarks:<br />
Plot taken in gravel pad upslope <strong>of</strong> edge <strong>of</strong> inundation. Vegetation is generally sparse and comprised <strong>of</strong> weedy forbs.<br />
US Army Corps <strong>of</strong> Engineers Arid West – Version 2.0
SOIL Sampling Point: 12<br />
Pr<strong>of</strong>ile Description: (Describe to the depth needed to document the indicator or confirm the absence <strong>of</strong> indicators.)<br />
Depth Matrix Redox Features<br />
(inches) Color (moist) % Color (moist) % Type 1 Loc 2 Texture Remarks<br />
1 Type: C=Concentration, D=Depletion, RM=Reduced Matrix, CS=Covered or Coated Sand Grains.<br />
2 Location: PL=Pore Lining, M=Matrix.<br />
Hydric Soil Indicators: (Applicable to all LRRs, unless otherwise noted.) Indicators for Problematic Hydric Soils 3 :<br />
Histosol (A1) Sandy Redox (S5) 1 cm Muck (A9) (LRR D)<br />
Histic Epipedon (A2) Stripped Matrix (S6) 2 cm Muck (A10)<br />
Black Histic (A3) Loamy Mucky Mineral (F1) (except MLRA 1) Reduced Vertic (F18)<br />
Hydrogen Sulfide (A4) Loamy Gleyed Matrix (F2) Red Parent Material (TF2)<br />
Stratified Layers (A5) (LRR C) Depleted Matrix (F3) Other (Explain in Remarks)<br />
1 cm Muck (A9) (LRR D) Redox Dark Surface (F6)<br />
Depleted Below Dark Surface (A11) Depleted Dark Surface (F7)<br />
Thick Dark Surface (A12)<br />
Redox Depressions (F8)<br />
3 Indicators <strong>of</strong> hydrophytic vegetation and<br />
Sandy Mucky Mineral (S1) Vernal Pools (F9) wetland hydrology must be present,<br />
Sandy Gleyed Matrix (S4)<br />
unless disturbed or problematic.<br />
Restrictive Layer (if present):<br />
Type: gravel pad<br />
Depth (inches): surface Hydric Soil Present Yes No<br />
Remarks:<br />
Plot taken in gravel pad. No plot excavated.<br />
HYDROLOGY<br />
Wetland Hydrology Indicators:<br />
Primary Indicators (minimum <strong>of</strong> one required; check all that apply)<br />
Secondary Indicators (2 or more required)<br />
Surface Water (A1) Salt Crust (B11) Water Marks (B1) (Riverine)<br />
High Water Table (A2) Biotic Crust (B12) Sediment Deposits (B2) (Riverine)<br />
Saturation (A3) Aquatic Invertebrates (B13) Drift Deposits (B3) (Riverine)<br />
Water Marks (B1) (Nonriverine) Hydrogen Sulfide Odor (C1) Drainage Patterns (B10)<br />
Sediment Deposits (B2) (Nonriverine) Oxidized Rhizospheres along Living Roots (C3) Dry-Season Water Table (C2)<br />
Drift Deposits (B3) (Nonriverine) Presence <strong>of</strong> Reduced Iron (C4) Crayfish Burrows (C8)<br />
Surface Soil Cracks (B6) Recent Iron Reduction in Tilled Soils (C6) Saturation Visible on Aerial Imagery (C9)<br />
Inundation Visible on Aerial Imagery (B7) Thin Muck Surface (C7) Shallow Aquitard (D3)<br />
Water-Stained Leaves (B9) Other (Explain in Remarks) FAC-Neutral Test (D5)<br />
Field Observations:<br />
Surface Water Present Yes No Depth (inches):<br />
Water Table Present Yes No Depth (inches):<br />
Saturation Present Yes No Depth (inches):<br />
Wetland Hydrology Present Yes No<br />
(includes capillary fringe)<br />
Describe Recorded Data (stream gauge, monitoring well, aerial photos, previous inspections), if available:<br />
Remarks:<br />
Plot taken within developed area upslope <strong>of</strong> upper extent <strong>of</strong> inundation. Gravel pad precluded investigation <strong>of</strong> subsurface hydrology indicator<br />
observation.<br />
US Army Corps <strong>of</strong> Engineers Arid West – Version 2.0
<strong>WETLAND</strong> <strong>DETERMINATION</strong> <strong>DATA</strong> <strong>FORM</strong> – Arid West Region<br />
Project/Site: <strong>Pendleton</strong> <strong>City</strong>/County: Umatilla Sampling Date: 4/18, 4/19/2012<br />
Applicant/Owner: <strong>City</strong> <strong>of</strong> <strong>Pendleton</strong> State: OR Sampling Point: 13<br />
Investigator(s): TB/ACS Section, Township, Range:<br />
Landform (hillslope, terrace, etc.): terrace at toe <strong>of</strong> slope Local relief (concave, convex, none) concave Slope (%) flat<br />
Subregion (LRR): Arid Lands Lat: Long: Datum:<br />
Soil Map Unit Name: 28A - Freewater gravelly silt loam, 0-3% NWI Classification:<br />
Are climatic/hydrologic site conditions typical for this time <strong>of</strong> year Yes No (If no, explain in Remarks.)<br />
Are Vegetation Soil or Hydrology significantly disturbed Are “Normal Circumstances” present Yes No<br />
Are Vegetation Soil or Hydrology naturally problematic (If needed, explain any answers in Remarks”)<br />
SUMMARY OF FINDINGS – Attach site map showing sampling point locations, transects, important features, etc.<br />
Hydrophytic Vegetation Present Yes No<br />
Is the Sampled Area<br />
Hydric Soil Present Yes No<br />
within a Wetland Yes No<br />
Wetland Hydrology Present Yes No<br />
Remarks: Depression between railroad and industrial area. Mapped as UR-1. Paired with Plot 14.<br />
VEGETATION – Use scientific names <strong>of</strong> plants.<br />
Absolute Dominant Indicator<br />
Tree Stratum (Plot size: 30' r) % Cover Species Status<br />
1. Salix lucida v. lasiandra 10 FACW<br />
2.<br />
3.<br />
4.<br />
Sapling/Shrub Stratum (Plot size: 5' r)<br />
10% = Total Cover<br />
1. Salix geyeriana 30 FACW<br />
2.<br />
3.<br />
4.<br />
5.<br />
Herb Stratum (Plot size: 5' r)<br />
30% = Total Cover<br />
1. Typha latifolia 100 OBL<br />
2. Lemna minor 5 OBL<br />
3.<br />
4.<br />
5.<br />
6.<br />
7.<br />
8.<br />
9.<br />
10.<br />
11.<br />
Woody Vine Stratum (Plot size: 30' r)<br />
1.<br />
2.<br />
105% = Total Cover<br />
Dominance Test worksheet:<br />
Number <strong>of</strong> Dominant Species<br />
That Are OBL, FACW, or FAC:<br />
Total Number <strong>of</strong> Dominant<br />
Species Across All Strata:<br />
Percent <strong>of</strong> Dominant Species<br />
That Are OBL, FACW, or FAC:<br />
0 = Total Cover<br />
% Bare Ground in Herb Stratum: 0%<br />
Remarks:<br />
Carex sp., Juncus effusus, also present in wetlands with verry shallow to no inundation. Lemna covers open water where Typha cover is lower.<br />
3 (A)<br />
3 (B)<br />
100 (A/B)<br />
Prevalence Index worksheet:<br />
Total % Cover <strong>of</strong>:<br />
Multiply by:<br />
OBL species x 1 =<br />
FACW species x 2 =<br />
FAC species x 3 =<br />
FACU species x 4 =<br />
UPL species x 5 =<br />
Column Totals<br />
Prevalence Index = B/A =<br />
Hydrophytic Vegetation Indicators:<br />
Dominance Test is >50%<br />
Prevalence Index is ≤3.0 1<br />
Morphological Adaptations 1 (Provide supporting<br />
data in Remarks or on a separate sheet)<br />
Wetland Non-Vascular Plants 1<br />
Problematic Hydrophytic Vegetation 1 (Explain)<br />
1 Indicators <strong>of</strong> hydric soil and wetland hydrology must be<br />
present, unless disturbed or problematic.<br />
Hydrophytic<br />
Vegetation<br />
Present Yes No<br />
US Army Corps <strong>of</strong> Engineers Arid West – Version 2.0
SOIL Sampling Point: 13<br />
Pr<strong>of</strong>ile Description: (Describe to the depth needed to document the indicator or confirm the absence <strong>of</strong> indicators.)<br />
Depth Matrix Redox Features<br />
(inches) Color (moist) % Color (moist) % Type 1 Loc 2 Texture Remarks<br />
1 Type: C=Concentration, D=Depletion, RM=Reduced Matrix, CS=Covered or Coated Sand Grains.<br />
2 Location: PL=Pore Lining, M=Matrix.<br />
Hydric Soil Indicators: (Applicable to all LRRs, unless otherwise noted.) Indicators for Problematic Hydric Soils 3 :<br />
Histosol (A1) Sandy Redox (S5) 1 cm Muck (A9) (LRR D)<br />
Histic Epipedon (A2) Stripped Matrix (S6) 2 cm Muck (A10)<br />
Black Histic (A3) Loamy Mucky Mineral (F1) (except MLRA 1) Reduced Vertic (F18)<br />
Hydrogen Sulfide (A4) Loamy Gleyed Matrix (F2) Red Parent Material (TF2)<br />
Stratified Layers (A5) (LRR C) Depleted Matrix (F3) Other (Explain in Remarks)<br />
1 cm Muck (A9) (LRR D) Redox Dark Surface (F6)<br />
Depleted Below Dark Surface (A11) Depleted Dark Surface (F7)<br />
Thick Dark Surface (A12)<br />
Redox Depressions (F8)<br />
3 Indicators <strong>of</strong> hydrophytic vegetation and<br />
Sandy Mucky Mineral (S1) Vernal Pools (F9) wetland hydrology must be present,<br />
Sandy Gleyed Matrix (S4)<br />
unless disturbed or problematic.<br />
Restrictive Layer (if present):<br />
Type:<br />
Depth (inches): Hydric Soil Present Yes No<br />
Remarks:<br />
Developed areas extend right up to maximum extent <strong>of</strong> open water, which is several inches deep. Meets definition <strong>of</strong> hydric soil.<br />
HYDROLOGY<br />
Wetland Hydrology Indicators:<br />
Primary Indicators (minimum <strong>of</strong> one required; check all that apply)<br />
Secondary Indicators (2 or more required)<br />
Surface Water (A1) Salt Crust (B11) Water Marks (B1) (Riverine)<br />
High Water Table (A2) Biotic Crust (B12) Sediment Deposits (B2) (Riverine)<br />
Saturation (A3) Aquatic Invertebrates (B13) Drift Deposits (B3) (Riverine)<br />
Water Marks (B1) (Nonriverine) Hydrogen Sulfide Odor (C1) Drainage Patterns (B10)<br />
Sediment Deposits (B2) (Nonriverine) Oxidized Rhizospheres along Living Roots (C3) Dry-Season Water Table (C2)<br />
Drift Deposits (B3) (Nonriverine) Presence <strong>of</strong> Reduced Iron (C4) Crayfish Burrows (C8)<br />
Surface Soil Cracks (B6) Recent Iron Reduction in Tilled Soils (C6) Saturation Visible on Aerial Imagery (C9)<br />
Inundation Visible on Aerial Imagery (B7) Thin Muck Surface (C7) Shallow Aquitard (D3)<br />
Water-Stained Leaves (B9) Other (Explain in Remarks) FAC-Neutral Test (D5)<br />
Field Observations:<br />
Surface Water Present Yes No Depth (inches):2 inches<br />
Water Table Present Yes No Depth (inches): did not measure<br />
Saturation Present Yes No Depth (inches): did not measure Wetland Hydrology Present Yes No<br />
(includes capillary fringe)<br />
Describe Recorded Data (stream gauge, monitoring well, aerial photos, previous inspections), if available:<br />
Remarks:<br />
Inundation is up to 4 inches deep nearby. Uplands adjacent are an unvegetated gravel pad. Vegetation in uplands consists <strong>of</strong> weedy species such<br />
as Conium maculatum (near the edge <strong>of</strong> inundation), Salsola kali, Sisymbrium altissimum, and other annuals.<br />
US Army Corps <strong>of</strong> Engineers Arid West – Version 2.0
<strong>WETLAND</strong> <strong>DETERMINATION</strong> <strong>DATA</strong> <strong>FORM</strong> – Arid West Region<br />
Project/Site: <strong>Pendleton</strong> <strong>City</strong>/County: Umatilla Sampling Date: 4/18, 4/19/2012<br />
Applicant/Owner: <strong>City</strong> <strong>of</strong> <strong>Pendleton</strong> State: OR Sampling Point: 14<br />
Investigator(s): TB/ACS Section, Township, Range:<br />
Landform (hillslope, terrace, etc.): terrace above wetland Local relief (concave, convex, none) concave Slope (%) flat<br />
Subregion (LRR): Arid Lands Lat: Long: Datum:<br />
Soil Map Unit Name: 28A - Freewater gravelly silt loam, 0-3% NWI Classification:<br />
Are climatic/hydrologic site conditions typical for this time <strong>of</strong> year Yes No (If no, explain in Remarks.)<br />
Are Vegetation Soil or Hydrology significantly disturbed Are “Normal Circumstances” present Yes No<br />
Are Vegetation Soil or Hydrology naturally problematic (If needed, explain any answers in Remarks”)<br />
SUMMARY OF FINDINGS – Attach site map showing sampling point locations, transects, important features, etc.<br />
Hydrophytic Vegetation Present Yes No<br />
Is the Sampled Area<br />
Hydric Soil Present Yes No<br />
within a Wetland Yes No<br />
Wetland Hydrology Present Yes No<br />
Remarks: Depression between railroad and industrial area. Mapped as UR-1.<br />
VEGETATION – Use scientific names <strong>of</strong> plants.<br />
Absolute Dominant Indicator<br />
Tree Stratum (Plot size: 30' r) % Cover Species Status<br />
1.<br />
2.<br />
3.<br />
4.<br />
Sapling/Shrub Stratum (Plot size: 5' r)<br />
1.<br />
2.<br />
3.<br />
4.<br />
5.<br />
Herb Stratum (Plot size: 5' r)<br />
0% = Total Cover<br />
0% = Total Cover<br />
1. Salsola kali 2 NL<br />
2. Sisymbrium altissimum 1 FACU-<br />
3. Conium maculatum 1 FAC+<br />
4.<br />
5.<br />
6.<br />
7.<br />
8.<br />
9.<br />
10.<br />
11.<br />
Woody Vine Stratum (Plot size: 30' r)<br />
1.<br />
2.<br />
4% = Total Cover<br />
Dominance Test worksheet:<br />
Number <strong>of</strong> Dominant Species<br />
That Are OBL, FACW, or FAC:<br />
Total Number <strong>of</strong> Dominant<br />
Species Across All Strata:<br />
Percent <strong>of</strong> Dominant Species<br />
That Are OBL, FACW, or FAC:<br />
0 = Total Cover<br />
% Bare Ground in Herb Stratum: 96%<br />
Remarks:<br />
Gravel pad community. Uplands adjacent to wetlands are an unvegetated gravel pad. Vegetation in uplands consists <strong>of</strong> weedy species such as Conium<br />
maculatum (near the edge <strong>of</strong> inundation), Salsola kali, Sisymbrium altissimum, and other annuals.<br />
1 (A)<br />
3 (B)<br />
33% (A/B)<br />
Prevalence Index worksheet:<br />
Total % Cover <strong>of</strong>:<br />
Multiply by:<br />
OBL species 0 x 1 = 0<br />
FACW species 0 x 2 = 0<br />
FAC species 1 x 3 = 3<br />
FACU species 1 x 4 = 4<br />
UPL species 2 x 5 = 10<br />
Column Totals 4 17<br />
Prevalence Index = B/A = 4.25<br />
Hydrophytic Vegetation Indicators:<br />
Dominance Test is >50%<br />
Prevalence Index is ≤3.0 1<br />
Morphological Adaptations 1 (Provide supporting<br />
data in Remarks or on a separate sheet)<br />
Wetland Non-Vascular Plants 1<br />
Problematic Hydrophytic Vegetation 1 (Explain)<br />
1 Indicators <strong>of</strong> hydric soil and wetland hydrology must be<br />
present, unless disturbed or problematic.<br />
Hydrophytic<br />
Vegetation<br />
Present Yes No<br />
US Army Corps <strong>of</strong> Engineers Arid West – Version 2.0
SOIL Sampling Point: 14<br />
Pr<strong>of</strong>ile Description: (Describe to the depth needed to document the indicator or confirm the absence <strong>of</strong> indicators.)<br />
Depth Matrix Redox Features<br />
(inches) Color (moist) % Color (moist) % Type 1 Loc 2 Texture Remarks<br />
1 Type: C=Concentration, D=Depletion, RM=Reduced Matrix, CS=Covered or Coated Sand Grains.<br />
2 Location: PL=Pore Lining, M=Matrix.<br />
Hydric Soil Indicators: (Applicable to all LRRs, unless otherwise noted.) Indicators for Problematic Hydric Soils 3 :<br />
Histosol (A1) Sandy Redox (S5) 1 cm Muck (A9) (LRR D)<br />
Histic Epipedon (A2) Stripped Matrix (S6) 2 cm Muck (A10)<br />
Black Histic (A3) Loamy Mucky Mineral (F1) (except MLRA 1) Reduced Vertic (F18)<br />
Hydrogen Sulfide (A4) Loamy Gleyed Matrix (F2) Red Parent Material (TF2)<br />
Stratified Layers (A5) (LRR C) Depleted Matrix (F3) Other (Explain in Remarks)<br />
1 cm Muck (A9) (LRR D) Redox Dark Surface (F6)<br />
Depleted Below Dark Surface (A11) Depleted Dark Surface (F7)<br />
Thick Dark Surface (A12)<br />
Redox Depressions (F8)<br />
3 Indicators <strong>of</strong> hydrophytic vegetation and<br />
Sandy Mucky Mineral (S1) Vernal Pools (F9) wetland hydrology must be present,<br />
Sandy Gleyed Matrix (S4)<br />
unless disturbed or problematic.<br />
Restrictive Layer (if present):<br />
Type: Gravel pad<br />
Depth (inches): surface Hydric Soil Present Yes No<br />
Remarks:<br />
HYDROLOGY<br />
Wetland Hydrology Indicators:<br />
Primary Indicators (minimum <strong>of</strong> one required; check all that apply)<br />
Secondary Indicators (2 or more required)<br />
Surface Water (A1) Salt Crust (B11) Water Marks (B1) (Riverine)<br />
High Water Table (A2) Biotic Crust (B12) Sediment Deposits (B2) (Riverine)<br />
Saturation (A3) Aquatic Invertebrates (B13) Drift Deposits (B3) (Riverine)<br />
Water Marks (B1) (Nonriverine) Hydrogen Sulfide Odor (C1) Drainage Patterns (B10)<br />
Sediment Deposits (B2) (Nonriverine) Oxidized Rhizospheres along Living Roots (C3) Dry-Season Water Table (C2)<br />
Drift Deposits (B3) (Nonriverine) Presence <strong>of</strong> Reduced Iron (C4) Crayfish Burrows (C8)<br />
Surface Soil Cracks (B6) Recent Iron Reduction in Tilled Soils (C6) Saturation Visible on Aerial Imagery (C9)<br />
Inundation Visible on Aerial Imagery (B7) Thin Muck Surface (C7) Shallow Aquitard (D3)<br />
Water-Stained Leaves (B9) Other (Explain in Remarks) FAC-Neutral Test (D5)<br />
Field Observations:<br />
Surface Water Present Yes No Depth (inches):<br />
Water Table Present Yes No Depth (inches):<br />
Saturation Present Yes No Depth (inches):<br />
Wetland Hydrology Present Yes No<br />
(includes capillary fringe)<br />
Describe Recorded Data (stream gauge, monitoring well, aerial photos, previous inspections), if available:<br />
Remarks:<br />
Gravel pad precluded plot excavation to determine depth to water table and/or saturation, if present. Vegetation cover gradient suggests water is<br />
increasingly unavailable with distance from open water. Paired with Plot 13.<br />
US Army Corps <strong>of</strong> Engineers Arid West – Version 2.0
<strong>WETLAND</strong> <strong>DETERMINATION</strong> <strong>DATA</strong> <strong>FORM</strong> – Arid West Region<br />
Project/Site: <strong>Pendleton</strong> <strong>City</strong>/County: Umatilla Sampling Date: 4/18/2012<br />
Applicant/Owner: <strong>City</strong> <strong>of</strong> <strong>Pendleton</strong> State: OR Sampling Point: 15<br />
Investigator(s): TB/ACS Section, Township, Range:<br />
Landform (hillslope, terrace, etc.): terrace at toe <strong>of</strong> slope Local relief (concave, convex, none) concave Slope (%) flat<br />
Subregion (LRR): Arid Lands Lat: Long: Datum:<br />
Soil Map Unit Name: Water NWI Classification:<br />
Are climatic/hydrologic site conditions typical for this time <strong>of</strong> year Yes No (If no, explain in Remarks.)<br />
Are Vegetation Soil or Hydrology significantly disturbed Are “Normal Circumstances” present Yes No<br />
Are Vegetation Soil or Hydrology naturally problematic (If needed, explain any answers in Remarks”)<br />
SUMMARY OF FINDINGS – Attach site map showing sampling point locations, transects, important features, etc.<br />
Hydrophytic Vegetation Present Yes No<br />
Hydric Soil Present Yes No<br />
Wetland Hydrology Present Yes No<br />
Is the Sampled Area<br />
within a Wetland Yes No<br />
Remarks: Open water "duck doughnut" in industrial area. Open water surrounded by PEM (as Plot 11) and PSS (as Plot 13). Inaccessible small island in<br />
center <strong>of</strong> open water likely meets 3 criteria for wetland determination. Paired with Plot 16.<br />
VEGETATION – Use scientific names <strong>of</strong> plants.<br />
Absolute Dominant Indicator<br />
Tree Stratum (Plot size: 30' r) % Cover Species Status<br />
1.<br />
2.<br />
3.<br />
4.<br />
Sapling/Shrub Stratum (Plot size: 5' r)<br />
1.<br />
2.<br />
3.<br />
4.<br />
5.<br />
Herb Stratum (Plot size: 5' r)<br />
0% = Total Cover<br />
0% = Total Cover<br />
1. Phalaris arundinacea 100 FACW<br />
2.<br />
3.<br />
4.<br />
5.<br />
6.<br />
7.<br />
8.<br />
9.<br />
10.<br />
11.<br />
Woody Vine Stratum (Plot size: 30' r)<br />
1.<br />
2.<br />
100% = Total Cover<br />
Dominance Test worksheet:<br />
Number <strong>of</strong> Dominant Species<br />
That Are OBL, FACW, or FAC:<br />
Total Number <strong>of</strong> Dominant<br />
Species Across All Strata:<br />
Percent <strong>of</strong> Dominant Species<br />
That Are OBL, FACW, or FAC:<br />
0 = Total Cover<br />
% Bare Ground in Herb Stratum: 0%<br />
Remarks:<br />
Thin margin <strong>of</strong> Phalaris at edge <strong>of</strong> open water. Open water is unvegetated. Adjacent uplands are developed gravel/rock pads with little vegetation. Upland<br />
species present include Conyza canadensis, Cirsium vulgare, Bromus tectorum.<br />
1 (A)<br />
1 (B)<br />
1 (A/B)<br />
Prevalence Index worksheet:<br />
Total % Cover <strong>of</strong>:<br />
Multiply by:<br />
OBL species x 1 =<br />
FACW species x 2 =<br />
FAC species x 3 =<br />
FACU species x 4 =<br />
UPL species x 5 =<br />
Column Totals<br />
Prevalence Index = B/A =<br />
Hydrophytic Vegetation Indicators:<br />
Dominance Test is >50%<br />
Prevalence Index is ≤3.0 1<br />
Morphological Adaptations 1 (Provide supporting<br />
data in Remarks or on a separate sheet)<br />
Wetland Non-Vascular Plants 1<br />
Problematic Hydrophytic Vegetation 1 (Explain)<br />
1 Indicators <strong>of</strong> hydric soil and wetland hydrology must be<br />
present, unless disturbed or problematic.<br />
Hydrophytic<br />
Vegetation<br />
Present Yes No<br />
US Army Corps <strong>of</strong> Engineers Arid West – Version 2.0
SOIL Sampling Point: 15<br />
Pr<strong>of</strong>ile Description: (Describe to the depth needed to document the indicator or confirm the absence <strong>of</strong> indicators.)<br />
Depth Matrix Redox Features<br />
(inches) Color (moist) % Color (moist) % Type 1 Loc 2 Texture Remarks<br />
1 Type: C=Concentration, D=Depletion, RM=Reduced Matrix, CS=Covered or Coated Sand Grains.<br />
2 Location: PL=Pore Lining, M=Matrix.<br />
Hydric Soil Indicators: (Applicable to all LRRs, unless otherwise noted.) Indicators for Problematic Hydric Soils 3 :<br />
Histosol (A1) Sandy Redox (S5) 1 cm Muck (A9) (LRR D)<br />
Histic Epipedon (A2) Stripped Matrix (S6) 2 cm Muck (A10)<br />
Black Histic (A3) Loamy Mucky Mineral (F1) (except MLRA 1) Reduced Vertic (F18)<br />
Hydrogen Sulfide (A4) Loamy Gleyed Matrix (F2) Red Parent Material (TF2)<br />
Stratified Layers (A5) (LRR C) Depleted Matrix (F3) Other (Explain in Remarks)<br />
1 cm Muck (A9) (LRR D) Redox Dark Surface (F6)<br />
Depleted Below Dark Surface (A11) Depleted Dark Surface (F7)<br />
Thick Dark Surface (A12)<br />
Redox Depressions (F8)<br />
3 Indicators <strong>of</strong> hydrophytic vegetation and<br />
Sandy Mucky Mineral (S1) Vernal Pools (F9) wetland hydrology must be present,<br />
Sandy Gleyed Matrix (S4)<br />
unless disturbed or problematic.<br />
Restrictive Layer (if present):<br />
Type:<br />
Depth (inches): Hydric Soil Present Yes No<br />
Remarks:<br />
Open water: meets definition <strong>of</strong> hydric soil.<br />
HYDROLOGY<br />
Wetland Hydrology Indicators:<br />
Primary Indicators (minimum <strong>of</strong> one required; check all that apply)<br />
Secondary Indicators (2 or more required)<br />
Surface Water (A1) Salt Crust (B11) Water Marks (B1) (Riverine)<br />
High Water Table (A2) Biotic Crust (B12) Sediment Deposits (B2) (Riverine)<br />
Saturation (A3) Aquatic Invertebrates (B13) Drift Deposits (B3) (Riverine)<br />
Water Marks (B1) (Nonriverine) Hydrogen Sulfide Odor (C1) Drainage Patterns (B10)<br />
Sediment Deposits (B2) (Nonriverine) Oxidized Rhizospheres along Living Roots (C3) Dry-Season Water Table (C2)<br />
Drift Deposits (B3) (Nonriverine) Presence <strong>of</strong> Reduced Iron (C4) Crayfish Burrows (C8)<br />
Surface Soil Cracks (B6) Recent Iron Reduction in Tilled Soils (C6) Saturation Visible on Aerial Imagery (C9)<br />
Inundation Visible on Aerial Imagery (B7) Thin Muck Surface (C7) Shallow Aquitard (D3)<br />
Water-Stained Leaves (B9) Other (Explain in Remarks) FAC-Neutral Test (D5)<br />
Field Observations:<br />
Surface Water Present Yes No Depth (inches):2 inches at edge<br />
Water Table Present Yes No Depth (inches): did not measure<br />
Saturation Present Yes No Depth (inches): did not measure Wetland Hydrology Present Yes No<br />
(includes capillary fringe)<br />
Describe Recorded Data (stream gauge, monitoring well, aerial photos, previous inspections), if available:<br />
Remarks:<br />
Maximum depth <strong>of</strong> water is unknown. This may be an old mitigation site.<br />
US Army Corps <strong>of</strong> Engineers Arid West – Version 2.0
<strong>WETLAND</strong> <strong>DETERMINATION</strong> <strong>DATA</strong> <strong>FORM</strong> – Arid West Region<br />
Project/Site: <strong>Pendleton</strong> <strong>City</strong>/County: Umatilla Sampling Date: 4/18/2012<br />
Applicant/Owner: <strong>City</strong> <strong>of</strong> <strong>Pendleton</strong> State: OR Sampling Point: 16<br />
Investigator(s): TB/ACS Section, Township, Range:<br />
Landform (hillslope, terrace, etc.): terrace above open water Local relief (concave, convex, none) concave Slope (%) flat<br />
Subregion (LRR): Arid Lands Lat: Long: Datum:<br />
Soil Map Unit Name: 28A - Freewater gravelly silt loam, 0-3% NWI Classification:<br />
Are climatic/hydrologic site conditions typical for this time <strong>of</strong> year Yes No (If no, explain in Remarks.)<br />
Are Vegetation Soil or Hydrology significantly disturbed Are “Normal Circumstances” present Yes No<br />
Are Vegetation Soil or Hydrology naturally problematic (If needed, explain any answers in Remarks”)<br />
SUMMARY OF FINDINGS – Attach site map showing sampling point locations, transects, important features, etc.<br />
Hydrophytic Vegetation Present Yes No<br />
Hydric Soil Present Yes No<br />
Wetland Hydrology Present Yes No<br />
Remarks: Gravel pad above open water "duck doughnut" in industrial area.<br />
Is the Sampled Area<br />
within a Wetland Yes No<br />
VEGETATION – Use scientific names <strong>of</strong> plants.<br />
Absolute Dominant Indicator<br />
Tree Stratum (Plot size: 30' r) % Cover Species Status<br />
1.<br />
2.<br />
3.<br />
4.<br />
0% = Total Cover<br />
Sapling/Shrub Stratum (Plot size: 5' r)<br />
1.<br />
2.<br />
3.<br />
4.<br />
5.<br />
0% = Total Cover<br />
Herb Stratum (Plot size: 5' r)<br />
1. Bromus tectorum 10 FACU<br />
2. Conyza canadensis 2 FACU<br />
3. Cirsium vulgare 2 FACU<br />
4.<br />
5.<br />
6.<br />
7.<br />
8.<br />
9.<br />
10.<br />
11.<br />
14% = Total Cover<br />
Woody Vine Stratum (Plot size: 30' r)<br />
1.<br />
2.<br />
0 = Total Cover<br />
% Bare Ground in Herb Stratum: 86%<br />
Remarks:<br />
Vegetation cover generally decreases with increasing distance from jurisdictional boundary.<br />
Dominance Test worksheet:<br />
Number <strong>of</strong> Dominant Species<br />
That Are OBL, FACW, or FAC:<br />
Total Number <strong>of</strong> Dominant<br />
Species Across All Strata:<br />
Percent <strong>of</strong> Dominant Species<br />
That Are OBL, FACW, or FAC:<br />
1 (A)<br />
1 (B)<br />
1 (A/B)<br />
Prevalence Index worksheet:<br />
Total % Cover <strong>of</strong>:<br />
Multiply by:<br />
OBL species x 1 =<br />
FACW species x 2 =<br />
FAC species x 3 =<br />
FACU species x 4 =<br />
UPL species x 5 =<br />
Column Totals<br />
Prevalence Index = B/A =<br />
Hydrophytic Vegetation Indicators:<br />
Dominance Test is >50%<br />
Prevalence Index is ≤3.0 1<br />
Morphological Adaptations 1 (Provide supporting<br />
data in Remarks or on a separate sheet)<br />
Wetland Non-Vascular Plants 1<br />
Problematic Hydrophytic Vegetation 1 (Explain)<br />
1 Indicators <strong>of</strong> hydric soil and wetland hydrology must be<br />
present, unless disturbed or problematic.<br />
Hydrophytic<br />
Vegetation<br />
Present Yes No<br />
US Army Corps <strong>of</strong> Engineers Arid West – Version 2.0
SOIL Sampling Point: 16<br />
Pr<strong>of</strong>ile Description: (Describe to the depth needed to document the indicator or confirm the absence <strong>of</strong> indicators.)<br />
Depth Matrix Redox Features<br />
(inches) Color (moist) % Color (moist) % Type 1 Loc 2 Texture Remarks<br />
1 Type: C=Concentration, D=Depletion, RM=Reduced Matrix, CS=Covered or Coated Sand Grains.<br />
2 Location: PL=Pore Lining, M=Matrix.<br />
Hydric Soil Indicators: (Applicable to all LRRs, unless otherwise noted.) Indicators for Problematic Hydric Soils 3 :<br />
Histosol (A1) Sandy Redox (S5) 1 cm Muck (A9) (LRR D)<br />
Histic Epipedon (A2) Stripped Matrix (S6) 2 cm Muck (A10)<br />
Black Histic (A3) Loamy Mucky Mineral (F1) (except MLRA 1) Reduced Vertic (F18)<br />
Hydrogen Sulfide (A4) Loamy Gleyed Matrix (F2) Red Parent Material (TF2)<br />
Stratified Layers (A5) (LRR C) Depleted Matrix (F3) Other (Explain in Remarks)<br />
1 cm Muck (A9) (LRR D) Redox Dark Surface (F6)<br />
Depleted Below Dark Surface (A11) Depleted Dark Surface (F7)<br />
Thick Dark Surface (A12)<br />
Redox Depressions (F8)<br />
3 Indicators <strong>of</strong> hydrophytic vegetation and<br />
Sandy Mucky Mineral (S1) Vernal Pools (F9) wetland hydrology must be present,<br />
Sandy Gleyed Matrix (S4)<br />
unless disturbed or problematic.<br />
Restrictive Layer (if present):<br />
Type: Gravel pad<br />
Depth (inches): surface Hydric Soil Present Yes No<br />
Remarks:<br />
HYDROLOGY<br />
Wetland Hydrology Indicators:<br />
Primary Indicators (minimum <strong>of</strong> one required; check all that apply)<br />
Secondary Indicators (2 or more required)<br />
Surface Water (A1) Salt Crust (B11) Water Marks (B1) (Riverine)<br />
High Water Table (A2) Biotic Crust (B12) Sediment Deposits (B2) (Riverine)<br />
Saturation (A3) Aquatic Invertebrates (B13) Drift Deposits (B3) (Riverine)<br />
Water Marks (B1) (Nonriverine) Hydrogen Sulfide Odor (C1) Drainage Patterns (B10)<br />
Sediment Deposits (B2) (Nonriverine) Oxidized Rhizospheres along Living Roots (C3) Dry-Season Water Table (C2)<br />
Drift Deposits (B3) (Nonriverine) Presence <strong>of</strong> Reduced Iron (C4) Crayfish Burrows (C8)<br />
Surface Soil Cracks (B6) Recent Iron Reduction in Tilled Soils (C6) Saturation Visible on Aerial Imagery (C9)<br />
Inundation Visible on Aerial Imagery (B7) Thin Muck Surface (C7) Shallow Aquitard (D3)<br />
Water-Stained Leaves (B9) Other (Explain in Remarks) FAC-Neutral Test (D5)<br />
Field Observations:<br />
Surface Water Present Yes No Depth (inches):<br />
Water Table Present Yes No Depth (inches):<br />
Saturation Present Yes No Depth (inches):<br />
Wetland Hydrology Present Yes No<br />
(includes capillary fringe)<br />
Describe Recorded Data (stream gauge, monitoring well, aerial photos, previous inspections), if available:<br />
Remarks:<br />
Plot taken on gravel pad above upper limit <strong>of</strong> evidence <strong>of</strong> inundation.<br />
US Army Corps <strong>of</strong> Engineers Arid West – Version 2.0
<strong>WETLAND</strong> <strong>DETERMINATION</strong> <strong>DATA</strong> <strong>FORM</strong> – Arid West Region<br />
Project/Site: <strong>Pendleton</strong> <strong>City</strong>/County: Umatilla Sampling Date: 4/19/2012<br />
Applicant/Owner: <strong>City</strong> <strong>of</strong> <strong>Pendleton</strong> State: OR Sampling Point: 17<br />
Investigator(s): TB/ACS/PR Section, Township, Range:<br />
Landform (hillslope, terrace, etc.): terrace Local relief (concave, convex, none) concave Slope (%) flat<br />
Subregion (LRR): Arid Lands Lat: Long: Datum:<br />
Soil Map Unit Name: 126A: Xer<strong>of</strong>luvents, 0-3% slopes NWI Classification:<br />
Are climatic/hydrologic site conditions typical for this time <strong>of</strong> year Yes No (If no, explain in Remarks.)<br />
Are Vegetation Soil or Hydrology significantly disturbed Are “Normal Circumstances” present Yes No<br />
Are Vegetation Soil or Hydrology naturally problematic (If needed, explain any answers in Remarks”)<br />
SUMMARY OF FINDINGS – Attach site map showing sampling point locations, transects, important features, etc.<br />
Hydrophytic Vegetation Present Yes No<br />
Hydric Soil Present Yes No<br />
Wetland Hydrology Present Yes No<br />
Is the Sampled Area<br />
within a Wetland Yes No<br />
Remarks: Terrace above the Umatilla River. No inundation at this location; it appears to stop about 100 feet to upstream. Property 62, South <strong>of</strong> Carden<br />
Avenue, north side <strong>of</strong> Umatilla River, near 14 th Street.<br />
VEGETATION – Use scientific names <strong>of</strong> plants.<br />
Absolute Dominant Indicator<br />
Tree Stratum (Plot size: 30' r) % Cover Species Status<br />
1.<br />
2.<br />
3.<br />
4.<br />
0% = Total Cover<br />
Sapling/Shrub Stratum (Plot size: 5' r)<br />
1.<br />
2.<br />
3.<br />
4.<br />
5.<br />
0% = Total Cover<br />
Herb Stratum (Plot size: 5' r)<br />
1. Poa bulbosa 45 FAC<br />
2. Bromus tectorum 20 NL<br />
3. Bromus rigidus 15 NL<br />
4.<br />
5.<br />
6.<br />
7.<br />
8.<br />
9.<br />
10.<br />
11.<br />
90% = Total Cover<br />
Woody Vine Stratum (Plot size: 15' r)<br />
1.<br />
2.<br />
0 = Total Cover<br />
% Bare Ground in Herb Stratum: 10%<br />
Remarks:<br />
Dominance Test worksheet:<br />
Number <strong>of</strong> Dominant Species<br />
That Are OBL, FACW, or FAC:<br />
Total Number <strong>of</strong> Dominant<br />
Species Across All Strata:<br />
Percent <strong>of</strong> Dominant Species<br />
That Are OBL, FACW, or FAC:<br />
1 (A)<br />
2 (B)<br />
50 (A/B)<br />
Prevalence Index worksheet:<br />
Total % Cover <strong>of</strong>:<br />
Multiply by:<br />
OBL species 0 x 1 = 0<br />
FACW species 0 x 2 = 0<br />
FAC species 45 x 3 = 135<br />
FACU species 0 x 4 = 0<br />
UPL species 35 x 5 = 175<br />
Column Totals 90 310<br />
Prevalence Index = B/A = 3.44<br />
Hydrophytic Vegetation Indicators:<br />
Dominance Test is >50%<br />
Prevalence Index is ≤3.0 1<br />
Morphological Adaptations 1 (Provide supporting<br />
data in Remarks or on a separate sheet)<br />
Wetland Non-Vascular Plants 1<br />
Problematic Hydrophytic Vegetation 1 (Explain)<br />
1 Indicators <strong>of</strong> hydric soil and wetland hydrology must be<br />
present, unless disturbed or problematic.<br />
Hydrophytic<br />
Vegetation<br />
Present Yes No<br />
US Army Corps <strong>of</strong> Engineers Arid West – Version 2.0
SOIL Sampling Point: 17<br />
Pr<strong>of</strong>ile Description: (Describe to the depth needed to document the indicator or confirm the absence <strong>of</strong> indicators.)<br />
Depth Matrix Redox Features<br />
(inches) Color (moist) % Color (moist) % Type 1 Loc 2 Texture Remarks<br />
0-20 10YR 4/2 100 sandy loam<br />
20-23 10YR 4/2 99 10YR 4/4 1 C M sandy loam very few redox features<br />
1 Type: C=Concentration, D=Depletion, RM=Reduced Matrix, CS=Covered or Coated Sand Grains.<br />
2 Location: PL=Pore Lining, M=Matrix.<br />
Hydric Soil Indicators: (Applicable to all LRRs, unless otherwise noted.) Indicators for Problematic Hydric Soils 3 :<br />
Histosol (A1) Sandy Redox (S5) 1 cm Muck (A9) (LRR D)<br />
Histic Epipedon (A2) Stripped Matrix (S6) 2 cm Muck (A10)<br />
Black Histic (A3) Loamy Mucky Mineral (F1) (except MLRA 1) Reduced Vertic (F18)<br />
Hydrogen Sulfide (A4) Loamy Gleyed Matrix (F2) Red Parent Material (TF2)<br />
Stratified Layers (A5) (LRR C) Depleted Matrix (F3) Other (Explain in Remarks)<br />
1 cm Muck (A9) (LRR D) Redox Dark Surface (F6)<br />
Depleted Below Dark Surface (A11) Depleted Dark Surface (F7)<br />
Thick Dark Surface (A12)<br />
Redox Depressions (F8)<br />
3 Indicators <strong>of</strong> hydrophytic vegetation and<br />
Sandy Mucky Mineral (S1) Vernal Pools (F9) wetland hydrology must be present,<br />
Sandy Gleyed Matrix (S4)<br />
unless disturbed or problematic.<br />
Restrictive Layer (if present):<br />
Type:<br />
Depth (inches): Hydric Soil Present Yes No<br />
Remarks:<br />
Well drained soil<br />
HYDROLOGY<br />
Wetland Hydrology Indicators:<br />
Primary Indicators (minimum <strong>of</strong> one required; check all that apply)<br />
Secondary Indicators (2 or more required)<br />
Surface Water (A1) Salt Crust (B11) Water Marks (B1) (Riverine)<br />
High Water Table (A2) Biotic Crust (B12) Sediment Deposits (B2) (Riverine)<br />
Saturation (A3) Aquatic Invertebrates (B13) Drift Deposits (B3) (Riverine)<br />
Water Marks (B1) (Nonriverine) Hydrogen Sulfide Odor (C1) Drainage Patterns (B10)<br />
Sediment Deposits (B2) (Nonriverine) Oxidized Rhizospheres along Living Roots (C3) Dry-Season Water Table (C2)<br />
Drift Deposits (B3) (Nonriverine) Presence <strong>of</strong> Reduced Iron (C4) Crayfish Burrows (C8)<br />
Surface Soil Cracks (B6) Recent Iron Reduction in Tilled Soils (C6) Saturation Visible on Aerial Imagery (C9)<br />
Inundation Visible on Aerial Imagery (B7) Thin Muck Surface (C7) Shallow Aquitard (D3)<br />
Water-Stained Leaves (B9) Other (Explain in Remarks) FAC-Neutral Test (D5)<br />
Field Observations:<br />
Surface Water Present Yes No Depth (inches):<br />
Water Table Present Yes No Depth (inches):<br />
Saturation Present Yes No Depth (inches):<br />
Wetland Hydrology Present Yes No<br />
(includes capillary fringe)<br />
Describe Recorded Data (stream gauge, monitoring well, aerial photos, previous inspections), if available:<br />
Remarks:<br />
Soil is dry to touch at 23 inches. No surface indicators <strong>of</strong> wetland hydrology.<br />
US Army Corps <strong>of</strong> Engineers Arid West – Version 2.0
<strong>WETLAND</strong> <strong>DETERMINATION</strong> <strong>DATA</strong> <strong>FORM</strong> – Arid West Region<br />
Project/Site: <strong>Pendleton</strong> <strong>City</strong>/County: Umatilla Sampling Date: 4/19/2012<br />
Applicant/Owner: <strong>City</strong> <strong>of</strong> <strong>Pendleton</strong> State: OR Sampling Point: 18<br />
Investigator(s): ACS/PR Section, Township, Range:<br />
Landform (hillslope, terrace, etc.): terrace Local relief (concave, convex, none) concave Slope (%) flat<br />
Subregion (LRR): Arid Lands Lat: Long: Datum:<br />
Soil Map Unit Name: water NWI Classification:<br />
Are climatic/hydrologic site conditions typical for this time <strong>of</strong> year Yes No (If no, explain in Remarks.)<br />
Are Vegetation Soil or Hydrology significantly disturbed Are “Normal Circumstances” present Yes No<br />
Are Vegetation Soil or Hydrology naturally problematic (If needed, explain any answers in Remarks”)<br />
SUMMARY OF FINDINGS – Attach site map showing sampling point locations, transects, important features, etc.<br />
Hydrophytic Vegetation Present Yes No<br />
Hydric Soil Present Yes No<br />
Wetland Hydrology Present Yes No<br />
Is the Sampled Area<br />
within a Wetland Yes No<br />
Remarks: Floodplain <strong>of</strong> the Umatilla River, south end <strong>of</strong> Bedford Pedestrian Bridge, east <strong>of</strong> abutment. Paired with Plot 19. Plot is below OHWM, treated<br />
as Water <strong>of</strong> the State.<br />
VEGETATION – Use scientific names <strong>of</strong> plants.<br />
Absolute Dominant Indicator<br />
Tree Stratum (Plot size: 30' r) % Cover Species Status<br />
1.<br />
2.<br />
3.<br />
4.<br />
0% = Total Cover<br />
Sapling/Shrub Stratum (Plot size: 5' r)<br />
1. Alnus rhombifolia 25 FACW<br />
2. Acer negundo 20 FAC+<br />
3.<br />
4.<br />
5.<br />
45% = Total Cover<br />
Herb Stratum (Plot size: 5' r)<br />
1. Phalaris arundinacea 60 FACW<br />
2.<br />
3.<br />
4.<br />
5.<br />
6.<br />
7.<br />
8.<br />
9.<br />
10.<br />
11.<br />
60% = Total Cover<br />
Woody Vine Stratum (Plot size: 30' r)<br />
1.<br />
2.<br />
0 = Total Cover<br />
% Bare Ground in Herb Stratum: 40%<br />
Remarks:<br />
Dominance Test worksheet:<br />
Number <strong>of</strong> Dominant Species<br />
That Are OBL, FACW, or FAC:<br />
Total Number <strong>of</strong> Dominant<br />
Species Across All Strata:<br />
Percent <strong>of</strong> Dominant Species<br />
That Are OBL, FACW, or FAC:<br />
3 (A)<br />
3 (B)<br />
100 (A/B)<br />
Prevalence Index worksheet:<br />
Total % Cover <strong>of</strong>:<br />
Multiply by:<br />
OBL species x 1 =<br />
FACW species x 2 =<br />
FAC species x 3 =<br />
FACU species x 4 =<br />
UPL species x 5 =<br />
Column Totals<br />
Prevalence Index = B/A =<br />
Hydrophytic Vegetation Indicators:<br />
Dominance Test is >50%<br />
Prevalence Index is ≤3.0 1<br />
Morphological Adaptations 1 (Provide supporting<br />
data in Remarks or on a separate sheet)<br />
Wetland Non-Vascular Plants 1<br />
Problematic Hydrophytic Vegetation 1 (Explain)<br />
1 Indicators <strong>of</strong> hydric soil and wetland hydrology must be<br />
present, unless disturbed or problematic.<br />
Hydrophytic<br />
Vegetation<br />
Present Yes No<br />
US Army Corps <strong>of</strong> Engineers Arid West – Version 2.0
SOIL Sampling Point: 18<br />
Pr<strong>of</strong>ile Description: (Describe to the depth needed to document the indicator or confirm the absence <strong>of</strong> indicators.)<br />
Depth Matrix Redox Features<br />
(inches) Color (moist) % Color (moist) % Type 1 Loc 2 Texture Remarks<br />
0-18 10YR 3/2 100 silt loam less sandy than elsewhere<br />
18-23 10YR 3/2 97 7.5YR 3/4 3 C M silt loam<br />
1 Type: C=Concentration, D=Depletion, RM=Reduced Matrix, CS=Covered or Coated Sand Grains.<br />
2 Location: PL=Pore Lining, M=Matrix.<br />
Hydric Soil Indicators: (Applicable to all LRRs, unless otherwise noted.) Indicators for Problematic Hydric Soils 3 :<br />
Histosol (A1) Sandy Redox (S5) 1 cm Muck (A9) (LRR D)<br />
Histic Epipedon (A2) Stripped Matrix (S6) 2 cm Muck (A10)<br />
Black Histic (A3) Loamy Mucky Mineral (F1) (except MLRA 1) Reduced Vertic (F18)<br />
Hydrogen Sulfide (A4) Loamy Gleyed Matrix (F2) Red Parent Material (TF2)<br />
Stratified Layers (A5) (LRR C) Depleted Matrix (F3) Other (Explain in Remarks)<br />
1 cm Muck (A9) (LRR D) Redox Dark Surface (F6)<br />
Depleted Below Dark Surface (A11) Depleted Dark Surface (F7)<br />
Thick Dark Surface (A12)<br />
Redox Depressions (F8)<br />
3 Indicators <strong>of</strong> hydrophytic vegetation and<br />
Sandy Mucky Mineral (S1) Vernal Pools (F9) wetland hydrology must be present,<br />
Sandy Gleyed Matrix (S4)<br />
unless disturbed or problematic.<br />
Restrictive Layer (if present):<br />
Type:<br />
Depth (inches): Hydric Soil Present Yes No<br />
Remarks:<br />
Per Chapter 5: soil is apparently <strong>of</strong> recent deposition at this location. Treated as a Problem Soil.<br />
HYDROLOGY<br />
Wetland Hydrology Indicators:<br />
Primary Indicators (minimum <strong>of</strong> one required; check all that apply)<br />
Secondary Indicators (2 or more required)<br />
Surface Water (A1) Salt Crust (B11) Water Marks (B1) (Riverine)<br />
High Water Table (A2) Biotic Crust (B12) Sediment Deposits (B2) (Riverine)<br />
Saturation (A3) Aquatic Invertebrates (B13) Drift Deposits (B3) (Riverine)<br />
Water Marks (B1) (Nonriverine) Hydrogen Sulfide Odor (C1) Drainage Patterns (B10)<br />
Sediment Deposits (B2) (Nonriverine) Oxidized Rhizospheres along Living Roots (C3) Dry-Season Water Table (C2)<br />
Drift Deposits (B3) (Nonriverine) Presence <strong>of</strong> Reduced Iron (C4) Crayfish Burrows (C8)<br />
Surface Soil Cracks (B6) Recent Iron Reduction in Tilled Soils (C6) Saturation Visible on Aerial Imagery (C9)<br />
Inundation Visible on Aerial Imagery (B7) Thin Muck Surface (C7) Shallow Aquitard (D3)<br />
Water-Stained Leaves (B9) Other (Explain in Remarks) FAC-Neutral Test (D5)<br />
Field Observations:<br />
Surface Water Present Yes No Depth (inches):<br />
Water Table Present Yes No Depth (inches): 12<br />
Saturation Present Yes No Depth (inches): 8<br />
Wetland Hydrology Present Yes No<br />
(includes capillary fringe)<br />
Describe Recorded Data (stream gauge, monitoring well, aerial photos, previous inspections), if available:<br />
Remarks:<br />
Wrack lines are approximately 2 feet above the plot surface at this location. Phalaris clearly shows evidence <strong>of</strong> water flow (all blades flattened and<br />
pointing downstream, sediment deposition).<br />
US Army Corps <strong>of</strong> Engineers Arid West – Version 2.0
<strong>WETLAND</strong> <strong>DETERMINATION</strong> <strong>DATA</strong> <strong>FORM</strong> – Arid West Region<br />
Project/Site: <strong>Pendleton</strong> <strong>City</strong>/County: Umatilla Sampling Date: 4/19/2012<br />
Applicant/Owner: <strong>City</strong> <strong>of</strong> <strong>Pendleton</strong> State: OR Sampling Point: 19<br />
Investigator(s): ACS/PR Section, Township, Range:<br />
Landform (hillslope, terrace, etc.): terrace Local relief (concave, convex, none) none Slope (%) flat<br />
Subregion (LRR): Arid Lands Lat: Long: Datum:<br />
Soil Map Unit Name: 129A: Yakima-Urban Land, 0-3% NWI Classification:<br />
Are climatic/hydrologic site conditions typical for this time <strong>of</strong> year Yes No (If no, explain in Remarks.)<br />
Are Vegetation Soil or Hydrology significantly disturbed Are “Normal Circumstances” present Yes No<br />
Are Vegetation Soil or Hydrology naturally problematic (If needed, explain any answers in Remarks”)<br />
SUMMARY OF FINDINGS – Attach site map showing sampling point locations, transects, important features, etc.<br />
Hydrophytic Vegetation Present Yes No<br />
Hydric Soil Present Yes No<br />
Wetland Hydrology Present Yes No<br />
Is the Sampled Area<br />
within a Wetland Yes No<br />
Remarks: South bank <strong>of</strong> Umatilla River. The channel braids on both sides, forming linear, tapering islands. Some areas <strong>of</strong> sediment deposition and<br />
accretion are present. Lower islands are vegetated with isolated scour from flowing water. Higher bench has a mix <strong>of</strong> trees, shrubs and <strong>of</strong>ten weedy<br />
herbaceous species. Paired with Plot 18.<br />
VEGETATION – Use scientific names <strong>of</strong> plants.<br />
Absolute Dominant Indicator<br />
Tree Stratum (Plot size: 30' r) % Cover Species Status<br />
1.<br />
2.<br />
3.<br />
4.<br />
0% = Total Cover<br />
Sapling/Shrub Stratum (Plot size: 5' r)<br />
1.<br />
2.<br />
3.<br />
4.<br />
5.<br />
0% = Total Cover<br />
Herb Stratum (Plot size: 5' r)<br />
1. Phalaris arundinacea 100 FACW<br />
2.<br />
3.<br />
4.<br />
5.<br />
6.<br />
7.<br />
8.<br />
9.<br />
10.<br />
11.<br />
100% = Total Cover<br />
Woody Vine Stratum (Plot size: 30' r)<br />
1.<br />
2.<br />
0 = Total Cover<br />
% Bare Ground in Herb Stratum: 0%<br />
Dominance Test worksheet:<br />
Number <strong>of</strong> Dominant Species<br />
That Are OBL, FACW, or FAC:<br />
Total Number <strong>of</strong> Dominant<br />
Species Across All Strata:<br />
Percent <strong>of</strong> Dominant Species<br />
That Are OBL, FACW, or FAC:<br />
1 (A)<br />
1 (B)<br />
100 (A/B)<br />
Prevalence Index worksheet:<br />
Total % Cover <strong>of</strong>:<br />
Multiply by:<br />
OBL species x 1 =<br />
FACW species x 2 =<br />
FAC species x 3 =<br />
FACU species x 4 =<br />
UPL species x 5 =<br />
Column Totals<br />
Prevalence Index = B/A =<br />
Hydrophytic Vegetation Indicators:<br />
Dominance Test is >50%<br />
Prevalence Index is ≤3.0 1<br />
Morphological Adaptations 1 (Provide supporting<br />
data in Remarks or on a separate sheet)<br />
Wetland Non-Vascular Plants 1<br />
Problematic Hydrophytic Vegetation 1 (Explain)<br />
1 Indicators <strong>of</strong> hydric soil and wetland hydrology must be<br />
present, unless disturbed or problematic.<br />
Hydrophytic<br />
Vegetation<br />
Present Yes No<br />
US Army Corps <strong>of</strong> Engineers Arid West – Version 2.0
Remarks:<br />
Plot taken in most hydrophytic part <strong>of</strong> otherwise drier terrace community. Also at this elevation are Ulmus sp., Rosa sp., Malus sp., Taraxacum <strong>of</strong>ficinale,<br />
Galium aparine, Onopordium acanthum. Clematis is an established weed here.<br />
US Army Corps <strong>of</strong> Engineers Arid West – Version 2.0
SOIL Sampling Point: 19<br />
Pr<strong>of</strong>ile Description: (Describe to the depth needed to document the indicator or confirm the absence <strong>of</strong> indicators.)<br />
Depth Matrix Redox Features<br />
(inches) Color (moist) % Color (moist) % Type 1 Loc 2 Texture Remarks<br />
0-4 10YR 3/2 100 silt loam many fine roots<br />
4-10 10YR 3/2 100 fine sandy loam no roots<br />
10-20 10YR 3/2 95 7.5YR 4/4 5 C M/PL fine sandy loam not roots, occasional cobble<br />
1 Type: C=Concentration, D=Depletion, RM=Reduced Matrix, CS=Covered or Coated Sand Grains.<br />
2 Location: PL=Pore Lining, M=Matrix.<br />
Hydric Soil Indicators: (Applicable to all LRRs, unless otherwise noted.) Indicators for Problematic Hydric Soils 3 :<br />
Histosol (A1) Sandy Redox (S5) 1 cm Muck (A9) (LRR D)<br />
Histic Epipedon (A2) Stripped Matrix (S6) 2 cm Muck (A10)<br />
Black Histic (A3) Loamy Mucky Mineral (F1) (except MLRA 1) Reduced Vertic (F18)<br />
Hydrogen Sulfide (A4) Loamy Gleyed Matrix (F2) Red Parent Material (TF2)<br />
Stratified Layers (A5) (LRR C) Depleted Matrix (F3) Other (Explain in Remarks)<br />
1 cm Muck (A9) (LRR D) Redox Dark Surface (F6)<br />
Depleted Below Dark Surface (A11) Depleted Dark Surface (F7)<br />
Thick Dark Surface (A12)<br />
Redox Depressions (F8)<br />
3 Indicators <strong>of</strong> hydrophytic vegetation and<br />
Sandy Mucky Mineral (S1) Vernal Pools (F9) wetland hydrology must be present,<br />
Sandy Gleyed Matrix (S4)<br />
unless disturbed or problematic.<br />
Restrictive Layer (if present):<br />
Type:<br />
Depth (inches): Hydric Soil Present Yes No<br />
Remarks:<br />
Plot at borderline <strong>of</strong> hydric/non-hydric transition. Well drained soil.<br />
HYDROLOGY<br />
Wetland Hydrology Indicators:<br />
Primary Indicators (minimum <strong>of</strong> one required; check all that apply)<br />
Secondary Indicators (2 or more required)<br />
Surface Water (A1) Salt Crust (B11) Water Marks (B1) (Riverine)<br />
High Water Table (A2) Biotic Crust (B12) Sediment Deposits (B2) (Riverine)<br />
Saturation (A3) Aquatic Invertebrates (B13) Drift Deposits (B3) (Riverine)<br />
Water Marks (B1) (Nonriverine) Hydrogen Sulfide Odor (C1) Drainage Patterns (B10)<br />
Sediment Deposits (B2) (Nonriverine) Oxidized Rhizospheres along Living Roots (C3) Dry-Season Water Table (C2)<br />
Drift Deposits (B3) (Nonriverine) Presence <strong>of</strong> Reduced Iron (C4) Crayfish Burrows (C8)<br />
Surface Soil Cracks (B6) Recent Iron Reduction in Tilled Soils (C6) Saturation Visible on Aerial Imagery (C9)<br />
Inundation Visible on Aerial Imagery (B7) Thin Muck Surface (C7) Shallow Aquitard (D3)<br />
Water-Stained Leaves (B9) Other (Explain in Remarks) FAC-Neutral Test (D5)<br />
Field Observations:<br />
Surface Water Present Yes No Depth (inches):<br />
Water Table Present Yes No Depth (inches):<br />
Saturation Present Yes No Depth (inches):<br />
Wetland Hydrology Present Yes No<br />
(includes capillary fringe)<br />
Describe Recorded Data (stream gauge, monitoring well, aerial photos, previous inspections), if available:<br />
Remarks:<br />
This area receives direct precipitation and local run<strong>of</strong>f only; above upper extent <strong>of</strong> waterborne debris. No indicators <strong>of</strong> saturation or inundation.<br />
US Army Corps <strong>of</strong> Engineers Arid West – Version 2.0
<strong>WETLAND</strong> <strong>DETERMINATION</strong> <strong>DATA</strong> <strong>FORM</strong> – Arid West Region<br />
Project/Site: <strong>Pendleton</strong> <strong>City</strong>/County: Umatilla Sampling Date: 4/19/2012<br />
Applicant/Owner: <strong>City</strong> <strong>of</strong> <strong>Pendleton</strong> State: OR Sampling Point: 20<br />
Investigator(s): TB/ACS/PR Section, Township, Range:<br />
Landform (hillslope, terrace, etc.): depression on terrace Local relief (concave, convex, none) none Slope (%) flat<br />
Subregion (LRR): Arid Lands Lat: Long: Datum:<br />
Soil Map Unit Name: see Soil Remarks NWI Classification:<br />
Are climatic/hydrologic site conditions typical for this time <strong>of</strong> year Yes No (If no, explain in Remarks.)<br />
Are Vegetation Soil or Hydrology significantly disturbed Are “Normal Circumstances” present Yes No<br />
Are Vegetation Soil or Hydrology naturally problematic (If needed, explain any answers in Remarks”)<br />
SUMMARY OF FINDINGS – Attach site map showing sampling point locations, transects, important features, etc.<br />
Hydrophytic Vegetation Present Yes No<br />
Hydric Soil Present Yes No<br />
Wetland Hydrology Present Yes No<br />
Is the Sampled Area<br />
within a Wetland Yes No<br />
Remarks: Wetland and unvegetated surface water near Umatilla River inside <strong>City</strong> <strong>of</strong> <strong>Pendleton</strong> wastewater treatment plant grounds. South <strong>of</strong> Umatilla<br />
River, upstream <strong>of</strong> McKay Creek confluence. No surface connection to the river. Paired with Plot 21. Mapped as UR-2.<br />
VEGETATION – Use scientific names <strong>of</strong> plants.<br />
Absolute Dominant Indicator<br />
Tree Stratum (Plot size: 30' r) % Cover Species Status<br />
1.<br />
2.<br />
3.<br />
4.<br />
0% = Total Cover<br />
Sapling/Shrub Stratum (Plot size: 5' r)<br />
1.<br />
2.<br />
3.<br />
4.<br />
5.<br />
0% = Total Cover<br />
Herb Stratum (Plot size: 5' r)<br />
1. Phalaris arundinacea 100 FACW<br />
2.<br />
3.<br />
4.<br />
5.<br />
6.<br />
7.<br />
8.<br />
9.<br />
10.<br />
11.<br />
100% = Total Cover<br />
Woody Vine Stratum (Plot size: 30' r)<br />
1.<br />
2.<br />
0 = Total Cover<br />
% Bare Ground in Herb Stratum: 0%<br />
Remarks:<br />
Dominance Test worksheet:<br />
Number <strong>of</strong> Dominant Species<br />
That Are OBL, FACW, or FAC:<br />
Total Number <strong>of</strong> Dominant<br />
Species Across All Strata:<br />
Percent <strong>of</strong> Dominant Species<br />
That Are OBL, FACW, or FAC:<br />
1 (A)<br />
1 (B)<br />
100 (A/B)<br />
Prevalence Index worksheet:<br />
Total % Cover <strong>of</strong>:<br />
Multiply by:<br />
OBL species x 1 =<br />
FACW species x 2 =<br />
FAC species x 3 =<br />
FACU species x 4 =<br />
UPL species x 5 =<br />
Column Totals<br />
Prevalence Index = B/A =<br />
Hydrophytic Vegetation Indicators:<br />
Dominance Test is >50%<br />
Prevalence Index is ≤3.0 1<br />
Morphological Adaptations 1 (Provide supporting<br />
data in Remarks or on a separate sheet)<br />
Wetland Non-Vascular Plants 1<br />
Problematic Hydrophytic Vegetation 1 (Explain)<br />
1 Indicators <strong>of</strong> hydric soil and wetland hydrology must be<br />
present, unless disturbed or problematic.<br />
Hydrophytic<br />
Vegetation<br />
Present Yes No<br />
US Army Corps <strong>of</strong> Engineers Arid West – Version 2.0
SOIL Sampling Point: 20<br />
Pr<strong>of</strong>ile Description: (Describe to the depth needed to document the indicator or confirm the absence <strong>of</strong> indicators.)<br />
Depth Matrix Redox Features<br />
(inches) Color (moist) % Color (moist) % Type 1 Loc 2 Texture Remarks<br />
0-10 10YR 3/2 100 sandy loam gravelly<br />
1 Type: C=Concentration, D=Depletion, RM=Reduced Matrix, CS=Covered or Coated Sand Grains.<br />
2 Location: PL=Pore Lining, M=Matrix.<br />
Hydric Soil Indicators: (Applicable to all LRRs, unless otherwise noted.) Indicators for Problematic Hydric Soils 3 :<br />
Histosol (A1) Sandy Redox (S5) 1 cm Muck (A9) (LRR D)<br />
Histic Epipedon (A2) Stripped Matrix (S6) 2 cm Muck (A10)<br />
Black Histic (A3) Loamy Mucky Mineral (F1) (except MLRA 1) Reduced Vertic (F18)<br />
Hydrogen Sulfide (A4) Loamy Gleyed Matrix (F2) Red Parent Material (TF2)<br />
Stratified Layers (A5) (LRR C) Depleted Matrix (F3) Other (Explain in Remarks)<br />
1 cm Muck (A9) (LRR D) Redox Dark Surface (F6)<br />
Depleted Below Dark Surface (A11) Depleted Dark Surface (F7)<br />
Thick Dark Surface (A12)<br />
Redox Depressions (F8)<br />
3 Indicators <strong>of</strong> hydrophytic vegetation and<br />
Sandy Mucky Mineral (S1) Vernal Pools (F9) wetland hydrology must be present,<br />
Sandy Gleyed Matrix (S4)<br />
unless disturbed or problematic.<br />
Restrictive Layer (if present):<br />
Type: Rock<br />
Depth (inches): 10 inches Hydric Soil Present Yes No<br />
Remarks:<br />
Plot taken below maximum extent <strong>of</strong> inundation, in an area with surface saturation well into the growing season. Meets definition <strong>of</strong> hydric soil. Plot<br />
lies at the intersection <strong>of</strong> Map Units 6B (Anderly silt loam, 1-7% slopes), 28A (Freewater gravelly silt loam, 0-3% slopes) and 126A (Xer<strong>of</strong>luvents, 0-<br />
3% slopes).<br />
HYDROLOGY<br />
Wetland Hydrology Indicators:<br />
Primary Indicators (minimum <strong>of</strong> one required; check all that apply)<br />
Secondary Indicators (2 or more required)<br />
Surface Water (A1) Salt Crust (B11) Water Marks (B1) (Riverine)<br />
High Water Table (A2) Biotic Crust (B12) Sediment Deposits (B2) (Riverine)<br />
Saturation (A3) Aquatic Invertebrates (B13) Drift Deposits (B3) (Riverine)<br />
Water Marks (B1) (Nonriverine) Hydrogen Sulfide Odor (C1) Drainage Patterns (B10)<br />
Sediment Deposits (B2) (Nonriverine) Oxidized Rhizospheres along Living Roots (C3) Dry-Season Water Table (C2)<br />
Drift Deposits (B3) (Nonriverine) Presence <strong>of</strong> Reduced Iron (C4) Crayfish Burrows (C8)<br />
Surface Soil Cracks (B6) Recent Iron Reduction in Tilled Soils (C6) Saturation Visible on Aerial Imagery (C9)<br />
Inundation Visible on Aerial Imagery (B7) Thin Muck Surface (C7) Shallow Aquitard (D3)<br />
Water-Stained Leaves (B9) Other (Explain in Remarks) FAC-Neutral Test (D5)<br />
Field Observations:<br />
Surface Water Present Yes No Depth (inches):<br />
Water Table Present Yes No Depth (inches): 3"<br />
Saturation Present Yes No Depth (inches): surface<br />
Wetland Hydrology Present Yes No<br />
(includes capillary fringe)<br />
Describe Recorded Data (stream gauge, monitoring well, aerial photos, previous inspections), if available:<br />
Remarks:<br />
Plot taken 1 foot from open water. Plot is fed by direct precipitation and local run<strong>of</strong>f.<br />
US Army Corps <strong>of</strong> Engineers Arid West – Version 2.0
<strong>WETLAND</strong> <strong>DETERMINATION</strong> <strong>DATA</strong> <strong>FORM</strong> – Arid West Region<br />
Project/Site: <strong>Pendleton</strong> <strong>City</strong>/County: Umatilla Sampling Date: 4/19/2012<br />
Applicant/Owner: <strong>City</strong> <strong>of</strong> <strong>Pendleton</strong> State: OR Sampling Point: 21<br />
Investigator(s): TB/ACS Section, Township, Range:<br />
Landform (hillslope, terrace, etc.): terrace Local relief (concave, convex, none) none Slope (%) flat<br />
Subregion (LRR): Arid Lands Lat: Long: Datum:<br />
Soil Map Unit Name: See Soil Remarks NWI Classification:<br />
Are climatic/hydrologic site conditions typical for this time <strong>of</strong> year Yes No (If no, explain in Remarks.)<br />
Are Vegetation Soil or Hydrology significantly disturbed Are “Normal Circumstances” present Yes No<br />
Are Vegetation Soil or Hydrology naturally problematic (If needed, explain any answers in Remarks”)<br />
SUMMARY OF FINDINGS – Attach site map showing sampling point locations, transects, important features, etc.<br />
Hydrophytic Vegetation Present Yes No<br />
Is the Sampled Area<br />
Hydric Soil Present Yes No<br />
within a Wetland Yes No<br />
Wetland Hydrology Present Yes No<br />
Remarks: Pond near Umatilla River. No surface connection to the river. Paired with Plot 20 as UR-2 upland plot.<br />
VEGETATION – Use scientific names <strong>of</strong> plants.<br />
Absolute Dominant Indicator<br />
Tree Stratum (Plot size: 30' r) % Cover Species Status<br />
1.<br />
2.<br />
3.<br />
4.<br />
0% = Total Cover<br />
Sapling/Shrub Stratum (Plot size: 5' r)<br />
1.<br />
2.<br />
3.<br />
4.<br />
5.<br />
0% = Total Cover<br />
Herb Stratum (Plot size: 5' r)<br />
1. Phalaris arundinacea 100 FACW<br />
2. Conium maculatum T FACW<br />
3.<br />
4.<br />
5.<br />
6.<br />
7.<br />
8.<br />
9.<br />
10.<br />
11.<br />
100% = Total Cover<br />
Woody Vine Stratum (Plot size: 30' r)<br />
1.<br />
2.<br />
0 = Total Cover<br />
% Bare Ground in Herb Stratum: 0%<br />
Remarks:<br />
Dominance Test worksheet:<br />
Number <strong>of</strong> Dominant Species<br />
That Are OBL, FACW, or FAC:<br />
Total Number <strong>of</strong> Dominant<br />
Species Across All Strata:<br />
Percent <strong>of</strong> Dominant Species<br />
That Are OBL, FACW, or FAC:<br />
1 (A)<br />
1 (B)<br />
100 (A/B)<br />
Prevalence Index worksheet:<br />
Total % Cover <strong>of</strong>:<br />
Multiply by:<br />
OBL species x 1 =<br />
FACW species x 2 =<br />
FAC species x 3 =<br />
FACU species x 4 =<br />
UPL species x 5 =<br />
Column Totals<br />
Prevalence Index = B/A =<br />
Hydrophytic Vegetation Indicators:<br />
Dominance Test is >50%<br />
Prevalence Index is ≤3.0 1<br />
Morphological Adaptations 1 (Provide supporting<br />
data in Remarks or on a separate sheet)<br />
Wetland Non-Vascular Plants 1<br />
Problematic Hydrophytic Vegetation 1 (Explain)<br />
1 Indicators <strong>of</strong> hydric soil and wetland hydrology must be<br />
present, unless disturbed or problematic.<br />
Hydrophytic<br />
Vegetation<br />
Present Yes No<br />
US Army Corps <strong>of</strong> Engineers Arid West – Version 2.0
SOIL Sampling Point: 21<br />
Pr<strong>of</strong>ile Description: (Describe to the depth needed to document the indicator or confirm the absence <strong>of</strong> indicators.)<br />
Depth Matrix Redox Features<br />
(inches) Color (moist) % Color (moist) % Type 1 Loc 2 Texture Remarks<br />
0-4 10YR 3/2 100 silt loam lots <strong>of</strong> fine roots<br />
4-10 10YR 3/2 100 fine sandy loam few to no roots<br />
10-20 10YR 3/2 94 7.5YR 4/4 5 C M/PL fine sandy loam no roots<br />
7.5YR 4/1 1 D M occasional cobbles (riverwash)<br />
1 Type: C=Concentration, D=Depletion, RM=Reduced Matrix, CS=Covered or Coated Sand Grains.<br />
2 Location: PL=Pore Lining, M=Matrix.<br />
Hydric Soil Indicators: (Applicable to all LRRs, unless otherwise noted.) Indicators for Problematic Hydric Soils 3 :<br />
Histosol (A1) Sandy Redox (S5) 1 cm Muck (A9) (LRR D)<br />
Histic Epipedon (A2) Stripped Matrix (S6) 2 cm Muck (A10)<br />
Black Histic (A3) Loamy Mucky Mineral (F1) (except MLRA 1) Reduced Vertic (F18)<br />
Hydrogen Sulfide (A4) Loamy Gleyed Matrix (F2) Red Parent Material (TF2)<br />
Stratified Layers (A5) (LRR C) Depleted Matrix (F3) Other (Explain in Remarks)<br />
1 cm Muck (A9) (LRR D) Redox Dark Surface (F6)<br />
Depleted Below Dark Surface (A11) Depleted Dark Surface (F7)<br />
Thick Dark Surface (A12)<br />
Redox Depressions (F8)<br />
3 Indicators <strong>of</strong> hydrophytic vegetation and<br />
Sandy Mucky Mineral (S1) Vernal Pools (F9) wetland hydrology must be present,<br />
Sandy Gleyed Matrix (S4)<br />
unless disturbed or problematic.<br />
Restrictive Layer (if present):<br />
Type:<br />
Depth (inches): Hydric Soil Present Yes No<br />
Remarks:<br />
Redox layer is too deep to meet F6; at hydric/non-hydric transition. Plot lies at the intersection <strong>of</strong> Map Units 6B (Anderly silt loam, 1-7% slopes), 28A<br />
(Freewater gravelly silt loam, 0-3% slopes) and 126A (Xer<strong>of</strong>luvents, 0-3% slopes).<br />
HYDROLOGY<br />
Wetland Hydrology Indicators:<br />
Primary Indicators (minimum <strong>of</strong> one required; check all that apply)<br />
Secondary Indicators (2 or more required)<br />
Surface Water (A1) Salt Crust (B11) Water Marks (B1) (Riverine)<br />
High Water Table (A2) Biotic Crust (B12) Sediment Deposits (B2) (Riverine)<br />
Saturation (A3) Aquatic Invertebrates (B13) Drift Deposits (B3) (Riverine)<br />
Water Marks (B1) (Nonriverine) Hydrogen Sulfide Odor (C1) Drainage Patterns (B10)<br />
Sediment Deposits (B2) (Nonriverine) Oxidized Rhizospheres along Living Roots (C3) Dry-Season Water Table (C2)<br />
Drift Deposits (B3) (Nonriverine) Presence <strong>of</strong> Reduced Iron (C4) Crayfish Burrows (C8)<br />
Surface Soil Cracks (B6) Recent Iron Reduction in Tilled Soils (C6) Saturation Visible on Aerial Imagery (C9)<br />
Inundation Visible on Aerial Imagery (B7) Thin Muck Surface (C7) Shallow Aquitard (D3)<br />
Water-Stained Leaves (B9) Other (Explain in Remarks) FAC-Neutral Test (D5)<br />
Field Observations:<br />
Surface Water Present Yes No Depth (inches):<br />
Water Table Present Yes No Depth (inches):<br />
Saturation Present Yes No Depth (inches):<br />
Wetland Hydrology Present Yes No<br />
(includes capillary fringe)<br />
Describe Recorded Data (stream gauge, monitoring well, aerial photos, previous inspections), if available:<br />
Remarks:<br />
Direct precipitation and local run<strong>of</strong>f are the sources <strong>of</strong> hydrology for this area. No indicators <strong>of</strong> saturation or inundation.<br />
US Army Corps <strong>of</strong> Engineers Arid West – Version 2.0
<strong>WETLAND</strong> <strong>DETERMINATION</strong> <strong>DATA</strong> <strong>FORM</strong> – Arid West Region<br />
Project/Site: <strong>Pendleton</strong> <strong>City</strong>/County: Umatilla Sampling Date: 5/18/2011<br />
Applicant/Owner: <strong>City</strong> <strong>of</strong> <strong>Pendleton</strong> State: OR Sampling Point: 22<br />
Investigator(s): LW/ACS Section, Township, Range:<br />
Landform (hillslope, terrace, etc.): hillslope Local relief (concave, convex, none) none Slope (%) 10%<br />
Subregion (LRR): Arid Lands Lat: Long: Datum:<br />
Soil Map Unit Name: 6E: Anderly silt loam, 20-35% slopes NWI Classification: PEMA<br />
Are climatic/hydrologic site conditions typical for this time <strong>of</strong> year Yes No (If no, explain in Remarks.)<br />
Are Vegetation Soil or Hydrology significantly disturbed Are “Normal Circumstances” present Yes No<br />
Are Vegetation Soil or Hydrology naturally problematic (If needed, explain any answers in Remarks”)<br />
SUMMARY OF FINDINGS – Attach site map showing sampling point locations, transects, important features, etc.<br />
Hydrophytic Vegetation Present Yes No<br />
Is the Sampled Area<br />
Hydric Soil Present Yes No<br />
within a Wetland Yes No<br />
Wetland Hydrology Present Yes No<br />
Remarks: OFFSITE - plots taken via binoculars from NW A Avenue right-<strong>of</strong>-way. Near site 4. Paired with Plot 23.<br />
VEGETATION – Use scientific names <strong>of</strong> plants.<br />
Absolute Dominant Indicator<br />
Tree Stratum (Plot size: 30' r) % Cover Species Status<br />
1. Elaeagnus angustifolia 5 FAC<br />
2. Populus balsamifera v. trichocarpa 30 FAC<br />
3.<br />
4.<br />
30% = Total Cover<br />
Sapling/Shrub Stratum (Plot size: 5' r)<br />
1. Crataegus douglasii 20 FAC<br />
2.<br />
3.<br />
4.<br />
5.<br />
35% = Total Cover<br />
Herb Stratum (Plot size: 5' r)<br />
1. Lysichiton americanum 70 OBL<br />
2. Unidentified grasses 20 FAC<br />
3.<br />
4.<br />
5.<br />
6.<br />
7.<br />
8.<br />
9.<br />
10.<br />
11.<br />
90% = Total Cover<br />
Woody Vine Stratum (Plot size: 30' r)<br />
1.<br />
2.<br />
0 = Total Cover<br />
% Bare Ground in Herb Stratum: 10%<br />
Remarks:<br />
Wooded swale in upper portion. Most <strong>of</strong> swale has herbaceous vegetation only.<br />
Dominance Test worksheet:<br />
Number <strong>of</strong> Dominant Species<br />
That Are OBL, FACW, or FAC:<br />
Total Number <strong>of</strong> Dominant<br />
Species Across All Strata:<br />
Percent <strong>of</strong> Dominant Species<br />
That Are OBL, FACW, or FAC:<br />
4 (A)<br />
4 (B)<br />
100 (A/B)<br />
Prevalence Index worksheet:<br />
Total % Cover <strong>of</strong>:<br />
Multiply by:<br />
OBL species x 1 =<br />
FACW species x 2 =<br />
FAC species x 3 =<br />
FACU species x 4 =<br />
UPL species x 5 =<br />
Column Totals<br />
Prevalence Index = B/A =<br />
Hydrophytic Vegetation Indicators:<br />
Dominance Test is >50%<br />
Prevalence Index is ≤3.0 1<br />
Morphological Adaptations 1 (Provide supporting<br />
data in Remarks or on a separate sheet)<br />
Wetland Non-Vascular Plants 1<br />
Problematic Hydrophytic Vegetation 1 (Explain)<br />
1 Indicators <strong>of</strong> hydric soil and wetland hydrology must<br />
be present, unless disturbed or problematic.<br />
Hydrophytic<br />
Vegetation<br />
Present Yes No<br />
US Army Corps <strong>of</strong> Engineers Arid West – Version 2.0
SOIL Sampling Point: 22<br />
Pr<strong>of</strong>ile Description: (Describe to the depth needed to document the indicator or confirm the absence <strong>of</strong> indicators.)<br />
Depth Matrix Redox Features<br />
(inches) Color (moist) % Color (moist) % Type 1 Loc 2 Texture Remarks<br />
1 Type: C=Concentration, D=Depletion, RM=Reduced Matrix, CS=Covered or Coated Sand Grains.<br />
2 Location: PL=Pore Lining, M=Matrix.<br />
Hydric Soil Indicators: (Applicable to all LRRs, unless otherwise noted.) Indicators for Problematic Hydric Soils 3 :<br />
Histosol (A1) Sandy Redox (S5) 1 cm Muck (A9) (LRR D)<br />
Histic Epipedon (A2) Stripped Matrix (S6) 2 cm Muck (A10)<br />
Black Histic (A3) Loamy Mucky Mineral (F1) (except MLRA 1) Reduced Vertic (F18)<br />
Hydrogen Sulfide (A4) Loamy Gleyed Matrix (F2) Red Parent Material (TF2)<br />
Stratified Layers (A5) (LRR C) Depleted Matrix (F3) Other (Explain in Remarks)<br />
1 cm Muck (A9) (LRR D) Redox Dark Surface (F6)<br />
Depleted Below Dark Surface (A11) Depleted Dark Surface (F7)<br />
Thick Dark Surface (A12)<br />
Redox Depressions (F8)<br />
3 Indicators <strong>of</strong> hydrophytic vegetation and<br />
Sandy Mucky Mineral (S1) Vernal Pools (F9) wetland hydrology must be present,<br />
Sandy Gleyed Matrix (S4)<br />
unless disturbed or problematic.<br />
Restrictive Layer (if present):<br />
Type: ---<br />
Depth (inches): --- Hydric Soil Present Yes No<br />
Remarks:<br />
OFFSITE - subsurface soil conditions not observed.<br />
HYDROLOGY<br />
Wetland Hydrology Indicators:<br />
Primary Indicators (minimum <strong>of</strong> one required; check all that apply)<br />
Secondary Indicators (2 or more required)<br />
Surface Water (A1) Salt Crust (B11) Water Marks (B1) (Riverine)<br />
Saturation (A3) Aquatic Invertebrates (B13) Sediment Deposits (B2) (Riverine)<br />
Water Marks (B1) (Nonriverine) Hydrogen Sulfide Odor (C1) Drift Deposits (B3) (Riverine)<br />
Sediment Deposits (B2) (Nonriverine) Oxidized Rhizospheres along Living Roots (C3) Drainage Patterns (B10)<br />
Drift Deposits (B3) (Nonriverine) Presence <strong>of</strong> Reduced Iron (C4) Dry-Season Water Table (C2)<br />
Surface Soil Cracks (B6) Recent Iron Reduction in Tilled Soils (C6) Crayfish Burrows (C8)<br />
Inundation Visible on Aerial Imagery (B7) Thin Muck Surface (C7) Saturation Visible on Aerial Imagery (C9)<br />
Water-Stained Leaves (B9) Other (Explain in Remarks) Shallow Aquitard (D3)<br />
FAC-Neutral Test (D5)<br />
Field Observations:<br />
Surface Water Present Yes No Depth (inches):not observed<br />
Water Table Present Yes No Depth (inches): N/A<br />
Saturation Present Yes No Depth (inches): N/A<br />
Wetland Hydrology Present Yes No<br />
(includes capillary fringe)<br />
Describe Recorded Data (stream gauge, monitoring well, aerial photos, previous inspections), if available:<br />
Remarks:<br />
Surface water not visible. Assume seasional saturation or surface water is present during the growing season based on lushness <strong>of</strong> vegetation,<br />
landform, and prevalence <strong>of</strong> water-dependent vegetation. Likely spring-fed, plus run<strong>of</strong>f from adjacent slopes. Head <strong>of</strong> wetland is about 200 feet from<br />
NW A Avenue.<br />
Cowardin: PEMA<br />
HGM: Slope Valley<br />
US Army Corps <strong>of</strong> Engineers Arid West – Version 2.0
<strong>WETLAND</strong> <strong>DETERMINATION</strong> <strong>DATA</strong> <strong>FORM</strong> – Arid West Region<br />
Project/Site: <strong>Pendleton</strong> <strong>City</strong>/County: Umatilla Sampling Date: 5/18/2011<br />
Applicant/Owner: <strong>City</strong> <strong>of</strong> <strong>Pendleton</strong> State: OR Sampling Point: 23<br />
Investigator(s): LW/ACS Section, Township, Range:<br />
Landform (hillslope, terrace, etc.): hillslope Local relief (concave, convex, none) none Slope (%) 10%<br />
Subregion (LRR): Arid Lands Lat: Long: Datum:<br />
Soil Map Unit Name: 6E: Anderly silt loam, 20-35% slopes NWI Classification:<br />
Are climatic/hydrologic site conditions typical for this time <strong>of</strong> year Yes No (If no, explain in Remarks.)<br />
Are Vegetation Soil or Hydrology significantly disturbed Are “Normal Circumstances” present Yes No<br />
Are Vegetation Soil or Hydrology naturally problematic (If needed, explain any answers in Remarks”)<br />
SUMMARY OF FINDINGS – Attach site map showing sampling point locations, transects, important features, etc.<br />
Hydrophytic Vegetation Present Yes No<br />
Is the Sampled Area<br />
Hydric Soil Present Yes No<br />
within a Wetland Yes No<br />
Wetland Hydrology Present Yes No<br />
Remarks: OFFSITE - plots taken via binoculars from NW A Avenue right-<strong>of</strong>-way. Near site 4. Paired with Plot 22.<br />
VEGETATION – Use scientific names <strong>of</strong> plants.<br />
Absolute Dominant Indicator<br />
Tree Stratum (Plot size: 30' r) % Cover Species Status<br />
1.<br />
2.<br />
3.<br />
4.<br />
Sapling/Shrub Stratum (Plot size: 5' r)<br />
0% = Total Cover<br />
1. Ericameria nauseosa 20 NL<br />
2. Artemisia tridentata 10 NL<br />
3. Chrysothamnus vicidiflorus 2 NL<br />
4.<br />
5.<br />
Herb Stratum (Plot size: 5' r)<br />
32 = Total Cover<br />
1. Bromus rigidus 5 NL<br />
2. Bromus tectorum 60 NL<br />
3. Hordeum jubaetum 5 FAC-<br />
4.<br />
5.<br />
6.<br />
7.<br />
8.<br />
9.<br />
10.<br />
11.<br />
Woody Vine Stratum (Plot size: 30' r)<br />
1.<br />
2.<br />
70 = Total Cover<br />
Dominance Test worksheet:<br />
Number <strong>of</strong> Dominant Species<br />
That Are OBL, FACW, or FAC:<br />
Total Number <strong>of</strong> Dominant<br />
Species Across All Strata:<br />
Percent <strong>of</strong> Dominant Species<br />
That Are OBL, FACW, or FAC:<br />
0 = Total Cover<br />
% Bare Ground in Herb Stratum: 30%<br />
Remarks:<br />
Except for the swale, hillside vegetation consists <strong>of</strong> grasses with patchy shrubs. Typical <strong>of</strong> hillside above drainage.<br />
0 (A)<br />
3 (B)<br />
0% (A/B)<br />
Prevalence Index worksheet:<br />
Total % Cover <strong>of</strong>:<br />
Multiply by:<br />
OBL species 0 x 1 = 0<br />
FACW species 0 x 2 = 0<br />
FAC species 5 x 3 = 15<br />
FACU species 0 x 4 = 0<br />
UPL species 97 x 5 = 475<br />
Column Totals 102 490<br />
Prevalence Index = B/A = 4.80<br />
Hydrophytic Vegetation Indicators:<br />
Dominance Test is >50%<br />
Prevalence Index is ≤3.0 1<br />
Morphological Adaptations 1 (Provide supporting<br />
data in Remarks or on a separate sheet)<br />
Wetland Non-Vascular Plants 1<br />
Problematic Hydrophytic Vegetation 1 (Explain)<br />
1 Indicators <strong>of</strong> hydric soil and wetland hydrology must<br />
be present, unless disturbed or problematic.<br />
Hydrophytic<br />
Vegetation<br />
Present Yes No<br />
US Army Corps <strong>of</strong> Engineers Arid West – Version 2.0
SOIL Sampling Point: 23<br />
Pr<strong>of</strong>ile Description: (Describe to the depth needed to document the indicator or confirm the absence <strong>of</strong> indicators.)<br />
Depth Matrix Redox Features<br />
(inches) Color (moist) % Color (moist) % Type 1 Loc 2 Texture Remarks<br />
1 Type: C=Concentration, D=Depletion, RM=Reduced Matrix, CS=Covered or Coated Sand Grains.<br />
2 Location: PL=Pore Lining, M=Matrix.<br />
Hydric Soil Indicators: (Applicable to all LRRs, unless otherwise noted.) Indicators for Problematic Hydric Soils 3 :<br />
Histosol (A1) Sandy Redox (S5) 1 cm Muck (A9) (LRR D)<br />
Histic Epipedon (A2) Stripped Matrix (S6) 2 cm Muck (A10)<br />
Black Histic (A3) Loamy Mucky Mineral (F1) (except MLRA 1) Reduced Vertic (F18)<br />
Hydrogen Sulfide (A4) Loamy Gleyed Matrix (F2) Red Parent Material (TF2)<br />
Stratified Layers (A5) (LRR C) Depleted Matrix (F3) Other (Explain in Remarks)<br />
1 cm Muck (A9) (LRR D) Redox Dark Surface (F6)<br />
Depleted Below Dark Surface (A11) Depleted Dark Surface (F7)<br />
Thick Dark Surface (A12)<br />
Redox Depressions (F8)<br />
3 Indicators <strong>of</strong> hydrophytic vegetation and<br />
Sandy Mucky Mineral (S1) Vernal Pools (F9) wetland hydrology must be present,<br />
Sandy Gleyed Matrix (S4)<br />
unless disturbed or problematic.<br />
Restrictive Layer (if present):<br />
Type: ---<br />
Depth (inches): --- Hydric Soil Present Yes No<br />
Remarks:<br />
OFFSITE - subsurface soil conditions not observed.<br />
HYDROLOGY<br />
Wetland Hydrology Indicators:<br />
Primary Indicators (minimum <strong>of</strong> one required; check all that apply)<br />
Secondary Indicators (2 or more required)<br />
Surface Water (A1) Salt Crust (B11) Water Marks (B1) (Riverine)<br />
Saturation (A3) Aquatic Invertebrates (B13) Sediment Deposits (B2) (Riverine)<br />
Water Marks (B1) (Nonriverine) Hydrogen Sulfide Odor (C1) Drift Deposits (B3) (Riverine)<br />
Sediment Deposits (B2) (Nonriverine) Oxidized Rhizospheres along Living Roots (C3) Drainage Patterns (B10)<br />
Drift Deposits (B3) (Nonriverine) Presence <strong>of</strong> Reduced Iron (C4) Dry-Season Water Table (C2)<br />
Surface Soil Cracks (B6) Recent Iron Reduction in Tilled Soils (C6) Crayfish Burrows (C8)<br />
Inundation Visible on Aerial Imagery (B7) Thin Muck Surface (C7) Saturation Visible on Aerial Imagery (C9)<br />
Water-Stained Leaves (B9) Other (Explain in Remarks) Shallow Aquitard (D3)<br />
FAC-Neutral Test (D5)<br />
Field Observations:<br />
Surface Water Present Yes No Depth (inches):not observed<br />
Water Table Present Yes No Depth (inches): N/A<br />
Saturation Present Yes No Depth (inches): N/A<br />
Wetland Hydrology Present Yes No<br />
(includes capillary fringe)<br />
Describe Recorded Data (stream gauge, monitoring well, aerial photos, previous inspections), if available:<br />
Remarks:<br />
Hillslopes above the wetland show no indication <strong>of</strong> sheet flow, groundwater discharge, or high water table. Vegetation suggests drier hydrologic<br />
regime than Plot 22.<br />
US Army Corps <strong>of</strong> Engineers Arid West – Version 2.0
<strong>WETLAND</strong> <strong>DETERMINATION</strong> <strong>DATA</strong> <strong>FORM</strong> – Arid West Region<br />
Project/Site: <strong>Pendleton</strong> <strong>City</strong>/County: Umatilla Sampling Date: 5/18/2011<br />
Applicant/Owner: <strong>City</strong> <strong>of</strong> <strong>Pendleton</strong> State: OR Sampling Point: 24<br />
Investigator(s): LW/ACS Section, Township, Range:<br />
Landform (hillslope, terrace, etc.): Hillslope draw Local relief (concave, convex, none) Concave Slope (%) 10%<br />
Subregion (LRR): Arid Lands Lat: 45.6841 N Long: 118.8424 W Datum:<br />
Soil Map Unit Name: Anderly silt loam, 12-20% NWI Classification:<br />
Are climatic/hydrologic site conditions typical for this time <strong>of</strong> year Yes No (If no, explain in Remarks.)<br />
Are Vegetation Soil or Hydrology significantly disturbed Are “Normal Circumstances” present Yes No<br />
Are Vegetation Soil or Hydrology naturally problematic (If needed, explain any answers in Remarks”)<br />
SUMMARY OF FINDINGS – Attach site map showing sampling point locations, transects, important features, etc.<br />
Hydrophytic Vegetation Present Yes No<br />
Hydric Soil Present Yes No<br />
Wetland Hydrology Present Yes No<br />
Is the Sampled Area<br />
within a Wetland Yes No<br />
Remarks: OFFSITE - viewed through binoculars from below at Airport Road. This site is a broad swale with herbaceous vegetation in the bottom and<br />
heavier on the sideslopes.. The bottom <strong>of</strong> the swale was visibly moist with a few scattered shallow puddles at the low end. While vegetation is<br />
borderline hydrophytic at the time <strong>of</strong> this investigation, the size <strong>of</strong> the standpipe suggests that this swale is capable <strong>of</strong> very high flows. Taken near area<br />
52.<br />
VEGETATION – Use scientific names <strong>of</strong> plants.<br />
Absolute Dominant Indicator<br />
Tree Stratum (Plot size: 30' r) % Cover Species Status<br />
1.<br />
2.<br />
3.<br />
4.<br />
0% = Total Cover<br />
Sapling/Shrub Stratum (Plot size: 5' r)<br />
1.<br />
2.<br />
3.<br />
4.<br />
5.<br />
0% = Total Cover<br />
Herb Stratum (Plot size: 5' r)<br />
1. Conium maculatum FAC+ 40%<br />
2. Bromus tectorum NL 10%<br />
3. Bromus ridgidus NL 20%<br />
4.<br />
5.<br />
6.<br />
7.<br />
8.<br />
9.<br />
10.<br />
11.<br />
70% = Total Cover<br />
Woody Vine Stratum (Plot size: 30' r)<br />
1.<br />
2.<br />
0 = Total Cover<br />
% Bare Ground in Herb Stratum: 30%<br />
Dominance Test worksheet:<br />
Number <strong>of</strong> Dominant Species<br />
That Are OBL, FACW, or FAC:<br />
Total Number <strong>of</strong> Dominant<br />
Species Across All Strata:<br />
Percent <strong>of</strong> Dominant Species<br />
That Are OBL, FACW, or FAC:<br />
1 (A)<br />
2 (B)<br />
50% (A/B)<br />
Prevalence Index worksheet:<br />
Total % Cover <strong>of</strong>:<br />
Multiply by:<br />
OBL species 0 x 1 = 0<br />
FACW species 0 x 2 = 0<br />
FAC species 40 x 3 = 120<br />
FACU species 0 x 4 = 0<br />
UPL species 30 x 5 = 150<br />
Column Totals 90 270<br />
Prevalence Index = B/A = 3.00<br />
Hydrophytic Vegetation Indicators:<br />
Dominance Test is >50%<br />
Prevalence Index is ≤3.0 1<br />
Morphological Adaptations 1 (Provide supporting<br />
data in Remarks or on a separate sheet)<br />
Wetland Non-Vascular Plants 1<br />
Problematic Hydrophytic Vegetation 1 (Explain)<br />
1 Indicators <strong>of</strong> hydric soil and wetland hydrology must<br />
be present, unless disturbed or problematic.<br />
Hydrophytic<br />
Vegetation<br />
Present Yes No<br />
US Army Corps <strong>of</strong> Engineers Arid West – Version 2.0
Remarks:<br />
Herbaceous cover only. Tree and shrub cover are absent in this reach <strong>of</strong> the swale.<br />
US Army Corps <strong>of</strong> Engineers Arid West – Version 2.0
SOIL Sampling Point: 24<br />
Pr<strong>of</strong>ile Description: (Describe to the depth needed to document the indicator or confirm the absence <strong>of</strong> indicators.)<br />
Depth Matrix Redox Features<br />
(inches) Color (moist) % Color (moist) % Type 1 Loc 2 Texture Remarks<br />
1 Type: C=Concentration, D=Depletion, RM=Reduced Matrix, CS=Covered or Coated Sand Grains.<br />
2 Location: PL=Pore Lining, M=Matrix.<br />
Hydric Soil Indicators: (Applicable to all LRRs, unless otherwise noted.) Indicators for Problematic Hydric Soils 3 :<br />
Histosol (A1) Sandy Redox (S5) 1 cm Muck (A9) (LRR D)<br />
Histic Epipedon (A2) Stripped Matrix (S6) 2 cm Muck (A10)<br />
Black Histic (A3) Loamy Mucky Mineral (F1) (except MLRA 1) Reduced Vertic (F18)<br />
Hydrogen Sulfide (A4) Loamy Gleyed Matrix (F2) Red Parent Material (TF2)<br />
Stratified Layers (A5) (LRR C) Depleted Matrix (F3) Other (Explain in Remarks)<br />
1 cm Muck (A9) (LRR D) Redox Dark Surface (F6)<br />
Depleted Below Dark Surface (A11) Depleted Dark Surface (F7)<br />
Thick Dark Surface (A12)<br />
Redox Depressions (F8)<br />
3 Indicators <strong>of</strong> hydrophytic vegetation and<br />
Sandy Mucky Mineral (S1) Vernal Pools (F9) wetland hydrology must be present,<br />
Sandy Gleyed Matrix (S4)<br />
unless disturbed or problematic.<br />
Restrictive Layer (if present):<br />
Type: ---<br />
Depth (inches): --- Hydric Soil Present Yes No<br />
Remarks:<br />
OFFSITE - subsurface soil conditions not observed.<br />
HYDROLOGY<br />
Wetland Hydrology Indicators:<br />
Primary Indicators (minimum <strong>of</strong> one required; check all that apply)<br />
Secondary Indicators (2 or more required)<br />
Surface Water (A1) Salt Crust (B11) Water Marks (B1) (Riverine)<br />
Saturation (A3) Aquatic Invertebrates (B13) Sediment Deposits (B2) (Riverine)<br />
Water Marks (B1) (Nonriverine) Hydrogen Sulfide Odor (C1) Drift Deposits (B3) (Riverine)<br />
Sediment Deposits (B2) (Nonriverine) Oxidized Rhizospheres along Living Roots (C3) Drainage Patterns (B10)<br />
Drift Deposits (B3) (Nonriverine) Presence <strong>of</strong> Reduced Iron (C4) Dry-Season Water Table (C2)<br />
Surface Soil Cracks (B6) Recent Iron Reduction in Tilled Soils (C6) Crayfish Burrows (C8)<br />
Inundation Visible on Aerial Imagery (B7) Thin Muck Surface (C7) Saturation Visible on Aerial Imagery (C9)<br />
Water-Stained Leaves (B9) Other (Explain in Remarks) Shallow Aquitard (D3)<br />
FAC-Neutral Test (D5)<br />
Field Observations:<br />
Surface Water Present Yes No Depth (inches):0.5 inch<br />
Water Table Present Yes No Depth (inches): N/A<br />
Saturation Present Yes No Depth (inches): N/A<br />
Wetland Hydrology Present Yes No<br />
(includes capillary fringe)<br />
Describe Recorded Data (stream gauge, monitoring well, aerial photos, previous inspections), if available:<br />
Remarks:<br />
Near the roadway, there is a very large standpipe at this location, suggesting that signficant flows through this swale are possible.<br />
US Army Corps <strong>of</strong> Engineers Arid West – Version 2.0
<strong>WETLAND</strong> <strong>DETERMINATION</strong> <strong>DATA</strong> <strong>FORM</strong> – Arid West Region<br />
Project/Site: <strong>Pendleton</strong> <strong>City</strong>/County: Umatilla Sampling Date: 5/18/2011<br />
Applicant/Owner: <strong>City</strong> <strong>of</strong> <strong>Pendleton</strong> State: OR Sampling Point: 25<br />
Investigator(s): LW/ACS Section, Township, Range:<br />
Landform (hillslope, terrace, etc.): Hillslope draw Local relief (concave, convex, none) Concave Slope (%) 15%<br />
Subregion (LRR): Arid Lands Lat: 45.6841 N Long: 118.8424 W Datum:<br />
Soil Map Unit Name: Anderly silt loam, 12-20% NWI Classification:<br />
Are climatic/hydrologic site conditions typical for this time <strong>of</strong> year Yes No (If no, explain in Remarks.)<br />
Are Vegetation Soil or Hydrology significantly disturbed Are “Normal Circumstances” present Yes No<br />
Are Vegetation Soil or Hydrology naturally problematic (If needed, explain any answers in Remarks”)<br />
SUMMARY OF FINDINGS – Attach site map showing sampling point locations, transects, important features, etc.<br />
Hydrophytic Vegetation Present Yes No<br />
Hydric Soil Present Yes No<br />
Wetland Hydrology Present Yes No<br />
Is the Sampled Area<br />
within a Wetland Yes No<br />
Remarks: OFFSITE - viewed through binoculars from below at Airport Road. This site is a broad swale with herbaceous vegetation in the bottom and<br />
heavier on the sideslopes.. This plot was taken on the slopes above the bottom, near the invert elevation <strong>of</strong> the standpipe. Paired with Plot 24. Near<br />
site 52.<br />
VEGETATION – Use scientific names <strong>of</strong> plants.<br />
Absolute Dominant Indicator<br />
Tree Stratum (Plot size: 30' r) % Cover Species Status<br />
1.<br />
2.<br />
3.<br />
4.<br />
0% = Total Cover<br />
Sapling/Shrub Stratum (Plot size: 5' r)<br />
1.<br />
2.<br />
3.<br />
4.<br />
5.<br />
0% = Total Cover<br />
Herb Stratum (Plot size: 5' r)<br />
1. Conium maculatum FAC+ 20%<br />
2. Bromus tectorum NL 60%<br />
3. Bromus ridgidus NL 10%<br />
4.<br />
5.<br />
6.<br />
7.<br />
8.<br />
9.<br />
10.<br />
11.<br />
90% = Total Cover<br />
Woody Vine Stratum (Plot size: 30' r)<br />
1.<br />
2.<br />
0 = Total Cover<br />
% Bare Ground in Herb Stratum: 10%<br />
Dominance Test worksheet:<br />
Number <strong>of</strong> Dominant Species<br />
That Are OBL, FACW, or FAC:<br />
Total Number <strong>of</strong> Dominant<br />
Species Across All Strata:<br />
Percent <strong>of</strong> Dominant Species<br />
That Are OBL, FACW, or FAC:<br />
1 (A)<br />
2 (B)<br />
50% (A/B)<br />
Prevalence Index worksheet:<br />
Total % Cover <strong>of</strong>:<br />
Multiply by:<br />
OBL species 0 x 1 = 0<br />
FACW species 0 x 2 = 0<br />
FAC species 20 x 3 = 60<br />
FACU species 0 x 4 = 0<br />
UPL species 70 x 5 = 350<br />
Column Totals 90 410<br />
Prevalence Index = B/A = 4.56<br />
Hydrophytic Vegetation Indicators:<br />
Dominance Test is >50%<br />
Prevalence Index is ≤3.0 1<br />
Morphological Adaptations 1 (Provide supporting<br />
data in Remarks or on a separate sheet)<br />
Wetland Non-Vascular Plants 1<br />
Problematic Hydrophytic Vegetation 1 (Explain)<br />
1 Indicators <strong>of</strong> hydric soil and wetland hydrology must<br />
be present, unless disturbed or problematic.<br />
Hydrophytic<br />
Vegetation<br />
Present Yes No<br />
US Army Corps <strong>of</strong> Engineers Arid West – Version 2.0
Remarks:<br />
Herbaceous cover only. Tree and shrub cover are absent in this reach <strong>of</strong> the swale. Conium still present, but cover has shifted in favor <strong>of</strong> Bromus<br />
tectorum.<br />
US Army Corps <strong>of</strong> Engineers Arid West – Version 2.0
SOIL Sampling Point: 25<br />
Pr<strong>of</strong>ile Description: (Describe to the depth needed to document the indicator or confirm the absence <strong>of</strong> indicators.)<br />
Depth Matrix Redox Features<br />
(inches) Color (moist) % Color (moist) % Type 1 Loc 2 Texture Remarks<br />
1 Type: C=Concentration, D=Depletion, RM=Reduced Matrix, CS=Covered or Coated Sand Grains.<br />
2 Location: PL=Pore Lining, M=Matrix.<br />
Hydric Soil Indicators: (Applicable to all LRRs, unless otherwise noted.) Indicators for Problematic Hydric Soils 3 :<br />
Histosol (A1) Sandy Redox (S5) 1 cm Muck (A9) (LRR D)<br />
Histic Epipedon (A2) Stripped Matrix (S6) 2 cm Muck (A10)<br />
Black Histic (A3) Loamy Mucky Mineral (F1) (except MLRA 1) Reduced Vertic (F18)<br />
Hydrogen Sulfide (A4) Loamy Gleyed Matrix (F2) Red Parent Material (TF2)<br />
Stratified Layers (A5) (LRR C) Depleted Matrix (F3) Other (Explain in Remarks)<br />
1 cm Muck (A9) (LRR D) Redox Dark Surface (F6)<br />
Depleted Below Dark Surface (A11) Depleted Dark Surface (F7)<br />
Thick Dark Surface (A12)<br />
Redox Depressions (F8)<br />
3 Indicators <strong>of</strong> hydrophytic vegetation and<br />
Sandy Mucky Mineral (S1) Vernal Pools (F9) wetland hydrology must be present,<br />
Sandy Gleyed Matrix (S4)<br />
unless disturbed or problematic.<br />
Restrictive Layer (if present):<br />
Type: ---<br />
Depth (inches): --- Hydric Soil Present Yes No<br />
Remarks:<br />
OFFSITE - subsurface soil conditions not observed.<br />
HYDROLOGY<br />
Wetland Hydrology Indicators:<br />
Primary Indicators (minimum <strong>of</strong> one required; check all that apply)<br />
Secondary Indicators (2 or more required)<br />
Surface Water (A1) Salt Crust (B11) Water Marks (B1) (Riverine)<br />
Saturation (A3) Aquatic Invertebrates (B13) Sediment Deposits (B2) (Riverine)<br />
Water Marks (B1) (Nonriverine) Hydrogen Sulfide Odor (C1) Drift Deposits (B3) (Riverine)<br />
Sediment Deposits (B2) (Nonriverine) Oxidized Rhizospheres along Living Roots (C3) Drainage Patterns (B10)<br />
Drift Deposits (B3) (Nonriverine) Presence <strong>of</strong> Reduced Iron (C4) Dry-Season Water Table (C2)<br />
Surface Soil Cracks (B6) Recent Iron Reduction in Tilled Soils (C6) Crayfish Burrows (C8)<br />
Inundation Visible on Aerial Imagery (B7) Thin Muck Surface (C7) Saturation Visible on Aerial Imagery (C9)<br />
Water-Stained Leaves (B9) Other (Explain in Remarks) Shallow Aquitard (D3)<br />
FAC-Neutral Test (D5)<br />
Field Observations:<br />
Surface Water Present Yes No Depth (inches):<br />
Water Table Present Yes No Depth (inches): N/A<br />
Saturation Present Yes No Depth (inches): N/A<br />
Wetland Hydrology Present Yes No<br />
(includes capillary fringe)<br />
Describe Recorded Data (stream gauge, monitoring well, aerial photos, previous inspections), if available:<br />
Remarks:<br />
Near the maximum inundation potential, as governed by the standpipe.<br />
US Army Corps <strong>of</strong> Engineers Arid West – Version 2.0
<strong>WETLAND</strong> <strong>DETERMINATION</strong> <strong>DATA</strong> <strong>FORM</strong> – Arid West Region<br />
Project/Site: <strong>Pendleton</strong> <strong>City</strong>/County: Umatilla Sampling Date: 5/18/2011<br />
Applicant/Owner: <strong>City</strong> <strong>of</strong> <strong>Pendleton</strong> State: OR Sampling Point: 26<br />
Investigator(s): LW/ACS Section, Township, Range:<br />
Landform (hillslope, terrace, etc.): Hillslope draw, impounded Local relief (concave, convex, none) Concave Slope (%) 5%<br />
Subregion (LRR): Arid Lands Lat: Long: Datum:<br />
Soil Map Unit Name: 6D: Anderly silt loam, 12-20% slopes NWI Classification:<br />
Are climatic/hydrologic site conditions typical for this time <strong>of</strong> year Yes No (If no, explain in Remarks.)<br />
Are Vegetation Soil or Hydrology significantly disturbed Are “Normal Circumstances” present Yes No<br />
Are Vegetation Soil or Hydrology naturally problematic (If needed, explain any answers in Remarks”)<br />
SUMMARY OF FINDINGS – Attach site map showing sampling point locations, transects, important features, etc.<br />
Hydrophytic Vegetation Present Yes No<br />
Hydric Soil Present Yes No<br />
Wetland Hydrology Present Yes No<br />
Is the Sampled Area<br />
within a Wetland Yes No<br />
Remarks: OFFSITE - viewed through binoculars from Red Lion hotel on Nye Avenue. This site is small pond at the edge <strong>of</strong> the landscaped area <strong>of</strong><br />
the hotel. It appears to have been created through impoundment. Near site 92, paired with Plot 27.<br />
VEGETATION – Use scientific names <strong>of</strong> plants.<br />
Absolute Dominant Indicator<br />
Tree Stratum (Plot size: 30' r) % Cover Species Status<br />
1.<br />
2.<br />
3.<br />
4.<br />
0% = Total Cover<br />
Sapling/Shrub Stratum (Plot size: 5' r)<br />
1.<br />
2.<br />
3.<br />
4.<br />
5.<br />
0% = Total Cover<br />
Herb Stratum (Plot size: 5' r)<br />
1. Juncus effusus FACW 20%<br />
2. Phalaris arundinacea FACW 30%<br />
3.<br />
4.<br />
5.<br />
6.<br />
7.<br />
8.<br />
9.<br />
10.<br />
11.<br />
50% = Total Cover<br />
Woody Vine Stratum (Plot size: 30' r)<br />
1.<br />
2.<br />
0 = Total Cover<br />
% Bare Ground in Herb Stratum: 50%<br />
Remarks:<br />
Pond margins not maintained<br />
Dominance Test worksheet:<br />
Number <strong>of</strong> Dominant Species<br />
That Are OBL, FACW, or FAC:<br />
Total Number <strong>of</strong> Dominant<br />
Species Across All Strata:<br />
Percent <strong>of</strong> Dominant Species<br />
That Are OBL, FACW, or FAC:<br />
2 (A)<br />
2 (B)<br />
100 (A/B)<br />
Prevalence Index worksheet:<br />
Total % Cover <strong>of</strong>:<br />
Multiply by:<br />
OBL species x 1 =<br />
FACW species x 2 =<br />
FAC species x 3 =<br />
FACU species x 4 =<br />
UPL species x 5 =<br />
Column Totals<br />
Prevalence Index = B/A =<br />
Hydrophytic Vegetation Indicators:<br />
Dominance Test is >50%<br />
Prevalence Index is ≤3.0 1<br />
Morphological Adaptations 1 (Provide supporting<br />
data in Remarks or on a separate sheet)<br />
Wetland Non-Vascular Plants 1<br />
Problematic Hydrophytic Vegetation 1 (Explain)<br />
1 Indicators <strong>of</strong> hydric soil and wetland hydrology must<br />
be present, unless disturbed or problematic.<br />
Hydrophytic<br />
Vegetation<br />
Present Yes No<br />
US Army Corps <strong>of</strong> Engineers Arid West – Version 2.0
SOIL Sampling Point: 26<br />
Pr<strong>of</strong>ile Description: (Describe to the depth needed to document the indicator or confirm the absence <strong>of</strong> indicators.)<br />
Depth Matrix Redox Features<br />
(inches) Color (moist) % Color (moist) % Type 1 Loc 2 Texture Remarks<br />
1 Type: C=Concentration, D=Depletion, RM=Reduced Matrix, CS=Covered or Coated Sand Grains.<br />
2 Location: PL=Pore Lining, M=Matrix.<br />
Hydric Soil Indicators: (Applicable to all LRRs, unless otherwise noted.) Indicators for Problematic Hydric Soils 3 :<br />
Histosol (A1) Sandy Redox (S5) 1 cm Muck (A9) (LRR D)<br />
Histic Epipedon (A2) Stripped Matrix (S6) 2 cm Muck (A10)<br />
Black Histic (A3) Loamy Mucky Mineral (F1) (except MLRA 1) Reduced Vertic (F18)<br />
Hydrogen Sulfide (A4) Loamy Gleyed Matrix (F2) Red Parent Material (TF2)<br />
Stratified Layers (A5) (LRR C) Depleted Matrix (F3) Other (Explain in Remarks)<br />
1 cm Muck (A9) (LRR D) Redox Dark Surface (F6)<br />
Depleted Below Dark Surface (A11) Depleted Dark Surface (F7)<br />
Thick Dark Surface (A12)<br />
Redox Depressions (F8)<br />
3 Indicators <strong>of</strong> hydrophytic vegetation and<br />
Sandy Mucky Mineral (S1) Vernal Pools (F9) wetland hydrology must be present,<br />
Sandy Gleyed Matrix (S4)<br />
unless disturbed or problematic.<br />
Restrictive Layer (if present):<br />
Type: ---<br />
Depth (inches): --- Hydric Soil Present Yes No<br />
Remarks:<br />
OFFSITE - subsurface soil conditions not observed.<br />
HYDROLOGY<br />
Wetland Hydrology Indicators:<br />
Primary Indicators (minimum <strong>of</strong> one required; check all that apply)<br />
Secondary Indicators (2 or more required)<br />
Surface Water (A1) Salt Crust (B11) Water Marks (B1) (Riverine)<br />
Saturation (A3) Aquatic Invertebrates (B13) Sediment Deposits (B2) (Riverine)<br />
Water Marks (B1) (Nonriverine) Hydrogen Sulfide Odor (C1) Drift Deposits (B3) (Riverine)<br />
Sediment Deposits (B2) (Nonriverine) Oxidized Rhizospheres along Living Roots (C3) Drainage Patterns (B10)<br />
Drift Deposits (B3) (Nonriverine) Presence <strong>of</strong> Reduced Iron (C4) Dry-Season Water Table (C2)<br />
Surface Soil Cracks (B6) Recent Iron Reduction in Tilled Soils (C6) Crayfish Burrows (C8)<br />
Inundation Visible on Aerial Imagery (B7) Thin Muck Surface (C7) Saturation Visible on Aerial Imagery (C9)<br />
Water-Stained Leaves (B9) Other (Explain in Remarks) Shallow Aquitard (D3)<br />
FAC-Neutral Test (D5)<br />
Field Observations:<br />
Surface Water Present Yes No Depth (inches):not measured<br />
Water Table Present Yes No Depth (inches): N/A<br />
Saturation Present Yes No Depth (inches): N/A<br />
Wetland Hydrology Present Yes No<br />
(includes capillary fringe)<br />
Describe Recorded Data (stream gauge, monitoring well, aerial photos, previous inspections), if available:<br />
Remarks:<br />
Unable to discern depth <strong>of</strong> water in pond. Only visible source <strong>of</strong> water is run<strong>of</strong>f from adjacent developed areas. Aerial photos suggest the pond<br />
discharges in a narrow swalle to the south.<br />
Cowardin : PUBHh<br />
HGM: Depressional outflow<br />
US Army Corps <strong>of</strong> Engineers Arid West – Version 2.0
<strong>WETLAND</strong> <strong>DETERMINATION</strong> <strong>DATA</strong> <strong>FORM</strong> – Arid West Region<br />
Project/Site: <strong>Pendleton</strong> <strong>City</strong>/County: Umatilla Sampling Date: 5/18/2011<br />
Applicant/Owner: <strong>City</strong> <strong>of</strong> <strong>Pendleton</strong> State: OR Sampling Point: 27<br />
Investigator(s): LW/ACS Section, Township, Range:<br />
Landform (hillslope, terrace, etc.): Hillslope draw, impounded Local relief (concave, convex, none) Concave Slope (%) 5%<br />
Subregion (LRR): Arid Lands Lat: Long: Datum:<br />
Soil Map Unit Name: 6D: Anderly silt loam, 12-20% slopes NWI Classification:<br />
Are climatic/hydrologic site conditions typical for this time <strong>of</strong> year Yes No (If no, explain in Remarks.)<br />
Are Vegetation Soil or Hydrology significantly disturbed Are “Normal Circumstances” present Yes No<br />
Are Vegetation Soil or Hydrology naturally problematic (If needed, explain any answers in Remarks”)<br />
SUMMARY OF FINDINGS – Attach site map showing sampling point locations, transects, important features, etc.<br />
Hydrophytic Vegetation Present Yes No<br />
Hydric Soil Present Yes No<br />
Wetland Hydrology Present Yes No<br />
Is the Sampled Area<br />
within a Wetland Yes No<br />
Remarks: OFFSITE - viewed through binoculars from Red Lion hotel. This plot characterizes the area above a small pond at the edge <strong>of</strong> the<br />
landscaped area <strong>of</strong> the hotel. Paired with Plot 26, near site 92.<br />
VEGETATION – Use scientific names <strong>of</strong> plants.<br />
Absolute Dominant Indicator<br />
Tree Stratum (Plot size: 30' r) % Cover Species Status<br />
1.<br />
2.<br />
3.<br />
4.<br />
0% = Total Cover<br />
Sapling/Shrub Stratum (Plot size: 5' r)<br />
1.<br />
2.<br />
3.<br />
4.<br />
5.<br />
0% = Total Cover<br />
Herb Stratum (Plot size: 5' r)<br />
1. Lawn grasses FAC 100%<br />
2.<br />
3.<br />
4.<br />
5.<br />
6.<br />
7.<br />
8.<br />
9.<br />
10.<br />
11.<br />
100% = Total Cover<br />
Woody Vine Stratum (Plot size: 30' r)<br />
1.<br />
2.<br />
0 = Total Cover<br />
% Bare Ground in Herb Stratum: 0%<br />
Remarks:<br />
Outside pond margin, vegetation consists <strong>of</strong> lawn grasses, most <strong>of</strong> which are rated FAC.<br />
Dominance Test worksheet:<br />
Number <strong>of</strong> Dominant Species<br />
That Are OBL, FACW, or FAC:<br />
Total Number <strong>of</strong> Dominant<br />
Species Across All Strata:<br />
Percent <strong>of</strong> Dominant Species<br />
That Are OBL, FACW, or FAC:<br />
1 (A)<br />
1 (B)<br />
100 (A/B)<br />
Prevalence Index worksheet:<br />
Total % Cover <strong>of</strong>:<br />
Multiply by:<br />
OBL species x 1 =<br />
FACW species x 2 =<br />
FAC species x 3 =<br />
FACU species x 4 =<br />
UPL species x 5 =<br />
Column Totals<br />
Prevalence Index = B/A =<br />
Hydrophytic Vegetation Indicators:<br />
Dominance Test is >50%<br />
Prevalence Index is ≤3.0 1<br />
Morphological Adaptations 1 (Provide supporting<br />
data in Remarks or on a separate sheet)<br />
Wetland Non-Vascular Plants 1<br />
Problematic Hydrophytic Vegetation 1 (Explain)<br />
1 Indicators <strong>of</strong> hydric soil and wetland hydrology must<br />
be present, unless disturbed or problematic.<br />
Hydrophytic<br />
Vegetation<br />
Present Yes No<br />
US Army Corps <strong>of</strong> Engineers Arid West – Version 2.0
SOIL Sampling Point: 27<br />
Pr<strong>of</strong>ile Description: (Describe to the depth needed to document the indicator or confirm the absence <strong>of</strong> indicators.)<br />
Depth Matrix Redox Features<br />
(inches) Color (moist) % Color (moist) % Type 1 Loc 2 Texture Remarks<br />
1 Type: C=Concentration, D=Depletion, RM=Reduced Matrix, CS=Covered or Coated Sand Grains.<br />
2 Location: PL=Pore Lining, M=Matrix.<br />
Hydric Soil Indicators: (Applicable to all LRRs, unless otherwise noted.) Indicators for Problematic Hydric Soils 3 :<br />
Histosol (A1) Sandy Redox (S5) 1 cm Muck (A9) (LRR D)<br />
Histic Epipedon (A2) Stripped Matrix (S6) 2 cm Muck (A10)<br />
Black Histic (A3) Loamy Mucky Mineral (F1) (except MLRA 1) Reduced Vertic (F18)<br />
Hydrogen Sulfide (A4) Loamy Gleyed Matrix (F2) Red Parent Material (TF2)<br />
Stratified Layers (A5) (LRR C) Depleted Matrix (F3) Other (Explain in Remarks)<br />
1 cm Muck (A9) (LRR D) Redox Dark Surface (F6)<br />
Depleted Below Dark Surface (A11) Depleted Dark Surface (F7)<br />
Thick Dark Surface (A12)<br />
Redox Depressions (F8)<br />
3 Indicators <strong>of</strong> hydrophytic vegetation and<br />
Sandy Mucky Mineral (S1) Vernal Pools (F9) wetland hydrology must be present,<br />
Sandy Gleyed Matrix (S4)<br />
unless disturbed or problematic.<br />
Restrictive Layer (if present):<br />
Type: ---<br />
Depth (inches): --- Hydric Soil Present Yes No<br />
Remarks:<br />
OFFSITE - subsurface soil conditions not observed.<br />
HYDROLOGY<br />
Wetland Hydrology Indicators:<br />
Primary Indicators (minimum <strong>of</strong> one required; check all that apply)<br />
Secondary Indicators (2 or more required)<br />
Surface Water (A1) Salt Crust (B11) Water Marks (B1) (Riverine)<br />
Saturation (A3) Aquatic Invertebrates (B13) Sediment Deposits (B2) (Riverine)<br />
Water Marks (B1) (Nonriverine) Hydrogen Sulfide Odor (C1) Drift Deposits (B3) (Riverine)<br />
Sediment Deposits (B2) (Nonriverine) Oxidized Rhizospheres along Living Roots (C3) Drainage Patterns (B10)<br />
Drift Deposits (B3) (Nonriverine) Presence <strong>of</strong> Reduced Iron (C4) Dry-Season Water Table (C2)<br />
Surface Soil Cracks (B6) Recent Iron Reduction in Tilled Soils (C6) Crayfish Burrows (C8)<br />
Inundation Visible on Aerial Imagery (B7) Thin Muck Surface (C7) Saturation Visible on Aerial Imagery (C9)<br />
Water-Stained Leaves (B9) Other (Explain in Remarks) Shallow Aquitard (D3)<br />
FAC-Neutral Test (D5)<br />
Field Observations:<br />
Surface Water Present Yes No Depth (inches):<br />
Water Table Present Yes No Depth (inches): N/A<br />
Saturation Present Yes No Depth (inches): N/A<br />
Wetland Hydrology Present Yes No<br />
(includes capillary fringe)<br />
Describe Recorded Data (stream gauge, monitoring well, aerial photos, previous inspections), if available:<br />
Remarks:<br />
Based on topographic position, developed land upslope, and mapped non-hydric soil, it is unlikely that this area meets the wetland hydrology<br />
criterion.<br />
US Army Corps <strong>of</strong> Engineers Arid West – Version 2.0
<strong>WETLAND</strong> <strong>DETERMINATION</strong> <strong>DATA</strong> <strong>FORM</strong> – Arid West Region<br />
Project/Site: <strong>Pendleton</strong> <strong>City</strong>/County: Umatilla Sampling Date: 5/18/2011<br />
Applicant/Owner: <strong>City</strong> <strong>of</strong> <strong>Pendleton</strong> State: OR Sampling Point: 28<br />
Investigator(s): LW/ACS Section, Township, Range:<br />
Landform (hillslope, terrace, etc.): Tutuilla Creek Local relief (concave, convex, none) none Slope (%) 5%<br />
Subregion (LRR): Arid Lands Lat: Long: Datum:<br />
Soil Map Unit Name: 39A: Hermiston silt loam, 0-3% slopes NWI Classification: PSSC<br />
Are climatic/hydrologic site conditions typical for this time <strong>of</strong> year Yes No (If no, explain in Remarks.)<br />
Are Vegetation Soil or Hydrology significantly disturbed Are “Normal Circumstances” present Yes No<br />
Are Vegetation Soil or Hydrology naturally problematic (If needed, explain any answers in Remarks”)<br />
SUMMARY OF FINDINGS – Attach site map showing sampling point locations, transects, important features, etc.<br />
Hydrophytic Vegetation Present Yes No<br />
Hydric Soil Present Yes No<br />
Wetland Hydrology Present Yes No<br />
Is the Sampled Area<br />
within a Wetland Yes No<br />
Remarks: OFFSITE - plot taken at the Tutuilla Road bridge near Murphy Road. Tutuilla Creek is somewhat incised with minimal overflow above top <strong>of</strong><br />
bank at this location despite recent heavy flows. Taken near areas 38, 60, 121, and 123. Paired with Plot 29.<br />
VEGETATION – Use scientific names <strong>of</strong> plants.<br />
Absolute Dominant Indicator<br />
Tree Stratum (Plot size: 30' r) % Cover Species Status<br />
1.<br />
2.<br />
3.<br />
4.<br />
Sapling/Shrub Stratum (Plot size: 5' r)<br />
0% = Total Cover<br />
1. Salix geyeriana 80% FACW+<br />
2.<br />
3.<br />
4.<br />
5.<br />
Herb Stratum (Plot size: 5' r)<br />
80% = Total Cover<br />
1. Conium maculatum 15% FAC+<br />
2. Phalaris arundinacea 10% FACW<br />
3. Epilobium sp. T<br />
4.<br />
5.<br />
6.<br />
7.<br />
8.<br />
9.<br />
10.<br />
11.<br />
Woody Vine Stratum (Plot size: 30' r)<br />
1.<br />
2.<br />
25% = Total Cover<br />
Dominance Test worksheet:<br />
Number <strong>of</strong> Dominant Species<br />
That Are OBL, FACW, or FAC:<br />
Total Number <strong>of</strong> Dominant<br />
Species Across All Strata:<br />
Percent <strong>of</strong> Dominant Species<br />
That Are OBL, FACW, or FAC:<br />
0 = Total Cover<br />
% Bare Ground in Herb Stratum: 75%<br />
Remarks:<br />
Stream has near-vertical banks leading to a high terrace at this location. Wetland vegetation is limited to a thin margin where slopes are slightly<br />
shallower and areas <strong>of</strong> bank failure. Otherwise, most vegetation below top <strong>of</strong> bank has been scoured away.<br />
3 (A)<br />
3 (B)<br />
100 (A/B)<br />
Prevalence Index worksheet:<br />
Total % Cover <strong>of</strong>:<br />
Multiply by:<br />
OBL species x 1 =<br />
FACW species x 2 =<br />
FAC species x 3 =<br />
FACU species x 4 =<br />
UPL species x 5 =<br />
Column Totals<br />
Prevalence Index = B/A =<br />
Hydrophytic Vegetation Indicators:<br />
Dominance Test is >50%<br />
Prevalence Index is ≤3.0 1<br />
Morphological Adaptations 1 (Provide supporting<br />
data in Remarks or on a separate sheet)<br />
Wetland Non-Vascular Plants 1<br />
Problematic Hydrophytic Vegetation 1 (Explain)<br />
1 Indicators <strong>of</strong> hydric soil and wetland hydrology must<br />
be present, unless disturbed or problematic.<br />
Hydrophytic<br />
Vegetation<br />
Present Yes No<br />
US Army Corps <strong>of</strong> Engineers Arid West – Version 2.0
SOIL Sampling Point: 28<br />
Pr<strong>of</strong>ile Description: (Describe to the depth needed to document the indicator or confirm the absence <strong>of</strong> indicators.)<br />
Depth Matrix Redox Features<br />
(inches) Color (moist) % Color (moist) % Type 1 Loc 2 Texture Remarks<br />
1 Type: C=Concentration, D=Depletion, RM=Reduced Matrix, CS=Covered or Coated Sand Grains.<br />
2 Location: PL=Pore Lining, M=Matrix.<br />
Hydric Soil Indicators: (Applicable to all LRRs, unless otherwise noted.) Indicators for Problematic Hydric Soils 3 :<br />
Histosol (A1) Sandy Redox (S5) 1 cm Muck (A9) (LRR D)<br />
Histic Epipedon (A2) Stripped Matrix (S6) 2 cm Muck (A10)<br />
Black Histic (A3) Loamy Mucky Mineral (F1) (except MLRA 1) Reduced Vertic (F18)<br />
Hydrogen Sulfide (A4) Loamy Gleyed Matrix (F2) Red Parent Material (TF2)<br />
Stratified Layers (A5) (LRR C) Depleted Matrix (F3) Other (Explain in Remarks)<br />
1 cm Muck (A9) (LRR D) Redox Dark Surface (F6)<br />
Depleted Below Dark Surface (A11) Depleted Dark Surface (F7)<br />
Thick Dark Surface (A12)<br />
Redox Depressions (F8)<br />
3 Indicators <strong>of</strong> hydrophytic vegetation and<br />
Sandy Mucky Mineral (S1) Vernal Pools (F9) wetland hydrology must be present,<br />
Sandy Gleyed Matrix (S4)<br />
unless disturbed or problematic.<br />
Restrictive Layer (if present):<br />
Type: ---<br />
Depth (inches): --- Hydric Soil Present Yes No<br />
Remarks:<br />
OFFSITE - subsurface soil conditions not observed.<br />
HYDROLOGY<br />
Wetland Hydrology Indicators:<br />
Primary Indicators (minimum <strong>of</strong> one required; check all that apply)<br />
Secondary Indicators (2 or more required)<br />
Surface Water (A1) Salt Crust (B11) Water Marks (B1) (Riverine)<br />
Saturation (A3) Aquatic Invertebrates (B13) Sediment Deposits (B2) (Riverine)<br />
Water Marks (B1) (Nonriverine) Hydrogen Sulfide Odor (C1) Drift Deposits (B3) (Riverine)<br />
Sediment Deposits (B2) (Nonriverine) Oxidized Rhizospheres along Living Roots (C3) Drainage Patterns (B10)<br />
Drift Deposits (B3) (Nonriverine) Presence <strong>of</strong> Reduced Iron (C4) Dry-Season Water Table (C2)<br />
Surface Soil Cracks (B6) Recent Iron Reduction in Tilled Soils (C6) Crayfish Burrows (C8)<br />
Inundation Visible on Aerial Imagery (B7) Thin Muck Surface (C7) Saturation Visible on Aerial Imagery (C9)<br />
Water-Stained Leaves (B9) Other (Explain in Remarks) Shallow Aquitard (D3)<br />
FAC-Neutral Test (D5)<br />
Field Observations:<br />
Surface Water Present Yes No Depth (inches):~12<br />
Water Table Present Yes No Depth (inches): N/A<br />
Saturation Present Yes No Depth (inches): N/A<br />
Wetland Hydrology Present Yes No<br />
(includes capillary fringe)<br />
Describe Recorded Data (stream gauge, monitoring well, aerial photos, previous inspections), if available:<br />
Remarks:<br />
US Army Corps <strong>of</strong> Engineers Arid West – Version 2.0
<strong>WETLAND</strong> <strong>DETERMINATION</strong> <strong>DATA</strong> <strong>FORM</strong> – Arid West Region<br />
Project/Site: <strong>Pendleton</strong> <strong>City</strong>/County: Umatilla Sampling Date: 5/18/2011<br />
Applicant/Owner: <strong>City</strong> <strong>of</strong> <strong>Pendleton</strong> State: OR Sampling Point: 29<br />
Investigator(s): LW/ACS Section, Township, Range:<br />
Landform (hillslope, terrace, etc.): Tutuilla Creek Local relief (concave, convex, none) none Slope (%) 5%<br />
Subregion (LRR): Arid Lands Lat: Long: Datum:<br />
Soil Map Unit Name: 39A: Hermiston silt loam, 0-3% slopes NWI Classification:<br />
Are climatic/hydrologic site conditions typical for this time <strong>of</strong> year Yes No (If no, explain in Remarks.)<br />
Are Vegetation Soil or Hydrology significantly disturbed Are “Normal Circumstances” present Yes No<br />
Are Vegetation Soil or Hydrology naturally problematic (If needed, explain any answers in Remarks”)<br />
SUMMARY OF FINDINGS – Attach site map showing sampling point locations, transects, important features, etc.<br />
Hydrophytic Vegetation Present Yes No<br />
Is the Sampled Area<br />
Hydric Soil Present Yes No<br />
within a Wetland Yes No<br />
Wetland Hydrology Present Yes No<br />
Remarks: OFFSITE - plots taken at the Tutuilla Road bridge near Murphy Road. Typical <strong>of</strong> sites 38, 60, 121, and 123. Paired with Plot 28.<br />
VEGETATION – Use scientific names <strong>of</strong> plants.<br />
Absolute Dominant Indicator<br />
Tree Stratum (Plot size: 30' r) % Cover Species Status<br />
1.<br />
2.<br />
3.<br />
4.<br />
Sapling/Shrub Stratum (Plot size: 5' r)<br />
0% = Total Cover<br />
1. Salix geyeriana 20% FACW+<br />
2.<br />
3.<br />
4.<br />
5.<br />
Herb Stratum (Plot size: 5' r)<br />
20% = Total Cover<br />
1. Conium maculatum T FAC+<br />
2. Phalaris arundinacea T FACW<br />
3. Bromus tectorum 80 NL<br />
4. Bromus rigidus 10 NL<br />
5. Poa bulbosa 5 NL<br />
6. Elymus glaucus 5 FACU<br />
7.<br />
8.<br />
9.<br />
10.<br />
11.<br />
Woody Vine Stratum (Plot size: 30' r)<br />
1.<br />
2.<br />
100% = Total Cover<br />
Dominance Test worksheet:<br />
Number <strong>of</strong> Dominant Species<br />
That Are OBL, FACW, or FAC:<br />
Total Number <strong>of</strong> Dominant<br />
Species Across All Strata:<br />
Percent <strong>of</strong> Dominant Species<br />
That Are OBL, FACW, or FAC:<br />
0 = Total Cover<br />
% Bare Ground in Herb Stratum: 0%<br />
Remarks:<br />
Stream has near-vertical banks leading to a high terrace at this location. Wetland vegetation is limited to a thin margin where slopes are slightly<br />
shallower and areas <strong>of</strong> bank failure. Otherwise, most vegetation below top <strong>of</strong> bank has been scoured away.<br />
1 (A)<br />
2 (B)<br />
50 (A/B)<br />
Prevalence Index worksheet:<br />
Total % Cover <strong>of</strong>:<br />
Multiply by:<br />
OBL species 0 x 1 = 0<br />
FACW species 20 x 2 = 40<br />
FAC species 0 x 3 = 0<br />
FACU species 5 x 4 = 20<br />
UPL species 95 x 5 = 475<br />
Column Totals 120 535<br />
Prevalence Index = B/A = 4.46<br />
Hydrophytic Vegetation Indicators:<br />
Dominance Test is >50%<br />
Prevalence Index is ≤3.0 1<br />
Morphological Adaptations 1 (Provide supporting<br />
data in Remarks or on a separate sheet)<br />
Wetland Non-Vascular Plants 1<br />
Problematic Hydrophytic Vegetation 1 (Explain)<br />
1 Indicators <strong>of</strong> hydric soil and wetland hydrology must<br />
be present, unless disturbed or problematic.<br />
Hydrophytic<br />
Vegetation<br />
Present Yes No<br />
US Army Corps <strong>of</strong> Engineers Arid West – Version 2.0
SOIL Sampling Point: 29<br />
Pr<strong>of</strong>ile Description: (Describe to the depth needed to document the indicator or confirm the absence <strong>of</strong> indicators.)<br />
Depth Matrix Redox Features<br />
(inches) Color (moist) % Color (moist) % Type 1 Loc 2 Texture Remarks<br />
1 Type: C=Concentration, D=Depletion, RM=Reduced Matrix, CS=Covered or Coated Sand Grains.<br />
2 Location: PL=Pore Lining, M=Matrix.<br />
Hydric Soil Indicators: (Applicable to all LRRs, unless otherwise noted.) Indicators for Problematic Hydric Soils 3 :<br />
Histosol (A1) Sandy Redox (S5) 1 cm Muck (A9) (LRR D)<br />
Histic Epipedon (A2) Stripped Matrix (S6) 2 cm Muck (A10)<br />
Black Histic (A3) Loamy Mucky Mineral (F1) (except MLRA 1) Reduced Vertic (F18)<br />
Hydrogen Sulfide (A4) Loamy Gleyed Matrix (F2) Red Parent Material (TF2)<br />
Stratified Layers (A5) (LRR C) Depleted Matrix (F3) Other (Explain in Remarks)<br />
1 cm Muck (A9) (LRR D) Redox Dark Surface (F6)<br />
Depleted Below Dark Surface (A11) Depleted Dark Surface (F7)<br />
Thick Dark Surface (A12)<br />
Redox Depressions (F8)<br />
3 Indicators <strong>of</strong> hydrophytic vegetation and<br />
Sandy Mucky Mineral (S1) Vernal Pools (F9) wetland hydrology must be present,<br />
Sandy Gleyed Matrix (S4)<br />
unless disturbed or problematic.<br />
Restrictive Layer (if present):<br />
Type: ---<br />
Depth (inches): --- Hydric Soil Present Yes No<br />
Remarks:<br />
OFFSITE - subsurface soil conditions not observed.<br />
HYDROLOGY<br />
Wetland Hydrology Indicators:<br />
Primary Indicators (minimum <strong>of</strong> one required; check all that apply)<br />
Secondary Indicators (2 or more required)<br />
Surface Water (A1) Salt Crust (B11) Water Marks (B1) (Riverine)<br />
Saturation (A3) Aquatic Invertebrates (B13) Sediment Deposits (B2) (Riverine)<br />
Water Marks (B1) (Nonriverine) Hydrogen Sulfide Odor (C1) Drift Deposits (B3) (Riverine)<br />
Sediment Deposits (B2) (Nonriverine) Oxidized Rhizospheres along Living Roots (C3) Drainage Patterns (B10)<br />
Drift Deposits (B3) (Nonriverine) Presence <strong>of</strong> Reduced Iron (C4) Dry-Season Water Table (C2)<br />
Surface Soil Cracks (B6) Recent Iron Reduction in Tilled Soils (C6) Crayfish Burrows (C8)<br />
Inundation Visible on Aerial Imagery (B7) Thin Muck Surface (C7) Saturation Visible on Aerial Imagery (C9)<br />
Water-Stained Leaves (B9) Other (Explain in Remarks) Shallow Aquitard (D3)<br />
FAC-Neutral Test (D5)<br />
Field Observations:<br />
Surface Water Present Yes No Depth (inches):N/A<br />
Water Table Present Yes No Depth (inches): N/A<br />
Saturation Present Yes No Depth (inches): N/A<br />
Wetland Hydrology Present Yes No<br />
(includes capillary fringe)<br />
Describe Recorded Data (stream gauge, monitoring well, aerial photos, previous inspections), if available:<br />
Remarks:<br />
Plot taken above extent <strong>of</strong> indicators <strong>of</strong> recent inundation.<br />
US Army Corps <strong>of</strong> Engineers Arid West – Version 2.0
<strong>WETLAND</strong> <strong>DETERMINATION</strong> <strong>DATA</strong> <strong>FORM</strong> – Arid West Region<br />
Project/Site: <strong>Pendleton</strong> <strong>City</strong>/County: Umatilla Sampling Date: 5/19/2011<br />
Applicant/Owner: <strong>City</strong> <strong>of</strong> <strong>Pendleton</strong> State: OR Sampling Point: 30<br />
Investigator(s): LW/ACS Section, Township, Range:<br />
Landform (hillslope, terrace, etc.): Tutuilla Creek @ Nye Local relief (concave, convex, none) none Slope (%) 5%<br />
Subregion (LRR): Arid Lands Lat: Long: Datum:<br />
Soil Map Unit Name: 39A: Hermiston silt loam, 0-3% slopes NWI Classification:<br />
Are climatic/hydrologic site conditions typical for this time <strong>of</strong> year Yes No (If no, explain in Remarks.)<br />
Are Vegetation Soil or Hydrology significantly disturbed Are “Normal Circumstances” present Yes No<br />
Are Vegetation Soil or Hydrology naturally problematic (If needed, explain any answers in Remarks”)<br />
SUMMARY OF FINDINGS – Attach site map showing sampling point locations, transects, important features, etc.<br />
Hydrophytic Vegetation Present Yes No<br />
Hydric Soil Present Yes No<br />
Wetland Hydrology Present Yes No<br />
Is the Sampled Area<br />
within a Wetland Yes No<br />
Remarks: OFFSITE - plots taken at the Tutuilla Road bridge near Nye Street. Surrounding area is a combination <strong>of</strong> residential property <strong>of</strong> various<br />
sizes. Near site 35. Paired with Plot 31. Mapped as Potential Wetland (PW) on the basis <strong>of</strong> landscape position, vegetation and hydrologic indicators,<br />
and size.<br />
VEGETATION – Use scientific names <strong>of</strong> plants.<br />
Absolute Dominant Indicator<br />
Tree Stratum (Plot size: 30' r) % Cover Species Status<br />
1.<br />
2.<br />
3.<br />
4.<br />
0% = Total Cover<br />
Sapling/Shrub Stratum (Plot size: 5' r)<br />
1. Salix geyeriana 20% FACW+<br />
2.<br />
3.<br />
4.<br />
5.<br />
20% = Total Cover<br />
Herb Stratum (Plot size: 5' r)<br />
1. Conium maculatum 10 FAC+<br />
2. Phalaris arundinacea 15 FACW<br />
3. Lapsana communis 10 NI<br />
4.<br />
5.<br />
6.<br />
7.<br />
8.<br />
9.<br />
10.<br />
11.<br />
35% = Total Cover<br />
Woody Vine Stratum (Plot size: 30' r)<br />
1.<br />
2.<br />
0 = Total Cover<br />
% Bare Ground in Herb Stratum: 65%<br />
Dominance Test worksheet:<br />
Number <strong>of</strong> Dominant Species<br />
That Are OBL, FACW, or FAC:<br />
Total Number <strong>of</strong> Dominant<br />
Species Across All Strata:<br />
Percent <strong>of</strong> Dominant Species<br />
That Are OBL, FACW, or FAC:<br />
3 (A)<br />
4 (B)<br />
75% (A/B)<br />
Prevalence Index worksheet:<br />
Total % Cover <strong>of</strong>:<br />
Multiply by:<br />
OBL species x 1 =<br />
FACW species x 2 =<br />
FAC species x 3 =<br />
FACU species x 4 =<br />
UPL species x 5 =<br />
Column Totals<br />
Prevalence Index = B/A =<br />
Hydrophytic Vegetation Indicators:<br />
Dominance Test is >50%<br />
Prevalence Index is ≤3.0 1<br />
Morphological Adaptations 1 (Provide supporting<br />
data in Remarks or on a separate sheet)<br />
Wetland Non-Vascular Plants 1<br />
Problematic Hydrophytic Vegetation 1 (Explain)<br />
1 Indicators <strong>of</strong> hydric soil and wetland hydrology must<br />
be present, unless disturbed or problematic.<br />
Hydrophytic<br />
Vegetation<br />
Present Yes No<br />
US Army Corps <strong>of</strong> Engineers Arid West – Version 2.0
Remarks:<br />
Much <strong>of</strong> the vegetation in this reach has been severely eroded by recent high flows.<br />
US Army Corps <strong>of</strong> Engineers Arid West – Version 2.0
SOIL Sampling Point: 30<br />
Pr<strong>of</strong>ile Description: (Describe to the depth needed to document the indicator or confirm the absence <strong>of</strong> indicators.)<br />
Depth Matrix Redox Features<br />
(inches) Color (moist) % Color (moist) % Type 1 Loc 2 Texture Remarks<br />
1 Type: C=Concentration, D=Depletion, RM=Reduced Matrix, CS=Covered or Coated Sand Grains.<br />
2 Location: PL=Pore Lining, M=Matrix.<br />
Hydric Soil Indicators: (Applicable to all LRRs, unless otherwise noted.) Indicators for Problematic Hydric Soils 3 :<br />
Histosol (A1) Sandy Redox (S5) 1 cm Muck (A9) (LRR D)<br />
Histic Epipedon (A2) Stripped Matrix (S6) 2 cm Muck (A10)<br />
Black Histic (A3) Loamy Mucky Mineral (F1) (except MLRA 1) Reduced Vertic (F18)<br />
Hydrogen Sulfide (A4) Loamy Gleyed Matrix (F2) Red Parent Material (TF2)<br />
Stratified Layers (A5) (LRR C) Depleted Matrix (F3) Other (Explain in Remarks)<br />
1 cm Muck (A9) (LRR D) Redox Dark Surface (F6)<br />
Depleted Below Dark Surface (A11) Depleted Dark Surface (F7)<br />
Thick Dark Surface (A12)<br />
Redox Depressions (F8)<br />
3 Indicators <strong>of</strong> hydrophytic vegetation and<br />
Sandy Mucky Mineral (S1) Vernal Pools (F9) wetland hydrology must be present,<br />
Sandy Gleyed Matrix (S4)<br />
unless disturbed or problematic.<br />
Restrictive Layer (if present):<br />
Type: ---<br />
Depth (inches): --- Hydric Soil Present Yes No<br />
Remarks:<br />
OFFSITE - subsurface soil conditions not observed.<br />
HYDROLOGY<br />
Wetland Hydrology Indicators:<br />
Primary Indicators (minimum <strong>of</strong> one required; check all that apply)<br />
Secondary Indicators (2 or more required)<br />
Surface Water (A1) Salt Crust (B11) Water Marks (B1) (Riverine)<br />
Saturation (A3) Aquatic Invertebrates (B13) Sediment Deposits (B2) (Riverine)<br />
Water Marks (B1) (Nonriverine) Hydrogen Sulfide Odor (C1) Drift Deposits (B3) (Riverine)<br />
Sediment Deposits (B2) (Nonriverine) Oxidized Rhizospheres along Living Roots (C3) Drainage Patterns (B10)<br />
Drift Deposits (B3) (Nonriverine) Presence <strong>of</strong> Reduced Iron (C4) Dry-Season Water Table (C2)<br />
Surface Soil Cracks (B6) Recent Iron Reduction in Tilled Soils (C6) Crayfish Burrows (C8)<br />
Inundation Visible on Aerial Imagery (B7) Thin Muck Surface (C7) Saturation Visible on Aerial Imagery (C9)<br />
Water-Stained Leaves (B9) Other (Explain in Remarks) Shallow Aquitard (D3)<br />
FAC-Neutral Test (D5)<br />
Field Observations:<br />
Surface Water Present Yes No Depth (inches):evidence <strong>of</strong> high flows<br />
Water Table Present Yes No Depth (inches): N/A<br />
Saturation Present Yes No Depth (inches): N/A<br />
Wetland Hydrology Present Yes No<br />
(includes capillary fringe)<br />
Describe Recorded Data (stream gauge, monitoring well, aerial photos, previous inspections), if available:<br />
Remarks:<br />
Plot taken below OHW, but in area affected by recent high flows. This damaged reach <strong>of</strong> Tutuilla Creek is immediately downstream <strong>of</strong> the confluence<br />
with Patawa Creek and extends at least several hundred feet downstream.<br />
US Army Corps <strong>of</strong> Engineers Arid West – Version 2.0
<strong>WETLAND</strong> <strong>DETERMINATION</strong> <strong>DATA</strong> <strong>FORM</strong> – Arid West Region<br />
Project/Site: <strong>Pendleton</strong> <strong>City</strong>/County: Umatilla Sampling Date: 5/19/2011<br />
Applicant/Owner: <strong>City</strong> <strong>of</strong> <strong>Pendleton</strong> State: OR Sampling Point: 31<br />
Investigator(s): LW/ACS Section, Township, Range:<br />
Landform (hillslope, terrace, etc.): Tutuilla Creek @ Nye Local relief (concave, convex, none) none Slope (%) 5%<br />
Subregion (LRR): Arid Lands Lat: Long: Datum:<br />
Soil Map Unit Name: 39A: Hermiston silt loam, 0-3% slopes NWI Classification:<br />
Are climatic/hydrologic site conditions typical for this time <strong>of</strong> year Yes No (If no, explain in Remarks.)<br />
Are Vegetation Soil or Hydrology significantly disturbed Are “Normal Circumstances” present Yes No<br />
Are Vegetation Soil or Hydrology naturally problematic (If needed, explain any answers in Remarks”)<br />
SUMMARY OF FINDINGS – Attach site map showing sampling point locations, transects, important features, etc.<br />
Hydrophytic Vegetation Present Yes No<br />
Hydric Soil Present Yes No<br />
Wetland Hydrology Present Yes No<br />
Is the Sampled Area<br />
within a Wetland Yes No<br />
Remarks: OFFSITE - plots taken at the Tutuilla Road bridge near Nye Street. Surrounding area is a combination <strong>of</strong> residential property <strong>of</strong> various<br />
sizes. Plot taken at site 35. Plot paired with Plot 30.<br />
VEGETATION – Use scientific names <strong>of</strong> plants.<br />
Absolute Dominant Indicator<br />
Tree Stratum (Plot size: 30' r) % Cover Species Status<br />
1.<br />
2.<br />
3.<br />
4.<br />
0% = Total Cover<br />
Sapling/Shrub Stratum (Plot size: 5' r)<br />
1.<br />
2.<br />
3.<br />
4.<br />
5.<br />
0% = Total Cover<br />
Herb Stratum (Plot size: 5' r)<br />
1. Elymus glaucus (planted) 100 FACU<br />
2.<br />
3.<br />
4.<br />
5.<br />
6.<br />
7.<br />
8.<br />
9.<br />
10.<br />
11.<br />
100% = Total Cover<br />
Woody Vine Stratum (Plot size: 30' r)<br />
1.<br />
2.<br />
0 = Total Cover<br />
% Bare Ground in Herb Stratum: 0%<br />
Remarks:<br />
Dominance Test worksheet:<br />
Number <strong>of</strong> Dominant Species<br />
That Are OBL, FACW, or FAC:<br />
Total Number <strong>of</strong> Dominant<br />
Species Across All Strata:<br />
Percent <strong>of</strong> Dominant Species<br />
That Are OBL, FACW, or FAC:<br />
0 (A)<br />
1 (B)<br />
0 (A/B)<br />
Prevalence Index worksheet:<br />
Total % Cover <strong>of</strong>:<br />
Multiply by:<br />
OBL species x 1 =<br />
FACW species x 2 =<br />
FAC species x 3 =<br />
FACU species 100 x 4 = 400<br />
UPL species x 5 =<br />
Column Totals 100 400<br />
Prevalence Index = B/A = 4.00<br />
Hydrophytic Vegetation Indicators:<br />
Dominance Test is >50%<br />
Prevalence Index is ≤3.0 1<br />
Morphological Adaptations 1 (Provide supporting<br />
data in Remarks or on a separate sheet)<br />
Wetland Non-Vascular Plants 1<br />
Problematic Hydrophytic Vegetation 1 (Explain)<br />
1 Indicators <strong>of</strong> hydric soil and wetland hydrology must<br />
be present, unless disturbed or problematic.<br />
Hydrophytic<br />
Vegetation<br />
Present Yes No<br />
US Army Corps <strong>of</strong> Engineers Arid West – Version 2.0
SOIL Sampling Point: 31<br />
Pr<strong>of</strong>ile Description: (Describe to the depth needed to document the indicator or confirm the absence <strong>of</strong> indicators.)<br />
Depth Matrix Redox Features<br />
(inches) Color (moist) % Color (moist) % Type 1 Loc 2 Texture Remarks<br />
1 Type: C=Concentration, D=Depletion, RM=Reduced Matrix, CS=Covered or Coated Sand Grains.<br />
2 Location: PL=Pore Lining, M=Matrix.<br />
Hydric Soil Indicators: (Applicable to all LRRs, unless otherwise noted.) Indicators for Problematic Hydric Soils 3 :<br />
Histosol (A1) Sandy Redox (S5) 1 cm Muck (A9) (LRR D)<br />
Histic Epipedon (A2) Stripped Matrix (S6) 2 cm Muck (A10)<br />
Black Histic (A3) Loamy Mucky Mineral (F1) (except MLRA 1) Reduced Vertic (F18)<br />
Hydrogen Sulfide (A4) Loamy Gleyed Matrix (F2) Red Parent Material (TF2)<br />
Stratified Layers (A5) (LRR C) Depleted Matrix (F3) Other (Explain in Remarks)<br />
1 cm Muck (A9) (LRR D) Redox Dark Surface (F6)<br />
Depleted Below Dark Surface (A11) Depleted Dark Surface (F7)<br />
Thick Dark Surface (A12)<br />
Redox Depressions (F8)<br />
3 Indicators <strong>of</strong> hydrophytic vegetation and<br />
Sandy Mucky Mineral (S1) Vernal Pools (F9) wetland hydrology must be present,<br />
Sandy Gleyed Matrix (S4)<br />
unless disturbed or problematic.<br />
Restrictive Layer (if present):<br />
Type: ---<br />
Depth (inches): --- Hydric Soil Present Yes No<br />
Remarks:<br />
OFFSITE - subsurface soil conditions not observed.<br />
HYDROLOGY<br />
Wetland Hydrology Indicators:<br />
Primary Indicators (minimum <strong>of</strong> one required; check all that apply)<br />
Secondary Indicators (2 or more required)<br />
Surface Water (A1) Salt Crust (B11) Water Marks (B1) (Riverine)<br />
Saturation (A3) Aquatic Invertebrates (B13) Sediment Deposits (B2) (Riverine)<br />
Water Marks (B1) (Nonriverine) Hydrogen Sulfide Odor (C1) Drift Deposits (B3) (Riverine)<br />
Sediment Deposits (B2) (Nonriverine) Oxidized Rhizospheres along Living Roots (C3) Drainage Patterns (B10)<br />
Drift Deposits (B3) (Nonriverine) Presence <strong>of</strong> Reduced Iron (C4) Dry-Season Water Table (C2)<br />
Surface Soil Cracks (B6) Recent Iron Reduction in Tilled Soils (C6) Crayfish Burrows (C8)<br />
Inundation Visible on Aerial Imagery (B7) Thin Muck Surface (C7) Saturation Visible on Aerial Imagery (C9)<br />
Water-Stained Leaves (B9) Other (Explain in Remarks) Shallow Aquitard (D3)<br />
FAC-Neutral Test (D5)<br />
Field Observations:<br />
Surface Water Present Yes No Depth (inches):<br />
Water Table Present Yes No Depth (inches): N/A<br />
Saturation Present Yes No Depth (inches): N/A<br />
Wetland Hydrology Present Yes No<br />
(includes capillary fringe)<br />
Describe Recorded Data (stream gauge, monitoring well, aerial photos, previous inspections), if available:<br />
Remarks:<br />
Plot taken above area affected by recent high flows.<br />
US Army Corps <strong>of</strong> Engineers Arid West – Version 2.0
<strong>WETLAND</strong> <strong>DETERMINATION</strong> <strong>DATA</strong> <strong>FORM</strong> – Arid West Region<br />
Project/Site: <strong>Pendleton</strong> <strong>City</strong>/County: Umatilla Sampling Date: 5/19/2011<br />
Applicant/Owner: <strong>City</strong> <strong>of</strong> <strong>Pendleton</strong> State: OR Sampling Point: 32<br />
Investigator(s): LW/ACS Section, Township, Range:<br />
Landform (hillslope, terrace, etc.): Patawa Creek Local relief (concave, convex, none) Concave Slope (%) 5%<br />
Subregion (LRR): Arid Lands Lat: Long: Datum:<br />
Soil Map Unit Name: 39A: Hermiston silt loam, 0-3% NWI Classification:<br />
Are climatic/hydrologic site conditions typical for this time <strong>of</strong> year Yes No (If no, explain in Remarks.)<br />
Are Vegetation Soil or Hydrology significantly disturbed Are “Normal Circumstances” present Yes No<br />
Are Vegetation Soil or Hydrology naturally problematic (If needed, explain any answers in Remarks”)<br />
SUMMARY OF FINDINGS – Attach site map showing sampling point locations, transects, important features, etc.<br />
Hydrophytic Vegetation Present Yes No<br />
Hydric Soil Present Yes No<br />
Wetland Hydrology Present Yes No<br />
Is the Sampled Area<br />
within a Wetland Yes No<br />
Remarks: OFFSITE - Patawa Creek viewed from Tutuilla Creek Road near confluence with Tutuilla Creek at Nye Street. The short segment <strong>of</strong><br />
Patawa Creek between Tutilla Creek Road and the confluence has been virtually stripped <strong>of</strong> vegetation. This plot characterizes the reach that starts<br />
upstream <strong>of</strong> the bridge where vegetation is relatively unaltered. Site 35.<br />
VEGETATION – Use scientific names <strong>of</strong> plants.<br />
Absolute Dominant Indicator<br />
Tree Stratum (Plot size: 30' r) % Cover Species Status<br />
1. Elaeagnus angustifolia 20 FAC<br />
2.<br />
3.<br />
4.<br />
20% = Total Cover<br />
Sapling/Shrub Stratum (Plot size: 5' r)<br />
1. Salix geyeriana 20% FACW+<br />
2.<br />
3.<br />
4.<br />
5.<br />
20% = Total Cover<br />
Herb Stratum (Plot size: 5' r)<br />
1. Phalaris arundinacea 10% FACW<br />
2. Conium maculatum 15% FAC+<br />
3. Lapsana communis 10% FAC<br />
4.<br />
5.<br />
6.<br />
7.<br />
8.<br />
9.<br />
10.<br />
11.<br />
35% = Total Cover<br />
Woody Vine Stratum (Plot size: 30' r)<br />
1.<br />
2.<br />
0 = Total Cover<br />
% Bare Ground in Herb Stratum: 65%<br />
Dominance Test worksheet:<br />
Number <strong>of</strong> Dominant Species<br />
That Are OBL, FACW, or FAC:<br />
Total Number <strong>of</strong> Dominant<br />
Species Across All Strata:<br />
Percent <strong>of</strong> Dominant Species<br />
That Are OBL, FACW, or FAC:<br />
5 (A)<br />
5 (B)<br />
100 (A/B)<br />
Prevalence Index worksheet:<br />
Total % Cover <strong>of</strong>:<br />
Multiply by:<br />
OBL species x 1 =<br />
FACW species x 2 =<br />
FAC species x 3 =<br />
FACU species x 4 =<br />
UPL species x 5 =<br />
Column Totals<br />
Prevalence Index = B/A =<br />
Hydrophytic Vegetation Indicators:<br />
Dominance Test is >50%<br />
Prevalence Index is ≤3.0 1<br />
Morphological Adaptations 1 (Provide supporting<br />
data in Remarks or on a separate sheet)<br />
Wetland Non-Vascular Plants 1<br />
Problematic Hydrophytic Vegetation 1 (Explain)<br />
1 Indicators <strong>of</strong> hydric soil and wetland hydrology must<br />
be present, unless disturbed or problematic.<br />
Hydrophytic<br />
Vegetation<br />
Present Yes No<br />
US Army Corps <strong>of</strong> Engineers Arid West – Version 2.0
Remarks:<br />
Channel is somewhat incised. Wet margin consists <strong>of</strong> near-vertical banks, parts <strong>of</strong> the bank that have sloughed, and a narrow fringe influenced by<br />
peak flows.<br />
US Army Corps <strong>of</strong> Engineers Arid West – Version 2.0
SOIL Sampling Point: 32<br />
Pr<strong>of</strong>ile Description: (Describe to the depth needed to document the indicator or confirm the absence <strong>of</strong> indicators.)<br />
Depth Matrix Redox Features<br />
(inches) Color (moist) % Color (moist) % Type 1 Loc 2 Texture Remarks<br />
1 Type: C=Concentration, D=Depletion, RM=Reduced Matrix, CS=Covered or Coated Sand Grains.<br />
2 Location: PL=Pore Lining, M=Matrix.<br />
Hydric Soil Indicators: (Applicable to all LRRs, unless otherwise noted.) Indicators for Problematic Hydric Soils 3 :<br />
Histosol (A1) Sandy Redox (S5) 1 cm Muck (A9) (LRR D)<br />
Histic Epipedon (A2) Stripped Matrix (S6) 2 cm Muck (A10)<br />
Black Histic (A3) Loamy Mucky Mineral (F1) (except MLRA 1) Reduced Vertic (F18)<br />
Hydrogen Sulfide (A4) Loamy Gleyed Matrix (F2) Red Parent Material (TF2)<br />
Stratified Layers (A5) (LRR C) Depleted Matrix (F3) Other (Explain in Remarks)<br />
1 cm Muck (A9) (LRR D) Redox Dark Surface (F6)<br />
Depleted Below Dark Surface (A11) Depleted Dark Surface (F7)<br />
Thick Dark Surface (A12)<br />
Redox Depressions (F8)<br />
3 Indicators <strong>of</strong> hydrophytic vegetation and<br />
Sandy Mucky Mineral (S1) Vernal Pools (F9) wetland hydrology must be present,<br />
Sandy Gleyed Matrix (S4)<br />
unless disturbed or problematic.<br />
Restrictive Layer (if present):<br />
Type: ---<br />
Depth (inches): --- Hydric Soil Present Yes No<br />
Remarks:<br />
OFFSITE - subsurface soil conditions not observed.<br />
HYDROLOGY<br />
Wetland Hydrology Indicators:<br />
Primary Indicators (minimum <strong>of</strong> one required; check all that apply)<br />
Secondary Indicators (2 or more required)<br />
Surface Water (A1) Salt Crust (B11) Water Marks (B1) (Riverine)<br />
Saturation (A3) Aquatic Invertebrates (B13) Sediment Deposits (B2) (Riverine)<br />
Water Marks (B1) (Nonriverine) Hydrogen Sulfide Odor (C1) Drift Deposits (B3) (Riverine)<br />
Sediment Deposits (B2) (Nonriverine) Oxidized Rhizospheres along Living Roots (C3) Drainage Patterns (B10)<br />
Drift Deposits (B3) (Nonriverine) Presence <strong>of</strong> Reduced Iron (C4) Dry-Season Water Table (C2)<br />
Surface Soil Cracks (B6) Recent Iron Reduction in Tilled Soils (C6) Crayfish Burrows (C8)<br />
Inundation Visible on Aerial Imagery (B7) Thin Muck Surface (C7) Saturation Visible on Aerial Imagery (C9)<br />
Water-Stained Leaves (B9) Other (Explain in Remarks) Shallow Aquitard (D3)<br />
FAC-Neutral Test (D5)<br />
Field Observations:<br />
Surface Water Present Yes No Depth (inches):In creek<br />
Water Table Present Yes No Depth (inches): N/A<br />
Saturation Present Yes No Depth (inches): N/A<br />
Wetland Hydrology Present Yes No<br />
(includes capillary fringe)<br />
Describe Recorded Data (stream gauge, monitoring well, aerial photos, previous inspections), if available:<br />
Remarks:<br />
Wetland margin subject to overbank flows as evidenced by drift and sediment deposits.<br />
Cowardin : PEMA<br />
HGM: Riverine Flow-Through<br />
US Army Corps <strong>of</strong> Engineers Arid West – Version 2.0
<strong>WETLAND</strong> <strong>DETERMINATION</strong> <strong>DATA</strong> <strong>FORM</strong> – Arid West Region<br />
Project/Site: <strong>Pendleton</strong> <strong>City</strong>/County: Umatilla Sampling Date: 5/19/2011<br />
Applicant/Owner: <strong>City</strong> <strong>of</strong> <strong>Pendleton</strong> State: OR Sampling Point: 33<br />
Investigator(s): LW/ACS Section, Township, Range:<br />
Landform (hillslope, terrace, etc.): Tutuilla Creek @ Hailey Ave. Local relief (concave, convex, none) Concave Slope (%) 2%<br />
Subregion (LRR): Arid Lands Lat: Long: Datum:<br />
Soil Map Unit Name:<br />
NWI Classification:<br />
Are climatic/hydrologic site conditions typical for this time <strong>of</strong> year Yes No (If no, explain in Remarks.)<br />
Are Vegetation Soil or Hydrology significantly disturbed Are “Normal Circumstances” present Yes No<br />
Are Vegetation Soil or Hydrology naturally problematic (If needed, explain any answers in Remarks”)<br />
SUMMARY OF FINDINGS – Attach site map showing sampling point locations, transects, important features, etc.<br />
Hydrophytic Vegetation Present Yes No<br />
Is the Sampled Area<br />
Hydric Soil Present Yes No<br />
within a Wetland Yes No<br />
Wetland Hydrology Present Yes No<br />
Remarks: OFFSITE - Tutuilla Creek viewed from bridge at Hailey Avenue bridge over Tutuilla Creek. Paired with Plot 34.<br />
VEGETATION – Use scientific names <strong>of</strong> plants.<br />
Absolute Dominant Indicator<br />
Tree Stratum (Plot size: 30' r) % Cover Species Status<br />
1.<br />
2.<br />
3.<br />
4.<br />
0% = Total Cover<br />
Sapling/Shrub Stratum (Plot size: 5' r)<br />
1.<br />
2.<br />
3.<br />
4.<br />
5.<br />
0% = Total Cover<br />
Herb Stratum (Plot size: 5' r)<br />
1. Bromus rigidus 15% NL<br />
2. Elymus glaucus 5% FACU<br />
3. Phalaris arundinacea 80% FACW<br />
4.<br />
5.<br />
6.<br />
7.<br />
8.<br />
9.<br />
10.<br />
11.<br />
100% = Total Cover<br />
Woody Vine Stratum (Plot size: 30' r)<br />
1.<br />
2.<br />
0 = Total Cover<br />
% Bare Ground in Herb Stratum: 0%<br />
Remarks:<br />
Plant community in narrow margin affected by high flows.<br />
Dominance Test worksheet:<br />
Number <strong>of</strong> Dominant Species<br />
That Are OBL, FACW, or FAC:<br />
Total Number <strong>of</strong> Dominant<br />
Species Across All Strata:<br />
Percent <strong>of</strong> Dominant Species<br />
That Are OBL, FACW, or FAC:<br />
1 (A)<br />
1 (B)<br />
100 (A/B)<br />
Prevalence Index worksheet:<br />
Total % Cover <strong>of</strong>:<br />
Multiply by:<br />
OBL species x 1 =<br />
FACW species x 2 =<br />
FAC species x 3 =<br />
FACU species x 4 =<br />
UPL species x 5 =<br />
Column Totals<br />
Prevalence Index = B/A =<br />
Hydrophytic Vegetation Indicators:<br />
Dominance Test is >50%<br />
Prevalence Index is ≤3.0 1<br />
Morphological Adaptations 1 (Provide supporting<br />
data in Remarks or on a separate sheet)<br />
Wetland Non-Vascular Plants 1<br />
Problematic Hydrophytic Vegetation 1 (Explain)<br />
1 Indicators <strong>of</strong> hydric soil and wetland hydrology must<br />
be present, unless disturbed or problematic.<br />
Hydrophytic<br />
Vegetation<br />
Present Yes No<br />
US Army Corps <strong>of</strong> Engineers Arid West – Version 2.0
SOIL Sampling Point: 33<br />
Pr<strong>of</strong>ile Description: (Describe to the depth needed to document the indicator or confirm the absence <strong>of</strong> indicators.)<br />
Depth Matrix Redox Features<br />
(inches) Color (moist) % Color (moist) % Type 1 Loc 2 Texture Remarks<br />
1 Type: C=Concentration, D=Depletion, RM=Reduced Matrix, CS=Covered or Coated Sand Grains.<br />
2 Location: PL=Pore Lining, M=Matrix.<br />
Hydric Soil Indicators: (Applicable to all LRRs, unless otherwise noted.) Indicators for Problematic Hydric Soils 3 :<br />
Histosol (A1) Sandy Redox (S5) 1 cm Muck (A9) (LRR D)<br />
Histic Epipedon (A2) Stripped Matrix (S6) 2 cm Muck (A10)<br />
Black Histic (A3) Loamy Mucky Mineral (F1) (except MLRA 1) Reduced Vertic (F18)<br />
Hydrogen Sulfide (A4) Loamy Gleyed Matrix (F2) Red Parent Material (TF2)<br />
Stratified Layers (A5) (LRR C) Depleted Matrix (F3) Other (Explain in Remarks)<br />
1 cm Muck (A9) (LRR D) Redox Dark Surface (F6)<br />
Depleted Below Dark Surface (A11) Depleted Dark Surface (F7)<br />
Thick Dark Surface (A12)<br />
Redox Depressions (F8)<br />
3 Indicators <strong>of</strong> hydrophytic vegetation and<br />
Sandy Mucky Mineral (S1) Vernal Pools (F9) wetland hydrology must be present,<br />
Sandy Gleyed Matrix (S4)<br />
unless disturbed or problematic.<br />
Restrictive Layer (if present):<br />
Type: ---<br />
Depth (inches): --- Hydric Soil Present Yes No<br />
Remarks:<br />
OFFSITE - subsurface soil conditions not observed.<br />
HYDROLOGY<br />
Wetland Hydrology Indicators:<br />
Primary Indicators (minimum <strong>of</strong> one required; check all that apply)<br />
Secondary Indicators (2 or more required)<br />
Surface Water (A1) Salt Crust (B11) Water Marks (B1) (Riverine)<br />
Saturation (A3) Aquatic Invertebrates (B13) Sediment Deposits (B2) (Riverine)<br />
Water Marks (B1) (Nonriverine) Hydrogen Sulfide Odor (C1) Drift Deposits (B3) (Riverine)<br />
Sediment Deposits (B2) (Nonriverine) Oxidized Rhizospheres along Living Roots (C3) Drainage Patterns (B10)<br />
Drift Deposits (B3) (Nonriverine) Presence <strong>of</strong> Reduced Iron (C4) Dry-Season Water Table (C2)<br />
Surface Soil Cracks (B6) Recent Iron Reduction in Tilled Soils (C6) Crayfish Burrows (C8)<br />
Inundation Visible on Aerial Imagery (B7) Thin Muck Surface (C7) Saturation Visible on Aerial Imagery (C9)<br />
Water-Stained Leaves (B9) Other (Explain in Remarks) Shallow Aquitard (D3)<br />
FAC-Neutral Test (D5)<br />
Field Observations:<br />
Surface Water Present Yes No Depth (inches):In creek<br />
Water Table Present Yes No Depth (inches): N/A<br />
Saturation Present Yes No Depth (inches): N/A<br />
Wetland Hydrology Present Yes No<br />
(includes capillary fringe)<br />
Describe Recorded Data (stream gauge, monitoring well, aerial photos, previous inspections), if available:<br />
Remarks:<br />
Wetland margin subject to occasional flooding from high flows above OHW.<br />
Cowardin : PEMC<br />
HGM: Riverine Flow-Through<br />
US Army Corps <strong>of</strong> Engineers Arid West – Version 2.0
<strong>WETLAND</strong> <strong>DETERMINATION</strong> <strong>DATA</strong> <strong>FORM</strong> – Arid West Region<br />
Project/Site: <strong>Pendleton</strong> <strong>City</strong>/County: Umatilla Sampling Date: 5/19/2011<br />
Applicant/Owner: <strong>City</strong> <strong>of</strong> <strong>Pendleton</strong> State: OR Sampling Point: 34<br />
Investigator(s): LW/ACS Section, Township, Range:<br />
Landform (hillslope, terrace, etc.): Tutuilla Creek @ Hailey Ave. Local relief (concave, convex, none) Concave Slope (%) 2%<br />
Subregion (LRR): Arid Lands Lat: Long: Datum:<br />
Soil Map Unit Name: 39A: Hermiston silt loam, 0-3% slopes NWI Classification:<br />
Are climatic/hydrologic site conditions typical for this time <strong>of</strong> year Yes No (If no, explain in Remarks.)<br />
Are Vegetation Soil or Hydrology significantly disturbed Are “Normal Circumstances” present Yes No<br />
Are Vegetation Soil or Hydrology naturally problematic (If needed, explain any answers in Remarks”)<br />
SUMMARY OF FINDINGS – Attach site map showing sampling point locations, transects, important features, etc.<br />
Hydrophytic Vegetation Present Yes No<br />
Is the Sampled Area<br />
Hydric Soil Present Yes No<br />
within a Wetland Yes No<br />
Wetland Hydrology Present Yes No<br />
Remarks: OFFSITE - viewed from bridge at Hailey Avenue. Site 40. Paired with Plot 33<br />
VEGETATION – Use scientific names <strong>of</strong> plants.<br />
Absolute Dominant Indicator<br />
Tree Stratum (Plot size: 30' r) % Cover Species Status<br />
1.<br />
2.<br />
3.<br />
4.<br />
0% = Total Cover<br />
Sapling/Shrub Stratum (Plot size: 5' r)<br />
1.<br />
2.<br />
3.<br />
4.<br />
5.<br />
0% = Total Cover<br />
Herb Stratum (Plot size: 5' r)<br />
1. Bromus tectorum 60% NL<br />
2. Galium aparine 20% FACU<br />
3. Elymus glaucus 5% FACU<br />
4. Lotus sp. 5% FAC<br />
5.<br />
6.<br />
7.<br />
8.<br />
9.<br />
10.<br />
11.<br />
90% = Total Cover<br />
Woody Vine Stratum (Plot size: 30' r)<br />
1.<br />
2.<br />
0 = Total Cover<br />
% Bare Ground in Herb Stratum: 10%<br />
Remarks:<br />
Terrace community<br />
Dominance Test worksheet:<br />
Number <strong>of</strong> Dominant Species<br />
That Are OBL, FACW, or FAC:<br />
Total Number <strong>of</strong> Dominant<br />
Species Across All Strata:<br />
Percent <strong>of</strong> Dominant Species<br />
That Are OBL, FACW, or FAC:<br />
0 (A)<br />
2 (B)<br />
0 (A/B)<br />
Prevalence Index worksheet:<br />
Total % Cover <strong>of</strong>:<br />
Multiply by:<br />
OBL species 0 x 1 = 0<br />
FACW species 0 x 2 = 0<br />
FAC species 5 x 3 = 15<br />
FACU species 25 x 4 = 100<br />
UPL species 60 x 5 = 300<br />
Column Totals 90 415<br />
Prevalence Index = B/A = 4.61<br />
Hydrophytic Vegetation Indicators:<br />
Dominance Test is >50%<br />
Prevalence Index is ≤3.0 1<br />
Morphological Adaptations 1 (Provide supporting<br />
data in Remarks or on a separate sheet)<br />
Wetland Non-Vascular Plants 1<br />
Problematic Hydrophytic Vegetation 1 (Explain)<br />
1 Indicators <strong>of</strong> hydric soil and wetland hydrology must<br />
be present, unless disturbed or problematic.<br />
Hydrophytic<br />
Vegetation<br />
Present Yes No<br />
US Army Corps <strong>of</strong> Engineers Arid West – Version 2.0
SOIL Sampling Point: 34<br />
Pr<strong>of</strong>ile Description: (Describe to the depth needed to document the indicator or confirm the absence <strong>of</strong> indicators.)<br />
Depth Matrix Redox Features<br />
(inches) Color (moist) % Color (moist) % Type 1 Loc 2 Texture Remarks<br />
1 Type: C=Concentration, D=Depletion, RM=Reduced Matrix, CS=Covered or Coated Sand Grains.<br />
2 Location: PL=Pore Lining, M=Matrix.<br />
Hydric Soil Indicators: (Applicable to all LRRs, unless otherwise noted.) Indicators for Problematic Hydric Soils 3 :<br />
Histosol (A1) Sandy Redox (S5) 1 cm Muck (A9) (LRR D)<br />
Histic Epipedon (A2) Stripped Matrix (S6) 2 cm Muck (A10)<br />
Black Histic (A3) Loamy Mucky Mineral (F1) (except MLRA 1) Reduced Vertic (F18)<br />
Hydrogen Sulfide (A4) Loamy Gleyed Matrix (F2) Red Parent Material (TF2)<br />
Stratified Layers (A5) (LRR C) Depleted Matrix (F3) Other (Explain in Remarks)<br />
1 cm Muck (A9) (LRR D) Redox Dark Surface (F6)<br />
Depleted Below Dark Surface (A11) Depleted Dark Surface (F7)<br />
Thick Dark Surface (A12)<br />
Redox Depressions (F8)<br />
3 Indicators <strong>of</strong> hydrophytic vegetation and<br />
Sandy Mucky Mineral (S1) Vernal Pools (F9) wetland hydrology must be present,<br />
Sandy Gleyed Matrix (S4)<br />
unless disturbed or problematic.<br />
Restrictive Layer (if present):<br />
Type: ---<br />
Depth (inches): --- Hydric Soil Present Yes No<br />
Remarks:<br />
OFFSITE - subsurface soil conditions not observed.<br />
HYDROLOGY<br />
Wetland Hydrology Indicators:<br />
Primary Indicators (minimum <strong>of</strong> one required; check all that apply)<br />
Secondary Indicators (2 or more required)<br />
Surface Water (A1) Salt Crust (B11) Water Marks (B1) (Riverine)<br />
Saturation (A3) Aquatic Invertebrates (B13) Sediment Deposits (B2) (Riverine)<br />
Water Marks (B1) (Nonriverine) Hydrogen Sulfide Odor (C1) Drift Deposits (B3) (Riverine)<br />
Sediment Deposits (B2) (Nonriverine) Oxidized Rhizospheres along Living Roots (C3) Drainage Patterns (B10)<br />
Drift Deposits (B3) (Nonriverine) Presence <strong>of</strong> Reduced Iron (C4) Dry-Season Water Table (C2)<br />
Surface Soil Cracks (B6) Recent Iron Reduction in Tilled Soils (C6) Crayfish Burrows (C8)<br />
Inundation Visible on Aerial Imagery (B7) Thin Muck Surface (C7) Saturation Visible on Aerial Imagery (C9)<br />
Water-Stained Leaves (B9) Other (Explain in Remarks) Shallow Aquitard (D3)<br />
FAC-Neutral Test (D5)<br />
Field Observations:<br />
Surface Water Present Yes No Depth (inches):N/A<br />
Water Table Present Yes No Depth (inches): N/A<br />
Saturation Present Yes No Depth (inches): N/A<br />
Wetland Hydrology Present Yes No<br />
(includes capillary fringe)<br />
Describe Recorded Data (stream gauge, monitoring well, aerial photos, previous inspections), if available:<br />
Remarks:<br />
Above area subject to occasional high flows.<br />
US Army Corps <strong>of</strong> Engineers Arid West – Version 2.0
<strong>WETLAND</strong> <strong>DETERMINATION</strong> <strong>DATA</strong> <strong>FORM</strong> – Arid West Region<br />
Project/Site: <strong>Pendleton</strong> <strong>City</strong>/County: Umatilla Sampling Date: 5/19/2011<br />
Applicant/Owner: <strong>City</strong> <strong>of</strong> <strong>Pendleton</strong> State: OR Sampling Point: 35<br />
Investigator(s): LW/ACS Section, Township, Range:<br />
Landform (hillslope, terrace, etc.): Tutuilla Creek @ interchange Local relief (concave, convex, none) none Slope (%) 2%<br />
Subregion (LRR): Arid Lands Lat: Long: Datum:<br />
Soil Map Unit Name: 129A: Yakima-Urban Land, 0-3% slopes NWI Classification:<br />
Are climatic/hydrologic site conditions typical for this time <strong>of</strong> year Yes No (If no, explain in Remarks.)<br />
Are Vegetation Soil or Hydrology significantly disturbed Are “Normal Circumstances” present Yes No<br />
Are Vegetation Soil or Hydrology naturally problematic (If needed, explain any answers in Remarks”)<br />
SUMMARY OF FINDINGS – Attach site map showing sampling point locations, transects, important features, etc.<br />
Hydrophytic Vegetation Present Yes No<br />
Is the Sampled Area<br />
Hydric Soil Present Yes No<br />
within a Wetland Yes No<br />
Wetland Hydrology Present Yes No<br />
Remarks: OFFSITE - viewed from interchange, southeast quadrant <strong>of</strong> I-84 and Highway 395. Part <strong>of</strong> site 123. Paired with Plot 36.<br />
VEGETATION – Use scientific names <strong>of</strong> plants.<br />
Absolute Dominant Indicator<br />
Tree Stratum (Plot size: 30' r) % Cover Species Status<br />
1. Salix sp. 10% FAC<br />
2.<br />
3.<br />
4.<br />
Sapling/Shrub Stratum (Plot size: 5' r)<br />
10% = Total Cover<br />
1. Salix geyeriana 50% FACW+<br />
2.<br />
3.<br />
4.<br />
5.<br />
Herb Stratum (Plot size: 5' r)<br />
50% = Total Cover<br />
1. Phalaris arundinacea 100% FACW<br />
2. Epilobium sp. T FAC<br />
3.<br />
4.<br />
5.<br />
6.<br />
7.<br />
8.<br />
9.<br />
10.<br />
11.<br />
Woody Vine Stratum (Plot size: 30' r)<br />
1.<br />
2.<br />
100% = Total Cover<br />
Dominance Test worksheet:<br />
Number <strong>of</strong> Dominant Species<br />
That Are OBL, FACW, or FAC:<br />
Total Number <strong>of</strong> Dominant<br />
Species Across All Strata:<br />
Percent <strong>of</strong> Dominant Species<br />
That Are OBL, FACW, or FAC:<br />
0 = Total Cover<br />
% Bare Ground in Herb Stratum: 0%<br />
Remarks:<br />
Plant community in narrow margin affected by high flows. Tree willow species difficult to discern at that distance; may be S. lucida (FACW)<br />
3 (A)<br />
3 (B)<br />
100 (A/B)<br />
Prevalence Index worksheet:<br />
Total % Cover <strong>of</strong>:<br />
Multiply by:<br />
OBL species x 1 =<br />
FACW species x 2 =<br />
FAC species x 3 =<br />
FACU species x 4 =<br />
UPL species x 5 =<br />
Column Totals<br />
Prevalence Index = B/A =<br />
Hydrophytic Vegetation Indicators:<br />
Dominance Test is >50%<br />
Prevalence Index is ≤3.0 1<br />
Morphological Adaptations 1 (Provide supporting<br />
data in Remarks or on a separate sheet)<br />
Wetland Non-Vascular Plants 1<br />
Problematic Hydrophytic Vegetation 1 (Explain)<br />
1 Indicators <strong>of</strong> hydric soil and wetland hydrology must<br />
be present, unless disturbed or problematic.<br />
Hydrophytic<br />
Vegetation<br />
Present Yes No<br />
US Army Corps <strong>of</strong> Engineers Arid West – Version 2.0
SOIL Sampling Point: 35<br />
Pr<strong>of</strong>ile Description: (Describe to the depth needed to document the indicator or confirm the absence <strong>of</strong> indicators.)<br />
Depth Matrix Redox Features<br />
(inches) Color (moist) % Color (moist) % Type 1 Loc 2 Texture Remarks<br />
1 Type: C=Concentration, D=Depletion, RM=Reduced Matrix, CS=Covered or Coated Sand Grains.<br />
2 Location: PL=Pore Lining, M=Matrix.<br />
Hydric Soil Indicators: (Applicable to all LRRs, unless otherwise noted.) Indicators for Problematic Hydric Soils 3 :<br />
Histosol (A1) Sandy Redox (S5) 1 cm Muck (A9) (LRR D)<br />
Histic Epipedon (A2) Stripped Matrix (S6) 2 cm Muck (A10)<br />
Black Histic (A3) Loamy Mucky Mineral (F1) (except MLRA 1) Reduced Vertic (F18)<br />
Hydrogen Sulfide (A4) Loamy Gleyed Matrix (F2) Red Parent Material (TF2)<br />
Stratified Layers (A5) (LRR C) Depleted Matrix (F3) Other (Explain in Remarks)<br />
1 cm Muck (A9) (LRR D) Redox Dark Surface (F6)<br />
Depleted Below Dark Surface (A11) Depleted Dark Surface (F7)<br />
Thick Dark Surface (A12)<br />
Redox Depressions (F8)<br />
3 Indicators <strong>of</strong> hydrophytic vegetation and<br />
Sandy Mucky Mineral (S1) Vernal Pools (F9) wetland hydrology must be present,<br />
Sandy Gleyed Matrix (S4)<br />
unless disturbed or problematic.<br />
Restrictive Layer (if present):<br />
Type: ---<br />
Depth (inches): --- Hydric Soil Present Yes No<br />
Remarks:<br />
OFFSITE - subsurface soil conditions not observed.<br />
HYDROLOGY<br />
Wetland Hydrology Indicators:<br />
Primary Indicators (minimum <strong>of</strong> one required; check all that apply)<br />
Secondary Indicators (2 or more required)<br />
Surface Water (A1) Salt Crust (B11) Water Marks (B1) (Riverine)<br />
Saturation (A3) Aquatic Invertebrates (B13) Sediment Deposits (B2) (Riverine)<br />
Water Marks (B1) (Nonriverine) Hydrogen Sulfide Odor (C1) Drift Deposits (B3) (Riverine)<br />
Sediment Deposits (B2) (Nonriverine) Oxidized Rhizospheres along Living Roots (C3) Drainage Patterns (B10)<br />
Drift Deposits (B3) (Nonriverine) Presence <strong>of</strong> Reduced Iron (C4) Dry-Season Water Table (C2)<br />
Surface Soil Cracks (B6) Recent Iron Reduction in Tilled Soils (C6) Crayfish Burrows (C8)<br />
Inundation Visible on Aerial Imagery (B7) Thin Muck Surface (C7) Saturation Visible on Aerial Imagery (C9)<br />
Water-Stained Leaves (B9) Other (Explain in Remarks) Shallow Aquitard (D3)<br />
FAC-Neutral Test (D5)<br />
Field Observations:<br />
Surface Water Present Yes No Depth (inches):In creek<br />
Water Table Present Yes No Depth (inches): N/A<br />
Saturation Present Yes No Depth (inches): N/A<br />
Wetland Hydrology Present Yes No<br />
(includes capillary fringe)<br />
Describe Recorded Data (stream gauge, monitoring well, aerial photos, previous inspections), if available:<br />
Remarks:<br />
Most areas meeting the three criteria for wetland determination lie within the OHWM as defined by visible wrack lines. Small areas above the OHW<br />
may also be subject to occasional flooding from high flows above OHW.<br />
Cowardin : PEMC, R3UBH<br />
HGM: Riverine Flow-Through<br />
US Army Corps <strong>of</strong> Engineers Arid West – Version 2.0
<strong>WETLAND</strong> <strong>DETERMINATION</strong> <strong>DATA</strong> <strong>FORM</strong> – Arid West Region<br />
Project/Site: <strong>Pendleton</strong> <strong>City</strong>/County: Umatilla Sampling Date: 5/19/2011<br />
Applicant/Owner: <strong>City</strong> <strong>of</strong> <strong>Pendleton</strong> State: OR Sampling Point: 36<br />
Investigator(s): LW/ACS Section, Township, Range:<br />
Landform (hillslope, terrace, etc.): Hillslope Local relief (concave, convex, none) none Slope (%) 2%<br />
Subregion (LRR): Arid Lands Lat: Long: Datum:<br />
Soil Map Unit Name: 123A: Yakima-Urban Land, 0-3% slopes NWI Classification:<br />
Are climatic/hydrologic site conditions typical for this time <strong>of</strong> year Yes No (If no, explain in Remarks.)<br />
Are Vegetation Soil or Hydrology significantly disturbed Are “Normal Circumstances” present Yes No<br />
Are Vegetation Soil or Hydrology naturally problematic (If needed, explain any answers in Remarks”)<br />
SUMMARY OF FINDINGS – Attach site map showing sampling point locations, transects, important features, etc.<br />
Hydrophytic Vegetation Present Yes No<br />
Is the Sampled Area<br />
Hydric Soil Present Yes No<br />
within a Wetland Yes No<br />
Wetland Hydrology Present Yes No<br />
Remarks: OFFSITE - viewed from southeast quadrant <strong>of</strong> I-84-Highway 295 interchange. Site 123, plot paired with Plot 35.<br />
VEGETATION – Use scientific names <strong>of</strong> plants.<br />
Absolute Dominant Indicator<br />
Tree Stratum (Plot size: 30' r) % Cover Species Status<br />
1.<br />
2.<br />
3.<br />
4.<br />
Sapling/Shrub Stratum (Plot size: 5' r)<br />
1.<br />
2.<br />
3.<br />
4.<br />
5.<br />
Herb Stratum (Plot size: 5' r)<br />
0% = Total Cover<br />
0% = Total Cover<br />
1. Elymus glaucus 90% FACU<br />
2. large thistle 5 FACU<br />
3. Lapsana communis 5 FAC<br />
4.<br />
5.<br />
6.<br />
7.<br />
8.<br />
9.<br />
10.<br />
11.<br />
Woody Vine Stratum (Plot size: 30' r)<br />
1.<br />
2.<br />
100% = Total Cover<br />
Dominance Test worksheet:<br />
Number <strong>of</strong> Dominant Species<br />
That Are OBL, FACW, or FAC:<br />
Total Number <strong>of</strong> Dominant<br />
Species Across All Strata:<br />
Percent <strong>of</strong> Dominant Species<br />
That Are OBL, FACW, or FAC:<br />
0 = Total Cover<br />
% Bare Ground in Herb Stratum: 0%<br />
Remarks:<br />
Plant community on steep hillslope leading down to south bank <strong>of</strong>Tutuilla Creek / Umatilla River. Large thistle may be Onopordum acanthium.<br />
Occasional trees present, including Ulmus, Acer negundo, ornamental maples.<br />
0 (A)<br />
1 (B)<br />
0 (A/B)<br />
Prevalence Index worksheet:<br />
Total % Cover <strong>of</strong>:<br />
Multiply by:<br />
OBL species 0 x 1 = 0<br />
FACW species 0 x 2 = 0<br />
FAC species 5 x 3 = 15<br />
FACU species 95 x 4 = 380<br />
UPL species 0 x 5 = 0<br />
Column Totals 100 395<br />
Prevalence Index = B/A = 3.95<br />
Hydrophytic Vegetation Indicators:<br />
Dominance Test is >50%<br />
Prevalence Index is ≤3.0 1<br />
Morphological Adaptations 1 (Provide supporting<br />
data in Remarks or on a separate sheet)<br />
Wetland Non-Vascular Plants 1<br />
Problematic Hydrophytic Vegetation 1 (Explain)<br />
1 Indicators <strong>of</strong> hydric soil and wetland hydrology must<br />
be present, unless disturbed or problematic.<br />
Hydrophytic<br />
Vegetation<br />
Present Yes No<br />
US Army Corps <strong>of</strong> Engineers Arid West – Version 2.0
SOIL Sampling Point: 36<br />
Pr<strong>of</strong>ile Description: (Describe to the depth needed to document the indicator or confirm the absence <strong>of</strong> indicators.)<br />
Depth Matrix Redox Features<br />
(inches) Color (moist) % Color (moist) % Type 1 Loc 2 Texture Remarks<br />
1 Type: C=Concentration, D=Depletion, RM=Reduced Matrix, CS=Covered or Coated Sand Grains.<br />
2 Location: PL=Pore Lining, M=Matrix.<br />
Hydric Soil Indicators: (Applicable to all LRRs, unless otherwise noted.) Indicators for Problematic Hydric Soils 3 :<br />
Histosol (A1) Sandy Redox (S5) 1 cm Muck (A9) (LRR D)<br />
Histic Epipedon (A2) Stripped Matrix (S6) 2 cm Muck (A10)<br />
Black Histic (A3) Loamy Mucky Mineral (F1) (except MLRA 1) Reduced Vertic (F18)<br />
Hydrogen Sulfide (A4) Loamy Gleyed Matrix (F2) Red Parent Material (TF2)<br />
Stratified Layers (A5) (LRR C) Depleted Matrix (F3) Other (Explain in Remarks)<br />
1 cm Muck (A9) (LRR D) Redox Dark Surface (F6)<br />
Depleted Below Dark Surface (A11) Depleted Dark Surface (F7)<br />
Thick Dark Surface (A12)<br />
Redox Depressions (F8)<br />
3 Indicators <strong>of</strong> hydrophytic vegetation and<br />
Sandy Mucky Mineral (S1) Vernal Pools (F9) wetland hydrology must be present,<br />
Sandy Gleyed Matrix (S4)<br />
unless disturbed or problematic.<br />
Restrictive Layer (if present):<br />
Type: ---<br />
Depth (inches): --- Hydric Soil Present Yes No<br />
Remarks:<br />
OFFSITE - subsurface soil conditions not observed.<br />
HYDROLOGY<br />
Wetland Hydrology Indicators:<br />
Primary Indicators (minimum <strong>of</strong> one required; check all that apply)<br />
Secondary Indicators (2 or more required)<br />
Surface Water (A1) Salt Crust (B11) Water Marks (B1) (Riverine)<br />
Saturation (A3) Aquatic Invertebrates (B13) Sediment Deposits (B2) (Riverine)<br />
Water Marks (B1) (Nonriverine) Hydrogen Sulfide Odor (C1) Drift Deposits (B3) (Riverine)<br />
Sediment Deposits (B2) (Nonriverine) Oxidized Rhizospheres along Living Roots (C3) Drainage Patterns (B10)<br />
Drift Deposits (B3) (Nonriverine) Presence <strong>of</strong> Reduced Iron (C4) Dry-Season Water Table (C2)<br />
Surface Soil Cracks (B6) Recent Iron Reduction in Tilled Soils (C6) Crayfish Burrows (C8)<br />
Inundation Visible on Aerial Imagery (B7) Thin Muck Surface (C7) Saturation Visible on Aerial Imagery (C9)<br />
Water-Stained Leaves (B9) Other (Explain in Remarks) Shallow Aquitard (D3)<br />
FAC-Neutral Test (D5)<br />
Field Observations:<br />
Surface Water Present Yes No Depth (inches):<br />
Water Table Present Yes No Depth (inches): N/A<br />
Saturation Present Yes No Depth (inches): N/A<br />
Wetland Hydrology Present Yes No<br />
(includes capillary fringe)<br />
Describe Recorded Data (stream gauge, monitoring well, aerial photos, previous inspections), if available:<br />
Remarks:<br />
Plot taken above influence <strong>of</strong> water in creek, river. No evidence <strong>of</strong> seepage in hillslope.<br />
US Army Corps <strong>of</strong> Engineers Arid West – Version 2.0
<strong>WETLAND</strong> <strong>DETERMINATION</strong> <strong>DATA</strong> <strong>FORM</strong> – Arid West Region<br />
Project/Site: <strong>Pendleton</strong> <strong>City</strong>/County: Umatilla Sampling Date: 5/19/2011<br />
Applicant/Owner: <strong>City</strong> <strong>of</strong> <strong>Pendleton</strong> State: OR Sampling Point: 37<br />
Investigator(s): LW/ACS Section, Township, Range:<br />
Landform (hillslope, terrace, etc.): Tutuilla Crk Local relief (concave, convex, none) none Slope (%) 2%<br />
Subregion (LRR): Arid Lands Lat: Long: Datum:<br />
Soil Map Unit Name: 123A: Yakima-Urban Land, 0-3% slopes NWI Classification:<br />
Are climatic/hydrologic site conditions typical for this time <strong>of</strong> year Yes No (If no, explain in Remarks.)<br />
Are Vegetation Soil or Hydrology significantly disturbed Are “Normal Circumstances” present Yes No<br />
Are Vegetation Soil or Hydrology naturally problematic (If needed, explain any answers in Remarks”)<br />
SUMMARY OF FINDINGS – Attach site map showing sampling point locations, transects, important features, etc.<br />
Hydrophytic Vegetation Present Yes No<br />
Is the Sampled Area<br />
Hydric Soil Present Yes No<br />
within a Wetland Yes No<br />
Wetland Hydrology Present Yes No<br />
Remarks: OFFSITE - viewed from Burger King at interchange (Southgate Road and I-84). Plot taken in Site 123.<br />
VEGETATION – Use scientific names <strong>of</strong> plants.<br />
Absolute Dominant Indicator<br />
Tree Stratum (Plot size: 30' r) % Cover Species Status<br />
1.<br />
2.<br />
3.<br />
4.<br />
Sapling/Shrub Stratum (Plot size: 5' r)<br />
0% = Total Cover<br />
1. Salix geyeriana 15% FACW+<br />
2.<br />
3.<br />
4.<br />
5.<br />
Herb Stratum (Plot size: 5' r)<br />
15% = Total Cover<br />
1. Phalaris arundinacea 100% FACW<br />
2.<br />
3.<br />
4.<br />
5.<br />
6.<br />
7.<br />
8.<br />
9.<br />
10.<br />
11.<br />
Woody Vine Stratum (Plot size: 30' r)<br />
1.<br />
2.<br />
100% = Total Cover<br />
Dominance Test worksheet:<br />
Number <strong>of</strong> Dominant Species<br />
That Are OBL, FACW, or FAC:<br />
Total Number <strong>of</strong> Dominant<br />
Species Across All Strata:<br />
Percent <strong>of</strong> Dominant Species<br />
That Are OBL, FACW, or FAC:<br />
0 = Total Cover<br />
% Bare Ground in Herb Stratum: 0%<br />
Remarks:<br />
Plant community in narrow margin along Tutuilla Creek. Floodplain is a little wider here and exhibits less erosion than in upstream reaches.<br />
2 (A)<br />
2 (B)<br />
100% (A/B)<br />
Prevalence Index worksheet:<br />
Total % Cover <strong>of</strong>:<br />
Multiply by:<br />
OBL species x 1 =<br />
FACW species x 2 =<br />
FAC species x 3 =<br />
FACU species x 4 =<br />
UPL species x 5 =<br />
Column Totals<br />
Prevalence Index = B/A =<br />
Hydrophytic Vegetation Indicators:<br />
Dominance Test is >50%<br />
Prevalence Index is ≤3.0 1<br />
Morphological Adaptations 1 (Provide supporting<br />
data in Remarks or on a separate sheet)<br />
Wetland Non-Vascular Plants 1<br />
Problematic Hydrophytic Vegetation 1 (Explain)<br />
1 Indicators <strong>of</strong> hydric soil and wetland hydrology must<br />
be present, unless disturbed or problematic.<br />
Hydrophytic<br />
Vegetation<br />
Present Yes No<br />
US Army Corps <strong>of</strong> Engineers Arid West – Version 2.0
SOIL Sampling Point: 37<br />
Pr<strong>of</strong>ile Description: (Describe to the depth needed to document the indicator or confirm the absence <strong>of</strong> indicators.)<br />
Depth Matrix Redox Features<br />
(inches) Color (moist) % Color (moist) % Type 1 Loc 2 Texture Remarks<br />
1 Type: C=Concentration, D=Depletion, RM=Reduced Matrix, CS=Covered or Coated Sand Grains.<br />
2 Location: PL=Pore Lining, M=Matrix.<br />
Hydric Soil Indicators: (Applicable to all LRRs, unless otherwise noted.) Indicators for Problematic Hydric Soils 3 :<br />
Histosol (A1) Sandy Redox (S5) 1 cm Muck (A9) (LRR D)<br />
Histic Epipedon (A2) Stripped Matrix (S6) 2 cm Muck (A10)<br />
Black Histic (A3) Loamy Mucky Mineral (F1) (except MLRA 1) Reduced Vertic (F18)<br />
Hydrogen Sulfide (A4) Loamy Gleyed Matrix (F2) Red Parent Material (TF2)<br />
Stratified Layers (A5) (LRR C) Depleted Matrix (F3) Other (Explain in Remarks)<br />
1 cm Muck (A9) (LRR D) Redox Dark Surface (F6)<br />
Depleted Below Dark Surface (A11) Depleted Dark Surface (F7)<br />
Thick Dark Surface (A12)<br />
Redox Depressions (F8)<br />
3 Indicators <strong>of</strong> hydrophytic vegetation and<br />
Sandy Mucky Mineral (S1) Vernal Pools (F9) wetland hydrology must be present,<br />
Sandy Gleyed Matrix (S4)<br />
unless disturbed or problematic.<br />
Restrictive Layer (if present):<br />
Type: ---<br />
Depth (inches): --- Hydric Soil Present Yes No<br />
Remarks:<br />
OFFSITE - subsurface soil conditions not observed.<br />
HYDROLOGY<br />
Wetland Hydrology Indicators:<br />
Primary Indicators (minimum <strong>of</strong> one required; check all that apply)<br />
Secondary Indicators (2 or more required)<br />
Surface Water (A1) Salt Crust (B11) Water Marks (B1) (Riverine)<br />
Saturation (A3) Aquatic Invertebrates (B13) Sediment Deposits (B2) (Riverine)<br />
Water Marks (B1) (Nonriverine) Hydrogen Sulfide Odor (C1) Drift Deposits (B3) (Riverine)<br />
Sediment Deposits (B2) (Nonriverine) Oxidized Rhizospheres along Living Roots (C3) Drainage Patterns (B10)<br />
Drift Deposits (B3) (Nonriverine) Presence <strong>of</strong> Reduced Iron (C4) Dry-Season Water Table (C2)<br />
Surface Soil Cracks (B6) Recent Iron Reduction in Tilled Soils (C6) Crayfish Burrows (C8)<br />
Inundation Visible on Aerial Imagery (B7) Thin Muck Surface (C7) Saturation Visible on Aerial Imagery (C9)<br />
Water-Stained Leaves (B9) Other (Explain in Remarks) Shallow Aquitard (D3)<br />
FAC-Neutral Test (D5)<br />
Field Observations:<br />
Surface Water Present Yes No Depth (inches):In creek<br />
Water Table Present Yes No Depth (inches): N/A<br />
Saturation Present Yes No Depth (inches): N/A<br />
Wetland Hydrology Present Yes No<br />
(includes capillary fringe)<br />
Describe Recorded Data (stream gauge, monitoring well, aerial photos, previous inspections), if available:<br />
Remarks:<br />
Plot taken in area <strong>of</strong> overbank flow adjacent to OHWL. OHWL estimated as upper extent <strong>of</strong> drift deposits. Based on topographic position, vegetation<br />
community, proximity to Tutuilla Creek and evidence <strong>of</strong> overbank flow, prolonged saturation in the upper part <strong>of</strong> the soil pr<strong>of</strong>ile in the early part <strong>of</strong> the<br />
growing season is likely at this location.<br />
US Army Corps <strong>of</strong> Engineers Arid West – Version 2.0
<strong>WETLAND</strong> <strong>DETERMINATION</strong> <strong>DATA</strong> <strong>FORM</strong> – Arid West Region<br />
Project/Site: <strong>Pendleton</strong> <strong>City</strong>/County: Umatilla Sampling Date: 5/19/2011<br />
Applicant/Owner: <strong>City</strong> <strong>of</strong> <strong>Pendleton</strong> State: OR Sampling Point: 38<br />
Investigator(s): LW/ACS Section, Township, Range:<br />
Landform (hillslope, terrace, etc.): Hillslope above Tutuilla Crk Local relief (concave, convex, none) none Slope (%) 2%<br />
Subregion (LRR): Arid Lands Lat: Long: Datum:<br />
Soil Map Unit Name:<br />
NWI Classification:<br />
Are climatic/hydrologic site conditions typical for this time <strong>of</strong> year Yes No (If no, explain in Remarks.)<br />
Are Vegetation Soil or Hydrology significantly disturbed Are “Normal Circumstances” present Yes No<br />
Are Vegetation Soil or Hydrology naturally problematic (If needed, explain any answers in Remarks”)<br />
SUMMARY OF FINDINGS – Attach site map showing sampling point locations, transects, important features, etc.<br />
Hydrophytic Vegetation Present Yes No<br />
Hydric Soil Present Yes No<br />
Wetland Hydrology Present Yes No<br />
Remarks: OFFSITE - viewed from Southgate Road/I-84 interchange.<br />
Is the Sampled Area<br />
within a Wetland Yes No<br />
VEGETATION – Use scientific names <strong>of</strong> plants.<br />
Absolute Dominant Indicator<br />
Tree Stratum (Plot size: 30' r) % Cover Species Status<br />
1.<br />
2.<br />
3.<br />
4.<br />
Sapling/Shrub Stratum (Plot size: 5' r)<br />
1.<br />
2.<br />
3.<br />
4.<br />
5.<br />
Herb Stratum (Plot size: 5' r)<br />
0% = Total Cover<br />
0% = Total Cover<br />
1. Bromus tectorum 60% NL<br />
2. Elymus glaucus 10 FACU<br />
3. Dipsacus fullonum 5 NI<br />
4. Bromus rigidus 5 NL<br />
5. Conium maculatum 5 FAC+<br />
6. Other forbs 15 mixed<br />
7.<br />
8.<br />
9.<br />
10.<br />
11.<br />
Woody Vine Stratum (Plot size: 30' r)<br />
1.<br />
2.<br />
100% = Total Cover<br />
Dominance Test worksheet:<br />
Number <strong>of</strong> Dominant Species<br />
That Are OBL, FACW, or FAC:<br />
Total Number <strong>of</strong> Dominant<br />
Species Across All Strata:<br />
Percent <strong>of</strong> Dominant Species<br />
That Are OBL, FACW, or FAC:<br />
0 = Total Cover<br />
% Bare Ground in Herb Stratum: 0%<br />
Remarks:<br />
Plant community on steep hillslope leading down to south bank <strong>of</strong> Tutuilla Creek / Umatilla River. Large thistle may be Onopordum acanthium. Few<br />
trees present, including Ulmus, Acer negundo, ornamental maples.<br />
0 (A)<br />
1 (B)<br />
0 (A/B)<br />
Prevalence Index worksheet:<br />
Total % Cover <strong>of</strong>:<br />
Multiply by:<br />
OBL species 0 x 1 = 0<br />
FACW species 0 x 2 = 0<br />
FAC species 20 x 3 = 60<br />
FACU species 10 x 4 = 40<br />
UPL species 65 x 5 = 325<br />
Column Totals 95 425<br />
Prevalence Index = B/A = 4.47<br />
Hydrophytic Vegetation Indicators:<br />
Dominance Test is >50%<br />
Prevalence Index is ≤3.0 1<br />
Morphological Adaptations 1 (Provide supporting<br />
data in Remarks or on a separate sheet)<br />
Wetland Non-Vascular Plants 1<br />
Problematic Hydrophytic Vegetation 1 (Explain)<br />
1 Indicators <strong>of</strong> hydric soil and wetland hydrology must<br />
be present, unless disturbed or problematic.<br />
Hydrophytic<br />
Vegetation<br />
Present Yes No<br />
US Army Corps <strong>of</strong> Engineers Arid West – Version 2.0
SOIL Sampling Point: 38<br />
Pr<strong>of</strong>ile Description: (Describe to the depth needed to document the indicator or confirm the absence <strong>of</strong> indicators.)<br />
Depth Matrix Redox Features<br />
(inches) Color (moist) % Color (moist) % Type 1 Loc 2 Texture Remarks<br />
1 Type: C=Concentration, D=Depletion, RM=Reduced Matrix, CS=Covered or Coated Sand Grains.<br />
2 Location: PL=Pore Lining, M=Matrix.<br />
Hydric Soil Indicators: (Applicable to all LRRs, unless otherwise noted.) Indicators for Problematic Hydric Soils 3 :<br />
Histosol (A1) Sandy Redox (S5) 1 cm Muck (A9) (LRR D)<br />
Histic Epipedon (A2) Stripped Matrix (S6) 2 cm Muck (A10)<br />
Black Histic (A3) Loamy Mucky Mineral (F1) (except MLRA 1) Reduced Vertic (F18)<br />
Hydrogen Sulfide (A4) Loamy Gleyed Matrix (F2) Red Parent Material (TF2)<br />
Stratified Layers (A5) (LRR C) Depleted Matrix (F3) Other (Explain in Remarks)<br />
1 cm Muck (A9) (LRR D) Redox Dark Surface (F6)<br />
Depleted Below Dark Surface (A11) Depleted Dark Surface (F7)<br />
Thick Dark Surface (A12)<br />
Redox Depressions (F8)<br />
3 Indicators <strong>of</strong> hydrophytic vegetation and<br />
Sandy Mucky Mineral (S1) Vernal Pools (F9) wetland hydrology must be present,<br />
Sandy Gleyed Matrix (S4)<br />
unless disturbed or problematic.<br />
Restrictive Layer (if present):<br />
Type: ---<br />
Depth (inches): --- Hydric Soil Present Yes No<br />
Remarks:<br />
OFFSITE - subsurface soil conditions not observed.<br />
HYDROLOGY<br />
Wetland Hydrology Indicators:<br />
Primary Indicators (minimum <strong>of</strong> one required; check all that apply)<br />
Secondary Indicators (2 or more required)<br />
Surface Water (A1) Salt Crust (B11) Water Marks (B1) (Riverine)<br />
Saturation (A3) Aquatic Invertebrates (B13) Sediment Deposits (B2) (Riverine)<br />
Water Marks (B1) (Nonriverine) Hydrogen Sulfide Odor (C1) Drift Deposits (B3) (Riverine)<br />
Sediment Deposits (B2) (Nonriverine) Oxidized Rhizospheres along Living Roots (C3) Drainage Patterns (B10)<br />
Drift Deposits (B3) (Nonriverine) Presence <strong>of</strong> Reduced Iron (C4) Dry-Season Water Table (C2)<br />
Surface Soil Cracks (B6) Recent Iron Reduction in Tilled Soils (C6) Crayfish Burrows (C8)<br />
Inundation Visible on Aerial Imagery (B7) Thin Muck Surface (C7) Saturation Visible on Aerial Imagery (C9)<br />
Water-Stained Leaves (B9) Other (Explain in Remarks) Shallow Aquitard (D3)<br />
FAC-Neutral Test (D5)<br />
Field Observations:<br />
Surface Water Present Yes No Depth (inches):<br />
Water Table Present Yes No Depth (inches): N/A<br />
Saturation Present Yes No Depth (inches): N/A<br />
Wetland Hydrology Present Yes No<br />
(includes capillary fringe)<br />
Describe Recorded Data (stream gauge, monitoring well, aerial photos, previous inspections), if available:<br />
Remarks:<br />
Plot taken above influence <strong>of</strong> water in creek, river. No evidence <strong>of</strong> seepage in hillslope.<br />
US Army Corps <strong>of</strong> Engineers Arid West – Version 2.0
<strong>WETLAND</strong> <strong>DETERMINATION</strong> <strong>DATA</strong> <strong>FORM</strong> – Arid West Region<br />
Project/Site: <strong>Pendleton</strong> <strong>City</strong>/County: Umatilla Sampling Date: 5/19/2011<br />
Applicant/Owner: <strong>City</strong> <strong>of</strong> <strong>Pendleton</strong> State: OR Sampling Point: 39<br />
Investigator(s): LW/ACS Section, Township, Range:<br />
Landform (hillslope, terrace, etc.): Umatilla River corridor Local relief (concave, convex, none) none Slope (%) 2%<br />
Subregion (LRR): Arid Lands Lat: Long: Datum:<br />
Soil Map Unit Name: water NWI Classification: R3UBH, PFOC, PSSC, PEMC<br />
Are climatic/hydrologic site conditions typical for this time <strong>of</strong> year Yes No (If no, explain in Remarks.)<br />
Are Vegetation Soil or Hydrology significantly disturbed Are “Normal Circumstances” present Yes No<br />
Are Vegetation Soil or Hydrology naturally problematic (If needed, explain any answers in Remarks”)<br />
SUMMARY OF FINDINGS – Attach site map showing sampling point locations, transects, important features, etc.<br />
Hydrophytic Vegetation Present Yes No<br />
Hydric Soil Present Yes No<br />
Wetland Hydrology Present Yes No<br />
Is the Sampled Area<br />
within a Wetland Yes No<br />
Remarks: OFFSITE - Umatilla River corridor just downstream <strong>of</strong> confluence with Tutuilla Creek, viewed from development along River View Drive.<br />
Typical <strong>of</strong> sites 54, 96, 101, 102, 137, and 140.<br />
VEGETATION – Use scientific names <strong>of</strong> plants.<br />
Absolute Dominant Indicator<br />
Tree Stratum (Plot size: 30' r) % Cover Species Status<br />
1. Acer negundo 5 FAC+<br />
2. Populus balsamifera v. trichocarpa 5 FAC<br />
3. Robinia pseudoacacia 5 FACU<br />
4.<br />
15% = Total Cover<br />
Sapling/Shrub Stratum (Plot size: 5' r)<br />
1. Salix geyeriana 25% FACW+<br />
2.<br />
3.<br />
4.<br />
5.<br />
25% = Total Cover<br />
Herb Stratum (Plot size: 5' r)<br />
1. Phalaris arundinacea 100% FACW<br />
2.<br />
3.<br />
4.<br />
5.<br />
6.<br />
7.<br />
8.<br />
9.<br />
10.<br />
11.<br />
100% = Total Cover<br />
Woody Vine Stratum (Plot size: 30' r)<br />
1.<br />
2.<br />
0 = Total Cover<br />
% Bare Ground in Herb Stratum: 0%<br />
Remarks:<br />
Plant community in wet margin along Umatilla River. Most features lie below OHW.<br />
Dominance Test worksheet:<br />
Number <strong>of</strong> Dominant Species<br />
That Are OBL, FACW, or FAC:<br />
Total Number <strong>of</strong> Dominant<br />
Species Across All Strata:<br />
Percent <strong>of</strong> Dominant Species<br />
That Are OBL, FACW, or FAC:<br />
4 (A)<br />
5 (B)<br />
80% (A/B)<br />
Prevalence Index worksheet:<br />
Total % Cover <strong>of</strong>:<br />
Multiply by:<br />
OBL species x 1 =<br />
FACW species x 2 =<br />
FAC species x 3 =<br />
FACU species x 4 =<br />
UPL species x 5 =<br />
Column Totals<br />
Prevalence Index = B/A =<br />
Hydrophytic Vegetation Indicators:<br />
Dominance Test is >50%<br />
Prevalence Index is ≤3.0 1<br />
Morphological Adaptations 1 (Provide supporting<br />
data in Remarks or on a separate sheet)<br />
Wetland Non-Vascular Plants 1<br />
Problematic Hydrophytic Vegetation 1 (Explain)<br />
1 Indicators <strong>of</strong> hydric soil and wetland hydrology must<br />
be present, unless disturbed or problematic.<br />
Hydrophytic<br />
Vegetation<br />
Present Yes No<br />
US Army Corps <strong>of</strong> Engineers Arid West – Version 2.0
SOIL Sampling Point: 39<br />
Pr<strong>of</strong>ile Description: (Describe to the depth needed to document the indicator or confirm the absence <strong>of</strong> indicators.)<br />
Depth Matrix Redox Features<br />
(inches) Color (moist) % Color (moist) % Type 1 Loc 2 Texture Remarks<br />
1 Type: C=Concentration, D=Depletion, RM=Reduced Matrix, CS=Covered or Coated Sand Grains.<br />
2 Location: PL=Pore Lining, M=Matrix.<br />
Hydric Soil Indicators: (Applicable to all LRRs, unless otherwise noted.) Indicators for Problematic Hydric Soils 3 :<br />
Histosol (A1) Sandy Redox (S5) 1 cm Muck (A9) (LRR D)<br />
Histic Epipedon (A2) Stripped Matrix (S6) 2 cm Muck (A10)<br />
Black Histic (A3) Loamy Mucky Mineral (F1) (except MLRA 1) Reduced Vertic (F18)<br />
Hydrogen Sulfide (A4) Loamy Gleyed Matrix (F2) Red Parent Material (TF2)<br />
Stratified Layers (A5) (LRR C) Depleted Matrix (F3) Other (Explain in Remarks)<br />
1 cm Muck (A9) (LRR D) Redox Dark Surface (F6)<br />
Depleted Below Dark Surface (A11) Depleted Dark Surface (F7)<br />
Thick Dark Surface (A12)<br />
Redox Depressions (F8)<br />
3 Indicators <strong>of</strong> hydrophytic vegetation and<br />
Sandy Mucky Mineral (S1) Vernal Pools (F9) wetland hydrology must be present,<br />
Sandy Gleyed Matrix (S4)<br />
unless disturbed or problematic.<br />
Restrictive Layer (if present):<br />
Type: ---<br />
Depth (inches): --- Hydric Soil Present Yes No<br />
Remarks:<br />
OFFSITE - subsurface soil conditions not observed.<br />
HYDROLOGY<br />
Wetland Hydrology Indicators:<br />
Primary Indicators (minimum <strong>of</strong> one required; check all that apply)<br />
Secondary Indicators (2 or more required)<br />
Surface Water (A1) Salt Crust (B11) Water Marks (B1) (Riverine)<br />
Saturation (A3) Aquatic Invertebrates (B13) Sediment Deposits (B2) (Riverine)<br />
Water Marks (B1) (Nonriverine) Hydrogen Sulfide Odor (C1) Drift Deposits (B3) (Riverine)<br />
Sediment Deposits (B2) (Nonriverine) Oxidized Rhizospheres along Living Roots (C3) Drainage Patterns (B10)<br />
Drift Deposits (B3) (Nonriverine) Presence <strong>of</strong> Reduced Iron (C4) Dry-Season Water Table (C2)<br />
Surface Soil Cracks (B6) Recent Iron Reduction in Tilled Soils (C6) Crayfish Burrows (C8)<br />
Inundation Visible on Aerial Imagery (B7) Thin Muck Surface (C7) Saturation Visible on Aerial Imagery (C9)<br />
Water-Stained Leaves (B9) Other (Explain in Remarks) Shallow Aquitard (D3)<br />
FAC-Neutral Test (D5)<br />
Field Observations:<br />
Surface Water Present Yes No Depth (inches):In creek<br />
Water Table Present Yes No Depth (inches): N/A<br />
Saturation Present Yes No Depth (inches): N/A<br />
Wetland Hydrology Present Yes No<br />
(includes capillary fringe)<br />
Describe Recorded Data (stream gauge, monitoring well, aerial photos, previous inspections), if available:<br />
Remarks:<br />
Based on vegetation, the wetland margin fringing the Umatilla River varies from negligible to approximately 25 feet in width.<br />
Cowardin: The margin is a mosaic <strong>of</strong> PFOC, PSSC, PEMC, varying with the abundance <strong>of</strong> tree and shrub cover. The Umatilla River is R3UBH<br />
HGM: Riverine Flow-Through<br />
US Army Corps <strong>of</strong> Engineers Arid West – Version 2.0
<strong>WETLAND</strong> <strong>DETERMINATION</strong> <strong>DATA</strong> <strong>FORM</strong> – Arid West Region<br />
Project/Site: <strong>Pendleton</strong> <strong>City</strong>/County: Umatilla Sampling Date: 5/19/2011<br />
Applicant/Owner: <strong>City</strong> <strong>of</strong> <strong>Pendleton</strong> State: OR Sampling Point: 40<br />
Investigator(s): LW/ACS Section, Township, Range:<br />
Landform (hillslope, terrace, etc.): Hillslope above Umatilla R Local relief (concave, convex, none) none Slope (%) 20%<br />
Subregion (LRR): Arid Lands Lat: Long: Datum:<br />
Soil Map Unit Name: 115D: Walla Walla silt loam, 12-25% NWI Classification:<br />
Are climatic/hydrologic site conditions typical for this time <strong>of</strong> year Yes No (If no, explain in Remarks.)<br />
Are Vegetation Soil or Hydrology significantly disturbed Are “Normal Circumstances” present Yes No<br />
Are Vegetation Soil or Hydrology naturally problematic (If needed, explain any answers in Remarks”)<br />
SUMMARY OF FINDINGS – Attach site map showing sampling point locations, transects, important features, etc.<br />
Hydrophytic Vegetation Present Yes No<br />
Hydric Soil Present Yes No<br />
Wetland Hydrology Present Yes No<br />
Is the Sampled Area<br />
within a Wetland Yes No<br />
Remarks: OFFSITE - viewed from River View Drive, just below confluence <strong>of</strong> Umatilla River and Tutuilla Creek. Typical <strong>of</strong> steep slopes leading down<br />
to the Umatilla River. Paired with Plot 39.<br />
VEGETATION – Use scientific names <strong>of</strong> plants.<br />
Absolute Dominant Indicator<br />
Tree Stratum (Plot size: 30' r) % Cover Species Status<br />
1.<br />
2.<br />
3.<br />
4.<br />
0% = Total Cover<br />
Sapling/Shrub Stratum (Plot size: 5' r)<br />
1.<br />
2.<br />
3.<br />
4.<br />
5.<br />
0% = Total Cover<br />
Herb Stratum (Plot size: 5' r)<br />
1. Bromus tectorum 25% NL<br />
2. Elymus glaucus 25% FACU<br />
3. Bromus rigidus 40% NI<br />
4. Phalaris arundinacea 10% FACW<br />
5.<br />
6.<br />
7.<br />
8.<br />
9.<br />
10.<br />
11.<br />
100% = Total Cover<br />
Woody Vine Stratum (Plot size: 30' r)<br />
1.<br />
2.<br />
0 = Total Cover<br />
% Bare Ground in Herb Stratum: 0%<br />
Remarks:<br />
Plant community on steep hillslope leading down to south bank <strong>of</strong> Umatilla River.<br />
Dominance Test worksheet:<br />
Number <strong>of</strong> Dominant Species<br />
That Are OBL, FACW, or FAC:<br />
Total Number <strong>of</strong> Dominant<br />
Species Across All Strata:<br />
Percent <strong>of</strong> Dominant Species<br />
That Are OBL, FACW, or FAC:<br />
0 (A)<br />
3 (B)<br />
0 (A/B)<br />
Prevalence Index worksheet:<br />
Total % Cover <strong>of</strong>:<br />
Multiply by:<br />
OBL species 0 x 1 = 0<br />
FACW species 10 x 2 = 20<br />
FAC species 0 x 3 = 0<br />
FACU species 25 x 4 = 100<br />
UPL species 25 x 5 = 125<br />
Column Totals 60 245<br />
Prevalence Index = B/A = 4.08<br />
Hydrophytic Vegetation Indicators:<br />
Dominance Test is >50%<br />
Prevalence Index is ≤3.0 1<br />
Morphological Adaptations 1 (Provide supporting<br />
data in Remarks or on a separate sheet)<br />
Wetland Non-Vascular Plants 1<br />
Problematic Hydrophytic Vegetation 1 (Explain)<br />
1 Indicators <strong>of</strong> hydric soil and wetland hydrology must<br />
be present, unless disturbed or problematic.<br />
Hydrophytic<br />
Vegetation<br />
Present Yes No<br />
US Army Corps <strong>of</strong> Engineers Arid West – Version 2.0
SOIL Sampling Point: 40<br />
Pr<strong>of</strong>ile Description: (Describe to the depth needed to document the indicator or confirm the absence <strong>of</strong> indicators.)<br />
Depth Matrix Redox Features<br />
(inches) Color (moist) % Color (moist) % Type 1 Loc 2 Texture Remarks<br />
1 Type: C=Concentration, D=Depletion, RM=Reduced Matrix, CS=Covered or Coated Sand Grains.<br />
2 Location: PL=Pore Lining, M=Matrix.<br />
Hydric Soil Indicators: (Applicable to all LRRs, unless otherwise noted.) Indicators for Problematic Hydric Soils 3 :<br />
Histosol (A1) Sandy Redox (S5) 1 cm Muck (A9) (LRR D)<br />
Histic Epipedon (A2) Stripped Matrix (S6) 2 cm Muck (A10)<br />
Black Histic (A3) Loamy Mucky Mineral (F1) (except MLRA 1) Reduced Vertic (F18)<br />
Hydrogen Sulfide (A4) Loamy Gleyed Matrix (F2) Red Parent Material (TF2)<br />
Stratified Layers (A5) (LRR C) Depleted Matrix (F3) Other (Explain in Remarks)<br />
1 cm Muck (A9) (LRR D) Redox Dark Surface (F6)<br />
Depleted Below Dark Surface (A11) Depleted Dark Surface (F7)<br />
Thick Dark Surface (A12)<br />
Redox Depressions (F8)<br />
3 Indicators <strong>of</strong> hydrophytic vegetation and<br />
Sandy Mucky Mineral (S1) Vernal Pools (F9) wetland hydrology must be present,<br />
Sandy Gleyed Matrix (S4)<br />
unless disturbed or problematic.<br />
Restrictive Layer (if present):<br />
Type: ---<br />
Depth (inches): --- Hydric Soil Present Yes No<br />
Remarks:<br />
OFFSITE - subsurface soil conditions not observed.<br />
HYDROLOGY<br />
Wetland Hydrology Indicators:<br />
Primary Indicators (minimum <strong>of</strong> one required; check all that apply)<br />
Secondary Indicators (2 or more required)<br />
Surface Water (A1) Salt Crust (B11) Water Marks (B1) (Riverine)<br />
Saturation (A3) Aquatic Invertebrates (B13) Sediment Deposits (B2) (Riverine)<br />
Water Marks (B1) (Nonriverine) Hydrogen Sulfide Odor (C1) Drift Deposits (B3) (Riverine)<br />
Sediment Deposits (B2) (Nonriverine) Oxidized Rhizospheres along Living Roots (C3) Drainage Patterns (B10)<br />
Drift Deposits (B3) (Nonriverine) Presence <strong>of</strong> Reduced Iron (C4) Dry-Season Water Table (C2)<br />
Surface Soil Cracks (B6) Recent Iron Reduction in Tilled Soils (C6) Crayfish Burrows (C8)<br />
Inundation Visible on Aerial Imagery (B7) Thin Muck Surface (C7) Saturation Visible on Aerial Imagery (C9)<br />
Water-Stained Leaves (B9) Other (Explain in Remarks) Shallow Aquitard (D3)<br />
FAC-Neutral Test (D5)<br />
Field Observations:<br />
Surface Water Present Yes No Depth (inches):<br />
Water Table Present Yes No Depth (inches): N/A<br />
Saturation Present Yes No Depth (inches): N/A<br />
Wetland Hydrology Present Yes No<br />
(includes capillary fringe)<br />
Describe Recorded Data (stream gauge, monitoring well, aerial photos, previous inspections), if available:<br />
Remarks:<br />
Plot taken above influence <strong>of</strong> water in creek, river. No evidence <strong>of</strong> seepage in hillslope.<br />
US Army Corps <strong>of</strong> Engineers Arid West – Version 2.0
<strong>WETLAND</strong> <strong>DETERMINATION</strong> <strong>DATA</strong> <strong>FORM</strong> – Arid West Region<br />
Project/Site: <strong>Pendleton</strong> <strong>City</strong>/County: Umatilla Sampling Date: 5/19/2011<br />
Applicant/Owner: <strong>City</strong> <strong>of</strong> <strong>Pendleton</strong> State: OR Sampling Point: 41<br />
Investigator(s): LW/ACS Section, Township, Range:<br />
Landform (hillslope, terrace, etc.): McKay Creek @ park Local relief (concave, convex, none) none Slope (%) 2%<br />
Subregion (LRR): Arid Lands Lat: Long: Datum:<br />
Soil Map Unit Name: 29A: Freewater very cobbly loam, 0-3% NWI Classification: R3UBH, PFOC, PEMC<br />
Are climatic/hydrologic site conditions typical for this time <strong>of</strong> year Yes No (If no, explain in Remarks.)<br />
Are Vegetation Soil or Hydrology significantly disturbed Are “Normal Circumstances” present Yes No<br />
Are Vegetation Soil or Hydrology naturally problematic (If needed, explain any answers in Remarks”)<br />
SUMMARY OF FINDINGS – Attach site map showing sampling point locations, transects, important features, etc.<br />
Hydrophytic Vegetation Present Yes No<br />
Hydric Soil Present Yes No<br />
Wetland Hydrology Present Yes No<br />
Is the Sampled Area<br />
within a Wetland Yes No<br />
Remarks: Viewed site from path along McKay Creek. Site is <strong>Pendleton</strong> Community Park (Kirk Avenue/37 th Street), developedfor recreational uses<br />
except for a margin along McKay Creek. The margin varies in width from negligible to 25 feet. Narrow fringing wetlands are mostly RFT/PFOC, but a<br />
few small enclosed RI basins were also observed on the school side <strong>of</strong> the creek. The creek is also braided, with sand/gravel bars supporting sparse<br />
vegetation.<br />
VEGETATION – Use scientific names <strong>of</strong> plants.<br />
Absolute Dominant Indicator<br />
Tree Stratum (Plot size: 30' r) % Cover Species Status<br />
1. Populus balsamifera v. trichocarpa 80% FAC<br />
2. Prunus virginiana 5 FACU<br />
3. Acer platanoides 5 NI<br />
4.<br />
90% = Total Cover<br />
Sapling/Shrub Stratum (Plot size: 5' r)<br />
1. Populus balsamifera v. trichocarpa 5% FAC<br />
2.<br />
3.<br />
4.<br />
5.<br />
5% = Total Cover<br />
Herb Stratum (Plot size: 5' r)<br />
1. Phalaris arundinacea 5% FACW<br />
2. Dactylis glomerata 5% FACU<br />
3. Bromus sterilis 40% NI<br />
4. Arctium sp. 50% NI<br />
5.<br />
6.<br />
7.<br />
8.<br />
9.<br />
10.<br />
11.<br />
100% = Total Cover<br />
Woody Vine Stratum (Plot size: 30' r)<br />
1. Clematis ligusticifolia 5 FAC-<br />
2.<br />
5 = Total Cover<br />
% Bare Ground in Herb Stratum: 0%<br />
Dominance Test worksheet:<br />
Number <strong>of</strong> Dominant Species<br />
That Are OBL, FACW, or FAC:<br />
Total Number <strong>of</strong> Dominant<br />
Species Across All Strata:<br />
Percent <strong>of</strong> Dominant Species<br />
That Are OBL, FACW, or FAC:<br />
4 (A)<br />
7 (B)<br />
57% (A/B)<br />
Prevalence Index worksheet:<br />
Total % Cover <strong>of</strong>:<br />
Multiply by:<br />
OBL species x 1 =<br />
FACW species x 2 =<br />
FAC species x 3 =<br />
FACU species x 4 =<br />
UPL species x 5 =<br />
Column Totals<br />
Prevalence Index = B/A =<br />
Hydrophytic Vegetation Indicators:<br />
Dominance Test is >50%<br />
Prevalence Index is ≤3.0 1<br />
Morphological Adaptations 1 (Provide supporting<br />
data in Remarks or on a separate sheet)<br />
Wetland Non-Vascular Plants 1<br />
Problematic Hydrophytic Vegetation 1 (Explain)<br />
1 Indicators <strong>of</strong> hydric soil and wetland hydrology must<br />
be present, unless disturbed or problematic.<br />
Hydrophytic<br />
Vegetation<br />
Present Yes No<br />
US Army Corps <strong>of</strong> Engineers Arid West – Version 2.0
Remarks:<br />
Plant community in small impounded wetland along McKay Creek. Wetland separated from creek by a low berm <strong>of</strong> alluvial material.<br />
US Army Corps <strong>of</strong> Engineers Arid West – Version 2.0
SOIL Sampling Point: 41<br />
Pr<strong>of</strong>ile Description: (Describe to the depth needed to document the indicator or confirm the absence <strong>of</strong> indicators.)<br />
Depth Matrix Redox Features<br />
(inches) Color (moist) % Color (moist) % Type 1 Loc 2 Texture Remarks<br />
1 Type: C=Concentration, D=Depletion, RM=Reduced Matrix, CS=Covered or Coated Sand Grains.<br />
2 Location: PL=Pore Lining, M=Matrix.<br />
Hydric Soil Indicators: (Applicable to all LRRs, unless otherwise noted.) Indicators for Problematic Hydric Soils 3 :<br />
Histosol (A1) Sandy Redox (S5) 1 cm Muck (A9) (LRR D)<br />
Histic Epipedon (A2) Stripped Matrix (S6) 2 cm Muck (A10)<br />
Black Histic (A3) Loamy Mucky Mineral (F1) (except MLRA 1) Reduced Vertic (F18)<br />
Hydrogen Sulfide (A4) Loamy Gleyed Matrix (F2) Red Parent Material (TF2)<br />
Stratified Layers (A5) (LRR C) Depleted Matrix (F3) Other (Explain in Remarks)<br />
1 cm Muck (A9) (LRR D) Redox Dark Surface (F6)<br />
Depleted Below Dark Surface (A11) Depleted Dark Surface (F7)<br />
Thick Dark Surface (A12)<br />
Redox Depressions (F8)<br />
3 Indicators <strong>of</strong> hydrophytic vegetation and<br />
Sandy Mucky Mineral (S1) Vernal Pools (F9) wetland hydrology must be present,<br />
Sandy Gleyed Matrix (S4)<br />
unless disturbed or problematic.<br />
Restrictive Layer (if present):<br />
Type: ---<br />
Depth (inches): --- Hydric Soil Present Yes No<br />
Remarks:<br />
subsurface soil conditions not observed.<br />
HYDROLOGY<br />
Wetland Hydrology Indicators:<br />
Primary Indicators (minimum <strong>of</strong> one required; check all that apply)<br />
Secondary Indicators (2 or more required)<br />
Surface Water (A1) Salt Crust (B11) Water Marks (B1) (Riverine)<br />
Saturation (A3) Aquatic Invertebrates (B13) Sediment Deposits (B2) (Riverine)<br />
Water Marks (B1) (Nonriverine) Hydrogen Sulfide Odor (C1) Drift Deposits (B3) (Riverine)<br />
Sediment Deposits (B2) (Nonriverine) Oxidized Rhizospheres along Living Roots (C3) Drainage Patterns (B10)<br />
Drift Deposits (B3) (Nonriverine) Presence <strong>of</strong> Reduced Iron (C4) Dry-Season Water Table (C2)<br />
Surface Soil Cracks (B6) Recent Iron Reduction in Tilled Soils (C6) Crayfish Burrows (C8)<br />
Inundation Visible on Aerial Imagery (B7) Thin Muck Surface (C7) Saturation Visible on Aerial Imagery (C9)<br />
Water-Stained Leaves (B9) Other (Explain in Remarks) Shallow Aquitard (D3)<br />
FAC-Neutral Test (D5)<br />
Field Observations:<br />
Surface Water Present Yes No Depth (inches):to 2" deep<br />
Water Table Present Yes No Depth (inches): N/A<br />
Saturation Present Yes No Depth (inches): N/A<br />
Wetland Hydrology Present Yes No<br />
(includes capillary fringe)<br />
Describe Recorded Data (stream gauge, monitoring well, aerial photos, previous inspections), if available:<br />
Remarks:<br />
Cowardin: PFOC (McKay Creek itself is R3UBH)<br />
HGM: Riverine Impounding<br />
US Army Corps <strong>of</strong> Engineers Arid West – Version 2.0
<strong>WETLAND</strong> <strong>DETERMINATION</strong> <strong>DATA</strong> <strong>FORM</strong> – Arid West Region<br />
Project/Site: <strong>Pendleton</strong> <strong>City</strong>/County: Umatilla Sampling Date: 5/19/2011<br />
Applicant/Owner: <strong>City</strong> <strong>of</strong> <strong>Pendleton</strong> State: OR Sampling Point: 42<br />
Investigator(s): LW/ACS Section, Township, Range:<br />
Landform (hillslope, terrace, etc.): McKay Creek @ park - lawn Local relief (concave, convex, none) none Slope (%) flat<br />
Subregion (LRR): Arid Lands Lat: Long: Datum:<br />
Soil Map Unit Name:<br />
NWI Classification:<br />
Are climatic/hydrologic site conditions typical for this time <strong>of</strong> year Yes No (If no, explain in Remarks.)<br />
Are Vegetation Soil or Hydrology significantly disturbed Are “Normal Circumstances” present Yes No<br />
Are Vegetation Soil or Hydrology naturally problematic (If needed, explain any answers in Remarks”)<br />
SUMMARY OF FINDINGS – Attach site map showing sampling point locations, transects, important features, etc.<br />
Hydrophytic Vegetation Present Yes No<br />
Hydric Soil Present Yes No<br />
Wetland Hydrology Present Yes No<br />
Is the Sampled Area<br />
within a Wetland Yes No<br />
Remarks: Viewed site from path along south bank <strong>of</strong> McKay Creek in <strong>Pendleton</strong> Community Park. Area outside McKay Creek corridor is developed -<br />
walking paths, lawn grasses, structures. Site 26, paired with Plot 41.<br />
VEGETATION – Use scientific names <strong>of</strong> plants.<br />
Absolute Dominant Indicator<br />
Tree Stratum (Plot size: 30' r) % Cover Species Status<br />
1.<br />
2.<br />
3.<br />
4.<br />
Sapling/Shrub Stratum (Plot size: 5' r)<br />
1.<br />
2.<br />
3.<br />
4.<br />
5.<br />
Herb Stratum (Plot size: 5' r)<br />
0% = Total Cover<br />
0% = Total Cover<br />
1. Lawn grasses (mowed) 100% FAC<br />
2.<br />
3.<br />
4.<br />
5.<br />
6.<br />
7.<br />
8.<br />
9.<br />
10.<br />
11.<br />
Woody Vine Stratum (Plot size: 30' r)<br />
1.<br />
2.<br />
100% = Total Cover<br />
Dominance Test worksheet:<br />
Number <strong>of</strong> Dominant Species<br />
That Are OBL, FACW, or FAC:<br />
Total Number <strong>of</strong> Dominant<br />
Species Across All Strata:<br />
Percent <strong>of</strong> Dominant Species<br />
That Are OBL, FACW, or FAC:<br />
0 = Total Cover<br />
% Bare Ground in Herb Stratum: 0%<br />
Remarks:<br />
Lawn grasses mowed and not identifiable to species. Presume typical blend <strong>of</strong> turf grasses, which are generaly rated FAC.<br />
1 (A)<br />
1 (B)<br />
100% (A/B)<br />
Prevalence Index worksheet:<br />
Total % Cover <strong>of</strong>:<br />
Multiply by:<br />
OBL species x 1 =<br />
FACW species x 2 =<br />
FAC species x 3 =<br />
FACU species x 4 =<br />
UPL species x 5 =<br />
Column Totals<br />
Prevalence Index = B/A =<br />
Hydrophytic Vegetation Indicators:<br />
Dominance Test is >50%<br />
Prevalence Index is ≤3.0 1<br />
Morphological Adaptations 1 (Provide supporting<br />
data in Remarks or on a separate sheet)<br />
Wetland Non-Vascular Plants 1<br />
Problematic Hydrophytic Vegetation 1 (Explain)<br />
1 Indicators <strong>of</strong> hydric soil and wetland hydrology must<br />
be present, unless disturbed or problematic.<br />
Hydrophytic<br />
Vegetation<br />
Present Yes No<br />
US Army Corps <strong>of</strong> Engineers Arid West – Version 2.0
SOIL Sampling Point: 42<br />
Pr<strong>of</strong>ile Description: (Describe to the depth needed to document the indicator or confirm the absence <strong>of</strong> indicators.)<br />
Depth Matrix Redox Features<br />
(inches) Color (moist) % Color (moist) % Type 1 Loc 2 Texture Remarks<br />
1 Type: C=Concentration, D=Depletion, RM=Reduced Matrix, CS=Covered or Coated Sand Grains.<br />
2 Location: PL=Pore Lining, M=Matrix.<br />
Hydric Soil Indicators: (Applicable to all LRRs, unless otherwise noted.) Indicators for Problematic Hydric Soils 3 :<br />
Histosol (A1) Sandy Redox (S5) 1 cm Muck (A9) (LRR D)<br />
Histic Epipedon (A2) Stripped Matrix (S6) 2 cm Muck (A10)<br />
Black Histic (A3) Loamy Mucky Mineral (F1) (except MLRA 1) Reduced Vertic (F18)<br />
Hydrogen Sulfide (A4) Loamy Gleyed Matrix (F2) Red Parent Material (TF2)<br />
Stratified Layers (A5) (LRR C) Depleted Matrix (F3) Other (Explain in Remarks)<br />
1 cm Muck (A9) (LRR D) Redox Dark Surface (F6)<br />
Depleted Below Dark Surface (A11) Depleted Dark Surface (F7)<br />
Thick Dark Surface (A12)<br />
Redox Depressions (F8)<br />
3 Indicators <strong>of</strong> hydrophytic vegetation and<br />
Sandy Mucky Mineral (S1) Vernal Pools (F9) wetland hydrology must be present,<br />
Sandy Gleyed Matrix (S4)<br />
unless disturbed or problematic.<br />
Restrictive Layer (if present):<br />
Type: ---<br />
Depth (inches): --- Hydric Soil Present Yes No<br />
Remarks:<br />
subsurface soil conditions not observed.<br />
HYDROLOGY<br />
Wetland Hydrology Indicators:<br />
Primary Indicators (minimum <strong>of</strong> one required; check all that apply)<br />
Secondary Indicators (2 or more required)<br />
Surface Water (A1) Salt Crust (B11) Water Marks (B1) (Riverine)<br />
Saturation (A3) Aquatic Invertebrates (B13) Sediment Deposits (B2) (Riverine)<br />
Water Marks (B1) (Nonriverine) Hydrogen Sulfide Odor (C1) Drift Deposits (B3) (Riverine)<br />
Sediment Deposits (B2) (Nonriverine) Oxidized Rhizospheres along Living Roots (C3) Drainage Patterns (B10)<br />
Drift Deposits (B3) (Nonriverine) Presence <strong>of</strong> Reduced Iron (C4) Dry-Season Water Table (C2)<br />
Surface Soil Cracks (B6) Recent Iron Reduction in Tilled Soils (C6) Crayfish Burrows (C8)<br />
Inundation Visible on Aerial Imagery (B7) Thin Muck Surface (C7) Saturation Visible on Aerial Imagery (C9)<br />
Water-Stained Leaves (B9) Other (Explain in Remarks) Shallow Aquitard (D3)<br />
FAC-Neutral Test (D5)<br />
Field Observations:<br />
Surface Water Present Yes No Depth (inches):not observed<br />
Water Table Present Yes No Depth (inches): N/A<br />
Saturation Present Yes No Depth (inches): N/A<br />
Wetland Hydrology Present Yes No<br />
(includes capillary fringe)<br />
Describe Recorded Data (stream gauge, monitoring well, aerial photos, previous inspections), if available:<br />
Remarks:<br />
The terrace exhibits no indication that high flows escape into the managed landscaped part <strong>of</strong> the property.<br />
US Army Corps <strong>of</strong> Engineers Arid West – Version 2.0
<strong>WETLAND</strong> <strong>DETERMINATION</strong> <strong>DATA</strong> <strong>FORM</strong> – Arid West Region<br />
Project/Site: <strong>Pendleton</strong> <strong>City</strong>/County: Umatilla Sampling Date: 5/19/2011<br />
Applicant/Owner: <strong>City</strong> <strong>of</strong> <strong>Pendleton</strong> State: OR Sampling Point: 43<br />
Investigator(s): LW/ACS Section, Township, Range:<br />
Landform (hillslope, terrace, etc.): Umatilla River Local relief (concave, convex, none) none Slope (%) 2%<br />
Subregion (LRR): Arid Lands Lat: Long: Datum:<br />
Soil Map Unit Name: water NWI Classification: R3UBH<br />
Are climatic/hydrologic site conditions typical for this time <strong>of</strong> year Yes No (If no, explain in Remarks.)<br />
Are Vegetation Soil or Hydrology significantly disturbed Are “Normal Circumstances” present Yes No<br />
Are Vegetation Soil or Hydrology naturally problematic (If needed, explain any answers in Remarks”)<br />
SUMMARY OF FINDINGS – Attach site map showing sampling point locations, transects, important features, etc.<br />
Hydrophytic Vegetation Present Yes No<br />
Is the Sampled Area<br />
Hydric Soil Present Yes No<br />
within a Wetland Yes No<br />
Wetland Hydrology Present Yes No<br />
Remarks: Umatilla River at the Main Street Bridge below the Performing Arts building - 214 Main Street. Site 81.<br />
VEGETATION – Use scientific names <strong>of</strong> plants.<br />
Absolute Dominant Indicator<br />
Tree Stratum (Plot size: 30' r) % Cover Species Status<br />
1. Ulmus sp. 80% NI<br />
2.<br />
3.<br />
4.<br />
Sapling/Shrub Stratum (Plot size: 5' r)<br />
1.<br />
2.<br />
3.<br />
4.<br />
5.<br />
Herb Stratum (Plot size: 5' r)<br />
0% = Total Cover<br />
0% = Total Cover<br />
1. Lapsana communis T FAC<br />
2.<br />
3.<br />
4.<br />
5.<br />
6.<br />
7.<br />
8.<br />
9.<br />
10.<br />
11.<br />
Woody Vine Stratum (Plot size: 30' r)<br />
1.<br />
2.<br />
100% = Total Cover<br />
Dominance Test worksheet:<br />
Number <strong>of</strong> Dominant Species<br />
That Are OBL, FACW, or FAC:<br />
Total Number <strong>of</strong> Dominant<br />
Species Across All Strata:<br />
Percent <strong>of</strong> Dominant Species<br />
That Are OBL, FACW, or FAC:<br />
0 = Total Cover<br />
% Bare Ground in Herb Stratum: 100%<br />
Remarks:<br />
Elms not identifiable to species. About 12 inches below upper extent <strong>of</strong> debris lines. Fine material swept free, minimal herbaceous and shrubby<br />
vegetation below OHWL. TUplands much more heavily vegetated, with elms and Robinia pseudoacacia<br />
1 (A)<br />
2 (B)<br />
50 (A/B)<br />
Prevalence Index worksheet:<br />
Total % Cover <strong>of</strong>:<br />
Multiply by:<br />
OBL species x 1 =<br />
FACW species x 2 =<br />
FAC species x 3 =<br />
FACU species x 4 =<br />
UPL species 80 x 5 = 400<br />
Column Totals 80 400<br />
Prevalence Index = B/A = 5.00<br />
Hydrophytic Vegetation Indicators:<br />
Dominance Test is >50%<br />
Prevalence Index is ≤3.0 1<br />
Morphological Adaptations 1 (Provide supporting<br />
data in Remarks or on a separate sheet)<br />
Wetland Non-Vascular Plants 1<br />
Problematic Hydrophytic Vegetation 1 (Explain)<br />
1 Indicators <strong>of</strong> hydric soil and wetland hydrology must<br />
be present, unless disturbed or problematic.<br />
Hydrophytic<br />
Vegetation<br />
Present Yes No<br />
US Army Corps <strong>of</strong> Engineers Arid West – Version 2.0
SOIL Sampling Point: 43<br />
Pr<strong>of</strong>ile Description: (Describe to the depth needed to document the indicator or confirm the absence <strong>of</strong> indicators.)<br />
Depth Matrix Redox Features<br />
(inches) Color (moist) % Color (moist) % Type 1 Loc 2 Texture Remarks<br />
1 Type: C=Concentration, D=Depletion, RM=Reduced Matrix, CS=Covered or Coated Sand Grains.<br />
2 Location: PL=Pore Lining, M=Matrix.<br />
Hydric Soil Indicators: (Applicable to all LRRs, unless otherwise noted.) Indicators for Problematic Hydric Soils 3 :<br />
Histosol (A1) Sandy Redox (S5) 1 cm Muck (A9) (LRR D)<br />
Histic Epipedon (A2) Stripped Matrix (S6) 2 cm Muck (A10)<br />
Black Histic (A3) Loamy Mucky Mineral (F1) (except MLRA 1) Reduced Vertic (F18)<br />
Hydrogen Sulfide (A4) Loamy Gleyed Matrix (F2) Red Parent Material (TF2)<br />
Stratified Layers (A5) (LRR C) Depleted Matrix (F3) Other (Explain in Remarks)<br />
1 cm Muck (A9) (LRR D) Redox Dark Surface (F6)<br />
Depleted Below Dark Surface (A11) Depleted Dark Surface (F7)<br />
Thick Dark Surface (A12)<br />
Redox Depressions (F8)<br />
3 Indicators <strong>of</strong> hydrophytic vegetation and<br />
Sandy Mucky Mineral (S1) Vernal Pools (F9) wetland hydrology must be present,<br />
Sandy Gleyed Matrix (S4)<br />
unless disturbed or problematic.<br />
Restrictive Layer (if present):<br />
Type: ---<br />
Depth (inches): --- Hydric Soil Present Yes No<br />
Remarks:<br />
subsurface soil conditions not observed.<br />
HYDROLOGY<br />
Wetland Hydrology Indicators:<br />
Primary Indicators (minimum <strong>of</strong> one required; check all that apply)<br />
Secondary Indicators (2 or more required)<br />
Surface Water (A1) Salt Crust (B11) Water Marks (B1) (Riverine)<br />
Saturation (A3) Aquatic Invertebrates (B13) Sediment Deposits (B2) (Riverine)<br />
Water Marks (B1) (Nonriverine) Hydrogen Sulfide Odor (C1) Drift Deposits (B3) (Riverine)<br />
Sediment Deposits (B2) (Nonriverine) Oxidized Rhizospheres along Living Roots (C3) Drainage Patterns (B10)<br />
Drift Deposits (B3) (Nonriverine) Presence <strong>of</strong> Reduced Iron (C4) Dry-Season Water Table (C2)<br />
Surface Soil Cracks (B6) Recent Iron Reduction in Tilled Soils (C6) Crayfish Burrows (C8)<br />
Inundation Visible on Aerial Imagery (B7) Thin Muck Surface (C7) Saturation Visible on Aerial Imagery (C9)<br />
Water-Stained Leaves (B9) Other (Explain in Remarks) Shallow Aquitard (D3)<br />
FAC-Neutral Test (D5)<br />
Field Observations:<br />
Surface Water Present Yes No Depth (inches):Plot at edge <strong>of</strong> water<br />
Water Table Present Yes No Depth (inches): N/A<br />
Saturation Present Yes No Depth (inches): N/A<br />
Wetland Hydrology Present Yes No<br />
(includes capillary fringe)<br />
Describe Recorded Data (stream gauge, monitoring well, aerial photos, previous inspections), if available:<br />
US Army Corps <strong>of</strong> Engineers Arid West – Version 2.0
Remarks:<br />
Umatilla River has experienced exceptionally high flows recently due to heavy rainfall on an above-average snowpack. Newspaper reports 10,000<br />
CFS in the river through <strong>Pendleton</strong>; annual peak flows typically range up to 5,000 CFS.<br />
Cowardin: R3UBH<br />
HGM: Riverine Flow-Through<br />
US Army Corps <strong>of</strong> Engineers Arid West – Version 2.0
<strong>WETLAND</strong> <strong>DETERMINATION</strong> <strong>DATA</strong> <strong>FORM</strong> – Arid West Region<br />
Project/Site: <strong>Pendleton</strong> <strong>City</strong>/County: Umatilla Sampling Date: 5/19/2011<br />
Applicant/Owner: <strong>City</strong> <strong>of</strong> <strong>Pendleton</strong> State: OR Sampling Point: 44<br />
Investigator(s): LW/ACS Section, Township, Range:<br />
Landform (hillslope, terrace, etc.): Umatilla River flood terrace Local relief (concave, convex, none) none Slope (%) 2%<br />
Subregion (LRR): Arid Lands Lat: Long: Datum:<br />
Soil Map Unit Name: Water NWI Classification: PFOC, R3UBH (river)<br />
Are climatic/hydrologic site conditions typical for this time <strong>of</strong> year Yes No (If no, explain in Remarks.)<br />
Are Vegetation Soil or Hydrology significantly disturbed Are “Normal Circumstances” present Yes No<br />
Are Vegetation Soil or Hydrology naturally problematic (If needed, explain any answers in Remarks”)<br />
SUMMARY OF FINDINGS – Attach site map showing sampling point locations, transects, important features, etc.<br />
Hydrophytic Vegetation Present Yes No<br />
Is the Sampled Area<br />
Hydric Soil Present Yes No<br />
within a Wetland Yes No<br />
Wetland Hydrology Present Yes No<br />
Remarks: OFFSITE - Umatilla River at 10 th Street bridge, northwest quadrant. Near Lincoln Primary School. Site 145. Paired with Plot 45.<br />
VEGETATION – Use scientific names <strong>of</strong> plants.<br />
Absolute Dominant Indicator<br />
Tree Stratum (Plot size: 30'r) % Cover Species Status<br />
1. Elaeagnus angustifolia 5% FAC<br />
2. Salix lucida v. lasiandra 10% FACW<br />
3. Populus balsamifera v. trichocarpa 5% FAC<br />
4.<br />
20% = Total Cover<br />
Sapling/Shrub Stratum (Plot size: 5' r)<br />
1. Populus balsamifera v. trichocarpa 5% FAC<br />
2. Syringa sp. T<br />
3.<br />
4.<br />
5.<br />
0% = Total Cover<br />
Herb Stratum (Plot size: 5' r)<br />
1. Phalaris arundinacea 60% FACW<br />
2. Bromus rigidus 30% NI<br />
3. annual forbs 10% FAC<br />
4.<br />
5.<br />
6.<br />
7.<br />
8.<br />
9.<br />
10.<br />
11.<br />
100% = Total Cover<br />
Woody Vine Stratum (Plot size: 30' r)<br />
1.<br />
2.<br />
0 = Total Cover<br />
% Bare Ground in Herb Stratum: 0%<br />
Remarks:<br />
Viewed from 10 th Street near bridge.<br />
Dominance Test worksheet:<br />
Number <strong>of</strong> Dominant Species<br />
That Are OBL, FACW, or FAC:<br />
Total Number <strong>of</strong> Dominant<br />
Species Across All Strata:<br />
Percent <strong>of</strong> Dominant Species<br />
That Are OBL, FACW, or FAC:<br />
5 (A)<br />
6 (B)<br />
83% (A/B)<br />
Prevalence Index worksheet:<br />
Total % Cover <strong>of</strong>:<br />
Multiply by:<br />
OBL species x 1 =<br />
FACW species x 2 =<br />
FAC species x 3 =<br />
FACU species x 4 =<br />
UPL species x 5 =<br />
Column Totals<br />
Prevalence Index = B/A =<br />
Hydrophytic Vegetation Indicators:<br />
Dominance Test is >50%<br />
Prevalence Index is ≤3.0 1<br />
Morphological Adaptations 1 (Provide supporting<br />
data in Remarks or on a separate sheet)<br />
Wetland Non-Vascular Plants 1<br />
Problematic Hydrophytic Vegetation 1 (Explain)<br />
1 Indicators <strong>of</strong> hydric soil and wetland hydrology must<br />
be present, unless disturbed or problematic.<br />
Hydrophytic<br />
Vegetation<br />
Present Yes No<br />
US Army Corps <strong>of</strong> Engineers Arid West – Version 2.0
SOIL Sampling Point: 44<br />
Pr<strong>of</strong>ile Description: (Describe to the depth needed to document the indicator or confirm the absence <strong>of</strong> indicators.)<br />
Depth Matrix Redox Features<br />
(inches) Color (moist) % Color (moist) % Type 1 Loc 2 Texture Remarks<br />
1 Type: C=Concentration, D=Depletion, RM=Reduced Matrix, CS=Covered or Coated Sand Grains.<br />
2 Location: PL=Pore Lining, M=Matrix.<br />
Hydric Soil Indicators: (Applicable to all LRRs, unless otherwise noted.) Indicators for Problematic Hydric Soils 3 :<br />
Histosol (A1) Sandy Redox (S5) 1 cm Muck (A9) (LRR D)<br />
Histic Epipedon (A2) Stripped Matrix (S6) 2 cm Muck (A10)<br />
Black Histic (A3) Loamy Mucky Mineral (F1) (except MLRA 1) Reduced Vertic (F18)<br />
Hydrogen Sulfide (A4) Loamy Gleyed Matrix (F2) Red Parent Material (TF2)<br />
Stratified Layers (A5) (LRR C) Depleted Matrix (F3) Other (Explain in Remarks)<br />
1 cm Muck (A9) (LRR D) Redox Dark Surface (F6)<br />
Depleted Below Dark Surface (A11) Depleted Dark Surface (F7)<br />
Thick Dark Surface (A12)<br />
Redox Depressions (F8)<br />
3 Indicators <strong>of</strong> hydrophytic vegetation and<br />
Sandy Mucky Mineral (S1) Vernal Pools (F9) wetland hydrology must be present,<br />
Sandy Gleyed Matrix (S4)<br />
unless disturbed or problematic.<br />
Restrictive Layer (if present):<br />
Type: ---<br />
Depth (inches): --- Hydric Soil Present Yes No<br />
Remarks:<br />
OFFSITE - subsurface soil conditions not observed.<br />
HYDROLOGY<br />
Wetland Hydrology Indicators:<br />
Primary Indicators (minimum <strong>of</strong> one required; check all that apply)<br />
Secondary Indicators (2 or more required)<br />
Surface Water (A1) Salt Crust (B11) Water Marks (B1) (Riverine)<br />
Saturation (A3) Aquatic Invertebrates (B13) Sediment Deposits (B2) (Riverine)<br />
Water Marks (B1) (Nonriverine) Hydrogen Sulfide Odor (C1) Drift Deposits (B3) (Riverine)<br />
Sediment Deposits (B2) (Nonriverine) Oxidized Rhizospheres along Living Roots (C3) Drainage Patterns (B10)<br />
Drift Deposits (B3) (Nonriverine) Presence <strong>of</strong> Reduced Iron (C4) Dry-Season Water Table (C2)<br />
Surface Soil Cracks (B6) Recent Iron Reduction in Tilled Soils (C6) Crayfish Burrows (C8)<br />
Inundation Visible on Aerial Imagery (B7) Thin Muck Surface (C7) Saturation Visible on Aerial Imagery (C9)<br />
Water-Stained Leaves (B9) Other (Explain in Remarks) Shallow Aquitard (D3)<br />
FAC-Neutral Test (D5)<br />
Field Observations:<br />
Surface Water Present Yes No Depth (inches):not observed<br />
Water Table Present Yes No Depth (inches): N/A<br />
Saturation Present Yes No Depth (inches): N/A<br />
Wetland Hydrology Present Yes No<br />
(includes capillary fringe)<br />
Describe Recorded Data (stream gauge, monitoring well, aerial photos, previous inspections), if available:<br />
Remarks:<br />
Landscape position, proximity to river, and vegetation community strongly suggests the presence <strong>of</strong> saturated soil conditions for extended periods in<br />
the early growing season.<br />
Cowardin: PFOC<br />
HGM: unclear due to vegetation cover. Likely sources are groundwater support and occasional overbank flows from river plus run<strong>of</strong>f from adjacent<br />
developed areas. Did not see inundation during the site visit.<br />
US Army Corps <strong>of</strong> Engineers Arid West – Version 2.0
<strong>WETLAND</strong> <strong>DETERMINATION</strong> <strong>DATA</strong> <strong>FORM</strong> – Arid West Region<br />
Project/Site: <strong>Pendleton</strong> <strong>City</strong>/County: Umatilla Sampling Date: 5/19/2011<br />
Applicant/Owner: <strong>City</strong> <strong>of</strong> <strong>Pendleton</strong> State: OR Sampling Point: 45<br />
Investigator(s): LW/ACS Section, Township, Range:<br />
Landform (hillslope, terrace, etc.): roadway embankment Local relief (concave, convex, none) none Slope (%) 2%<br />
Subregion (LRR): Arid Lands Lat: Long: Datum:<br />
Soil Map Unit Name: 126A: Xer<strong>of</strong>luvents, 0-3% slopes NWI Classification:<br />
Are climatic/hydrologic site conditions typical for this time <strong>of</strong> year Yes No (If no, explain in Remarks.)<br />
Are Vegetation Soil or Hydrology significantly disturbed Are “Normal Circumstances” present Yes No<br />
Are Vegetation Soil or Hydrology naturally problematic (If needed, explain any answers in Remarks”)<br />
SUMMARY OF FINDINGS – Attach site map showing sampling point locations, transects, important features, etc.<br />
Hydrophytic Vegetation Present Yes No<br />
Is the Sampled Area<br />
Hydric Soil Present Yes No<br />
within a Wetland Yes No<br />
Wetland Hydrology Present Yes No<br />
Remarks: OFFSITE - Umatilla River at 10 th Street bridge, northwest quadrant. Near Lincoln Primary School. Site 145. Paired with Plot 44.<br />
VEGETATION – Use scientific names <strong>of</strong> plants.<br />
Absolute Dominant Indicator<br />
Tree Stratum (Plot size: 30' r) % Cover Species Status<br />
1.<br />
2.<br />
3.<br />
4.<br />
Sapling/Shrub Stratum (Plot size: 5' r)<br />
1.<br />
2.<br />
3.<br />
4.<br />
5.<br />
Herb Stratum (Plot size: 5' r)<br />
0% = Total Cover<br />
0% = Total Cover<br />
1. Bromus tectorum 10% NI<br />
2. Bromus rigidus 90% NI<br />
3.<br />
4.<br />
5.<br />
6.<br />
7.<br />
8.<br />
9.<br />
10.<br />
11.<br />
Woody Vine Stratum (Plot size: 30' r)<br />
1.<br />
2.<br />
100% = Total Cover<br />
Dominance Test worksheet:<br />
Number <strong>of</strong> Dominant Species<br />
That Are OBL, FACW, or FAC:<br />
Total Number <strong>of</strong> Dominant<br />
Species Across All Strata:<br />
Percent <strong>of</strong> Dominant Species<br />
That Are OBL, FACW, or FAC:<br />
0 = Total Cover<br />
% Bare Ground in Herb Stratum: 0%<br />
Remarks:<br />
Viewed from 10 th Street near bridge. Community on roadway embankment leading down to the terrace described in Plot 44.<br />
0 (A)<br />
1 (B)<br />
0% (A/B)<br />
Prevalence Index worksheet:<br />
Total % Cover <strong>of</strong>:<br />
Multiply by:<br />
OBL species 0 x 1 = 0<br />
FACW species 0 x 2 = 0<br />
FAC species 0 x 3 = 0<br />
FACU species 0 x 4 = 0<br />
UPL species 0 x 5 = 0<br />
Column Totals 0 0<br />
Prevalence Index = B/A = N/A<br />
Hydrophytic Vegetation Indicators:<br />
Dominance Test is >50%<br />
Prevalence Index is ≤3.0 1<br />
Morphological Adaptations 1 (Provide supporting<br />
data in Remarks or on a separate sheet)<br />
Wetland Non-Vascular Plants 1<br />
Problematic Hydrophytic Vegetation 1 (Explain)<br />
1 Indicators <strong>of</strong> hydric soil and wetland hydrology must<br />
be present, unless disturbed or problematic.<br />
Hydrophytic<br />
Vegetation<br />
Present Yes No<br />
US Army Corps <strong>of</strong> Engineers Arid West – Version 2.0
SOIL Sampling Point: 45<br />
Pr<strong>of</strong>ile Description: (Describe to the depth needed to document the indicator or confirm the absence <strong>of</strong> indicators.)<br />
Depth Matrix Redox Features<br />
(inches) Color (moist) % Color (moist) % Type 1 Loc 2 Texture Remarks<br />
1 Type: C=Concentration, D=Depletion, RM=Reduced Matrix, CS=Covered or Coated Sand Grains.<br />
2 Location: PL=Pore Lining, M=Matrix.<br />
Hydric Soil Indicators: (Applicable to all LRRs, unless otherwise noted.) Indicators for Problematic Hydric Soils 3 :<br />
Histosol (A1) Sandy Redox (S5) 1 cm Muck (A9) (LRR D)<br />
Histic Epipedon (A2) Stripped Matrix (S6) 2 cm Muck (A10)<br />
Black Histic (A3) Loamy Mucky Mineral (F1) (except MLRA 1) Reduced Vertic (F18)<br />
Hydrogen Sulfide (A4) Loamy Gleyed Matrix (F2) Red Parent Material (TF2)<br />
Stratified Layers (A5) (LRR C) Depleted Matrix (F3) Other (Explain in Remarks)<br />
1 cm Muck (A9) (LRR D) Redox Dark Surface (F6)<br />
Depleted Below Dark Surface (A11) Depleted Dark Surface (F7)<br />
Thick Dark Surface (A12)<br />
Redox Depressions (F8)<br />
3 Indicators <strong>of</strong> hydrophytic vegetation and<br />
Sandy Mucky Mineral (S1) Vernal Pools (F9) wetland hydrology must be present,<br />
Sandy Gleyed Matrix (S4)<br />
unless disturbed or problematic.<br />
Restrictive Layer (if present):<br />
Type: ---<br />
Depth (inches): --- Hydric Soil Present Yes No<br />
Remarks:<br />
OFFSITE - subsurface soil conditions not observed.<br />
HYDROLOGY<br />
Wetland Hydrology Indicators:<br />
Primary Indicators (minimum <strong>of</strong> one required; check all that apply)<br />
Secondary Indicators (2 or more required)<br />
Surface Water (A1) Salt Crust (B11) Water Marks (B1) (Riverine)<br />
Saturation (A3) Aquatic Invertebrates (B13) Sediment Deposits (B2) (Riverine)<br />
Water Marks (B1) (Nonriverine) Hydrogen Sulfide Odor (C1) Drift Deposits (B3) (Riverine)<br />
Sediment Deposits (B2) (Nonriverine) Oxidized Rhizospheres along Living Roots (C3) Drainage Patterns (B10)<br />
Drift Deposits (B3) (Nonriverine) Presence <strong>of</strong> Reduced Iron (C4) Dry-Season Water Table (C2)<br />
Surface Soil Cracks (B6) Recent Iron Reduction in Tilled Soils (C6) Crayfish Burrows (C8)<br />
Inundation Visible on Aerial Imagery (B7) Thin Muck Surface (C7) Saturation Visible on Aerial Imagery (C9)<br />
Water-Stained Leaves (B9) Other (Explain in Remarks) Shallow Aquitard (D3)<br />
FAC-Neutral Test (D5)<br />
Field Observations:<br />
Surface Water Present Yes No Depth (inches):not observed<br />
Water Table Present Yes No Depth (inches): N/A<br />
Saturation Present Yes No Depth (inches): N/A<br />
Wetland Hydrology Present Yes No<br />
(includes capillary fringe)<br />
Describe Recorded Data (stream gauge, monitoring well, aerial photos, previous inspections), if available:<br />
Remarks:<br />
US Army Corps <strong>of</strong> Engineers Arid West – Version 2.0
<strong>WETLAND</strong> <strong>DETERMINATION</strong> <strong>DATA</strong> <strong>FORM</strong> – Arid West Region<br />
Project/Site: <strong>Pendleton</strong> <strong>City</strong>/County: Umatilla Sampling Date: 5/19/2011<br />
Applicant/Owner: <strong>City</strong> <strong>of</strong> <strong>Pendleton</strong> State: OR Sampling Point: 46<br />
Investigator(s): LW/ACS Section, Township, Range:<br />
Landform (hillslope, terrace, etc.): low terrace Local relief (concave, convex, none) none Slope (%) 2%<br />
Subregion (LRR): Arid Lands Lat: Long: Datum:<br />
Soil Map Unit Name: NWI Classification: PFOC, R3UBH (river)<br />
Are climatic/hydrologic site conditions typical for this time <strong>of</strong> year Yes No (If no, explain in Remarks.)<br />
Are Vegetation Soil or Hydrology significantly disturbed Are “Normal Circumstances” present Yes No<br />
Are Vegetation Soil or Hydrology naturally problematic (If needed, explain any answers in Remarks”)<br />
SUMMARY OF FINDINGS – Attach site map showing sampling point locations, transects, important features, etc.<br />
Hydrophytic Vegetation Present Yes No<br />
Hydric Soil Present Yes No<br />
Wetland Hydrology Present Yes No<br />
Is the Sampled Area<br />
within a Wetland Yes No<br />
Remarks: OFFSITE - Umatilla River northeast <strong>of</strong> the 10 th Street bridge, near Lincoln Primary School. Plot taken on low terrace within OHWL. Plot<br />
paired with Plot 47. Site 64.<br />
VEGETATION – Use scientific names <strong>of</strong> plants.<br />
Absolute Dominant Indicator<br />
Tree Stratum (Plot size: 30' r) % Cover Species Status<br />
1. Ornamental maple 35% NL<br />
2. Ornamental pine 10% NL<br />
3.<br />
4.<br />
45% = Total Cover<br />
Sapling/Shrub Stratum (Plot size: 5' r)<br />
1.<br />
2.<br />
3.<br />
4.<br />
5.<br />
0% = Total Cover<br />
Herb Stratum (Plot size: 5' r)<br />
1. Phalaris arundinacea 100% FACW<br />
2.<br />
3.<br />
4.<br />
5.<br />
6.<br />
7.<br />
8.<br />
9.<br />
10.<br />
11.<br />
100% = Total Cover<br />
Woody Vine Stratum (Plot size: 30' r)<br />
1.<br />
2.<br />
0 = Total Cover<br />
% Bare Ground in Herb Stratum: 0%<br />
Remarks:<br />
Viewed from 10 th Street near bridge. Community below OHWL.<br />
Dominance Test worksheet:<br />
Number <strong>of</strong> Dominant Species<br />
That Are OBL, FACW, or FAC:<br />
Total Number <strong>of</strong> Dominant<br />
Species Across All Strata:<br />
Percent <strong>of</strong> Dominant Species<br />
That Are OBL, FACW, or FAC:<br />
1 (A)<br />
3 (B)<br />
33 (A/B)<br />
Prevalence Index worksheet:<br />
Total % Cover <strong>of</strong>:<br />
Multiply by:<br />
OBL species 0 x 1 = 0<br />
FACW species 100 x 2 = 200<br />
FAC species 0 x 3 = 0<br />
FACU species 0 x 4 = 0<br />
UPL species 45 x 5 = 220<br />
Column Totals 145 420<br />
Prevalence Index = B/A = 2.89<br />
Hydrophytic Vegetation Indicators:<br />
Dominance Test is >50%<br />
Prevalence Index is ≤3.0 1<br />
Morphological Adaptations 1 (Provide supporting<br />
data in Remarks or on a separate sheet)<br />
Wetland Non-Vascular Plants 1<br />
Problematic Hydrophytic Vegetation 1 (Explain)<br />
1 Indicators <strong>of</strong> hydric soil and wetland hydrology must<br />
be present, unless disturbed or problematic.<br />
Hydrophytic<br />
Vegetation<br />
Present Yes No<br />
US Army Corps <strong>of</strong> Engineers Arid West – Version 2.0
SOIL Sampling Point: 46<br />
Pr<strong>of</strong>ile Description: (Describe to the depth needed to document the indicator or confirm the absence <strong>of</strong> indicators.)<br />
Depth Matrix Redox Features<br />
(inches) Color (moist) % Color (moist) % Type 1 Loc 2 Texture Remarks<br />
1 Type: C=Concentration, D=Depletion, RM=Reduced Matrix, CS=Covered or Coated Sand Grains.<br />
2 Location: PL=Pore Lining, M=Matrix.<br />
Hydric Soil Indicators: (Applicable to all LRRs, unless otherwise noted.) Indicators for Problematic Hydric Soils 3 :<br />
Histosol (A1) Sandy Redox (S5) 1 cm Muck (A9) (LRR D)<br />
Histic Epipedon (A2) Stripped Matrix (S6) 2 cm Muck (A10)<br />
Black Histic (A3) Loamy Mucky Mineral (F1) (except MLRA 1) Reduced Vertic (F18)<br />
Hydrogen Sulfide (A4) Loamy Gleyed Matrix (F2) Red Parent Material (TF2)<br />
Stratified Layers (A5) (LRR C) Depleted Matrix (F3) Other (Explain in Remarks)<br />
1 cm Muck (A9) (LRR D) Redox Dark Surface (F6)<br />
Depleted Below Dark Surface (A11) Depleted Dark Surface (F7)<br />
Thick Dark Surface (A12)<br />
Redox Depressions (F8)<br />
3 Indicators <strong>of</strong> hydrophytic vegetation and<br />
Sandy Mucky Mineral (S1) Vernal Pools (F9) wetland hydrology must be present,<br />
Sandy Gleyed Matrix (S4)<br />
unless disturbed or problematic.<br />
Restrictive Layer (if present):<br />
Type: ---<br />
Depth (inches): --- Hydric Soil Present Yes No<br />
Remarks:<br />
OFFSITE - subsurface soil conditions not observed.<br />
HYDROLOGY<br />
Wetland Hydrology Indicators:<br />
Primary Indicators (minimum <strong>of</strong> one required; check all that apply)<br />
Secondary Indicators (2 or more required)<br />
Surface Water (A1) Salt Crust (B11) Water Marks (B1) (Riverine)<br />
Saturation (A3) Aquatic Invertebrates (B13) Sediment Deposits (B2) (Riverine)<br />
Water Marks (B1) (Nonriverine) Hydrogen Sulfide Odor (C1) Drift Deposits (B3) (Riverine)<br />
Sediment Deposits (B2) (Nonriverine) Oxidized Rhizospheres along Living Roots (C3) Drainage Patterns (B10)<br />
Drift Deposits (B3) (Nonriverine) Presence <strong>of</strong> Reduced Iron (C4) Dry-Season Water Table (C2)<br />
Surface Soil Cracks (B6) Recent Iron Reduction in Tilled Soils (C6) Crayfish Burrows (C8)<br />
Inundation Visible on Aerial Imagery (B7) Thin Muck Surface (C7) Saturation Visible on Aerial Imagery (C9)<br />
Water-Stained Leaves (B9) Other (Explain in Remarks) Shallow Aquitard (D3)<br />
FAC-Neutral Test (D5)<br />
Field Observations:<br />
Surface Water Present Yes No Depth (inches):in river<br />
Water Table Present Yes No Depth (inches): N/A<br />
Saturation Present Yes No Depth (inches): N/A<br />
Wetland Hydrology Present Yes No<br />
(includes capillary fringe)<br />
Describe Recorded Data (stream gauge, monitoring well, aerial photos, previous inspections), if available:<br />
Remarks:<br />
Based on high water marks seen at Area 81, this area may have flooded during peak river volumes. If not, saturation levels were likely at or near the<br />
surface.<br />
US Army Corps <strong>of</strong> Engineers Arid West – Version 2.0
<strong>WETLAND</strong> <strong>DETERMINATION</strong> <strong>DATA</strong> <strong>FORM</strong> – Arid West Region<br />
Project/Site: <strong>Pendleton</strong> <strong>City</strong>/County: Umatilla Sampling Date: 5/19/2011<br />
Applicant/Owner: <strong>City</strong> <strong>of</strong> <strong>Pendleton</strong> State: OR Sampling Point: 47<br />
Investigator(s): LW/ACS Section, Township, Range:<br />
Landform (hillslope, terrace, etc.): hillslopes Local relief (concave, convex, none) none Slope (%) 20%<br />
Subregion (LRR): Arid Lands Lat: Long: Datum:<br />
Soil Map Unit Name: 126A: Xer<strong>of</strong>luvents, 0-3% slopes NWI Classification:<br />
Are climatic/hydrologic site conditions typical for this time <strong>of</strong> year Yes No (If no, explain in Remarks.)<br />
Are Vegetation Soil or Hydrology significantly disturbed Are “Normal Circumstances” present Yes No<br />
Are Vegetation Soil or Hydrology naturally problematic (If needed, explain any answers in Remarks”)<br />
SUMMARY OF FINDINGS – Attach site map showing sampling point locations, transects, important features, etc.<br />
Hydrophytic Vegetation Present Yes No<br />
Hydric Soil Present Yes No<br />
Wetland Hydrology Present Yes No<br />
Is the Sampled Area<br />
within a Wetland Yes No<br />
Remarks: OFFSITE - Umatilla River northeast <strong>of</strong> the 10 th Street bridge, near Lincoln Primary School. Plot taken hillslope between adjacent<br />
development and river. Paired with Plot 46. Site 64.<br />
VEGETATION – Use scientific names <strong>of</strong> plants.<br />
Absolute Dominant Indicator<br />
Tree Stratum (Plot size: 30' r) % Cover Species Status<br />
1. Ulmus sp. 65% NL<br />
2.<br />
3.<br />
4.<br />
65% = Total Cover<br />
Sapling/Shrub Stratum (Plot size: 15' r)<br />
1.<br />
2.<br />
3.<br />
4.<br />
5.<br />
0% = Total Cover<br />
Herb Stratum (Plot size: 5' r)<br />
1. Bromus rigidus 70% NI<br />
2. Bromus tectorum 15% NI<br />
3.<br />
4.<br />
5.<br />
6.<br />
7.<br />
8.<br />
9.<br />
10.<br />
11.<br />
85% = Total Cover<br />
Woody Vine Stratum (Plot size: 30' r)<br />
1.<br />
2.<br />
0 = Total Cover<br />
% Bare Ground in Herb Stratum: 15%<br />
Remarks:<br />
Viewed from 10 th Street near bridge. Slope is well above the OHWL.<br />
Dominance Test worksheet:<br />
Number <strong>of</strong> Dominant Species<br />
That Are OBL, FACW, or FAC:<br />
Total Number <strong>of</strong> Dominant<br />
Species Across All Strata:<br />
Percent <strong>of</strong> Dominant Species<br />
That Are OBL, FACW, or FAC:<br />
0 (A)<br />
2 (B)<br />
0% (A/B)<br />
Prevalence Index worksheet:<br />
Total % Cover <strong>of</strong>:<br />
Multiply by:<br />
OBL species 0 x 1 = 0<br />
FACW species 0 x 2 = 0<br />
FAC species 0 x 3 = 0<br />
FACU species 0 x 4 = 0<br />
UPL species 65 x 5 = 325<br />
Column Totals 0 0<br />
Prevalence Index = B/A = 4.00<br />
Hydrophytic Vegetation Indicators:<br />
Dominance Test is >50%<br />
Prevalence Index is ≤3.0 1<br />
Morphological Adaptations 1 (Provide supporting<br />
data in Remarks or on a separate sheet)<br />
Wetland Non-Vascular Plants 1<br />
Problematic Hydrophytic Vegetation 1 (Explain)<br />
1 Indicators <strong>of</strong> hydric soil and wetland hydrology must<br />
be present, unless disturbed or problematic.<br />
Hydrophytic<br />
Vegetation<br />
Present Yes No<br />
US Army Corps <strong>of</strong> Engineers Arid West – Version 2.0
SOIL Sampling Point: 47<br />
Pr<strong>of</strong>ile Description: (Describe to the depth needed to document the indicator or confirm the absence <strong>of</strong> indicators.)<br />
Depth Matrix Redox Features<br />
(inches) Color (moist) % Color (moist) % Type 1 Loc 2 Texture Remarks<br />
1 Type: C=Concentration, D=Depletion, RM=Reduced Matrix, CS=Covered or Coated Sand Grains.<br />
2 Location: PL=Pore Lining, M=Matrix.<br />
Hydric Soil Indicators: (Applicable to all LRRs, unless otherwise noted.) Indicators for Problematic Hydric Soils 3 :<br />
Histosol (A1) Sandy Redox (S5) 1 cm Muck (A9) (LRR D)<br />
Histic Epipedon (A2) Stripped Matrix (S6) 2 cm Muck (A10)<br />
Black Histic (A3) Loamy Mucky Mineral (F1) (except MLRA 1) Reduced Vertic (F18)<br />
Hydrogen Sulfide (A4) Loamy Gleyed Matrix (F2) Red Parent Material (TF2)<br />
Stratified Layers (A5) (LRR C) Depleted Matrix (F3) Other (Explain in Remarks)<br />
1 cm Muck (A9) (LRR D) Redox Dark Surface (F6)<br />
Depleted Below Dark Surface (A11) Depleted Dark Surface (F7)<br />
Thick Dark Surface (A12)<br />
Redox Depressions (F8)<br />
3 Indicators <strong>of</strong> hydrophytic vegetation and<br />
Sandy Mucky Mineral (S1) Vernal Pools (F9) wetland hydrology must be present,<br />
Sandy Gleyed Matrix (S4)<br />
unless disturbed or problematic.<br />
Restrictive Layer (if present):<br />
Type: ---<br />
Depth (inches): --- Hydric Soil Present Yes No<br />
Remarks:<br />
OFFSITE - subsurface soil conditions not observed.<br />
HYDROLOGY<br />
Wetland Hydrology Indicators:<br />
Primary Indicators (minimum <strong>of</strong> one required; check all that apply)<br />
Secondary Indicators (2 or more required)<br />
Surface Water (A1) Salt Crust (B11) Water Marks (B1) (Riverine)<br />
Saturation (A3) Aquatic Invertebrates (B13) Sediment Deposits (B2) (Riverine)<br />
Water Marks (B1) (Nonriverine) Hydrogen Sulfide Odor (C1) Drift Deposits (B3) (Riverine)<br />
Sediment Deposits (B2) (Nonriverine) Oxidized Rhizospheres along Living Roots (C3) Drainage Patterns (B10)<br />
Drift Deposits (B3) (Nonriverine) Presence <strong>of</strong> Reduced Iron (C4) Dry-Season Water Table (C2)<br />
Surface Soil Cracks (B6) Recent Iron Reduction in Tilled Soils (C6) Crayfish Burrows (C8)<br />
Inundation Visible on Aerial Imagery (B7) Thin Muck Surface (C7) Saturation Visible on Aerial Imagery (C9)<br />
Water-Stained Leaves (B9) Other (Explain in Remarks) Shallow Aquitard (D3)<br />
FAC-Neutral Test (D5)<br />
Field Observations:<br />
Surface Water Present Yes No Depth (inches):not observed<br />
Water Table Present Yes No Depth (inches): N/A<br />
Saturation Present Yes No Depth (inches): N/A<br />
Wetland Hydrology Present Yes No<br />
(includes capillary fringe)<br />
Describe Recorded Data (stream gauge, monitoring well, aerial photos, previous inspections), if available:<br />
Remarks:<br />
Plot is well above hydrologic influence <strong>of</strong> river. No evidence <strong>of</strong> overland flow or seepage from the hillslope.<br />
US Army Corps <strong>of</strong> Engineers Arid West – Version 2.0
<strong>WETLAND</strong> <strong>DETERMINATION</strong> <strong>DATA</strong> <strong>FORM</strong> – Arid West Region<br />
Project/Site: <strong>Pendleton</strong> <strong>City</strong>/County: Umatilla Sampling Date: 5/19/2011<br />
Applicant/Owner: <strong>City</strong> <strong>of</strong> <strong>Pendleton</strong> State: OR Sampling Point: 48<br />
Investigator(s): LW/ACS Section, Township, Range:<br />
Landform (hillslope, terrace, etc.): depression Local relief (concave, convex, none) concave Slope (%) flat<br />
Subregion (LRR): Arid Lands Lat: Long: Datum:<br />
Soil Map Unit Name:<br />
NWI Classification:<br />
Are climatic/hydrologic site conditions typical for this time <strong>of</strong> year Yes No (If no, explain in Remarks.)<br />
Are Vegetation Soil or Hydrology significantly disturbed Are “Normal Circumstances” present Yes No<br />
Are Vegetation Soil or Hydrology naturally problematic (If needed, explain any answers in Remarks”)<br />
SUMMARY OF FINDINGS – Attach site map showing sampling point locations, transects, important features, etc.<br />
Hydrophytic Vegetation Present Yes No<br />
Hydric Soil Present Yes No<br />
Wetland Hydrology Present Yes No<br />
Is the Sampled Area<br />
within a Wetland Yes No<br />
Remarks: OFFSITE - Viewed area from I-84. Depression that receives flow from two unnamed streams entering from the north. Hemi marsh with good<br />
interspersion <strong>of</strong> PEM and open water. Typcial <strong>of</strong> areas 44, 45, 46, 71, 142, 152. Paired with Plot 49. UR-1.<br />
VEGETATION – Use scientific names <strong>of</strong> plants.<br />
Absolute Dominant Indicator<br />
Tree Stratum (Plot size: 30' r) % Cover Species Status<br />
1. Populus balsamifera v. trichocarpa 5% FAC<br />
2.<br />
3.<br />
4.<br />
5% = Total Cover<br />
Sapling/Shrub Stratum (Plot size: 5' r)<br />
1. Salix geyeriana 10% FACW+<br />
2.<br />
3.<br />
4.<br />
5.<br />
10% = Total Cover<br />
Herb Stratum (Plot size: 5' r)<br />
1. Phalaris arundinacea 20% FACW<br />
2. Typha latifolia 25% OBL<br />
3.<br />
4.<br />
5.<br />
6.<br />
7.<br />
8.<br />
9.<br />
10.<br />
11.<br />
45% = Total Cover<br />
Woody Vine Stratum (Plot size: 30' r)<br />
1.<br />
2.<br />
0 = Total Cover<br />
% Bare Ground in Herb Stratum: 0%<br />
Remarks:<br />
Elaeagnus angustifolia and Ulmus sp. also present around marsh.<br />
Dominance Test worksheet:<br />
Number <strong>of</strong> Dominant Species<br />
That Are OBL, FACW, or FAC:<br />
Total Number <strong>of</strong> Dominant<br />
Species Across All Strata:<br />
Percent <strong>of</strong> Dominant Species<br />
That Are OBL, FACW, or FAC:<br />
4 (A)<br />
4 (B)<br />
100% (A/B)<br />
Prevalence Index worksheet:<br />
Total % Cover <strong>of</strong>:<br />
Multiply by:<br />
OBL species x 1 =<br />
FACW species x 2 =<br />
FAC species x 3 =<br />
FACU species x 4 =<br />
UPL species x 5 =<br />
Column Totals<br />
Prevalence Index = B/A =<br />
Hydrophytic Vegetation Indicators:<br />
Dominance Test is >50%<br />
Prevalence Index is ≤3.0 1<br />
Morphological Adaptations 1 (Provide supporting<br />
data in Remarks or on a separate sheet)<br />
Wetland Non-Vascular Plants 1<br />
Problematic Hydrophytic Vegetation 1 (Explain)<br />
1 Indicators <strong>of</strong> hydric soil and wetland hydrology must<br />
be present, unless disturbed or problematic.<br />
Hydrophytic<br />
Vegetation<br />
Present Yes No<br />
US Army Corps <strong>of</strong> Engineers Arid West – Version 2.0
SOIL Sampling Point: 48<br />
Pr<strong>of</strong>ile Description: (Describe to the depth needed to document the indicator or confirm the absence <strong>of</strong> indicators.)<br />
Depth Matrix Redox Features<br />
(inches) Color (moist) % Color (moist) % Type 1 Loc 2 Texture Remarks<br />
1 Type: C=Concentration, D=Depletion, RM=Reduced Matrix, CS=Covered or Coated Sand Grains.<br />
2 Location: PL=Pore Lining, M=Matrix.<br />
Hydric Soil Indicators: (Applicable to all LRRs, unless otherwise noted.) Indicators for Problematic Hydric Soils 3 :<br />
Histosol (A1) Sandy Redox (S5) 1 cm Muck (A9) (LRR D)<br />
Histic Epipedon (A2) Stripped Matrix (S6) 2 cm Muck (A10)<br />
Black Histic (A3) Loamy Mucky Mineral (F1) (except MLRA 1) Reduced Vertic (F18)<br />
Hydrogen Sulfide (A4) Loamy Gleyed Matrix (F2) Red Parent Material (TF2)<br />
Stratified Layers (A5) (LRR C) Depleted Matrix (F3) Other (Explain in Remarks)<br />
1 cm Muck (A9) (LRR D) Redox Dark Surface (F6)<br />
Depleted Below Dark Surface (A11) Depleted Dark Surface (F7)<br />
Thick Dark Surface (A12)<br />
Redox Depressions (F8)<br />
3 Indicators <strong>of</strong> hydrophytic vegetation and<br />
Sandy Mucky Mineral (S1) Vernal Pools (F9) wetland hydrology must be present,<br />
Sandy Gleyed Matrix (S4)<br />
unless disturbed or problematic.<br />
Restrictive Layer (if present):<br />
Type: ---<br />
Depth (inches): --- Hydric Soil Present Yes No<br />
Remarks:<br />
OFFSITE - subsurface soil conditions not observed.<br />
HYDROLOGY<br />
Wetland Hydrology Indicators:<br />
Primary Indicators (minimum <strong>of</strong> one required; check all that apply)<br />
Secondary Indicators (2 or more required)<br />
Surface Water (A1) Salt Crust (B11) Water Marks (B1) (Riverine)<br />
Saturation (A3) Aquatic Invertebrates (B13) Sediment Deposits (B2) (Riverine)<br />
Water Marks (B1) (Nonriverine) Hydrogen Sulfide Odor (C1) Drift Deposits (B3) (Riverine)<br />
Sediment Deposits (B2) (Nonriverine) Oxidized Rhizospheres along Living Roots (C3) Drainage Patterns (B10)<br />
Drift Deposits (B3) (Nonriverine) Presence <strong>of</strong> Reduced Iron (C4) Dry-Season Water Table (C2)<br />
Surface Soil Cracks (B6) Recent Iron Reduction in Tilled Soils (C6) Crayfish Burrows (C8)<br />
Inundation Visible on Aerial Imagery (B7) Thin Muck Surface (C7) Saturation Visible on Aerial Imagery (C9)<br />
Water-Stained Leaves (B9) Other (Explain in Remarks) Shallow Aquitard (D3)<br />
FAC-Neutral Test (D5)<br />
Field Observations:<br />
Surface Water Present Yes No Depth (inches):not measured<br />
Water Table Present Yes No Depth (inches): N/A<br />
Saturation Present Yes No Depth (inches): N/A<br />
Wetland Hydrology Present Yes No<br />
(includes capillary fringe)<br />
Describe Recorded Data (stream gauge, monitoring well, aerial photos, previous inspections), if available:<br />
Remarks:<br />
This is a large wetland complex fed by two intermittent streams. Unclear whether backflow from the Umatilla River also contributes hydrologic<br />
support.<br />
US Army Corps <strong>of</strong> Engineers Arid West – Version 2.0
<strong>WETLAND</strong> <strong>DETERMINATION</strong> <strong>DATA</strong> <strong>FORM</strong> – Arid West Region<br />
Project/Site: <strong>Pendleton</strong> <strong>City</strong>/County: Umatilla Sampling Date: 5/19/2011<br />
Applicant/Owner: <strong>City</strong> <strong>of</strong> <strong>Pendleton</strong> State: OR Sampling Point: 49<br />
Investigator(s): LW/ACS Section, Township, Range:<br />
Landform (hillslope, terrace, etc.): depression Local relief (concave, convex, none) concave Slope (%) flat<br />
Subregion (LRR): Arid Lands Lat: Long: Datum:<br />
Soil Map Unit Name: 28A: Freewater gravelly silt loam, 0-3% NWI Classification:<br />
Are climatic/hydrologic site conditions typical for this time <strong>of</strong> year Yes No (If no, explain in Remarks.)<br />
Are Vegetation Soil or Hydrology significantly disturbed Are “Normal Circumstances” present Yes No<br />
Are Vegetation Soil or Hydrology naturally problematic (If needed, explain any answers in Remarks”)<br />
SUMMARY OF FINDINGS – Attach site map showing sampling point locations, transects, important features, etc.<br />
Hydrophytic Vegetation Present Yes No<br />
Hydric Soil Present Yes No<br />
Wetland Hydrology Present Yes No<br />
Remarks: OFFSITE - Viewed area from I-84. Uplands adjacent to UR-1.<br />
Is the Sampled Area<br />
within a Wetland Yes No<br />
VEGETATION – Use scientific names <strong>of</strong> plants.<br />
Absolute Dominant Indicator<br />
Tree Stratum (Plot size: 30' r) % Cover Species Status<br />
1.<br />
2.<br />
3.<br />
4.<br />
0% = Total Cover<br />
Sapling/Shrub Stratum (Plot size: 5' r)<br />
1.<br />
2.<br />
3.<br />
4.<br />
5.<br />
0% = Total Cover<br />
Herb Stratum (Plot size: 5' r)<br />
1. Bromus rigidus 50 NI<br />
2. Bromus tectorum 50 NI<br />
3.<br />
4.<br />
5.<br />
6.<br />
7.<br />
8.<br />
9.<br />
10.<br />
11.<br />
100% = Total Cover<br />
Woody Vine Stratum (Plot size: 30' r)<br />
1.<br />
2.<br />
0 = Total Cover<br />
% Bare Ground in Herb Stratum: 0%<br />
Remarks:<br />
Difficult to determine species and coverages from freeway. The two Bromus were dominant.<br />
Dominance Test worksheet:<br />
Number <strong>of</strong> Dominant Species<br />
That Are OBL, FACW, or FAC:<br />
Total Number <strong>of</strong> Dominant<br />
Species Across All Strata:<br />
Percent <strong>of</strong> Dominant Species<br />
That Are OBL, FACW, or FAC:<br />
0 (A)<br />
2 (B)<br />
0% (A/B)<br />
Prevalence Index worksheet:<br />
Total % Cover <strong>of</strong>:<br />
Multiply by:<br />
OBL species 0 x 1 = 0<br />
FACW species 0 x 2 = 0<br />
FAC species 0 x 3 = 0<br />
FACU species 0 x 4 = 0<br />
UPL species 100 x 5 = 500<br />
Column Totals 100 500<br />
Prevalence Index = B/A = 5.00<br />
Hydrophytic Vegetation Indicators:<br />
Dominance Test is >50%<br />
Prevalence Index is ≤3.0 1<br />
Morphological Adaptations 1 (Provide supporting<br />
data in Remarks or on a separate sheet)<br />
Wetland Non-Vascular Plants 1<br />
Problematic Hydrophytic Vegetation 1 (Explain)<br />
1 Indicators <strong>of</strong> hydric soil and wetland hydrology must<br />
be present, unless disturbed or problematic.<br />
Hydrophytic<br />
Vegetation<br />
Present Yes No<br />
US Army Corps <strong>of</strong> Engineers Arid West – Version 2.0
SOIL Sampling Point: 49<br />
Pr<strong>of</strong>ile Description: (Describe to the depth needed to document the indicator or confirm the absence <strong>of</strong> indicators.)<br />
Depth Matrix Redox Features<br />
(inches) Color (moist) % Color (moist) % Type 1 Loc 2 Texture Remarks<br />
1 Type: C=Concentration, D=Depletion, RM=Reduced Matrix, CS=Covered or Coated Sand Grains.<br />
2 Location: PL=Pore Lining, M=Matrix.<br />
Hydric Soil Indicators: (Applicable to all LRRs, unless otherwise noted.) Indicators for Problematic Hydric Soils 3 :<br />
Histosol (A1) Sandy Redox (S5) 1 cm Muck (A9) (LRR D)<br />
Histic Epipedon (A2) Stripped Matrix (S6) 2 cm Muck (A10)<br />
Black Histic (A3) Loamy Mucky Mineral (F1) (except MLRA 1) Reduced Vertic (F18)<br />
Hydrogen Sulfide (A4) Loamy Gleyed Matrix (F2) Red Parent Material (TF2)<br />
Stratified Layers (A5) (LRR C) Depleted Matrix (F3) Other (Explain in Remarks)<br />
1 cm Muck (A9) (LRR D) Redox Dark Surface (F6)<br />
Depleted Below Dark Surface (A11) Depleted Dark Surface (F7)<br />
Thick Dark Surface (A12)<br />
Redox Depressions (F8)<br />
3 Indicators <strong>of</strong> hydrophytic vegetation and<br />
Sandy Mucky Mineral (S1) Vernal Pools (F9) wetland hydrology must be present,<br />
Sandy Gleyed Matrix (S4)<br />
unless disturbed or problematic.<br />
Restrictive Layer (if present):<br />
Type: ---<br />
Depth (inches): --- Hydric Soil Present Yes No<br />
Remarks:<br />
OFFSITE - subsurface soil conditions not observed.<br />
HYDROLOGY<br />
Wetland Hydrology Indicators:<br />
Primary Indicators (minimum <strong>of</strong> one required; check all that apply)<br />
Secondary Indicators (2 or more required)<br />
Surface Water (A1) Salt Crust (B11) Water Marks (B1) (Riverine)<br />
Saturation (A3) Aquatic Invertebrates (B13) Sediment Deposits (B2) (Riverine)<br />
Water Marks (B1) (Nonriverine) Hydrogen Sulfide Odor (C1) Drift Deposits (B3) (Riverine)<br />
Sediment Deposits (B2) (Nonriverine) Oxidized Rhizospheres along Living Roots (C3) Drainage Patterns (B10)<br />
Drift Deposits (B3) (Nonriverine) Presence <strong>of</strong> Reduced Iron (C4) Dry-Season Water Table (C2)<br />
Surface Soil Cracks (B6) Recent Iron Reduction in Tilled Soils (C6) Crayfish Burrows (C8)<br />
Inundation Visible on Aerial Imagery (B7) Thin Muck Surface (C7) Saturation Visible on Aerial Imagery (C9)<br />
Water-Stained Leaves (B9) Other (Explain in Remarks) Shallow Aquitard (D3)<br />
FAC-Neutral Test (D5)<br />
Field Observations:<br />
Surface Water Present Yes No Depth (inches):not observed<br />
Water Table Present Yes No Depth (inches): N/A<br />
Saturation Present Yes No Depth (inches): N/A<br />
Wetland Hydrology Present Yes No<br />
(includes capillary fringe)<br />
Describe Recorded Data (stream gauge, monitoring well, aerial photos, previous inspections), if available:<br />
Remarks:<br />
Based on changes in vegetation and topography, the area dominated by Bromus is unlikely to experience prolonged saturation in the upper part <strong>of</strong><br />
the soil pr<strong>of</strong>ile during the growing season.<br />
US Army Corps <strong>of</strong> Engineers Arid West – Version 2.0