The HITRAN 2004 molecular spectroscopic database - Harvard ...
The HITRAN 2004 molecular spectroscopic database - Harvard ...
The HITRAN 2004 molecular spectroscopic database - Harvard ...

You also want an ePaper? Increase the reach of your titles
YUMPU automatically turns print PDFs into web optimized ePapers that Google loves.
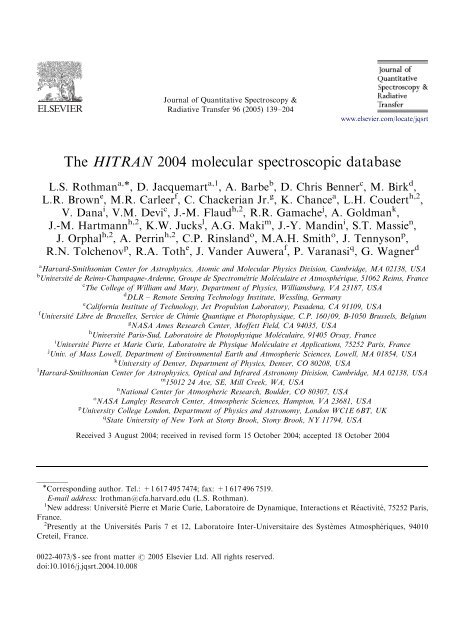
ARTICLE IN PRESS<br />
Journal of Quantitative Spectroscopy &<br />
Radiative Transfer 96 (2005) 139–204<br />
www.elsevier.com/locate/jqsrt<br />
<strong>The</strong> <strong>HITRAN</strong> <strong>2004</strong> <strong>molecular</strong> <strong>spectroscopic</strong> <strong>database</strong><br />
L.S. Rothman a, , D. Jacquemart a,1 , A. Barbe b , D. Chris Benner c , M. Birk d ,<br />
L.R. Brown e , M.R. Carleer f , C. Chackerian Jr. g , K. Chance a , L.H. Coudert h,2 ,<br />
V. Dana i , V.M. Devi c , J.-M. Flaud h,2 , R.R. Gamache j , A. Goldman k ,<br />
J.-M. Hartmann h,2 , K.W. Jucks l , A.G. Maki m , J.-Y. Mandin i , S.T. Massie n ,<br />
J. Orphal h,2 , A. Perrin h,2 , C.P. Rinsland o , M.A.H. Smith o , J. Tennyson p ,<br />
R.N. Tolchenov p , R.A. Toth e , J. Vander Auwera f , P. Varanasi q , G. Wagner d<br />
a <strong>Harvard</strong>-Smithsonian Center for Astrophysics, Atomic and Molecular Physics Division, Cambridge, MA 02138, USA<br />
b Université de Reims-Champagne-Ardenne, Groupe de Spectrométrie Moléculaire et Atmosphérique, 51062 Reims, France<br />
c <strong>The</strong> College of William and Mary, Department of Physics, Williamsburg, VA 23187, USA<br />
d DLR – Remote Sensing Technology Institute, Wessling, Germany<br />
e California Institute of Technology, Jet Propulsion Laboratory, Pasadena, CA 91109, USA<br />
f Université Libre de Bruxelles, Service de Chimie Quantique et Photophysique, C.P. 160/09, B-1050 Brussels, Belgium<br />
g NASA Ames Research Center, Moffett Field, CA 94035, USA<br />
h Université Paris-Sud, Laboratoire de Photophysique Moléculaire, 91405 Orsay, France<br />
i Université Pierre et Marie Curie, Laboratoire de Physique Moléculaire et Applications, 75252 Paris, France<br />
j Univ. of Mass Lowell, Department of Environmental Earth and Atmospheric Sciences, Lowell, MA 01854, USA<br />
k University of Denver, Department of Physics, Denver, CO 80208, USA<br />
l <strong>Harvard</strong>-Smithsonian Center for Astrophysics, Optical and Infrared Astronomy Division, Cambridge, MA 02138, USA<br />
m 15012 24 Ave, SE, Mill Creek, WA, USA<br />
n National Center for Atmospheric Research, Boulder, CO 80307, USA<br />
o NASA Langley Research Center, Atmospheric Sciences, Hampton, VA 23681, USA<br />
p University College London, Department of Physics and Astronomy, London WC1E 6BT, UK<br />
q State University of New York at Stony Brook, Stony Brook, NY 11794, USA<br />
Received 3 August <strong>2004</strong>; received in revised form 15 October <strong>2004</strong>; accepted 18 October <strong>2004</strong><br />
Corresponding author. Tel.: +1 617 495 7474; fax: +1 617 496 7519.<br />
E-mail address: lrothman@cfa.harvard.edu (L.S. Rothman).<br />
1 New address: Universite´ Pierre et Marie Curie, Laboratoire de Dynamique, Interactions et Re´ activite´ , 75252 Paris,<br />
France.<br />
2 Presently at the Universite´ s Paris 7 et 12, Laboratoire Inter-Universitaire des Syste` mes Atmosphe´ riques, 94010<br />
Creteil, France.<br />
0022-4073/$ - see front matter r 2005 Elsevier Ltd. All rights reserved.<br />
doi:10.1016/j.jqsrt.<strong>2004</strong>.10.008
ARTICLE IN PRESS<br />
140<br />
L.S. Rothman et al. / Journal of Quantitative Spectroscopy & Radiative Transfer 96 (2005) 139–204<br />
Abstract<br />
This paper describes the status of the <strong>2004</strong> edition of the <strong>HITRAN</strong> <strong>molecular</strong> <strong>spectroscopic</strong> <strong>database</strong>.<br />
<strong>The</strong> <strong>HITRAN</strong> compilation consists of several components that serve as input for radiative transfer<br />
calculation codes: individual line parameters for the microwave through visible spectra of molecules in the<br />
gas phase; absorption cross-sections for molecules having dense spectral features, i.e., spectra in which the<br />
individual lines are unresolvable; individual line parameters and absorption cross-sections for bands in the<br />
ultra-violet; refractive indices of aerosols; tables and files of general properties associated with the <strong>database</strong>;<br />
and <strong>database</strong> management software. <strong>The</strong> line-by-line portion of the <strong>database</strong> contains <strong>spectroscopic</strong><br />
parameters for 39 molecules including many of their isotopologues.<br />
<strong>The</strong> format of the section of the <strong>database</strong> on individual line parameters of <strong>HITRAN</strong> has undergone the<br />
most extensive enhancement in almost two decades. It now lists the Einstein A-coefficients, statistical<br />
weights of the upper and lower levels of the transitions, a better system for the representation of quantum<br />
identifications, and enhanced referencing and uncertainty codes. In addition, there is a provision for<br />
making corrections to the broadening of line transitions due to line mixing.<br />
r 2005 Elsevier Ltd. All rights reserved.<br />
Keywords: <strong>HITRAN</strong>; Spectroscopic <strong>database</strong>; Molecular spectroscopy; Molecular absorption; Line parameters;<br />
Absorption cross-sections; Aerosols<br />
1. Introduction<br />
This article describes the data and software that have been added, modified, or enhanced in the<br />
<strong>HITRAN</strong> (high resolution transmission) compilation since the previous update of 2001 [1]. An<br />
archival compilation was made available in the summer of <strong>2004</strong> after the 8th biennial <strong>HITRAN</strong><br />
Database conference that took place at the <strong>Harvard</strong>-Smithsonian Center for Astrophysics,<br />
Cambridge MA, 16–18 June <strong>2004</strong>. <strong>The</strong> compilation brings together the <strong>HITRAN</strong> line-transition<br />
parameters, infrared cross-sections, UV line-by-line parameters and cross-sections, aerosol<br />
refractive indices, and documentation. <strong>The</strong> new file structure for the compilation is shown in<br />
Fig. 1. This compilation, called HAWKS (<strong>HITRAN</strong> atmospheric workstation), is available on an<br />
anonymous ftp-site. Instructions for accessing the <strong>database</strong> can be found in the <strong>HITRAN</strong> web-site<br />
JavaHawks Software installer and Documentation<br />
<strong>HITRAN</strong><br />
(Line-transition<br />
Parameters)<br />
IR<br />
Cross-<br />
Sections<br />
UV<br />
Aerosol<br />
Refractive<br />
Indices<br />
Global Data<br />
Files, Tables<br />
and<br />
References<br />
Line-<br />
Coupling<br />
Molecule-<br />
by-<br />
Molecule<br />
Supplemental<br />
Line-<br />
By-Line<br />
Cross-<br />
Sections<br />
CO 2<br />
Supplemental<br />
Alternate<br />
Fig. 1. File structure of the <strong>HITRAN</strong> ftp-site (ftp://cfa-ftp.harvard.edu/pub/hitran04).
ARTICLE IN PRESS<br />
L.S. Rothman et al. / Journal of Quantitative Spectroscopy & Radiative Transfer 96 (2005) 139–204 141<br />
(http://cfa-www.harvard.edu/<strong>HITRAN</strong>). As in previous editions, there is software included called<br />
JavaHAWKS which provides a functional and flexible set of functions for managing the <strong>database</strong>.<br />
This software can be installed on a wide set of platforms, running for example Windows, UNIX,<br />
Solaris, LINUX, and Mac OS.<br />
<strong>The</strong> <strong>HITRAN</strong> <strong>database</strong> is the recognized international standard, used for a vast array of<br />
applications including terrestrial atmospheric remote sensing, transmission simulations, fundamental<br />
laboratory spectroscopy studies, industrial process monitoring, and pollution regulatory<br />
studies. An international <strong>HITRAN</strong> advisory committee, composed of a dozen experts in the field<br />
of spectroscopy, has been established under the auspices of NASA. This committee reviews and<br />
evaluates new data and makes recommendations for updates and replacements in the compilation.<br />
<strong>The</strong> most significant of the improvements featured in this newly updated edition of <strong>HITRAN</strong><br />
relates to the line-by-line parameters. In Section 2 of this paper, the new <strong>HITRAN</strong> format for the lineby-line<br />
parameters is presented. Section 3 deals with the notable improvements that have been made<br />
in the line-by-line portion of the present (<strong>2004</strong>) compilation. <strong>The</strong> status of the infrared cross-sections,<br />
sets of ultraviolet data, and the aerosol refractive indices of aerosols, is discussed in Sections 4–6.<br />
2. <strong>The</strong> <strong>2004</strong> <strong>HITRAN</strong> format<br />
<strong>The</strong> format of the parameters for each spectral line (equivalent to a record in the <strong>database</strong>) is<br />
given in Table 1. <strong>The</strong> total length of the record is now 160 characters, an increase from the 100<br />
bytes that had been adopted since the edition of 1986 [2] until the edition of 2000 including<br />
updates of 2001 [1]. <strong>The</strong> parameters presented in Table 1 are described in Table 2. Nine fields have<br />
been added in this 160-byte format: three extra uncertainty indices for line-shape parameters and<br />
three corresponding reference pointers, a flag for line coupling, which is also known as ‘‘line<br />
mixing,’’ and the statistical weights of the upper and lower levels of each of the transitions.<br />
<strong>The</strong> flag used for line coupling is identified in the <strong>database</strong> by an asterisk (*). Its appearance in the<br />
corresponding field of a transition is an alert that information on line coupling is available in the<br />
<strong>HITRAN</strong> ftp-site (ftp://cfa-ftp.harvard.edu/pub/hitran04). <strong>The</strong> current <strong>HITRAN</strong> ftp-site contains<br />
several directories (folders) which are illustrated in Fig. 1. One of these directories is called ‘‘linecoupling.’’<br />
It contains subdirectories in the cases of those molecules for which line-coupling data are<br />
available. <strong>The</strong>se data appear in several files: a ‘‘readme’’ file, programs and input files that introduce<br />
line coupling into the usual line-profile model using the Voigt profile. In this edition of <strong>HITRAN</strong>,CO 2<br />
is the only molecule for which line-coupling data have been introduced (see Section 3.2 for details). In<br />
the future, line-coupling data will be considered for other molecules, especially CH 4 ,N 2 O, and O 2 .<br />
In the format that has been adopted in the present edition, the weighted square of the transition<br />
moment has been replaced by the Einstein A-coefficient. <strong>The</strong>re are several reasons for the<br />
implementation of this change [3]. <strong>The</strong> most crucial of these is prompted by the facts that: (a) the<br />
Einstein A-coefficients are more desirable for applications in the studies of non-local<br />
thermodynamic equilibrium (non-LTE) in the atmosphere, astrophysics, and fundamental<br />
physics, and (b) some inconsistencies in the definitions adopted for the transition moment were<br />
indeed the sources of inaccuracies in the previous editions of <strong>HITRAN</strong>. A complete and detailed<br />
paper [3] dealing with the calculation of the A-coefficients and statistical weights of the energy<br />
levels of the upper and lower states in the present edition of the <strong>database</strong> appears in Ref. [3].
142<br />
Table 1<br />
Record formats for line-by-line parameters and cross-section data in <strong>HITRAN</strong><br />
Format for <strong>HITRAN</strong> Parameters in the line-by-line section, Editions 1986 through 2001 (100-character record)<br />
Parameter M I v S R g air g self E 00 n air d air V 0 V 00 Q 0 Q 00 Ierr Iref<br />
Field Length 2 1 12 10 10 5 5 10 4 8 3 3 9 9 3 6<br />
FORTRAN Descriptor I2 I1 F12.6 E10.3 E10.3 F5.4 F5.4 F10.4 F4.2 F8.6 I3 I3 A9 A9 3I1 3I2<br />
Format for <strong>HITRAN</strong> Parameters in the line-by-line section, <strong>2004</strong> Edition (160-character record)<br />
Parameter M I v S A g air g self E 00 n air d air V 0 V 00 Q 0 Q 00 Ierr Iref * (flag) g 0 g 00<br />
Field Length 2 1 12 10 10 5 5 10 4 8 15 15 15 15 6 12 1 7 7<br />
FORTRAN Descriptor I2 I1 F12.6 E10.3 E10.3 F5.4 F5.4 F10.4 F4.2 F8.6 A15 A15 A15 A15 6I1 6I2 A1 F7.1 F7.1<br />
Format for cross-section headers<br />
Quantity Chemical Wavenumber ðcm 1 Þ Number of Temperature Pressure Maximum Resolution Common Not Broadener Reference<br />
symbol Minimum Maximum points (K) (torr) X-section name used number<br />
Field length 20 10 10 7 7 6 10 5 15 4 3 3<br />
FORTRAN Descriptor A20 F10.3 F10.3 I7 F7.1 F6.1 E10.3 A5 A15 4X A3 I3<br />
Notes: <strong>The</strong> quantities of the <strong>HITRAN</strong> line-by-line section in these 100- and 160-character records are defined in Table 2.<br />
<strong>The</strong> format of the cross-section files did not change from the <strong>HITRAN</strong> 2000 edition to the <strong>2004</strong> edition. <strong>The</strong> pressure stated in the cross-section<br />
header is in torr (760 torr ¼ 1 atm ¼ 1013:25 hPa). <strong>The</strong> field for resolution is normally given in cm 1 since the majority of cross-section measurements<br />
were taken with Fourier transform spectrometers. In the case of measurements taken with grating spectrometers, the resolution field is given in milli-<br />
Angtroms and is listed as xxxmA where ‘‘xxx’’ is a number.<br />
L.S. Rothman et al. / Journal of Quantitative Spectroscopy & Radiative Transfer 96 (2005) 139–204<br />
ARTICLE IN PRESS
Table 2<br />
Description of the quantities present in the 100- and 160-character records of the <strong>HITRAN</strong> line-by-line section<br />
Parameter Meaning Field length of the Type Comments or units<br />
(100/160) character records<br />
M Molecule number 2/2 Integer <strong>HITRAN</strong> chronological assignment<br />
I Isotopologue number 1/1 Integer Ordering within a molecule by terrestrial abundance<br />
v Vacuum wavenumber 12/12 Real cm 1<br />
S Intensity 10/10 Real cm 1 =ðmolecule cm 2 Þ at standard 296 K<br />
R Weighted square of the transition moment 10/0 Real Debye 2 (for an electric dipole transition)<br />
A Einstein A-coefficient 0/10 Real s 1<br />
g air Air-broadened half-width 5/5 Real HWHM at 296 K (in cm 1 atm 1 )<br />
g self Self-broadened half-width 5/5 Real HWHM at 296 K (in cm 1 atm 1 )<br />
E 00 Lower-state energy 10/10 Real cm 1<br />
n air Temperature-dependence exponent for g air 4/4 Real unitless, with g air ðTÞ ¼g air ðT 0 ÞðT 0 =TÞ n air<br />
d air Air pressure-induced line shift 8/8 Real cm 1 atm 1 at 296 K<br />
V 0 Upper-state ‘‘global’’ quanta 3/15 Hollerith see Table 3<br />
V 00 Lower-state ‘‘global’’ quanta 3/15 Hollerith see Table 3<br />
Q 0 Upper-state ‘‘local’’ quanta 9/15 Hollerith see Table 4<br />
Q 00 Lower-state ‘‘local’’ quanta 9/15 Hollerith see Table 4<br />
Ierr Uncertainty indices 3/6 Integer Accuracy for 3/6 critical parameters<br />
ðv; S; g air =v; S; g air ; g self ; n air ; d air Þ, see Table 5<br />
Iref Reference indices 6/12 Integer References for 3/6 critical parameters<br />
ðv; S; g air =v; S; g air ; g self ; n air ; d air Þ<br />
* Flag 0/1 Character Availability of program and data for the case of line mixing<br />
g 0 Statistical weight of the upper state 0/7 Real See details in Ref. [3]<br />
g 00 Statistical weight of the lower state 0/7 Real See details in Ref. [3]<br />
Notes: For the field-length column, the notation A/B corresponds to the number of characters respectively in the 100- and 160-character records. For<br />
example, concerning the weighted square of the transition moment, the number of characters for R is 10 in the case of the <strong>HITRAN</strong> 2000 edition [1],<br />
and 0 in the case of the <strong>HITRAN</strong> <strong>2004</strong> edition since this parameter has been replaced by the Einstein A-coefficient.<br />
L.S. Rothman et al. / Journal of Quantitative Spectroscopy & Radiative Transfer 96 (2005) 139–204 143<br />
ARTICLE IN PRESS
ARTICLE IN PRESS<br />
144<br />
L.S. Rothman et al. / Journal of Quantitative Spectroscopy & Radiative Transfer 96 (2005) 139–204<br />
Major effort has gone into making the identifications of quantum numbers of energy levels or<br />
states more readily evident in the present edition of the <strong>database</strong>. Instead of the codes that were<br />
adopted for the vibrational levels, and in certain cases for electronic levels, in the previous edition<br />
[1], explicit identification of quanta (the so-called global quanta) has been used in the present<br />
edition. <strong>The</strong> field lengths of the global and local quantum identifications have been increased from<br />
9 to 15 characters so that a more consistent and encompassing notation for the assignments could<br />
be established. In the current edition, a substantial effort has been made to describe and<br />
systematize the format of the <strong>database</strong> identifying the vibrational and rotational quantum<br />
numbers of each molecule in its ‘‘line-by-line’’ section. <strong>The</strong> global and local identification of the<br />
quantum numbers and of their FORTRAN descriptors are summarized, respectively, in Tables 3<br />
and 4. As regards the identification of the quantum numbers used for global identification, the<br />
modifications made to the previous notation [1] are as follows. In the case of C 2 H 2 , the total<br />
symmetry þ or of the level has been added in order to specify a precise assignment of the lower<br />
vibrational state. In the case of CH 4 , in class 10, the notation in Table 3 can now describe each<br />
vibrational level of methane [13]. For the identification of the ‘‘local quanta,’’ the number of<br />
different classes has been decreased to 6 groups in this edition from 11 sub-groups in the previous<br />
edition [1], thus creating a more compact format. <strong>The</strong> format of the rotational quantum numbers<br />
J, K, K a , K c has been increased from two digits to three digits (allowing for the possibility in<br />
the future of values greater than 99 for heavy species). <strong>The</strong> format of the hyperfine quantum<br />
number F has been increased from two digits (I2) or four digits (F4.1) to five digits (denoted as<br />
A5 in Table 4 in order to incorporate the two cases of integer (I5) or half-integer (F5.1) numbers).<br />
Moreover, an important effort has been made in order to standardize the local quanta<br />
identification for each molecule. Such is the case, for example, of NO 2 for which the conventions<br />
for the J-coding and the F-coding in <strong>HITRAN</strong> had been different depending on the<br />
spectral region (see Table 2 of Ref. [14]). We now have the same convention (see notes of<br />
Table 4) for the different spectral regions. This convention has also been adopted for HO 2<br />
(see notes of Table 4).<br />
<strong>The</strong> definitions of the uncertainty indices used in <strong>HITRAN</strong> have not changed from previous<br />
editions and are defined in Table 5. However, uncertainty and reference indices are now also given<br />
for the self-broadened half-width, the exponent depicting the temperature-dependence of the airbroadened<br />
half-width, and the air pressure-induced line shift in addition to line position, line<br />
intensity, and air-broadened half-width. It should be remarked that the code 0 in Table 5 might<br />
lend itself to two different meanings in the case of line position or air pressure-induced shift. It<br />
means that either the uncertainty in the shift reported is greater than 1 cm 1 or was not reported.<br />
<strong>The</strong> word ‘‘default’’ or ‘‘constant’’ (code 1 in Table 5) means a constant value, and the word<br />
‘‘average’’ or ‘‘estimate’’ (code 2 in Table 5) means an average or empirical value.<br />
Table 6 is a summary of the molecules in <strong>HITRAN</strong>, giving the isotopologues or isotopomers 3<br />
(a total of 93 variants), their fractional abundance, spectral coverage, and number of lines.<br />
3 An isotopologue is a <strong>molecular</strong> twin, as it were, that differs from the original molecule in the isotopic composition<br />
(number of isotopic substitutions) only; for example, 13 CH 4 and 12 CH 3 D are isotopologues of 12 CH 4 . An isotopomer (a<br />
contraction of ‘isotopic isomer’), on the other hand, has the same number of each of the isotopic atoms but differing in<br />
their orientation within the <strong>molecular</strong> structure (giving rise to different spectra), for example 16 O 18 O 16 O is an<br />
isotopomer of 16 O 16 O 18 O and so is 14 N 15 NO of 15 N 14 NO.
ARTICLE IN PRESS<br />
L.S. Rothman et al. / Journal of Quantitative Spectroscopy & Radiative Transfer 96 (2005) 139–204 145<br />
Table 3<br />
Notation and format for the ten classes of global quanta identification in the <strong>HITRAN</strong> <strong>2004</strong> edition<br />
Notes: Defined in an earlier <strong>HITRAN</strong> edition [2], the global quanta were represented by an index (format I3) which was<br />
a code corresponding to the vibrational quantum numbers. In the <strong>HITRAN</strong> <strong>2004</strong> edition, the vibrational quantum<br />
numbers are directly incorporated as a 15-character field. v j is the quantum number associated with the normal mode of<br />
vibration j, l j is the vibrational angular momentum quantum number associated with the degenerate bending mode j,<br />
and l is defined as the absolute value of the sum of the vibrational angular momentum quantum number l j . For classes 2<br />
and 3, X designates the electronic state of the molecule, and for class 3, i corresponds to either 1 or 3 , which means<br />
2 2<br />
N ¼ J 1 depending on the molecules, see Ref. [4, pp. 233–234]. For details of the notation of class 5, see Ref. [5]. For<br />
2<br />
the notation of class 7, see Ref. [6]. Moreover, we added for class 7 the parity u or g of the vibrational level in the S-field<br />
for the symmetric isotopologue 12 C 2<br />
H 2 . For class 8, S is the symmetry of the level (only for NH 3 : for PH 3 S is blank).<br />
For H 2 O 2 in class 9, v 4 has been replaced by the torsional quanta n and t described in Refs. [7,8]. For CH 4 , n is a<br />
multiplicity index, and C is the symmetry. Class 10 includes a wide variety of polyatomic molecules; the notation is<br />
tailored to each individual molecule.
ARTICLE IN PRESS<br />
146<br />
L.S. Rothman et al. / Journal of Quantitative Spectroscopy & Radiative Transfer 96 (2005) 139–204<br />
Table 4<br />
Notation and format for the six groups of local quanta identification in the <strong>HITRAN</strong> <strong>2004</strong> edition<br />
Notes: Prime and double primes refer, respectively, to upper and lower states, respectively; Br is the O-, P-, Q-, R-, or S-<br />
branch symbol; J is the quantum number associated with the total angular momentum excluding nuclear spin; F is the<br />
quantum number associated with the total angular momentum including nuclear spin. F is shown in A5 FORTRAN<br />
format in order to accommodate integer (I5) or half-integer values (F5.1). For group 3, the notations C and a are<br />
described in Ref. [9]. For group 4, the symmetry C (which is equal to Aþ,A or E) is described in Refs. [10,11]. N is the<br />
total angular momentum including spin and rotation for O 2 . Sym is either the symmetry e or f for ‘-type doubling [12],<br />
þ or for required symmetry symbols, or d or q for magnetic-dipole or electric-quadrupole transitions (only for O 2 and<br />
N 2 ).<br />
a For NO 2 and HO 2 , N (the quantum number associated with the rotational angular momentum) is used instead of J,<br />
and the Sym field þ= (which is not a symmetry) is the J-coding defined as follows: þ means J ¼ N þ 1 and means<br />
2<br />
J ¼ N 1.<br />
b 2<br />
For OH, the format of branch (Br) in the lower-state quanta field is 2A1 to accommodate the total orbital angular<br />
momentum N as well as J.
ARTICLE IN PRESS<br />
L.S. Rothman et al. / Journal of Quantitative Spectroscopy & Radiative Transfer 96 (2005) 139–204 147<br />
Table 5<br />
Uncertainty codes adopted for <strong>HITRAN</strong><br />
Line position and<br />
Air pressure-induced line shift ðcm 1 Þ<br />
Intensity, half-width (air- and self-)<br />
and temperature-dependence<br />
Code Uncertainty range Code Uncertainty range<br />
0 X1. or Unreported 0 Unreported or unavailable<br />
1 X0:1 and o1. 1 Default or constant<br />
2 X0:01 and o0:1 2 Average or estimate<br />
3 X0:001 and o0:01 3 X20%<br />
4 X0:0001 and o0:001 4 X10% and o20%<br />
5 X0:00001 and o0:0001 5 X5% and o10%<br />
6 o0:00001 6 X2% and o5%<br />
7 X1% and o2%<br />
8 o1%<br />
Note: Uncertainty indices are provided for six parameters in the <strong>HITRAN</strong> <strong>2004</strong> edition. However, there remain some<br />
lines from earlier editions with zero or blank for these indices, since this system was first implemented for three<br />
parameters in 1986. Because some contributors do not supply this important information, it is incumbent upon users to<br />
consult the references. Sources for these parameters are provided by the reference indices (access to these references can<br />
be made in the JavaHAWKS software or the file ref-table.pdf available at the address ftp://cfa-ftp.harvard.edu/pub/<br />
hitran04/Global_Data/).<br />
Tables 1–6 should facilitate the user’s interpretation of all of the notations used in this (<strong>2004</strong>)<br />
edition of the <strong>HITRAN</strong> <strong>database</strong>.<br />
3. Line-by-line parameters<br />
This edition of <strong>HITRAN</strong> contains a new entry, namely, the methanol molecule (CH 3 OH). <strong>The</strong><br />
number of transitions included in the <strong>database</strong> is limited by: (1) a reasonable minimum cutoff in<br />
absorption intensity (based on sensitivity of instruments to observe absorption over maximum<br />
terrestrial path lengths), (2) lack of sufficient experimental data, or (3) lack of calculated<br />
transitions.<br />
<strong>The</strong> molecules for which data are included in the line-by-line portion of <strong>HITRAN</strong> are mostly<br />
composed of small numbers of atoms and have low <strong>molecular</strong> weights. Large polyatomic<br />
molecules have many normal modes of vibration and ‘‘heavy’’ species have fundamentals at very<br />
low wavenumbers. For two of the molecules in <strong>HITRAN</strong>, SF 6 and ClONO 2 , we have put the<br />
parameters for this edition in a supplemental folder (see Fig. 1). <strong>The</strong> rationale for this is that the<br />
line-by-line parameters represent only a few bands, and neglect many significant hot bands for the<br />
‘‘heavy’’ species. For most applications, the IR cross-sections of these molecules in the <strong>HITRAN</strong><br />
compilation provide a better simulation.<br />
<strong>The</strong> following sub-sections cover all molecules whose parameters have been updated since the<br />
last edition of <strong>HITRAN</strong> [1]. <strong>The</strong> descriptions are generally ordered by increasing wavenumber<br />
region, and we have attempted to describe the improvements in the line positions and intensities
ARTICLE IN PRESS<br />
148<br />
L.S. Rothman et al. / Journal of Quantitative Spectroscopy & Radiative Transfer 96 (2005) 139–204<br />
Table 6<br />
Summary of isotopologues represented in <strong>HITRAN</strong>
ARTICLE IN PRESS<br />
L.S. Rothman et al. / Journal of Quantitative Spectroscopy & Radiative Transfer 96 (2005) 139–204 149<br />
Table 6 (continued)<br />
Note: SF 6 and ClONO 2 are relegated to the supplemental directory.
ARTICLE IN PRESS<br />
150<br />
L.S. Rothman et al. / Journal of Quantitative Spectroscopy & Radiative Transfer 96 (2005) 139–204<br />
prior to those in the other parameters, when feasible. Future improvements are also mentioned<br />
where necessary.<br />
3.1. H 2 O (molecule 1)<br />
For water-vapor parameters, a major improvement has been accomplished, especially for the<br />
main isotopologue H 16 2 O.<br />
In the pure-rotation region, 952 lines of HD 18 O have been added to <strong>HITRAN</strong>. Line positions<br />
and intensities derive from the JPL catalog [15]. It should be noted that the spectral line<br />
parameters of this isotopologue were only listed in the earlier editions of <strong>HITRAN</strong> in the spectral<br />
region covering the bands due to the bending mode of vibration of the molecule.<br />
Updates of line positions have been made for 1396 lines of H 17 2 O and H 18 2 O from 0 to 500 cm 1<br />
based on the work of Toth [16], and of line intensities for 2523 lines of H 17 2 O, H 18 2 O, and HD 16 O<br />
from 0 to 500 cm 1 based on the work of Pearson [17].<br />
For the main isotopologue H 16 2 O between 0 and 800 cm 1 , the calculations of Coudert et al.<br />
[18–20] have been used to update line positions and line intensities of the 000-000, 010-010, 020-<br />
020, 100-100, and 001-001 bands, and to add six new bands into <strong>HITRAN</strong> (100-001, 100-020, 020-<br />
100, 020-001, 001-100, 001-020). <strong>The</strong>se updates and improvements are for positions and intensities<br />
of 2852 lines involving the first eight vibrational states. At very low wavenumbers, the intensity<br />
cutoff S cut used in <strong>HITRAN</strong> is not a constant, but in fact decreases and is related to the effect of<br />
the radiation field in the line intensity calculation [21]. For the first seven molecules in <strong>HITRAN</strong>,it<br />
is given by<br />
S cut ¼ S <br />
critn<br />
tanh c 2n<br />
n crit 2T 0<br />
<br />
, (1)<br />
where, S crit ¼ 3 10 27 cm molecule 1 at n crit ¼ 2000 cm 1 for water vapor. c 2 is the second<br />
radiation constant hc=k (h is Planck’s constant, c is the speed of light in vacuum, k is Boltzmann’s<br />
constant), n is the wavenumber of the transition, and T 0 is a standard temperature. In <strong>HITRAN</strong>,<br />
T 0 has traditionally been 296 K.<br />
A complete update for positions and line intensities has been done for all <strong>HITRAN</strong> water-vapor<br />
isotopologues between 500 and 8000 cm 1 based on the work of Toth [22]. This update does not<br />
apply to the lines previously discussed that come from the work of Coudert et al. [18–20].<br />
From 9600 to 11400 cm 1 , the line positions and intensities of the isotopologue H 2 17 O, which<br />
come from a preliminary study of Camy-Peyret et al. [23], have been updated. <strong>The</strong> number of lines<br />
has been increased to 1063 from 370. Above 11400 cm 1 , lines have recently been assigned by<br />
Tanaka et al. [24] and will be included in a future update to <strong>HITRAN</strong>.<br />
Nine hundred and eighteen lines of H 2 18 O have been entered into <strong>HITRAN</strong> in the<br />
12400–14518 cm 1 region by drawing upon the work of Tanaka et al. [24,25]. Using the FTS<br />
(Fourier Transform Spectroscopy) spectra of water vapor (with significantly enhanced H 2 17 O and<br />
H 2 18 O), which were recorded at the Kitt Peak National Solar Observatory in August 1980, the line<br />
positions and the heights of the absorption peaks of the transitions of H 2 18 O were determined. <strong>The</strong><br />
conversion of the peak heights of absorption into values of line intensity has been obtained by<br />
using the spectra of water vapor in its natural abundance that were recorded in the same spectral<br />
region [26]. <strong>The</strong> quantum assignments of the lines in this spectral region are mostly complete,
ARTICLE IN PRESS<br />
L.S. Rothman et al. / Journal of Quantitative Spectroscopy & Radiative Transfer 96 (2005) 139–204 151<br />
while, in some cases, a slight revision of line intensities and line positions, based upon the work of<br />
Tanaka et al. [24] is made apparent.<br />
Another significant improvement in the <strong>database</strong> is in the 9250–9600, 11400–12895, and<br />
13184–25000 cm 1 regions, in which the line lists generated from the work of Mérienne et al. [27]<br />
and Coheur et al. [28] have been used to replace the previously listed entries for the lines of H 16 2 O.<br />
<strong>The</strong> line positions and line intensities alone have been adopted from Refs. [27,28], while the line<br />
assignments are taken from Ref. [29]. <strong>The</strong> experimental data from Refs. [27,28] are still being<br />
analyzed and scrutinized, and improvements are expected in the near future.<br />
<strong>The</strong>re has been a complete overhaul of the line-shape parameters (air-broadened half-widths<br />
ðg air Þ, self-broadened half-widths ðg self Þ, and the air-induced line shift ðd air Þ)ofH 16 2 O, H 18 2 O and<br />
H 17 2 O. A procedure, described below, was developed that reads the line list for water-vapor,<br />
searches in a number of <strong>database</strong>s for the line-shape data of the particular rotational–vibrational<br />
transition, and adds the information based on a scheme of priority. Let us consider firstly the data<br />
on air-broadened half-widths. A primary <strong>database</strong> has been constructed by performing an<br />
intercomparison of measured air-broadened half-widths [30] that were determined by averaging<br />
two to eight experimental data on each of 3514 transitions and the corresponding and reported<br />
experimental uncertainties. A second similar <strong>database</strong> has been composed of all the single<br />
measurements of g air of 14,355 transitions [30] with the reported uncertainty. Additional<br />
<strong>database</strong>s, as those of smoothed g air values created by Toth [22] (for 7716 transitions) and those<br />
calculated using the complex Robert–Bonamy (CRB) method for 6040 rotational–vibrational<br />
transitions [31–36], have been set up.<br />
<strong>The</strong> algorithm given in Ref. [37] to determine an approximate value of g air allows us to<br />
determine an approximate air pressure-induced line shift as well. <strong>The</strong> method of Ref. [37] is an<br />
attempt to fit, for each rotational transition, the experimental and theoretical data by applying<br />
Eq. (15) of Ref. [36], which describes the vibrational dependence of g air and d air . <strong>The</strong> coefficients<br />
deduced from the fit allow one to obtain any air-broadened half-width or air pressure-induced line<br />
shift of transitions having the same rotational quantum numbers but different vibrational<br />
quantum numbers. <strong>The</strong> fits were made using recent experimental [22,27,28,38,39] and theoretical<br />
[32–34] data. This approach may be employed as the interim method of determining the<br />
approximate values of g air and d air for the rotational–vibrational transitions of H 16 2 O, H 18 2 O and<br />
H 17 2 O until a more robust approach, based upon accurately measured data, surfaces.<br />
<strong>The</strong> procedure for adding the air-broadened half-width data is based on a preference for<br />
the data extracted from the intercomparison <strong>database</strong> [30], in which the respective uncertainties in<br />
the data are identified. If a value does not exist in this <strong>database</strong> for a given rotational–vibrational<br />
transition, the algorithm next searches the <strong>database</strong> of all air-broadened measurements of the<br />
half-width. If a reliable datum exists, with its associated uncertainty and the source from<br />
which it was extracted is duly apparent, it is recommended by the algorithm. If such is not<br />
the case, then the algorithm recommends the employment of the smoothed data that were<br />
created by Toth [22]. If a reliable datum exists, it is used, and the uncertainty code is set to 5. If<br />
there is no datum in the latter list, the search is extended to the CRB <strong>database</strong> [32–36] for the<br />
particular rovibrational transition. If the datum is in the CRB <strong>database</strong> it is used and the<br />
uncertainty code set to 5. Finally, if the datum has not been found in the above <strong>database</strong>s,<br />
the approximate air-broadened half-width from the work of Ref. [37] is used with the uncertainty<br />
code set to 4.
ARTICLE IN PRESS<br />
152<br />
L.S. Rothman et al. / Journal of Quantitative Spectroscopy & Radiative Transfer 96 (2005) 139–204<br />
In the case of the deuterated isotopologues HD 16 O, HD 18 O and HD 17 O, the measurements and<br />
extrapolations performed by Toth [22] have been used in the 500–8000 cm 1 region. For all the<br />
other transitions of these species, only the data from Ref. [22] that belong to the n 1 , n 2 , and n 3<br />
bands of HD 16 O have been used by making the implicit assumption that the dependence upon the<br />
vibrational quantum numbers is negligible.<br />
For the self-broadened half-widths, g self ,ofH 16 2 O, H 18 2 O, and H 17 2 O, the following procedure has<br />
been adopted. For a given rovibrational transition, priority is given to data taken from the<br />
<strong>database</strong> of all values of g self (10,596 transitions) from Ref. [30]. When the datum existed as a<br />
measurement, it was implemented with the corresponding experimental uncertainty along with the<br />
suitable reference found in the <strong>database</strong>. In cases where a measured datum had not been available,<br />
we resorted to the adoption of the smoothed data on g self presented by Toth in Ref. [22] for 7716<br />
transitions. If a measured value was available, it is listed with the uncertainty code assigned to be<br />
5. Finally, if a value had not been found in either the experimental or the extrapolated <strong>database</strong>, a<br />
g self that has been determined by averaging experimental values as a function of J 00 (uncertainty<br />
code 2) was adopted.<br />
For the transitions in the pure-rotational bands of HD 16 O and HD 18 O, we adopted the data<br />
from Ref. [22] on corresponding rotational transitions in the n 1 , n 2 , and n 3 bands of HD 16 O. A<br />
study, which is based on the approach of Ref. [37], of the dependence of self-broadened line<br />
widths on vibrational quantum numbers, is contemplated as an update of these coefficients in a<br />
future <strong>HITRAN</strong> edition.<br />
As the modern atmospheric remote-sensing instruments and experiments are becoming<br />
progressively more sophisticated, the need for data on air-induced shifts of the spectral lines of<br />
atmospheric gases is emerging. However, it must be recognized that collision-induced line shifts<br />
are, more often than not, more difficult to measure than half-widths, and values reported by<br />
different laboratories can disagree significantly. It is difficult to archive a set of data that is<br />
concordant with the measurements reported by every laboratory. So, the entries in the <strong>database</strong> in<br />
this category have to be regarded as the best estimates that we could provide at the present time.<br />
<strong>The</strong> air pressure-induced line shifts, d air , for water vapor included in the current edition, have been<br />
judiciously chosen from the following five sources: the <strong>database</strong> compiled by Gamache and<br />
Hartmann [30] after a critical intercomparison of all of the published experimental line shift data<br />
on 680 transitions, a seemingly comprehensive list cited in Ref. [30] of published experimental line<br />
shifts of 8754 transitions, the line shifts reported by Toth [22] on 2978 transitions after he<br />
subjected his measured data to a smoothing procedure, the CRB calculated <strong>database</strong> [32–36] on<br />
6040 transitions, and the complete set of data from Ref. [37], which describes a semi-empirical<br />
procedure for generating the list of line parameters in the absence of definitive measurements. <strong>The</strong><br />
same set of criteria as applied to, and described above for air-broadened widths, has been adopted<br />
for the line shifts as well. Top priority has been given to accurate and carefully performed<br />
measurements, and the next order of priority is assigned to a CRB calculation, and then falling<br />
back to the data of Ref. [37] for a semi-empirical approach as an interim solution. <strong>The</strong> present<br />
attempt is a considerable advance from the lack of these data in the previous edition [1], in which<br />
we were only able to assign for most of the transitions a value of zero as an indication that a<br />
datum was unavailable for the air-induced line shift.<br />
As it is commonly accepted now, the dependence of a collision-broadened half-width upon<br />
temperature is expressed in terms of an exponent, n, under the assumption that the half-width
ARTICLE IN PRESS<br />
L.S. Rothman et al. / Journal of Quantitative Spectroscopy & Radiative Transfer 96 (2005) 139–204 153<br />
Table 7<br />
Summary of the temperature-dependence exponents n air of the water-vapor air-broadened half-widths from Ref. [40]<br />
jmj<br />
n air<br />
0 0.78<br />
1 0.78<br />
2 0.78<br />
3 0.77<br />
4 0.73<br />
5 0.69<br />
6 0.64<br />
7 0.59<br />
8 0.53<br />
9 0.49<br />
10 0.45<br />
11 0.41<br />
12 0.39<br />
13 0.37<br />
14 0.36<br />
15 0.36<br />
16 0.38<br />
X17 0.41<br />
varies as the negative power n of the temperature. <strong>The</strong> exponents of the air-broadened halfwidths,<br />
n air , in the current <strong>database</strong> are the estimated values given in Ref. [40], which addresses the<br />
6-mm region. It should be noted that these values are only jmj-dependent (m ¼ J 00 for DJ ¼ 1,<br />
m ¼ J 00 for DJ ¼ 0, and m ¼ J 00 þ 1 for DJ ¼þ1, where J 00 is the rotational quantum number in<br />
the lower state of a radiative transition resulting from absorption). <strong>The</strong>se exponents have now<br />
been used for all the assigned transitions of all of the isotopologues of water vapor throughout<br />
this <strong>database</strong>. Table 7 summarizes these entries. A default exponent of 0.68 has been adopted for<br />
n air for unassigned lines.<br />
3.2. CO 2 (molecule 2)<br />
Among the recent studies on carbon dioxide, we highlight the global calculation by Tashkun et<br />
al. [41] on the positions and intensities of the lines of 12 C 16 O 2 , 13 C 16 O 2 , 12 C 16 O 18 O and 12 C 16 O 17 O.<br />
This enterprise of calculation resulted in the establishment of the so-called ‘‘Carbon Dioxide<br />
Spectroscopic Database at 296 K’’ with the acronym CDSD-296. This work has been compared<br />
with earlier calculations that used the Direct Numerical Diagonalization (DND) technique [42],<br />
and has been found to be an improvement. Following the procedure that has been employed<br />
previously [43], high-quality experimental data have been preferred. For this reason, the data of<br />
CDSD-296 have been adopted in order to update <strong>HITRAN</strong> only in situations in which highquality<br />
observational data were unavailable.<br />
We have added two line lists in the pure-rotational spectral region in this edition for the<br />
isotopologues 16 O 12 C 18 O and 16 O 12 C 17 O. Although their permanent dipole moments are quite<br />
small, their effects are apparently identifiable in <strong>spectroscopic</strong> observations. Thus we felt that the
ARTICLE IN PRESS<br />
154<br />
L.S. Rothman et al. / Journal of Quantitative Spectroscopy & Radiative Transfer 96 (2005) 139–204<br />
data on these transitions deserved to be included in the <strong>database</strong>. <strong>The</strong> positions, line intensities,<br />
and the energies of the lower states of the transitions are derived from the JPL catalog [15]. It<br />
should be noted that the hyperfine structure of the 16 O 12 C 17 O isotopologue is resolved.<br />
It can be stated that a significant update has indeed been accomplished on the line positions.<br />
For the principal isotopologue of CO 2 , namely, 12 C 16 O 2 , the recent work of Miller and Brown [44]<br />
has been used to update the line positions of 83 bands in a considerably large infrared spectral<br />
region. Fig. 2 shows the dramatic improvement in the residuals due to the new line positions that<br />
are identified in the 2-mm region. This improvement is typical of what has been achieved in the<br />
latest update in the <strong>database</strong> on this molecule. Furthermore, the calculation by Tashkun et al. [41]<br />
has been used to improve the <strong>database</strong> on line positions that had previously been presented in<br />
<strong>HITRAN</strong>92 [45] as calculations using <strong>spectroscopic</strong> constants [43] coming from a DND<br />
calculation [42], from Venus observations [46], and from the calculation by Rothman and<br />
Benedict [47] for the other isotopologues. <strong>The</strong> work of Tashkun et al. [41] has led to this update of<br />
line positions of 51 bands of 12 C 16 O 2 , 8 bands of 13 C 16 O 2 , 4 bands of 12 C 16 O 18 O, and 12 bands of<br />
12 C 16 O 17 O. This update covers the entire infrared region.<br />
Fig. 2. Comparison between experimental (solid line) and simulated (dashed line) CO 2 laboratory spectra in the 2-mm<br />
region. <strong>The</strong> experimental conditions of the bottom panel are 30 torr CO 2 and 25 m path. Top panel: residuals from<br />
simulating the experimental spectrum using the previous <strong>HITRAN</strong> <strong>database</strong> [1]. RMS error ¼ 2:75%. Middle panel:<br />
simulation residuals using the line positions reported in Miller and Brown [44] with unpublished intensity data.<br />
RMS error ¼ 0:11%.
ARTICLE IN PRESS<br />
L.S. Rothman et al. / Journal of Quantitative Spectroscopy & Radiative Transfer 96 (2005) 139–204 155<br />
As recommended by Goldman et al. [48], the work of Ding et al. [49] has been used to update<br />
the line positions in the 2n 1 þ 3n 3 band triad around 9550 cm 1 of 12 C 16 O 2 . <strong>The</strong> <strong>spectroscopic</strong><br />
constants of Ref. [49] have also been used to update the line positions of the two hot bands 20031-<br />
10001 and 20032-10002 around 8230 cm 1 involving the levels of the 2n 1 þ 3n 3 triad (the<br />
vibrational quantum number notation used for this molecule is shown in Table 3). For the<br />
interacting 21113-11102, 21113-11101, 12212-02201, 40002-11102, and 23301-02201 bands of<br />
12 C 16 O 2 in the 3-mm region, the line positions have been taken from Benner [50]. <strong>The</strong> positions of<br />
the two laser bands of 12 C 16 O 17 O have also been updated from Ref. [51]. A summary of the<br />
improvements pertaining to the line positions is given in Table 8.<br />
Numerous experimental studies have been reported in the open literature on line intensities of<br />
this molecule since the last update of <strong>HITRAN</strong> [1] was announced in this journal. Several research<br />
efforts have been recognized in the preparation of the current edition: Mandin et al. [52] on the<br />
10012-10001 band of 12 C 16 O 2 centered at 2225 cm 1 ; Claveau et al. [51] on three hot bands of<br />
16 O 12 C 17 O between 550 and 765 cm 1 ; Ref. [53] on the n 2 þ n 3 n 2 band of 16 O 12 C 17 O and the<br />
laser bands of 16 O 12 C 17 O and 16 O 12 C 18 O; Teffo et al. [54,55] on the 10031-00001 and 10032-00001<br />
bands of the main isotopologue centered at 8294 cm 1 and at 8192 cm 1 [54] and on the n 3 -<br />
fundamental of 16 O 13 C 17 O [55]; Henningsen and Simonsen [56] on the 2n 1 þ 2n 2 þ n 3 band of<br />
12 C 16 O 2 at 6348 cm 1 ; Kshirasagar et al. [57] for the data on the 2n 3 band of 16 O 12 C 18 Oat<br />
4639 cm 1 ; Ref. [58] for the data on the 00031-10001 and 00031-10002 bands of 12 C 16 O 2 at<br />
5584 cm 1 ; Giver et al. [59] for the data on the five bands of 12 C 16 O 2 between 5218 cm 1 and<br />
5349 cm 1 ; Devi et al. [60] for data on the 33 bands of 12 C 16 O 2 between 3090 and 3850 cm 1 ; and<br />
Benner [50] for the data on the five interacting bands around 3400 cm 1 . We also used the<br />
calculation, CDSD-296 [41], in order to replace the line intensities that arose from an early<br />
calculation by Rothman and Benedict [47]. In essence, the line intensities for four bands of<br />
12 C 16 O 2 and 15 bands of 12 C 16 O 17 O have thus been updated. A summary of the bands for which<br />
the line intensities have been updated is presented in Table 9. It should be noted that the 23301-<br />
02201 band centered at 3554:964 cm 1 , which was not present in the 2000 <strong>HITRAN</strong> edition [1], has<br />
been added from the work of Benner [50].<br />
<strong>The</strong> previous edition of <strong>HITRAN</strong> [1] had no CO 2 line parameters at wavenumbers above<br />
9650 cm 1 . However, in the present edition we have added parameters for the 10041-00001, 10051-<br />
00001, 10052-00001 and 00051-00001 bands of the 12 C 16 O 2 isotopologue. <strong>The</strong> spectral line positions<br />
stem from Campargue et al. [61], and the line positions in the 10051-00001 band have been confirmed<br />
independently by Lucchesini [62]. Line intensities are drawn from Ref. [63], but,sincethedataare<br />
deemed to be not highly accurate, a code 3 (i.e., uncertainty in the measurement in excess of 20%) has<br />
been adopted. <strong>The</strong>se four bands are of particular interest in the studies of the atmosphere of Venus.<br />
Concerning the air- and self-broadened half-widths, and the temperature dependence of the airbroadened<br />
widths, the values recommended in Ref. [45] for the <strong>HITRAN</strong> 92 edition have been<br />
used for all CO 2 transitions in subsequent editions of the <strong>database</strong>, including the present one. Air<br />
pressure-induced line shifts have been added for the two laser bands of 12 C 16 O 2 at 9.4 and<br />
10:4 mm, based on the work of Devi et al. [64]. <strong>The</strong>se shifts have also been adopted for the laser<br />
bands of the other isotopologues, by assuming that the dependence upon the type of isotopologue<br />
is negligible. Values of shifts have been retained from the previous <strong>HITRAN</strong> edition for the bands<br />
at 4:3 mm, but otherwise there has been no attempt to give non-zero values of d air for the majority<br />
of carbon dioxide bands at this time.
ARTICLE IN PRESS<br />
156<br />
L.S. Rothman et al. / Journal of Quantitative Spectroscopy & Radiative Transfer 96 (2005) 139–204<br />
Table 8<br />
Bands of CO 2 for which the line positions have been updated<br />
Band center Upper vib Lower vib n min n max Number of J min J max Ref.<br />
ðcm 1 Þ v 1 v 2 l 2 v 3 r v 1 v 2 l 2 v 3 r ðcm 1 Þ ðcm 1 Þ lines<br />
12 C 16 O 2 isotopologue<br />
608.8 1 0012 01111 576 644 67 1 47 [44]<br />
618.0 1 0002 01101 546 687 136 1 91 [44]<br />
645.1 2 3303 22203 645 646 15 10 24 [41]<br />
654.9 0 1111 00011 607 708 98 1 67 [44]<br />
655.3 0 2211 01111 621 696 144 1 52 [44]<br />
667.4 0 1101 00001 593 752 153 0 102 [44]<br />
667.8 0 2201 01101 600 750 275 1 94 [44]<br />
688.7 1 1101 10001 625 756 126 0 84 [44]<br />
710.8 1 0011 01111 677 745 67 1 47 [44]<br />
720.8 1 0001 01101 649 791 137 1 92 [44]<br />
741.7 1 1101 02201 675 802 233 2 81 [44]<br />
791.4 1 1101 10002 737 849 109 0 74 [44]<br />
927.2 01 1 1 1 1 1101 868 964 138 1 60 [44]<br />
961.0 0 0011 10001 886 1002 75 0 74 [44]<br />
1063.7 0 0011 10002 986 1105 77 0 76 [44]<br />
2076.9 1 1101 00001 2010 2145 127 0 88 [44]<br />
2224.7 1 0012 10001 2158 2264 68 0 68 [44]<br />
2274.4 0 6611 06601 2244 2299 62 6 34 [41]<br />
2275.8 1 4411 14401 2251 2297 42 4 28 [41]<br />
2277.2 2 2211 22201 2259 2294 23 10 22 [41]<br />
2278.4 1 4412 14402 2243 2306 77 4 39 [41]<br />
2280.6 2 2212 22202 2250 2305 61 4 34 [41]<br />
2281.7 2 2213 22203 2243 2310 85 2 42 [41]<br />
2286.8 0 5511 05501 2234 2322 133 5 56 [41]<br />
2311.7 0 1121 01111 2246 2350 162 1 67 [44]<br />
2324.1 0 2211 02201 2227 2371 250 2 92 [44]<br />
2324.2 0 0021 00011 2244 2366 80 1 79 [44]<br />
2326.6 1 0011 10001 2231 2372 91 0 90 [44]<br />
2327.4 1 0012 10002 2231 2374 93 0 92 [44]<br />
2336.6 0 1111 01101 2227 2384 278 1 101 [44]<br />
2349.1 0 0011 00001 2230 2397 109 0 108 [44]<br />
2429.4 1 0011 10002 2364 2467 66 0 66 [44]<br />
3365.3 3 1102 10001 3331 3403 33 8 48 [41]<br />
3398.2 2 1113 11101 3374 3420 46 6 28 [50]<br />
3465.4 2 0013 10001 3410 3505 61 0 60 [44]<br />
3496.1 2 3313 13302 3464 3522 68 3 36 [41]<br />
3505.0 1 4412 04401 3461 3537 108 4 48 [41]<br />
3506.7 3 1114 21103 3473 3534 73 2 38 [41]<br />
3518.7 2 2 21 3 1 2202 3468 3554 124 2 54 [41]<br />
3527.8 2 2212 12201 3484 3559 100 2 47 [41]<br />
3542.6 2 1113 11102 3476 3586 171 1 70 [50]<br />
3543.1 4 0002 11102 3502 3592 82 1 63 [50]<br />
3552.9 1 2212 02201 3476 3598 203 2 78 [50]<br />
3555.0 2 3301 02201 3504 3611 188 2 68 [50]<br />
3555.9 2 1112 11101 3492 3593 152 1 64 [44]
ARTICLE IN PRESS<br />
L.S. Rothman et al. / Journal of Quantitative Spectroscopy & Radiative Transfer 96 (2005) 139–204 157<br />
Table 8 (continued )<br />
Band center Upper vib Lower vib n min n max Number of J min J max Ref.<br />
ðcm 1 Þ v 1 v 2 l 2 v 3 r v 1 v 2 l 2 v 3 r ðcm 1 Þ ðcm 1 Þ lines<br />
3568.2 2 0013 10002 3490 3615 81 0 80 [44]<br />
3589.7 2 0012 10001 3506 3628 79 0 78 [44]<br />
3612.8 1 0012 00001 3509 3661 99 0 98 [44]<br />
3659.3 0 2211 00001 3582 3715 82 4 86 [44]<br />
3692.4 2 0012 10002 3606 3731 81 0 80 [44]<br />
3703.2 3 1111 21101 3680 3723 43 6 27 [41]<br />
3703.5 2 2212 12202 3651 3736 124 2 54 [41]<br />
3704.1 2 3312 13302 3675 3727 56 3 32 [41]<br />
3711.5 2 0011 10001 3635 3757 79 0 78 [44]<br />
3712.4 2 3311 13301 3689 3733 42 7 28 [41]<br />
3713.7 2 1111 11101 3648 3755 166 1 68 [44]<br />
3713.8 2 2211 12201 3665 3747 118 2 52 [41]<br />
3714.8 1 0011 00001 3610 3763 99 0 98 [44]<br />
3724.1 1 5511 05501 3702 3743 33 5 25 [41]<br />
3726.4 1 4411 04401 3678 3759 119 4 51 [41]<br />
3814.3 2 0011 10002 3753 3854 65 0 64 [44]<br />
3980.6 0 1121 02201 3975 4003 59 8 47 [44]<br />
4005.9 0 0021 01101 3934 4029 78 2 63 [44]<br />
4416.1 3 1104 00001 4426 4452 16 12 42 [41]<br />
4687.8 3 00 1 4 1 0001 4652 4719 42 2 42 [44]<br />
4722.6 3 2214 12202 4705 4740 23 10 22 [41]<br />
4733.5 2 3313 03301 4696 4763 87 3 42 [41]<br />
4735.6 4 0015 20003 4712 4757 24 6 28 [41]<br />
4753.5 3 1102 00001 4706 4800 72 2 60 [41]<br />
4755.7 3 1114 11102 4712 4792 102 1 50 [41]<br />
4768.6 2 2213 02201 4711 4807 144 2 60 [44]<br />
4784.7 2 0023 00011 4762 4805 21 7 27 [41]<br />
4786.7 3 1113 11101 4750 4814 78 2 41 [44]<br />
4790.6 3 0014 10002 4733 4834 65 0 64 [44]<br />
4807.7 2 1113 01101 4741 4854 91 1 72 [44]<br />
4808.2 4 0002 01101 4758 4857 80 1 55 [41]<br />
4839.7 3 0013 10001 4780 4874 61 0 60 [44]<br />
4853.6 2 0013 00001 4772 4903 85 0 84 [44]<br />
4910.6 2 0022 00011 4872 4937 41 1 41 [41]<br />
4912.2 4 0014 20003 4879 4936 35 2 36 [41]<br />
4920.2 3 2213 12202 4893 4942 49 6 30 [41]<br />
4922.6 4 0013 20002 4889 4946 35 2 36 [41]<br />
4937.3 4 0012 20001 4922 4953 8 12 20 [41]<br />
4941.5 2 3312 03301 4897 4972 103 3 47 [41]<br />
4942.5 3 0013 10002 4872 4978 69 0 68 [44]<br />
4946.8 3 1112 11101 4900 4979 102 1 50 [44]<br />
4953.4 2 2212 02201 4890 4991 158 2 64 [44]<br />
4959.7 3 0012 10001 4892 4996 67 0 66 [44]<br />
4965.4 2 1112 01101 4884 5007 198 1 77 [44]<br />
4977.8 2 0012 00001 4881 5018 89 0 88 [44]<br />
5028.5 2 0 0 21 0 0011 5000 5052 31 3 33 [41]<br />
5062.4 3 0012 10002 5002 5096 61 0 60 [44]
ARTICLE IN PRESS<br />
158<br />
L.S. Rothman et al. / Journal of Quantitative Spectroscopy & Radiative Transfer 96 (2005) 139–204<br />
Table 8 (continued )<br />
Band center Upper vib Lower vib n min n max Number of J min J max Ref.<br />
ðcm 1 Þ v 1 v 2 l 2 v 3 r v 1 v 2 l 2 v 3 r ðcm 1 Þ ðcm 1 Þ lines<br />
5099.7 2 0011 00001 5017 5148 85 0 84 [44]<br />
5114.9 3 0011 10001 5060 5155 61 0 60 [44]<br />
5123.2 2 1111 01101 5050 5167 185 1 73 [44]<br />
5127.0 3 1111 11101 5086 5158 91 1 45 [44]<br />
5139.4 2 2211 02201 5081 5176 145 2 60 [44]<br />
5151.4 2 3311 03301 5112 5181 90 3 43 [41]<br />
5217.7 3 0011 10002 5176 5251 48 0 46 [44]<br />
5315.7 0 1121 00001 5251 5342 93 0 64 [44]<br />
5584.4 0 0031 10001 5541 5601 39 2 40 [44]<br />
5687.2 0 0031 10002 5638 5703 42 2 42 [44]<br />
5972.5 3 2214 02201 5949 5995 46 6 29 [41]<br />
5998.6 4 0015 10002 5967 6028 37 2 38 [41]<br />
6020.8 3 1114 01101 5975 6059 108 1 52 [44]<br />
6076.0 3 0014 00001 6019 6121 66 0 66 [44]<br />
6149.4 4 1114 11102 6160 6164 5 14 18 [41]<br />
6170.1 3 2213 02201 6132 6198 82 2 41 [44]<br />
6175.1 4 0014 10002 6130 6207 50 0 50 [44]<br />
6196.2 3 1113 01101 6137 6233 136 1 60 [44]<br />
6205.5 4 0013 10001 6160 6232 47 0 46 [44]<br />
6227.9 3 0013 00001 6150 6266 75 0 74 [44]<br />
6308.3 4 0013 10002 6260 6335 49 0 48 [44]<br />
6346.3 4 0012 10001 6303 6376 47 0 46 [44]<br />
6347.9 3 0012 00001 6271 6385 73 0 74 [44]<br />
6356.3 3 1112 01101 6297 6392 134 1 59 [44]<br />
6359.3 3 2212 02201 6322 6386 80 2 40 [41]<br />
6387.9 4 1101 00001 6348 6430 45 8 52 [41]<br />
6503.1 3 0011 00001 6447 6545 63 0 62 [44]<br />
6532.7 4 0011 10001 6506 6557 29 4 32 [41]<br />
6536.4 3 1111 01101 6489 6572 107 1 51 [44]<br />
6562.4 3 2211 02201 6547 6577 15 11 19 [41]<br />
6870.8 1 1132 11102 6848 6885 30 9 24 [41]<br />
6905.8 1 0031 10001 6850 6922 47 0 46 [44]<br />
6907.1 1 0032 10002 6846 6924 51 0 50 [44]<br />
6935.1 0 1131 01101 6846 6952 156 1 65 [44]<br />
6972.6 0 0031 00001 6856 6989 79 0 78 [44]<br />
7284.0 4 0015 00001 7253 7314 37 2 38 [41]<br />
7414.5 4 1114 01101 7386 7438 57 4 32 [41]<br />
7460.5 4 0014 00001 7411 7494 54 0 54 [44]<br />
7583.3 4 1113 01101 7550 7608 70 2 37 [41]<br />
7593.7 4 0013 00001 7535 7623 57 0 56 [44]<br />
7734.4 4 0012 00001 7687 7766 51 0 50 [44]<br />
7757.6 4 1112 01101 7741 7773 18 11 21 [44]<br />
7920.8 4 0011 00001 7897 7944 25 6 30 [41]<br />
8103.6 2 0033 10002 8080 8119 18 8 26 [41]<br />
8135.9 1 1132 01101 8079 8154 98 1 48 [41]<br />
8192.6 1 0032 00001 8099 8210 70 0 70 [44]<br />
8231.6 2 0032 10002 8207 8246 18 8 26 [49]
ARTICLE IN PRESS<br />
L.S. Rothman et al. / Journal of Quantitative Spectroscopy & Radiative Transfer 96 (2005) 139–204 159<br />
Table 8 (continued )<br />
Band center Upper vib Lower vib n min n max Number of J min J max Ref.<br />
ðcm 1 Þ v 1 v 2 l 2 v 3 r v 1 v 2 l 2 v 3 r ðcm 1 Þ ðcm 1 Þ lines<br />
8243.2 2 0031 10001 8224 8256 11 10 20 [49]<br />
8276.8 1 1131 01101 8216 8293 101 1 49 [41]<br />
8294.0 1 0031 00001 8206 8310 65 0 64 [44]<br />
9517.0 2 0032 00001 9454 9533 51 0 50 [49]<br />
9631.4 2 0031 00001 9583 9649 42 2 42 [49]<br />
13 C 16 O 2 isotopologue<br />
573.7 1 3302 04401 573 574 25 7 31 [41]<br />
595.7 2 1103 12202 579 597 40 5 31 [41]<br />
619.8 2 1103 20003 591 650 57 2 42 [41]<br />
637.8 1 3302 12202 613 669 100 2 41 [41]<br />
649.7 0 5501 04401 625 682 92 4 41 [41]<br />
2225.0 0 5511 05501 2206 2243 24 5 23 [41]<br />
2227.8 1 3312 13302 2202 2249 44 7 29 [41]<br />
2229.7 2 1113 21103 2202 2253 56 4 32 [41]<br />
16 O 12 C 18 O isotopologue<br />
561.1 1 2202 03301 547 562 68 7 29 [41]<br />
647.7 1 2202 11102 617 685 266 1 49 [41]<br />
2287.1 1 2212 12202 2251 2315 170 2 43 [41]<br />
2295.0 0 3311 03301 2241 2330 284 3 59 [41]<br />
16 O 12 C 17 O isotopologue<br />
586.9 1 1102 02201 548 626 294 2 53 [41]<br />
650.0 1 2202 11102 620 685 244 1 46 [41]<br />
665.1 0 2201 01101 614 726 427 1 74 [41]<br />
665.5 0 3301 02201 623 715 348 2 62 [41]<br />
681.4 1 2201 11101 656 712 208 1 41 [41]<br />
732.3 1 1101 02201 691 771 302 2 54 [41]<br />
748.1 1 2201 03301 733 749 72 7 29 [41]<br />
964.0 0 0011 10001 925 991 85 1 43 [51]<br />
1067.7 00 0 1 1 1 0002 1024 1098 97 0 48 [51]<br />
2306.7 1 1112 11102 2253 2342 258 1 58 [41]<br />
2315.1 0 2211 02201 2246 2355 362 2 71 [41]<br />
2317.3 1 0011 10001 2249 2356 141 0 70 [41]<br />
2319.0 1 0012 10002 2249 2359 145 0 72 [41]<br />
2327.6 0 1111 01101 2248 2370 416 1 80 [41]<br />
Note: Upper vib and Lower vib use the AFGL vibrational notation for carbon dioxide [5]. <strong>The</strong> sixth column indicates<br />
the number of lines that have been replaced in <strong>HITRAN</strong>.<br />
It is to be noted that a recent work on line positions of the 16 O 13 C 16 O and 16 O 13 C 18 O<br />
isotopologues in the near-infrared from Miller et al. [65] will be taken into account in the next<br />
<strong>HITRAN</strong> edition.
ARTICLE IN PRESS<br />
160<br />
L.S. Rothman et al. / Journal of Quantitative Spectroscopy & Radiative Transfer 96 (2005) 139–204<br />
Carbon dioxide is the first molecule for which line-coupling data are introduced into<br />
the <strong>HITRAN</strong> <strong>database</strong>. <strong>The</strong>se data have been researched by Hartmann and are based on<br />
Refs. [66,67]. <strong>The</strong>y can be found on the <strong>HITRAN</strong> ftp-site (see Fig. 1). A detailed ‘‘readme’’<br />
file gives recommendations on how to implement the line coupling in the line-by-line codes<br />
of users. <strong>The</strong> package of subroutines and input file allows one to take into account line<br />
coupling for 306 Q branches of CO 2 isotopologues between 469 and 6935 cm 1 . Table 10<br />
summarizes the Q branches of CO 2 for which line-coupling data have been supplied with the<br />
<strong>HITRAN</strong> compilation.<br />
3.3. O 3 (molecule 3)<br />
We have implemented a major improvement on the entire list of lines of ozone.<br />
In the pure-rotation region, the positions, the intensities, and the lower energy levels of all of<br />
the transitions of the two isotopologues 16 O 16 O 17 O and 16 O 17 O 16 O have been updated by drawing<br />
upon the JPL catalog [15]. <strong>The</strong> significant difference between this and the previous <strong>HITRAN</strong><br />
edition is in resolution of the hyperfine structure of these two isotopologues. It should be noted<br />
that the JPL catalog contains measured as well as calculated line positions. As a rule, when several<br />
lines of different hyperfine components are reported with the same wavenumber, thereby implying<br />
that they could not be resolved, such an unresolved observed feature is designated as a blend of<br />
those components in the <strong>database</strong>.<br />
Using the MIPAS (Michelson Interferometer for Passive Atmospheric Sounding) <strong>database</strong> [20],<br />
the line positions and intensities of forty-nine infrared bands of 16 O 3 and the n 1 and n 3 bands of the<br />
16 O 16 O 18 O and 16 O 18 O 16 O isotopologues have been updated. Furthermore, seventeen bands of<br />
16 O 3 , a band each of 16 O 16 O 18 O and 16 O 18 O 16 O, and three bands of 16 O 16 O 17 O and 16 O 17 O 16 O<br />
have been introduced. In Table 11 is presented a summary of all the ozone bands that have been<br />
added or updated.<br />
Wagner et al. [68] have enabled us to improve the data on the line positions and intensities in<br />
the n 2 fundamental and the ‘‘hot bands,’’ 4 2n 2 n 2 , n 1 þ n 2 n 2 , and n 2 þ n 3 n 2 bands of the main<br />
isotopologue in the 14-mm region. Additionally, six other bands in the 1613–1903 cm 1 spectral<br />
region (previously unlisted in <strong>HITRAN</strong>), three ‘‘hot’’ bands in the 1872–2288 cm 1 region, and<br />
three cold bands in the 2590–3006 cm 1 region for 16 O 3 have been incorporated into <strong>HITRAN</strong>.<br />
<strong>The</strong>se latter 12 bands come from the work of Ref. [69].<br />
Except for the intensities of the bands discussed above, the intensities of all of the other bands<br />
(including those of the species with their isotopic variants) have been divided by 1.04 in order to<br />
account for the change in the absolute intensities of the two fundamental bands, n 1 and n 3 , upon<br />
which the other data were based [70].<br />
We used the polynomial expressions given in Ref. [68] for the air-broadened half-widths in<br />
order to update the previously ‘‘scaled calculation’’ [45]. In apparent contrast to the previous<br />
calculation, the data of Ref. [68], as well as the air-broadened width measurements of [71,72],<br />
show neither a strong K a dependence nor a large difference between the J K a K c sub-bands.<br />
4 A ‘‘hot’’ band, by its conventional definition, is a vibrational–rotational transition that occurs with the same change<br />
in the vibrational quanta as that representing a transition from the ground vibrational level of the molecule, but it<br />
implies a transition that takes places from an excited (‘‘hot’’) vibrational level of energy.
ARTICLE IN PRESS<br />
L.S. Rothman et al. / Journal of Quantitative Spectroscopy & Radiative Transfer 96 (2005) 139–204 161<br />
Table 9<br />
Bands of CO 2 for which the line intensities have been updated<br />
Band center Upper vib Lower vib n min n max Number of Sum of line Ref.<br />
ðcm 1 Þ v 1 v 2 l 2 v 3 r v 1 v 2 l 2 v 3 r ðcm 1 Þ ðcm 1 Þ lines intensities<br />
12 C 16 O 2 isotopologue<br />
2224.7 10012 10001 2158 2264 68 1.12E-22 [52]<br />
3181.5 21103 00001 3131 3239 78 1.19E-23 [60]<br />
3275.2 30003 01101 3232 3317 65 1.91E-24 [60]<br />
3305.7 31103 10002 3270 3344 36 4.42E-25 [60]<br />
3339.4 21102 00001 3279 3398 105 1.02E-22 [60]<br />
3340.5 22202 01101 3294 3394 145 8.19E-24 [60]<br />
3341.7 23302 02201 3311 3379 55 4.04E-25 [60]<br />
3365.3 31102 10001 3331 3403 33 3.27E-25 [60]<br />
3396.9 30002 01101 3349 3441 52 1.92E-24 [60]<br />
3398.2 21113 11101 3374 3420 46 2.52E-25 [50]<br />
3465.4 20013 10001 3410 3505 61 1.49E-23 [60]<br />
3496.1 23313 13302 3464 3522 68 6.37E-25 [60]<br />
3500.7 21101 00001 3445 3561 100 6.18E-23 [60]<br />
3505.0 14 4 1 2 0 4 4 0 1 3461 3537 108 3.67E-24 [60]<br />
3518.7 22213 12202 3468 3554 124 1.14E-23 [60]<br />
3527.6 30014 20003 3476 3565 57 8.61E-24 [60]<br />
3528.1 13312 03301 3467 3568 162 1.01E-22 [60]<br />
3530.0 22201 01101 3488 3580 131 4.15E-24 [60]<br />
3542.6 21113 11102 3476 3586 171 2.81E-22 [50]<br />
3543.1 40002 11102 3502 3592 82 1.09E-23 [50]<br />
3552.9 12212 02201 3476 3598 203 2.80E-21 [50]<br />
3555.0 23301 02201 3504 3611 188 2.78E-23 [50]<br />
3555.9 21112 11101 3492 3593 152 9.39E-23 [60]<br />
3556.8 30013 20002 3506 3591 55 5.69E-24 [60]<br />
3566.1 10022 00011 3509 3604 62 2.05E-23 [60]<br />
3568.2 20013 10002 3490 3615 81 3.09E-21 [60]<br />
3589.7 20012 10001 3506 3628 79 1.60E-21 [60]<br />
3659.3 02211 00001 3582 3715 82 1.93E-22 [50]<br />
3667.5 10021 00011 3606 3704 64 3.47E-23 [60]<br />
3676.7 30012 20002 3626 3711 55 7.09E-24 [60]<br />
3679.6 30013 20003 3622 3710 57 8.07E-24 [60]<br />
3692.4 20012 10002 3606 3731 81 3.64E-21 [60]<br />
3700.3 21112 11102 3629 3738 170 2.87E-22 [60]<br />
3711.5 20011 10001 3635 3757 79 2.93E-21 [60]<br />
3713.7 21111 11101 3648 3755 166 2.22E-22 [60]<br />
3726.6 12211 02201 3646 3770 208 4.68E-21 [60]<br />
3727.4 13311 03301 3662 3766 168 1.76E-22 [60]<br />
3799.5 30012 20003 3774 3819 24 1.35E-25 [60]<br />
3814.3 20011 10002 3753 3854 65 5.90E-23 [60]<br />
3858.1 21111 11102 3818 3888 87 1.84E-24 [60]<br />
4808.2 40002 01101 4758 4857 80 2.44E-23 [41]<br />
5061.8 12211 00001 4992 5112 69 4.47E-24 [41]<br />
5217.7 30011 10002 5176 5251 48 2.13E-24 [59]<br />
5247.8 10022 01101 5217 5271 61 1.37E-24 [59]<br />
5291.1 02221 01101 5248 5316 130 3.52E-24 [59]
ARTICLE IN PRESS<br />
162<br />
L.S. Rothman et al. / Journal of Quantitative Spectroscopy & Radiative Transfer 96 (2005) 139–204<br />
Table 9 (continued )<br />
Band center Upper vib Lower vib n min n max Number of Sum of line Ref.<br />
ðcm 1 Þ v 1 v 2 l 2 v 3 r v 1 v 2 l 2 v 3 r ðcm 1 Þ ðcm 1 Þ lines intensities<br />
5315.7 01121 00001 5251 5342 93 4.72E-23 [59]<br />
5349.3 10021 01101 5301 5357 43 5.77E-25 [59]<br />
5584.4 00031 10001 5541 5601 39 5.58E-25 [58]<br />
5687.2 00031 10002 5641 5703 40 6.31E-25 [58]<br />
6347.9 30012 00001 6271 6385 73 4.42E-22 [56]<br />
6387.9 41101 00001 6348 6430 45 2.45E-25 [41]<br />
8192.6 10032 00001 8099 8210 70 4.15E-23 [54]<br />
8294.0 10031 00001 8194 8310 71 6.18E-23 [54]<br />
16 O 12 C 18 O isotopologue<br />
966.3 00011 10001 918 997 108 2.01E-24 [51]<br />
1072.7 00011 10002 1020 1107 118 5.19E-24 [51]<br />
4639.5 00021 00001 4579 4663 115 1.44E-23 [57]<br />
16 O 12 C 17 O isotopologue<br />
586.9 11102 02201 548 626 294 4.23E-24 [41]<br />
607.6 20003 11102 578 640 123 5.41E-25 [41]<br />
607.6 10002 01101 554 659 208 1.05E-22 [53]<br />
644.4 11102 10002 601 693 183 1.74E-23 [41]<br />
650.0 12202 11102 620 685 244 1.27E-24 [41]<br />
665.1 02 2 0 1 0 1 1 0 1 614 726 427 9.55E-22 [41]<br />
681.4 12201 11101 656 712 208 6.17E-25 [41]<br />
686.1 11101 10001 643 732 178 1.12E-23 [41]<br />
711.3 10001 01101 659 765 210 1.30E-22 [53]<br />
713.5 20001 11101 688 742 105 3.07E-25 [41]<br />
724.5 20002 11102 700 749 89 1.90E-25 [41]<br />
732.3 11101 02201 691 771 302 4.94E-24 [41]<br />
748.1 12201 03301 733 749 72 9.72E-26 [41]<br />
789.8 11101 10002 762 821 114 4.08E-25 [41]<br />
964.0 00011 10001 925 991 85 4.00E-25 [51]<br />
1067.7 00011 10002 1024 1098 97 8.34E-25 [51]<br />
2306.7 11112 11102 2253 2342 258 1.17E-23 [41]<br />
2315.1 02211 02201 2246 2355 362 2.03E-22 [41]<br />
2317.3 10011 10001 2249 2356 141 8.20E-23 [41]<br />
2319.0 10012 10002 2249 2359 145 1.36E-22 [41]<br />
2327.6 01111 01101 2244 2370 434 5.20E-21 [41]<br />
16 O 13 C 17 O isotopologue<br />
2274.1 00011 00001 2198 2316 157 7.33E-22 [60]<br />
Note: Upper vib and Lower vib use the AFGL vibrational notation for carbon dioxide [5]. <strong>The</strong> sixth column indicates<br />
the number of lines that have been replaced in <strong>HITRAN</strong>. Units of the seventh column are cm 1 =ðmolecule cm 2 Þ.
ARTICLE IN PRESS<br />
L.S. Rothman et al. / Journal of Quantitative Spectroscopy & Radiative Transfer 96 (2005) 139–204 163<br />
Table 10<br />
Summary of CO 2 bands for which line-coupling data for the Q branches are available in the <strong>2004</strong> <strong>HITRAN</strong> edition<br />
Upper vib Lower vib n min n max Number<br />
v 1 v 2 l 2 v 3 r v 1 v 2 l 2 v 3 r (cm 1 ) (cm 1 ) of lines<br />
12 C 16 O 2 isotopologue<br />
20003 11101 469.0 471.5 70<br />
13302 12201 479.9 485.3 70<br />
12202 11101 508.2 514.9 70<br />
21103 20002 510.3 523.1 70<br />
21102 20001 542.2 544.0 70<br />
11102 10001 544.3 551.3 74<br />
14402 05501 555.5 557.8 70<br />
13302 04401 566.6 568.9 70<br />
21102 12201 571.1 578.6 70<br />
12202 03301 579.4 581.8 70<br />
22203 13302 579.5 581.4 70<br />
22203 13302 579.5 581.4 70<br />
20002 11101 585.2 594.3 70<br />
11102 02201 591.1 597.3 79<br />
21103 12202 591.8 597.7 70<br />
30003 21102 594.6 603.2 70<br />
10012 20001 605.0 608.8 70<br />
30004 21103 607.5 611.2 70<br />
10002 01101 610.4 618.0 90<br />
20003 11102 612.0 615.9 74<br />
21103 20003 633.1 639.4 70<br />
11112 10012 634.9 640.7 70<br />
22203 21103 640.5 646.8 70<br />
23303 22203 645.1 648.6 70<br />
11102 10002 647.1 655.7 84<br />
12202 11102 652.6 659.3 75<br />
01111 00011 654.9 659.9 70<br />
02211 01111 655.3 660.4 70<br />
13302 12202 655.6 659.1 70<br />
03311 02211 655.7 659.3 70<br />
14402 13302 657.7 661.1 70<br />
15502 14402 659.3 662.7 70<br />
01101 00001 667.4 678.0 102<br />
02201 01101 667.8 676.5 94<br />
03301 02201 668.1 673.4 86<br />
21102 20002 668.2 676.1 70<br />
04401 03301 668.5 672.5 76<br />
22202 21102 668.6 675.2 70<br />
05501 04401 668.8 672.2 70<br />
06601 05501 669.2 672.5 70<br />
11111 10011 675.8 681.4 70<br />
14401 13301 680.1 683.3 70<br />
13301 12201 681.5 685.0 70<br />
12201 11101 683.9 689.9 73<br />
11101 10001 688.7 696.5 84<br />
22201 21101 694.7 702.5 70<br />
21101 20001 703.5 708.7 70
ARTICLE IN PRESS<br />
164<br />
L.S. Rothman et al. / Journal of Quantitative Spectroscopy & Radiative Transfer 96 (2005) 139–204<br />
Table 10 (continued )<br />
Upper vib Lower vib n min n max Number<br />
v 1 v 2 l 2 v 3 r v 1 v 2 l 2 v 3 r (cm 1 ) (cm 1 ) of lines<br />
10011 01111 705.8 710.8 70<br />
10001 01101 713.3 720.8 92<br />
20001 11101 717.2 720.3 72<br />
30002 21102 718.0 724.9 70<br />
30001 21101 721.8 724.4 70<br />
20002 11102 728.1 738.7 72<br />
11101 02201 733.9 741.7 81<br />
21101 12201 734.6 741.7 70<br />
21102 12202 745.5 754.3 70<br />
30003 21103 747.5 761.1 70<br />
22201 13301 751.4 755.1 70<br />
12201 03301 753.2 757.5 70<br />
22202 13302 761.3 767.3 70<br />
13301 04401 766.3 770.5 70<br />
14401 05501 777.4 781.7 70<br />
21102 20003 791.0 792.3 70<br />
11101 10002 791.5 797.3 74<br />
12201 11102 827.8 832.6 70<br />
21101 20002 829.5 840.8 70<br />
13301 12202 857.2 858.9 70<br />
20001 11102 860.8 864.7 70<br />
01111 11101 908.2 927.2 70<br />
21101 12202 909.0 915.6 70<br />
01111 11102 1051.7 1071.5 70<br />
20003 01101 1879.2 1881.0 70<br />
21103 10002 1896.1 1904.9 70<br />
13302 02201 1905.5 1910.1 70<br />
12202 01101 1917.6 1923.5 70<br />
11102 00001 1932.5 1939.9 74<br />
21102 10001 1951.2 1955.5 70<br />
20002 01101 1995.4 2003.8 70<br />
21102 10002 2054.0 2057.8 70<br />
22202 11102 2074.4 2079.0 70<br />
11101 00001 2076.9 2084.6 80<br />
12201 01101 2093.3 2097.9 70<br />
13301 02201 2107.1 2109.9 70<br />
21101 10001 2112.5 2120.2 70<br />
14401 03301 2119.0 2121.5 70<br />
22201 11101 2120.5 2126.4 70<br />
30002 11102 2122.8 2131.8 70<br />
20001 01101 2127.5 2129.8 70<br />
30001 11101 2147.6 2148.2 70<br />
21101 02201 2159.9 2166.5 70<br />
22201 03301 2189.6 2194.1 70<br />
21101 10002 2215.3 2222.6 70<br />
05511 05501 2272.3 2286.7 70<br />
21113 21103 2273.1 2293.6 70<br />
21112 21102 2273.2 2293.4 70
ARTICLE IN PRESS<br />
L.S. Rothman et al. / Journal of Quantitative Spectroscopy & Radiative Transfer 96 (2005) 139–204 165<br />
Table 10 (continued )<br />
Upper vib Lower vib n min n max Number<br />
v 1 v 2 l 2 v 3 r v 1 v 2 l 2 v 3 r (cm 1 ) (cm 1 ) of lines<br />
13311 13301 2273.7 2288.4 70<br />
13312 13302 2276.1 2290.6 70<br />
02221 02211 2284.3 2299.2 70<br />
04411 04401 2284.5 2299.2 70<br />
12211 12201 2286.2 2301.0 70<br />
12212 12202 2288.1 2302.9 70<br />
11111 11101 2294.0 2313.8 70<br />
01121 01111 2294.1 2311.7 70<br />
11112 11102 2296.0 2315.2 70<br />
03311 03301 2296.8 2311.6 70<br />
02211 02201 2309.1 2324.1 70<br />
01111 01101 2315.2 2336.6 77<br />
21103 00001 3181.5 3191.0 70<br />
30003 01101 3266.1 3275.2 70<br />
21102 00001 3339.4 3344.0 70<br />
22202 01101 3340.5 3344.3 70<br />
30002 01101 3389.5 3396.9 70<br />
14412 04401 3491.7 3504.9 70<br />
21101 00001 3500.7 3508.7 70<br />
22213 12202 3503.4 3518.6 70<br />
13312 03301 3514.6 3528.0 70<br />
22201 01101 3530.0 3535.0 70<br />
21112 11101 3534.1 3555.9 70<br />
12212 02201 3539.2 3552.8 70<br />
30001 01101 3557.4 3558.0 70<br />
11112 01101 3562.8 3580.3 70<br />
21112 11102 3677.6 3700.3 70<br />
22212 12202 3686.3 3703.5 70<br />
21111 11101 3694.4 3713.7 70<br />
22211 12201 3699.2 3713.8 70<br />
11111 01101 3704.2 3723.2 70<br />
14411 04401 3710.7 3726.3 70<br />
12211 02201 3711.4 3726.6 70<br />
13311 03301 3712.0 3727.3 70<br />
01121 02201 3946.3 3980.5 70<br />
00021 01101 3970.3 4005.9 70<br />
31103 00001 4591.1 4601.3 70<br />
31102 00001 4753.5 4757.8 70<br />
22213 02201 4754.3 4768.5 70<br />
23312 03301 4926.1 4941.5 70<br />
22212 02201 4937.5 4953.4 70<br />
21112 01101 4944.4 4965.4 70<br />
21111 01101 5104.7 5123.2 70<br />
22211 02201 5124.1 5139.4 70<br />
10022 01101 5213.9 5247.8 70<br />
02221 01101 5263.1 5291.1 70<br />
01121 00001 5290.4 5315.7 70<br />
31113 01101 6174.5 6196.2 70
ARTICLE IN PRESS<br />
166<br />
L.S. Rothman et al. / Journal of Quantitative Spectroscopy & Radiative Transfer 96 (2005) 139–204<br />
Table 10 (continued )<br />
Upper vib Lower vib n min n max Number<br />
v 1 v 2 l 2 v 3 r v 1 v 2 l 2 v 3 r (cm 1 ) (cm 1 ) of lines<br />
31112 01101 6334.3 6356.3 70<br />
11122 00001 6515.1 6537.9 70<br />
11121 00001 6654.8 6679.7 70<br />
02231 02201 6852.7 6897.7 70<br />
01131 01101 6886.7 6935.1 70<br />
13 C 16 O 2 isotopologue<br />
11102 10001 526.5 537.0 70<br />
13302 04401 572.6 573.7 70<br />
12202 03301 584.2 585.3 70<br />
21103 12202 591.8 598.3 70<br />
11102 02201 595.9 600.7 70<br />
20002 11101 601.3 608.0 70<br />
20003 11102 608.6 611.0 70<br />
10002 01101 614.5 617.3 78<br />
21103 20003 619.8 626.1 70<br />
11102 10002 630.7 636.2 70<br />
12202 11102 635.1 640.6 70<br />
01111 00011 636.8 641.6 70<br />
13302 12202 637.7 641.0 70<br />
21102 20002 644.6 652.1 70<br />
01101 00001 648.5 656.5 90<br />
02201 01101 648.8 655.3 81<br />
03301 02201 649.1 652.3 70<br />
04401 03301 649.4 652.6 70<br />
05501 04401 649.7 652.9 70<br />
13301 12201 661.1 664.5 70<br />
12201 11101 663.2 668.6 70<br />
11101 10001 667.0 672.9 70<br />
21101 20001 683.2 688.9 70<br />
20001 11101 708.2 713.5 70<br />
10001 01101 713.2 721.6 76<br />
21101 12201 726.8 733.5 70<br />
11101 02201 732.5 739.8 70<br />
20002 11102 737.2 748.5 70<br />
13301 04401 760.3 765.7 70<br />
11101 10002 771.3 772.1 70<br />
12201 11102 800.1 805.3 70<br />
11102 00001 1896.5 1904.8 70<br />
20002 01101 1988.6 1996.6 70<br />
11101 00001 2037.1 2040.7 70<br />
12201 01101 2051.5 2054.7 70<br />
21101 10001 2063.7 2070.0 70<br />
13301 02201 2064.1 2065.4 70<br />
20001 01101 2095.5 2102.1 70<br />
21101 02201 2127.9 2136.5 70<br />
04411 04401 2222.6 2236.6 70<br />
12212 12202 2224.5 2239.3 70
ARTICLE IN PRESS<br />
L.S. Rothman et al. / Journal of Quantitative Spectroscopy & Radiative Transfer 96 (2005) 139–204 167<br />
Table 10 (continued )<br />
Upper vib Lower vib n min n max Number<br />
v 1 v 2 l 2 v 3 r v 1 v 2 l 2 v 3 r (cm 1 ) (cm 1 ) of lines<br />
11112 11102 2231.4 2250.7 70<br />
11111 11101 2231.7 2250.6 70<br />
03311 03301 2234.0 2248.3 70<br />
02211 02201 2245.4 2260.0 70<br />
01111 01101 2254.1 2271.8 70<br />
12212 02201 3461.5 3473.7 70<br />
11111 01101 3619.0 3639.2 70<br />
12211 02201 3625.2 3641.5 70<br />
13311 03301 3625.6 3641.6 70<br />
21112 01101 4850.9 4871.4 70<br />
21111 01101 4992.4 5013.8 70<br />
01121 00001 5144.2 5168.6 70<br />
16 O 12 C 18 O isotopologue<br />
11102 10001 535.9 539.0 70<br />
20002 11101 556.1 564.9 70<br />
12202 03301 558.0 561.1 70<br />
11102 02201 571.2 576.6 70<br />
10002 01101 591.2 597.0 72<br />
20003 11102 594.5 599.0 70<br />
11102 10002 642.3 648.2 70<br />
12202 11102 647.7 653.3 70<br />
01101 00001 662.4 669.8 88<br />
02201 01101 662.8 668.3 77<br />
03301 02201 663.2 666.5 70<br />
04401 03301 663.6 666.9 70<br />
12201 11101 678.9 684.0 70<br />
11101 10001 683.5 688.3 70<br />
10001 01101 700.4 703.5 75<br />
20002 11102 705.4 712.5 70<br />
20001 11101 706.0 707.8 70<br />
11101 02201 719.8 724.4 70<br />
12201 03301 736.9 739.9 70<br />
11101 10002 789.9 797.5 70<br />
11102 00001 1901.7 1906.9 70<br />
11101 00001 2049.3 2056.2 70<br />
12201 01101 2065.9 2071.2 70<br />
20001 01101 2094.7 2095.0 70<br />
11111 11101 2277.4 2296.8 70<br />
03311 03301 2281.0 2295.0 70<br />
11112 11102 2281.7 2299.4 70<br />
02211 02201 2293.1 2307.4 70<br />
01111 01101 2302.7 2319.7 70<br />
16 O 12 C 17 O isotopologue<br />
20002 11101 570.0 579.1 70<br />
11102 02201 581.6 586.8 70<br />
10002 01101 602.5 607.6 70
ARTICLE IN PRESS<br />
168<br />
L.S. Rothman et al. / Journal of Quantitative Spectroscopy & Radiative Transfer 96 (2005) 139–204<br />
Table 10 (continued )<br />
Upper vib Lower vib n min n max Number<br />
v 1 v 2 l 2 v 3 r v 1 v 2 l 2 v 3 r (cm 1 ) (cm 1 ) of lines<br />
20003 11102 603.2 607.6 70<br />
11102 10002 644.4 650.8 70<br />
12202 11102 650.0 655.6 70<br />
01101 00001 664.7 671.3 81<br />
02201 01101 665.1 670.0 70<br />
03301 02201 665.5 668.9 70<br />
12201 11101 681.4 686.5 70<br />
11101 10001 686.1 691.2 70<br />
10001 01101 707.6 711.3 70<br />
20001 11101 710.2 713.5 70<br />
20002 11102 715.6 724.5 70<br />
11101 02201 727.1 732.3 70<br />
12201 03301 744.5 748.1 70<br />
11101 10002 789.8 796.3 70<br />
11102 00001 1916.7 1923.0 70<br />
11101 00001 2062.1 2068.5 70<br />
02211 02201 2300.5 2315.1 70<br />
01111 01101 2310.7 2327.6 70<br />
11112 01101 3541.8 3558.7 70<br />
11111 01101 3684.7 3702.1 70<br />
16 O 13 C 18 O isotopologue<br />
10002 01101 598.2 601.6 70<br />
01101 00001 643.3 648.1 71<br />
02201 01101 643.7 648.2 70<br />
10001 01101 694.0 699.0 70<br />
02211 02201 2229.2 2242.8 70<br />
01111 01101 2238.3 2254.4 70<br />
16 O 13 C 17 O isotopologue<br />
10002 01101 606.7 609.6 70<br />
01101 00001 645.7 650.7 70<br />
02201 01101 646.1 650.9 70<br />
10001 01101 703.1 709.4 70<br />
01111 01101 2245.2 2262.4 70<br />
18 O 12 C 18 O isotopologue<br />
01101 00001 657.3 661.8 70<br />
02201 01101 657.8 662.0 70<br />
01111 01101 2285.9 2301.8 70<br />
17 O 12 C 18 O isotopologue<br />
01101 00001 659.7 664.2 70<br />
Note: For the non-symmetric isotopologues of CO 2 , the Q branch possesses both e- and f -type transitions for each J 00<br />
(none of the data are S S). In this case, line-coupling data are supplied for each transition type.
ARTICLE IN PRESS<br />
L.S. Rothman et al. / Journal of Quantitative Spectroscopy & Radiative Transfer 96 (2005) 139–204 169<br />
Table 11<br />
Summary of the ozone bands which have been updated in <strong>HITRAN</strong> or added from the MIPAS <strong>database</strong> [20]<br />
Upper vib Lower vib n min n max Number Sum of line<br />
v 1 v 2 v 3 v 1 v 2 v 3 ðcm 1 Þ ðcm 1 Þ of lines intensities<br />
16 O 16 O 16 O<br />
0 2 1 0 1 1 612 770 923 1.8824E-22<br />
1 2 0 1 1 0 629 766 668 1.1351E-22<br />
0 0 2 1 0 0 918 1048 981 3.1436E-21<br />
1 0 1 1 0 0 918 1181 2684 6.0065E-20<br />
1 0 2 1 0 1 921 1003 1148 7.9910E-22<br />
1 1 1 1 1 0 924 1018 1425 2.0344E-21<br />
0 0 1 0 0 0 928 1244 7416 1.3664E-17<br />
0 1 1 0 1 0 929 1218 3956 4.4570E-19<br />
0 0 3 1 0 1 931 1016 201 4.0176E-23<br />
2 0 1 2 0 0 931 1009 808 2.8433E-22<br />
0 1 2 1 1 0 931 1017 211 3.7350E-23<br />
0 0 2 0 0 1 932 1194 3268 1.6156E-19<br />
0 2 1 0 2 0 933 1062 2125 1.4700E-20<br />
0 0 3 0 0 2 934 1021 1388 1.6040E-21<br />
1 0 1 0 0 1 934 1202 2600 5.0402E-21<br />
0 1 2 0 1 1 935 1032 1797 5.8154E-21<br />
1 2 1 1 2 0 937 990 286 4.0473E-23<br />
1 1 2 1 1 1 939 969 26 2.4853E-24<br />
0 3 1 0 3 0 940 1019 961 4.6499E-22<br />
1 0 2 0 0 2 940 1015 214 4.6153E-23<br />
0 2 2 0 2 1 942 1009 670 1.8133E-22<br />
1 0 0 0 0 0 943 1273 6749 5.1954E-19<br />
0 1 3 0 1 2 944 993 264 3.5856E-23<br />
1 1 1 0 1 1 947 1091 267 6.2728E-23<br />
1 1 0 0 1 0 947 1233 3931 1.2249E-20<br />
2 0 0 1 0 0 955 1216 3022 3.1850E-21<br />
1 2 0 0 2 0 959 1179 1031 2.4030E-22<br />
2 0 0 0 0 1 976 1232 2100 8.0229E-21<br />
2 1 0 1 1 0 1084 1158 201 3.4255E-23<br />
2 0 1 0 0 2 1099 1160 427 7.9395E-23<br />
2 1 0 0 1 1 1130 1201 614 1.6078E-22<br />
3 0 0 1 0 1 1158 1210 212 2.7170E-23<br />
0 0 2 0 1 0 1319 1431 107 1.9842E-23<br />
0 2 0 0 0 0 1332 1495 1127 4.3259E-22<br />
1 0 1 0 1 0 1358 1435 1043 9.5455E-22<br />
0 1 1 0 0 0 1634 1927 3415 5.1506E-20<br />
0 2 1 0 1 0 1644 1749 1365 3.2891E-21<br />
1 1 0 0 0 0 1666 1963 3695 2.2823E-20<br />
1 2 0 0 1 0 1712 1877 1621 1.3196E-21<br />
0 0 3 1 0 0 1860 2094 1301 1.1896E-21<br />
0 0 4 1 0 1 1868 1905 91 9.6770E-24<br />
0 0 2 0 0 0 1882 2278 5339 1.0771E-19<br />
1 0 2 1 0 0 1885 2066 1182 3.7277E-22<br />
0 0 3 0 0 1 1894 2089 1923 1.4636E-21<br />
0 1 2 0 1 0 1902 2112 2577 3.0415E-21
ARTICLE IN PRESS<br />
170<br />
L.S. Rothman et al. / Journal of Quantitative Spectroscopy & Radiative Transfer 96 (2005) 139–204<br />
Table 11 (continued )<br />
Upper vib Lower vib n min n max Number Sum of line<br />
v 1 v 2 v 3 v 1 v 2 v 3 ðcm 1 Þ ðcm 1 Þ of lines intensities<br />
1 0 1 0 0 0 1913 2322 5865 1.1884E-18<br />
1 0 3 0 0 2 1924 1986 536 1.1492E-22<br />
1 1 1 0 1 0 1929 2221 2614 3.9287E-20<br />
2 0 0 0 0 0 1935 2322 5024 3.2412E-20<br />
0 0 4 0 0 2 1943 1982 20 2.4744E-24<br />
1 1 2 0 1 1 1962 2036 984 4.9302E-22<br />
1 0 2 0 0 1 1965 2067 2187 1.4125E-20<br />
0 1 3 0 1 1 1976 2032 67 8.5047E-24<br />
2 0 2 1 0 1 1992 2050 435 7.9399E-23<br />
0 2 2 0 2 0 1993 2067 209 3.2910E-23<br />
1 2 1 0 2 0 1995 2080 1307 1.2856E-21<br />
2 1 1 1 1 0 1999 2074 873 3.5388E-22<br />
2 0 1 1 0 0 1999 2133 1986 1.0015E-20<br />
1 3 1 0 3 0 2001 2043 134 1.4683E-23<br />
3 0 1 2 0 0 2012 2066 309 4.5660E-23<br />
2 0 1 0 0 1 2014 2206 1006 2.5377E-22<br />
3 0 0 1 0 0 2023 2280 904 2.1541E-22<br />
2 1 0 0 1 0 2065 2258 1722 7.4254E-22<br />
2 2 0 0 2 0 2136 2154 20 2.3853E-24<br />
3 0 0 0 0 1 2160 2303 1100 8.1572E-22<br />
0 2 1 0 0 0 2347 2430 886 3.9777E-22<br />
16 O 16 O 18 O<br />
0 0 1 0 0 0 954 1124 4343 5.0599E-20<br />
1 0 0 0 0 0 968 1178 6045 4.2543E-21<br />
1 0 1 0 0 0 2031 2114 2571 4.6343E-21<br />
16 O 18 O 16 O<br />
0 0 1 0 0 0 934 1071 2184 2.5550E-20<br />
1 0 0 0 0 0 969 1146 1018 4.7827E-22<br />
1 0 1 0 0 0 1988 2075 1424 2.3525E-21<br />
16 O 16 O 17 O<br />
0 0 1 0 0 0 968 1067 3314 9.5805E-21<br />
1 0 0 0 0 0 988 1158 1764 3.1376E-22<br />
1 0 1 0 0 0 2049 2122 1774 8.3593E-22<br />
16 O 17 O 16 O<br />
0 0 1 0 0 0 958 1057 1644 4.7081E-21<br />
1 0 0 0 0 0 986 1154 492 8.5858E-23<br />
1 0 1 0 0 0 2031 2101 861 4.0123E-22<br />
Note: An asterisk sign (*) in the column of the number of lines signifies that the corresponding band was absent in the<br />
<strong>HITRAN</strong> 2000 <strong>database</strong>. Units of the last column are cm 1 =ðmolecule cm 2 Þ.
ARTICLE IN PRESS<br />
L.S. Rothman et al. / Journal of Quantitative Spectroscopy & Radiative Transfer 96 (2005) 139–204 171<br />
For the self-broadened widths, we used the empirical polynomial expressions of Smith [73]<br />
based on experimental results for the n 1 ; n 2 ; n 2 þ n 3 ; n 1 þ n 3 , and 2n 3 bands [71,72,74]. For most<br />
transitions, where J 00 is not equal to K 00<br />
a<br />
, we used the following expression:<br />
g self ¼ 0:1064 7:46 10 6 JðJ þ 1Þ 1:40 10 4 K 2 , (2)<br />
for which J ¼ J 00 for DJp0, and J ¼ J 0 for DJ40, and where K ¼ K 00 for DK a ap0, and K ¼ K 0 a<br />
for DK a 40. Eq. (2) is applicable for J 00 up to at least 50, but with K 00<br />
ap13. Beyond these values, a<br />
constant value has been adopted from the last reliable combination of J 00 and K 00 . a<br />
For lines with J 00 ¼ K 00<br />
a<br />
, we adopted the following empirical formula:<br />
g self ¼ 0:1190 4:20 10 4 JðJ þ 1Þþ1:21 10 6 ðJðJ þ 1ÞÞ 2 . (3)<br />
Furthermore, Eq. (3) applies to J 00 p12 only. <strong>The</strong>re do not seem to be any measurements reported<br />
on J 00 ¼ K 00 transitions for a J00 412. Consequently, the value of g self for J 00 ¼ K 00<br />
a<br />
¼ 12 transitions<br />
has been assumed for J 00 ¼ K 00<br />
a<br />
lines at higher rotational quantum numbers.<br />
We used the polynomial expressions presented in Ref. [68] for the dependence of the air-widths<br />
upon temperature. <strong>The</strong> authors of Refs. [71,72] have also reported the dependence of the airbroadened<br />
widths upon temperature in the n 1 and n 2 bands. Drouin et al. [75] present a series of<br />
pressure-broadened widths, and of their dependence upon temperature, in the submillimeter<br />
region. <strong>The</strong>se data will be assessed for the next <strong>HITRAN</strong> edition.<br />
<strong>The</strong> mean values of the air-induced line shifts, 0:0007, 0:0008, 0:0007, 0:003, and<br />
0:008 cm 1 atm 1 , apply to the n 1 , n 2 , n 3 , n 1 þ n 3 , and 3n 3 bands, respectively. <strong>The</strong>se average<br />
values have been based upon Refs. [71,72,76,77], as no rotational quantum-number dependence of<br />
the pressure-induced line shifts has been ascertained with statistical significance from the presently<br />
available measurements.<br />
3.4. N 2 O (molecule 4)<br />
For nitrous oxide, the line list has been almost completely revised. For positions and<br />
intensities we have used the line list of Toth [78] that covers the five isotopologues present in<br />
<strong>HITRAN</strong> between 500 and 7500 cm 1 with a minimum line strength of 2:02 10 25 cm 1 /<br />
(molecule cm 2 ). Note that in this line list [78], the values of the bands centered below 900 cm 1<br />
come from Johns et al. [79] for the n 2 band of 14 N 2 16 O, and have been estimated [78] for the other<br />
bands, since research from the earlier work did not cover these bands. Furthermore, we replaced<br />
the line positions and intensities listed in Ref. [78] for the laser band (00 0 1-10 0 0) in the 10-mm<br />
region with the measurements by Daumont et al. [80], since both calculations [80,81] and new<br />
measurements [80], while in mutual agreement, show large differences with the data of Toth<br />
[78,82]. <strong>The</strong> line positions and intensities listed in the previous edition of <strong>HITRAN</strong> [1] have been<br />
retained for the lines in the 0–50 cm 1 region. Note that a recent work from Daumont et al. [83]<br />
has been performed between 3800 and 5300 cm 1 . More than 3000 line intensities have been<br />
measured in 66 bands, and 47 parameters of an effective dipole moment were fitted<br />
to experimental line intensities [83,84]. This work will be taken into account in a future<br />
<strong>HITRAN</strong> edition.<br />
For the air-broadened widths, a polynomial fit to the experimental results from Toth [85],<br />
Lacome et al. [86], and Nemtchinov et al. [87] has been used for all lines of all isotopologues. <strong>The</strong>
ARTICLE IN PRESS<br />
172<br />
L.S. Rothman et al. / Journal of Quantitative Spectroscopy & Radiative Transfer 96 (2005) 139–204<br />
expressions used for the air-broadened half-widths (in cm 1 atm 1 at 296 K) are<br />
g air ¼ 0:0964; 0pjmjp1, (4)<br />
g air ¼ 0:0964 1:72 10 3 jmjþ3:81 10 5 jmj 2 2:96 10 7 jmj 3 ; 2pjmjp67, (5)<br />
g air ¼ 0:0632; jmj467, (6)<br />
where the running index m is J 00 in the P-branch, J 00 in the Q-branch, and J 00 þ 1 in the R-branch.<br />
It should be emphasized that the formulae given as functions of jmj, which we have employed for<br />
the broadening parameters described here and throughout this article, are purely empirical and<br />
lack any physical interpretation.<br />
A polynomial fit to the measurements by Toth [82] has been used for the self-broadened halfwidths<br />
of all the lines of all of the isotopologues. <strong>The</strong> expressions used for the self-broadened halfwidths<br />
(in cm 1 atm 1 at 296 K) are<br />
g self ¼ 0:127; 0pjmjp1, (7)<br />
g self ¼ 0:1238 1:803 10 3 jmjþ2:54 10 5 jmj 2 1:4 10 7 jmj 3 ; 2pjmjp86, (8)<br />
g self ¼ 0:0676; jmj486. (9)<br />
An average value of 0.75 was assumed for the exponent n in the expression for the temperature<br />
dependence of the air-broadened half-width of every line, as is apparent from Refs. [86,87].<br />
An expression given in Ref. [78] for the air pressure-induced line shift parameters as a function<br />
of wavenumber and jmj has been used for all the lines excepting those located between 0 and<br />
45 cm 1 . Zero has been adopted as the default value for the latter (a reasonable assumption<br />
consistent with the usual vibrational dependence expected for pressure-induced line shifts).<br />
3.5. CO (molecule 5)<br />
Several updates are apparent in the current edition for carbon monoxide. For the first overtone<br />
of 12 C 16 O located near 2:4 mm, line intensities have been updated using the measurements of<br />
Brault et al. [88]. It is expected that a question may arise, quite rightfully so, as to our choice of<br />
Ref. [88] as the source for the intensities of this band, while several, just as recent and excellent,<br />
measurements by other authors [89,90] have appeared in the literature. Ref. [88] contains an<br />
appealing and authoritative discourse on the use of (a) a seemingly correct line shape, which,<br />
since it exhibits the dependence of the collision-broadening mechanism upon the relative speed<br />
of collision (‘‘speed dependent’’ line shape), is deemed preferable and (b) the effect of line<br />
mixing. <strong>The</strong> other two sources employed the conventional Voigt line shape, and the readers are<br />
left to judge the accuracy of the employment of the different line shapes by different authors.<br />
<strong>The</strong>se new results show that the line intensities of the previous <strong>HITRAN</strong> edition [1] were<br />
systematically larger by 4.2% than those of Ref. [88], as had already been pointed out by the<br />
authors of Refs. [89,90], where the measured intensities were reported to be 1 to 6% smaller than<br />
those reported in Ref. [1].<br />
In the case of the second overtone (3-0) of 12 C 16 O located around 1:6 mm, different groups<br />
[91–94] have shown that the intensity values that they measured were smaller than the entries in
ARTICLE IN PRESS<br />
L.S. Rothman et al. / Journal of Quantitative Spectroscopy & Radiative Transfer 96 (2005) 139–204 173<br />
previous edition of <strong>HITRAN</strong> by 5–7%. This observation was discussed at <strong>HITRAN</strong> conferences<br />
and other workshops. While the data in Refs. [93,94] are in concordance, we chose the calculated<br />
values of Sung and Varanasi [94], which were fitted to their experimental data, to update<br />
<strong>HITRAN</strong>.<br />
Recent laboratory measurements [89,94,95] of air-broadened widths agree in the fundamental,<br />
the first overtone, and the second overtone bands, with the discrepancies being within 2% for<br />
transitions with 3ojmjo19. Outside this range of values of m, the air-broadened half-widths<br />
listed in Ref. [1] were 3–10% smaller than the measured values. For this reason, we chose to<br />
update the air-broadened half-widths using a fourth-order polynomial [96] derived from fitting the<br />
measurements of Refs. [89,94,95,97]. <strong>The</strong> root mean square (RMS) error of this fit is about 1.3%.<br />
For 1pjmjp26, we used the following expression:<br />
g air ¼ 0:08555 6:385 10 3 jmjþ5:627 10 4 jmj 2 2:341 10 5 jmj 3 þ 3:457 10 7 jmj 4 .<br />
(10)<br />
Since the above expression results in air-broadened widths 5% larger than the previous <strong>HITRAN</strong><br />
values [1] for jmj near 26, to extrapolate beyond jmj ¼26 we multiplied the previous <strong>HITRAN</strong><br />
values by 1.05.<br />
<strong>The</strong> entries in Ref. [1] of self-broadened line widths and recently reported measured data<br />
[88–94,98–104] all agree within 5% for Jo25. However, in order to achieve better accuracy,<br />
especially for higher J values, a fourth-order polynomial fit [96] of the measurements of Refs.<br />
[89,90,92–94,98–107] has been used to update the self-broadened half-widths. <strong>The</strong> RMS of this fit<br />
is 2.5%. For 1pjmjp35, we used the following expression:<br />
g self ¼ 0:09130 5:295 10 3 jmjþ3:764 10 4 jmj 2 1:338 10 5 jmj 3 þ 1:649 10 7 jmj 4 .<br />
(11)<br />
For jmj435 we adopted a constant half-width equal to the value at jmj ¼35, 0:0413 cm 1 atm 1 .<br />
Average differences from the previous <strong>HITRAN</strong> edition [1] are þ3% for jmj6, 2% for<br />
jmj11–16, and 5% to 10% for jmj425.<br />
<strong>The</strong> exponent n air for the dependence of air-broadened half-widths has been updated for all CO<br />
transitions by means of a polynomial fit [96] of the measurements by Zou and Varanasi [89] in the<br />
1-0 and 2-0 bands and by Connor and Radford [97] for the 0-0 band. <strong>The</strong> RMS error between the<br />
polynomial approximation and experimental data is about 2.7%. <strong>The</strong>n, for 1pjmjp20, we used<br />
the fourth degree polynomial,<br />
n air ¼ 0:7900 0:0316jmjþ6:34 10 3 jmj 2 4:61 10 4 jmj 3 þ 1:04 10 5 jmj 4 . (12)<br />
For jmj420, where the measured values are sparse and more uncertain, we adopted a constant<br />
value of 0.67. <strong>The</strong> average difference from the entries in the previous <strong>HITRAN</strong> edition [1] is<br />
þ13%.<br />
Air pressure-induced line shifts of lines in the 1-0, 2-0 and 3-0 bands of 12 C 16 O have made their<br />
debut in the current edition of the <strong>database</strong>. <strong>The</strong> measurements by Zou and Varanasi [89] have<br />
been adopted for the lines in the P-branch for 1pjmjp23 and in the R-branch for 1pjmjp25 for<br />
the fundamental band. Beyond this range of jmj, we used constant values extrapolated from the<br />
measurements, 0:0035 cm 1 atm 1 in the P-branch and 0:0030 cm 1 atm 1 in the R-branch. For<br />
the lines in the first overtone band, we adopted the measurements by Zou and Varanasi [89] for
ARTICLE IN PRESS<br />
174<br />
L.S. Rothman et al. / Journal of Quantitative Spectroscopy & Radiative Transfer 96 (2005) 139–204<br />
1pjmjp19 in the P-branch and for 1pjmjp22 in the R-branch. Beyond this range of jmj, we<br />
used constant values extrapolated from the measurements, 0:0050 cm 1 atm 1 in the P-branch<br />
and 0:0052 cm 1 atm 1 in the R-branch. For the second overtone, the experimental values of<br />
Sung and Varanasi [94], who reported air pressure-induced line shifts ranging between 0:003 and<br />
0:009 cm 1 atm 1 , have been used in the range 1pjmjp18 in the P-branch and 1pjmjp21 in the<br />
R-branch. Outside this range, we used the constant values extrapolated from the measurements,<br />
0:0076 cm 1 atm 1 in the P-branch and 0:0080 cm 1 atm 1 in the R-branch. For the other<br />
bands, a zero value has been kept to indicate the lack of measurements.<br />
3.6. CH 4 (molecule 6)<br />
Some 48,000 methane parameters that appeared in <strong>HITRAN</strong> 2000 were completely replaced by<br />
updated linelists of over 240,000 lines. Most of the revisions made in the region from 0 to<br />
6185 cm 1 were described by Brown et al. [9] as the 2001 update (which was available on the<br />
<strong>HITRAN</strong> website). Calculated positions and intensities of 12 CH 4 and 13 CH 4 were all based on<br />
successful modeling of the dyad (n 2 , n 4 ) and pentad (2n 4 , n 2 þ n 4 , n 1 , n 3 ,2n 2 ). For the deuterated<br />
species 12 CH 3 D, bands in the fundamental regions of the triad (n 3 , n 6 , n 5 ) and nonad (n 2 , n 1 , n 4 plus<br />
six combination/overtone bands) were also calculated. To accommodate astronomy requirements,<br />
weak lines with intensities of 10 27 cm 1 =ðmolecule cm 2 Þ were included, along with hot bands in<br />
the dyad and pentad regions, resulting in a substantial increase in the number of transitions. Since<br />
at wavenumbers above 3400 cm 1 data were available for 12 CH 4 only, these data were based<br />
largely on empirical values, as were all the pressure-broadened half-widths. Additional details are<br />
given by Brown et al. [9].<br />
Following the update performed in 2001, two additional changes were made in the spectral<br />
region below 1600 cm 1 . In the pure-rotation region, the quantum number K of 12 CH 3 D had been<br />
omitted in the previous <strong>HITRAN</strong> editions and, so, a new line list was taken from the JPL catalog<br />
[15]. In the dyad region, a few of the air pressure-induced line shifts of 12 CH 4 were revised after<br />
the revelation of systematic errors by a comparison with the analysis of the atmospheric spectra<br />
obtained in the MIPAS experiment [20].<br />
A major improvement was also accomplished for the near-infrared parameters of the lines of<br />
CH 4 between 4800 and 9200 cm 1 . Firstly, 4937 line positions and intensities measured by Brown<br />
[108] in the 4800–5500 cm 1 region were used to replace the entries in Ref. [1] that were only for<br />
273 lines located between 4800 and 4938 cm 1 . Additionally, 35,320 measured positions and<br />
intensities of lines between 6180 and 9200 cm 1 have made their debut here. <strong>The</strong>se parameters<br />
were obtained using high-resolution laboratory spectra recorded with the McMath–Pierce Fourier<br />
transform spectrometer. <strong>The</strong> sum of the intensities for all these new lines is 7:09 <br />
10 20 cm 1 =ðmolecule cm 2 Þ near 296 K (which is slightly less than the intensity of the R(0)<br />
line of the n 3 -fundamental band). Nearly 99% of the new entries are unassigned, with most of the<br />
identified transitions belonging to the 4n 4 band near 2 mm, the n 2 þ 2n 3 band near 1:3 mm, and the<br />
3n 3 band near 1:1 mm. Without proper quantum assignments, a <strong>database</strong> cannot lead to an<br />
accurate prediction of methane’s spectra at temperatures that are significantly different from<br />
296 K. However, it is hoped that the availability of this list will aid in the development of new<br />
remote-sensing applications in the near-infrared and encourage efforts to interpret this portion of<br />
the methane spectrum. <strong>The</strong> prospects for future improvements are discussed by Brown et al. [9].
ARTICLE IN PRESS<br />
L.S. Rothman et al. / Journal of Quantitative Spectroscopy & Radiative Transfer 96 (2005) 139–204 175<br />
3.7. O 2 (molecule 7)<br />
<strong>The</strong> A bands of the isotopologues 18 O 16 O and 17 O 16 O are centered at 0:76 mm, and the line<br />
parameters in these bands have been updated. This band of 17 O 16 O was absent in the previous<br />
<strong>HITRAN</strong> edition [1]. <strong>The</strong> positions, the intensities, and the air- and self-broadened half-widths in<br />
that band have been added using the work of Camy-Peyret et al. [109]. For 18 O 16 O, only the<br />
positions have been updated, using Ref. [109].<br />
3.8. NO (molecule 8)<br />
In atmospheric applications in which non-local thermodynamic equilibrium (NLTE) needs to<br />
be considered, data on weak lines of nitric oxide with high lower-state energies are required. <strong>The</strong><br />
calculation by Goldman et al. [110] for 14 N 16 O has been adopted for the high-v (vibrational) and<br />
high-J transitions; according to this calculation, the weakest line intensity of this file is equal to<br />
1:5 10 95 cm 1 =ðmolecule cm 2 Þ at the standard reference temperature of 296 K in the<br />
<strong>database</strong>. <strong>The</strong> line positions and intensities from this calculation have been used to replace the<br />
previous parameters calculated by Gillis and Goldman [111]. Furthermore, this calculation has<br />
also resulted in the enhancement of the previous version of <strong>HITRAN</strong> [1] in terms of the addition<br />
of transitions with high-J values of existing bands, and also transitions of 243 new highvibrational<br />
bands including forbidden bands. <strong>The</strong> maximum values for the vibrational and<br />
rotational quantum numbers are now v ¼ 14 and J ¼ 126 for the bands updated from Ref. [110].<br />
<strong>The</strong> 2 P 1=2<br />
electronic state (denoted X1/2 in the ‘‘global’’ quanta field, see Table 3, Class 3), has<br />
J ¼ N 1, whereas the 2 P<br />
2 3=2<br />
electronic state (denoted X3/2), has J ¼ N þ 1.<br />
2<br />
In addition, the air-broadened half-widths have been updated for all bands with DvX0 (except<br />
for the bands with Dv ¼ 2) by using algorithms deduced from Refs. [112,113] that were previously<br />
[1] used only for the fundamental and the hot band (2-1). For the 3 components and for mo26:5<br />
2<br />
g air ¼ 0:06850 1:89 10 3 jmjþ1:03 10 4 jmj 2 2:57 10 6 jmj 3 , (13)<br />
with the default value 0:045 cm 1 atm 1 for mX26:5.<br />
For the 1 components and for mo26:5<br />
2<br />
g air ¼ 0:06818 2:61 10 3 jmjþ1:58 10 4 jmj 2 3:71 10 6 jmj 3 , (14)<br />
with the default value 0:045 cm 1 atm 1 for mX26:5. For Dv ¼ 2 bands, we retained the <strong>HITRAN</strong><br />
[1] algorithms based on Refs. [114–116].<br />
For the self-broadened widths of all lines of all of the isotopologues, polynomial expressions<br />
were deduced from the measurements by Pine et al. [116] for the 2-0 band. <strong>The</strong> dependence of the<br />
widths upon vibrational quantum numbers was neglected in the application of the data to other<br />
vibrational bands. But a difference was introduced between the 1 1<br />
and 3 3<br />
sub-bands, as<br />
2 2 2 2<br />
observed by Pine et al. [116]. <strong>The</strong> widths of the 1 1<br />
sub-band were extrapolated to the 3 1<br />
2 2 2 2<br />
forbidden sub-band, and those of the 3 3<br />
sub-band were extrapolated to the 1 3<br />
forbidden subband.<br />
<strong>The</strong> self-broadened half-widths were calculated using the following least squares fits, which<br />
2 2 2 2<br />
were performed on Pine’s experimental data (in cm 1 atm 1 ) at 296 K:<br />
For the 1 1<br />
and 3 1<br />
sub-bands:<br />
2 2 2 2<br />
g self ¼ 0:075 3:05 10 3 jmjþ1:94 10 4 jmj 2 4:09 10 6 jmj 3 ; jmjp17:5, (15)
ARTICLE IN PRESS<br />
176<br />
L.S. Rothman et al. / Journal of Quantitative Spectroscopy & Radiative Transfer 96 (2005) 139–204<br />
g self ¼ 0:0596; jmjX18:5. (16)<br />
For the 3 3<br />
and 1 3<br />
sub-bands:<br />
2 2 2 2<br />
g self ¼ 0:0748 1:48 10 3 jmjþ4:73 10 5 jmj 2 ; jmjp15:5, (17)<br />
g self ¼ 0:0629; jmjX16:5. (18)<br />
<strong>The</strong> dependence of g air upon temperature is given in terms of an analysis of the values of the<br />
exponent n air , which was based on the measurements [117] of the N 2 -broadened half-widths. <strong>The</strong><br />
values from this analysis have been adopted for all of the lines of all of the isotopologues. <strong>The</strong>y<br />
are jmj-dependent until J 00 ¼ 16:5 (with a constant value for J 00 416:5) and are summarized for the<br />
2 P 1=2<br />
and 2 P 3=2<br />
components in Table 12.<br />
<strong>The</strong> previous <strong>HITRAN</strong> edition [1] had contained air pressure-induced line shifts reported in Ref.<br />
[113] for Dv ¼ 1 transitions and in Ref. [118] for Dv ¼ 2 transitions, but included some interchanges<br />
of data between the two bands. <strong>The</strong>se mistakes have been corrected in the current edition.<br />
3.9. SO 2 (molecule 9)<br />
<strong>The</strong>re are no modifications made in the line parameters since the previous edition of <strong>HITRAN</strong><br />
[1]. However, a calculated line list in the 8-mm region by Chu et al. [119] shows considerable<br />
differences from <strong>HITRAN</strong> [1]. In the n 1 band, the line intensities in <strong>HITRAN</strong> have been found to<br />
be larger by about 15%, on the average, while in the n 3 band, they are too large by 10–20%<br />
Table 12<br />
Summary of temperature-dependence exponents n air for air-broadened half-widths of NO used in <strong>HITRAN</strong> <strong>2004</strong> for<br />
lower levels corresponding to the 2 P 1=2<br />
and 2 P 3=2<br />
components<br />
jmj<br />
n air<br />
2 P 1=2 2 P 3=2<br />
0.5 0.79 0.74<br />
1.5 0.79 0.74<br />
2.5 0.78 0.74<br />
3.5 0.69 0.68<br />
4.5 0.71 0.63<br />
5.5 0.70 0.67<br />
6.5 0.64 0.65<br />
7.5 0.69 0.67<br />
8.5 0.73 0.73<br />
9.5 0.70 0.64<br />
10.5 0.68 0.70<br />
11.5 0.70 0.71<br />
12.5 0.67 0.68<br />
13.5 0.72 0.66<br />
14.5 0.63 0.83<br />
15.5 0.63 0.74<br />
16.5 0.51 0.67<br />
X 17.5 0.60 0.70
ARTICLE IN PRESS<br />
L.S. Rothman et al. / Journal of Quantitative Spectroscopy & Radiative Transfer 96 (2005) 139–204 177<br />
depending upon the rotational quantum numbers. This calculated line list should be available<br />
upon request from the authors. It should be noted that the results of Ref. [119] were corroborated<br />
by recent measurements of Sumpf [120]. Henningsen [121] has recently reported line intensities<br />
and self-broadened widths in the n 3 band, and that the modeling for both the line intensities and<br />
the self-broadened widths appeared to be in good agreement with the data of Refs. [119,120].<br />
3.10. NO 2 (molecule 10)<br />
As was pointed out in the work of Perrin et al. [14], the coding of the rotational quantum<br />
numbers N, K a , K c , J and F has been defined differently for nitrogen dioxide depending on<br />
spectral regions. In the present edition, the coding for these quantum numbers has been<br />
standardized according to Ref. [14]. For all nitrogen dioxide bands in <strong>HITRAN</strong> <strong>2004</strong>, we use N<br />
instead of J, i.e., in the field of J (see Table 4) we put the N quantum number. In the sym field, we<br />
use the following convention for all lines: þ or signifying respectively that J ¼ N þ 1 2 or N 1 2 .<br />
Finally, in the field of F, we put F instead of F J as had been done previously [1].<br />
No new analyses of positions and intensities were included, but the air-broadened half-widths,<br />
the air pressure-induced shifts, and the exponent for the temperature dependence of the airbroadened<br />
half-widths were revised throughout the <strong>database</strong> for nitrogen dioxide using empirical<br />
expressions and measurements by Benner et al. [122]. In this study, multispectrum retrievals of<br />
over 1000 transitions of n 3 were performed by placing constraints on spin-doubled transition pairs<br />
in order to improve the precision of the measurements. <strong>The</strong> experimental accuracies were thought<br />
to be 3% or better due to the agreement with other studies, as shown in Ref. [122]. <strong>The</strong> widths,<br />
and, to some extent, the pressure-induced shifts, were found to vary smoothly as a function of the<br />
quantum numbers and so quadratic functions were used at each K a to reproduce the measured<br />
widths and shifts. For pressure-induced shifts, the value computed from the constants was scaled<br />
by the ratio of the band center of the transition to that of n 3 . No pattern was discerned for the airbroadening<br />
temperature dependence exponents, and a simple linear equation in m (in this case<br />
m ¼ N 00 for P and Q branch transitions and N 00 þ 1 for R-branch transitions) was fit to these<br />
measurements. For selected widths, the RMS deviation was 2.5%. Based on these results, we<br />
updated the air-broadened half-widths and pressure shifts for all NO 2 transitions. For n 3<br />
transitions, individual measurements of the half-widths, pressure-induced shifts and the<br />
temperature dependence of the widths were inserted on a line-by-line basis. For all other<br />
transitions, the empirical expressions were used.<br />
3.11. NH 3 (molecule 11)<br />
<strong>The</strong>re are no changes in the line parameters of ammonia since the previous edition of <strong>HITRAN</strong><br />
[1]. <strong>The</strong> current status of this molecule and prospects for improvements were discussed by Kleiner<br />
et al. [123].<br />
3.12. HNO 3 (molecule 12)<br />
Several updates have been introduced in the case of nitric acid in the current edition. Recently,<br />
Zu et al. [124] showed in the 683 GHz region a comparison between an observed spectrum and the
ARTICLE IN PRESS<br />
178<br />
L.S. Rothman et al. / Journal of Quantitative Spectroscopy & Radiative Transfer 96 (2005) 139–204<br />
calculations using both the JPL catalog [15] and the previous <strong>HITRAN</strong> <strong>database</strong> [1], and<br />
concluded that the calculation based upon the JPL catalogue was more accurate than that using<br />
<strong>HITRAN</strong>. <strong>The</strong>refore, the older line list for the pure-rotation band in <strong>HITRAN</strong> [1], which covered<br />
the 0–43 cm 1 region, has been replaced by the line list of the JPL catalog [15] which, furthermore,<br />
extends the spectral coverage to 0–84 cm 1 .<br />
In the far infrared, two hot bands, 2n 9 –n 9 and n 5 –n 9 , have been added. Line positions are from a<br />
simulation based on analyses of rotational spectra [125], in which intensities were scaled relative to<br />
those in the n 9 fundamental using both laboratory and atmospheric spectra [125].<br />
<strong>The</strong> intensities of the n 5 and 2n 9 bands have been normalized based on an accurate analysis of<br />
the 11-mm region using new laboratory high-resolution Fourier transform spectra [126]. <strong>The</strong><br />
individual line intensities of the n 5 and 2n 9 bands given in <strong>HITRAN</strong> have been multiplied by the<br />
factor 0.879.<br />
<strong>The</strong> two hot bands, n 5 þ n 9 n 9 and 3n 9 n 9 , located at 885.424 and 830:6cm 1 , respectively,<br />
have been updated. <strong>The</strong>se two bands had been removed from <strong>HITRAN</strong> 96 [127] and replaced by<br />
the hot band n 5 þ n 9 n 9 from Goldman et al. [128] in <strong>HITRAN</strong> 2000 [1]. In the current edition,<br />
the 3n 9 n 9 band has been added using the line positions and intensities from Refs. [20,129]. In the<br />
n 5 þ n 9 n 9 band, which is the most commonly used for the retrieval of HNO 3 in the atmosphere,<br />
the positions and the intensities have been updated from Ref. [130].<br />
Chackerian et al. [131] compared their measurements of the integrated absorption crosssections<br />
with the entries in the 2000 edition of <strong>HITRAN</strong> that were based on Ref. [132], and<br />
showed in Table 4 of their article important differences in the two data sets. Using updates<br />
described above for the n 5 ,2n 9 , n 5 þ n 9 n 9 and 3n 9 n 9 bands, the sum of line intensities between<br />
820 and 950 cm 1 , multiplied by 1.29955 (see Ref. [131]), is 2:446 10 17 cm 1 =ðmolecule cm 2 Þ,<br />
which is in good agreement with 2:424 10 17 cm 1 =ðmolecule cm 2 Þ given in Ref. [131],<br />
thereby confirming that the updates described above are indeed an improvement over the previous<br />
edition [1]. However, we find in the 1160–1240 and 1240–1400 cm 1 regions a large difference<br />
between the sum of <strong>HITRAN</strong> values of the intensities and the cross-sections reported by<br />
Chackerian et al. (see Table 4 of Ref. [131]). A scaling factor of 1.066 was determined by<br />
comparing the sum of the integrated cross-sections of Ref. [131] with the previous <strong>HITRAN</strong><br />
intensities in the 1240–1400 cm 1 region. For the 1160–1240 cm 1 spectral region, because<br />
<strong>HITRAN</strong> does not contain the n 6 þ n 7 band, the cross-sections of Ref. [131] cannot be used to<br />
rescale <strong>HITRAN</strong> intensities. <strong>The</strong>refore, the same scaling factor derived from the 1240–1400 cm 1<br />
region was applied to the <strong>HITRAN</strong> 2000 line intensities in the n 3 and n 4 bands to obtain the<br />
current <strong>HITRAN</strong> intensities.<br />
In a recent study, Boone and Bernath [133] have performed the retrievals of the volumetric<br />
mixing ratios of nitric acid from the spectra observed in the Atmospheric Chemistry Experiment<br />
(ACE). <strong>The</strong> retrievals were of tropical occultation, Arctic occultation, and a northern<br />
mid-latitude occultation taken in <strong>2004</strong>. Comparisons are presented in Fig. 3 using both the<br />
<strong>HITRAN</strong> 2000 edition [1] and the current edition. For the three prominent bands of HNO 3<br />
studied, it can be seen that the application of the new edition of <strong>HITRAN</strong> has reduced<br />
discrepancies significantly.<br />
Prior to this edition, the self-broadened half-widths were set equal to zero for most of the lines<br />
of nitric acid. We have now assigned a constant value of 0:8cm 1 atm 1 of this parameter for all of<br />
the lines. This value was chosen following Refs. [124,134].
ARTICLE IN PRESS<br />
L.S. Rothman et al. / Journal of Quantitative Spectroscopy & Radiative Transfer 96 (2005) 139–204 179<br />
altitude (km)<br />
(a)<br />
40<br />
35<br />
30<br />
25<br />
20<br />
15<br />
870 cm -1<br />
10<br />
1330 cm -1<br />
5<br />
1700 cm -1<br />
0<br />
0 5<br />
10 15<br />
Volume mixing ratio (ppb by volume)<br />
3.13. OH (molecule 13)<br />
Line intensities and positions have been updated in the pure rotation bands, X 2 P 1=2<br />
ðv 0 ¼ 0Þ—<br />
X 2 P 1=2<br />
ðv 00 ¼ 0Þ, X 2 P 3=2<br />
ðv 0 ¼ 0Þ—X 2 P 3=2<br />
ðv 00 ¼ 0Þ and X 2 P 1=2<br />
ðv 0 ¼ 0Þ—X 2 P 3=2<br />
ðv 00 ¼ 0Þ, of the two<br />
isotopologues 18 OH and OD based on Ref. [15]. It should be noted that the hyperfine structure of<br />
the lines had been reported in <strong>HITRAN</strong> [1] for both of these isotopologues. Furthermore,<br />
hyperfine structure has been added for many lines of the X 2 P 1=2<br />
ðv 0 ¼ 0Þ—X 2 P 1=2<br />
ðv 00 ¼ 0Þ,<br />
X 2 P 1=2<br />
ðv 0 ¼ 1Þ—X 2 P 1=2<br />
ðv 00 ¼ 1Þ, X 2 P 1=2<br />
ðv 0 ¼ 2Þ—X 2 P 1=2<br />
ðv 00 ¼ 2Þ, X 2 P 1=2<br />
ðv 0 ¼ 0Þ—X 2 P 3=2<br />
ðv 00 ¼ 0Þ,<br />
X 2 P 3=2<br />
ðv 0 ¼ 0Þ—X 2 P 3=2<br />
ðv 00 ¼ 0Þ, X 2 P 1=2<br />
ðv 0 ¼ 1Þ—X 2 P 3=2<br />
ðv 00 ¼ 1Þ, X 2 P 3=2<br />
ðv 0 ¼ 1Þ—X 2 P 3=2<br />
ðv 00 ¼ 1Þ,<br />
X 2 P 1=2<br />
ðv 0 ¼ 2Þ—X 2 P 3=2<br />
ðv 00 ¼ 2Þ, and X 2 P 3=2<br />
ðv 0 ¼ 2Þ—X 2 P 3=2<br />
ðv 00 ¼ 2Þ bands of 16 OH by drawing<br />
upon the work of Goldman et al. [135]. <strong>The</strong> predicted line positions used in the current edition of<br />
<strong>HITRAN</strong> for high J and high v ðv43Þ transitions could be improved using the recent work of<br />
Colin et al. [136]. For the air-broadened half-widths and their temperature dependence, we used<br />
the data reported in Ref. [127] for 16 OH.<br />
3.14. HF (molecule 14)<br />
40<br />
35<br />
30<br />
25<br />
20<br />
15<br />
10<br />
5<br />
870 cm -1<br />
1330 cm -1<br />
1700 cm -1<br />
0<br />
0 5<br />
10 15<br />
(b)<br />
Volume mixing ratio (ppb by volume)<br />
altitude (km)<br />
Fig. 3. Atmospheric HNO 3 profiles from an Arctic occultation in February <strong>2004</strong> by the Atmospheric Chemistry<br />
Experiment [133], retrieved using three different bands of HNO 3 . (a) Retrieval using the <strong>HITRAN</strong> 2000 <strong>database</strong> [1]. (b)<br />
Retrieval using <strong>HITRAN</strong> <strong>2004</strong> line parameters.<br />
<strong>The</strong> line parameters of hydrogen fluoride have not undergone a revision and remain the same as<br />
in the previous edition of <strong>HITRAN</strong> [1].
ARTICLE IN PRESS<br />
180<br />
L.S. Rothman et al. / Journal of Quantitative Spectroscopy & Radiative Transfer 96 (2005) 139–204<br />
3.15. HCl (molecule 15)<br />
<strong>The</strong>oretically, the hyperfine structure is defined for hydrogen chloride as the coupling between<br />
the total angular momentum (excluding the nuclear spins) and the nuclear spins I(Cl) and I(H).<br />
Normally, the hyperfine quantum number F is equal to the vectorial summation of J, I(Cl) and<br />
I(H). In the previous <strong>HITRAN</strong> edition [1], in the-pure-rotation region, the coupling with I(H) was<br />
unresolved, and hence the lines were listed with the F 00 quantum number, an integer which is the<br />
vectorial sum of J and I(Cl) only. In the pure-rotation region, the line list in the current edition is<br />
a combination of the JPL catalog [15] and the previous edition of <strong>HITRAN</strong> [1]. <strong>The</strong> hyperfine<br />
lines R(0)–R(15) in the 0-0-band of H 35 Cl are from the JPL catalog, and we retained the<br />
R(16)–R(21) lines from the previous <strong>HITRAN</strong> edition [1] and the hyperfine structure was<br />
unresolved in these lines. <strong>The</strong> same procedure has been done for the 0-0 band of H 37 Cl. For the 1-<br />
1 bands of the two isotopologues, we kept the data that were in the previous <strong>HITRAN</strong> edition,<br />
which are very similar to those in the JPL catalog [15].<br />
3.16. HBr (molecule 16)<br />
<strong>The</strong> line parameters of hydrogen bromide line parameters remain the same as those in the<br />
previous edition of <strong>HITRAN</strong> [1].<br />
3.17. HI (molecule 17)<br />
<strong>The</strong> line parameters of hydrogen iodide are the same as in the previous edition of <strong>HITRAN</strong> [1].<br />
<strong>The</strong> recent work of Bulanin et al. [137], which was mentioned in Ref. [138] that describes the status<br />
of the <strong>spectroscopic</strong> parameters of HBr and HI in the year 2000, is now available. It presents new<br />
intensities and line widths in the fundamental band of HI.<br />
3.18. ClO (molecule 18)<br />
<strong>The</strong> line parameters of chlorine monoxide remain the same as those listed in the previous<br />
edition of <strong>HITRAN</strong> [1].<br />
3.19. OCS (molecule 19)<br />
Recently performed high-resolution line intensity measurements in the 3- to 5-mm regionofthe<br />
spectrum of the main isotopologue of carbonyl sulfide by Régalia-Jarlot et al. [139] showed<br />
discrepancies with entries in the previous edition of <strong>HITRAN</strong> [1]. In particular, the line intensities<br />
measured by Régalia-Jarlot et al. for the n 3 band of 16 O 12 C 32 S are, on the average, 12.4% higher<br />
than those that were compiled in <strong>HITRAN</strong> [1]. This discrepancy has also been confirmed by<br />
Vander Auwera et al. [140] recently. <strong>The</strong> value of the square of the vibrational transition dipole<br />
moment measured by the authors of Ref. [139] is 0.1313 ðDebye 2 Þ, while the value measured by<br />
authors of Ref. [140] is 0.1380 ðDebye 2 Þ. It should be noted that the intensities measured by<br />
Régalia-Jarlot et al. exhibited a dependence on the rotational quantum number, whereas Vander<br />
Auwera et al. had not found it in their measurements. <strong>The</strong> value of 0.1313 ðDebye 2 Þ given in
ARTICLE IN PRESS<br />
L.S. Rothman et al. / Journal of Quantitative Spectroscopy & Radiative Transfer 96 (2005) 139–204 181<br />
Ref. [139] corresponds to J ¼ 0. Because of the significant difference with <strong>HITRAN</strong> and despite the<br />
disagreement on the rotational dependence of the vibrational transition dipole moment, we decided<br />
to update the line intensities in the current edition using the average of the values taken from Refs.<br />
[139,140], i.e., 0.1346 ðDebye 2 Þ. In this update we neglected the dependence on J of the vibrational<br />
transition dipole moment, in agreement with the predictions of the global model of Rbaihi et al.<br />
[141]. In addition, we updated the line intensities of the n 1 þ n 3 band located around 2900 cm 1<br />
according to the work of Régalia-Jarlot et al. [139], as entries in the previous edition of <strong>HITRAN</strong><br />
[1] were found to be high by about 12%. Such a change is in agreement with recent measurements<br />
by Vander Auwera et al. [140]. In the cases of the 3n 1 and 2n 1 þ 2n 2 bands around 3:8 mm, the<br />
intensities reported by Régalia-Jarlot et al. [139] are lower than <strong>HITRAN</strong> [1] by 7.6% and 7.4%,<br />
respectively. However, since the data of Strugariu et al. [142] are in good agreement with the<br />
intensities listed in <strong>HITRAN</strong> [1], we have not revised the data on these bands in the current edition.<br />
Line intensities in the 2n 3 band of 16 O 12 C 32 S were also updated by adopting the data of Bermejo et<br />
al. [143]. <strong>The</strong> revised intensities are 7% higher than those in the previous edition of <strong>HITRAN</strong> [1].<br />
3.20. H 2 CO (molecule 20)<br />
<strong>The</strong> line parameters of formaldehyde remain the same as in the previous edition of <strong>HITRAN</strong><br />
[1]. However, a new analysis of the n 2 ; n 3 ; n 4 and n 6 bands yielding line positions and intensities in<br />
the 5–10 mm region has been reported by Perrin et al. [144]. This work will be considered for<br />
inclusion in a future edition of <strong>HITRAN</strong>.<br />
3.21. HOCl (molecule 21)<br />
<strong>The</strong> positions and intensities of the pure rotation lines of hypochlorous acid corresponding to<br />
transitions in its ground state were updated, and transitions within the (001) level were added by<br />
adopting the data from Ref. [145].<br />
<strong>The</strong> parameters were updated in the n 2 bands of HO 35 Cl and HO 37 Cl that are located in the<br />
1178–1321 cm 1 region by adopting the results reported in Ref. [146]. Furthermore, the airbroadened<br />
half-width of all of the lines in the n 2 band was set to the average of the measured<br />
values reported for two lines by Shorter et al. [147], i.e., 0:1cm 1 atm 1 . <strong>The</strong> previously used<br />
default value 0.5 for the exponent n air in the relation for the dependence of the air-broadened halfwidths<br />
upon temperature was replaced by 0.7.<br />
3.22. N 2 (molecule 22)<br />
<strong>The</strong> line parameters of nitrogen have not been revised. It has been remarked in Ref. [148] that<br />
the intensities may be erroneous by about 2%, and additional measurements need to be<br />
performed on these quadrupole lines at 4:3 mm.<br />
3.23. HCN (molecule 23)<br />
A major update has been accomplished for the hydrogen cyanide line list. Line positions and<br />
intensities throughout the infrared have been revisited by Maki et al. [149]. <strong>The</strong> improvements
ARTICLE IN PRESS<br />
182<br />
L.S. Rothman et al. / Journal of Quantitative Spectroscopy & Radiative Transfer 96 (2005) 139–204<br />
apply to the three isotopologues present in <strong>HITRAN</strong> in the pure-rotation region and in the<br />
infrared from 500 to 3425 cm 1 . This work has greatly increased the amount of HCN data in<br />
<strong>HITRAN</strong> from 772 transitions in the 2000 edition [1] to 4253 transitions in the present edition.<br />
However, transitions appearing at wavenumbers larger than 3425 cm 1 have not been considered.<br />
Air-broadened half-widths, self-broadened half-widths, the exponent in the formula for the<br />
temperature dependence of the air-broadened half-width, and air pressure-induced line shifts have<br />
been updated using polynomials that were fit to the data reported by Devi et al. [150,151] and<br />
Rinsland et al. [152].<br />
<strong>The</strong> polynomial used for air-broadened half-widths of lines with jmjp29 is<br />
g air ¼ 0:1583 0:01102jmjþ7:78 10 4 jmj 2 2:43 10 5 jmj 3 þ 2:65 10 7 jmj 4 . (19)<br />
For jmj429, a constant air-broadened half-width of 0:088 cm 1 atm 1 has been used. Eq. (19) has<br />
been obtained by fitting 114 measurements, obtained for the n 1 band [152] and the 2n 2 band [151],<br />
which do not show any apparent vibrational dependence. Eq. (19) has thus been applied for all<br />
bands of the three isotopologues.<br />
<strong>The</strong> following polynomial has been adopted for the self-broadened half-widths of lines with jmj<br />
between 1 and 32:<br />
g self ¼ 0:404 þ 0:177jmj 7:49 10 3 jmj 2 5:5 10 4 jmj 3 þ 3:42 10 5 jmj 4<br />
4:79 10 7 jmj 5 . ð20Þ<br />
For jmj432, a constant self-broadened half-width of 0:15 cm 1 atm 1 has been used. Eq. (20) has<br />
been obtained by fitting 67 measurements obtained for the n 1 band [150]. In the absence of any<br />
experimental evidence that there is a dependence of the self-broadened line widths on vibrational<br />
quantum numbers [150,151], Eq. (20) has been applied for all of the lines in all of the bands listed<br />
in the <strong>database</strong> for the three isotopologues.<br />
<strong>The</strong> temperature-dependence of air-broadened half-widths has been updated using the<br />
following polynomial for the exponent n air by fitting 52 measurements in the n 1 band [152]:<br />
n air ¼ 0:8185 0:0415jmjþ7:79 10 3 jmj 2 4:54 10 4 jmj 3 þ 8:31 10 6 jmj 4 . (21)<br />
<strong>The</strong> latter polynomial has been used for all bands of the three isotopologues of HCN for<br />
transitions between jmj ¼1 and jmj ¼22. Above jmj ¼22, a constant value of 0.79 has been<br />
adopted.<br />
Different polynomials have been used for the air pressure-induced line shifts in the P- and R-<br />
branches of the n 1 and 2n 2 bands of H 12 C 14 N. For the n 1 band, we used the following expressions:<br />
d P air ¼ 2:897 10 3 3:18 10 4 jmjþ2:29 10 5 jmj 2 4:67 10 7 jmj 3 , (22)<br />
d R ¼ 1:57 10 4 air<br />
5:15 10 4 jmjþ2:17 10 5 jmj 2 4:24 10 7 jmj 3 . (23)<br />
Eq. (22) is the result of obtaining the best fit of the measurements [152] on the lines with jmjp29.<br />
For jmj429, the constant value of 0:0044 cm 1 atm 1 has been adopted. Eq. (23) has been<br />
obtained by fitting measurements [152] on lines with jmjp27. For jmj427, the constant value of<br />
0:0065 cm 1 atm 1 has been adopted. For the 2n 2 band, we used the following expressions:<br />
d P air ¼ 2:114 10 3 þ 6:63 10 4 jmj 4:62 10 5 jmj 2 þ 1:19 10 6 jmj 3 , (24)
ARTICLE IN PRESS<br />
L.S. Rothman et al. / Journal of Quantitative Spectroscopy & Radiative Transfer 96 (2005) 139–204 183<br />
d R air ¼ 1:407 10 3 þ 2:68 10 4 jmj 2:40 10 5 jmj 2 þ 4:74 10 7 jmj 3 . (25)<br />
<strong>The</strong>se polynomials, which have been obtained by fitting the measurements [151] on 28 lines in the<br />
P-branch and 28 lines in the R-branch, apply only to lines with jmjp28. For jmj428, a constant<br />
value of 0:0072 cm 1 atm 1 has been adopted in the P-branch, while a constant value of<br />
0:0005 cm 1 atm 1 has been adopted in the R-branch. For the other bands, new measurements are<br />
needed, and extrapolation cannot be pursued using the results obtained for lines in the n 1 and 2n 2<br />
bands. <strong>The</strong>refore, the air pressure-induced line shift has been set at zero for the other bands,<br />
thereby meaning that data are lacking. Recent measurements for the n 2 region by Devi and coworkers<br />
[153] have been proposed for consideration in a future update of the <strong>database</strong>.<br />
It should be noted that, since some self-broadened half-widths of HCN are larger than<br />
1:0cm 1 atm 1 , this parameter can be read in the FORTRAN format F5.4, but cannot be written<br />
in that format. As special care has to be exercised, we recommend writing it in F5.3.<br />
3.24. CH 3 Cl (molecule 24)<br />
A line list for the n 2 ; n 5 , and 2n 3 triad of vibrational bands of methyl chloride appearing in the 6-<br />
to 8-mm region has been added in this edition. <strong>The</strong> positions, intensities, and self-broadened<br />
widths are based upon the data of Chackerian et al. [154]. A polynomial expression for the selfbroadened<br />
half-widths that considers J-dependence but not K-dependence, provided by this<br />
source of data, has been used to update the self-broadened half-widths of lines in all of the other<br />
bands of the two isotopologues considered in the <strong>database</strong>. An update of the air-broadened halfwidths<br />
has been performed for all CH 3 Cl lines in <strong>HITRAN</strong> using three sets of data calculated by<br />
Bouanich et al. [155] in the pure-rotation, parallel, and perpendicular bands. Considering that the<br />
uncertainty of the air-broadened half-widths is 5% for most lines in the calculation, we used the<br />
same calculations for the two isotopologues. Moreover, the constant value of 0.7 for n air based on<br />
Ref. [155] has been preferred to the previous 0.5 default value for all lines of the two<br />
isotopologues. <strong>The</strong> pure-rotation bands for the two isotopologues have also been added to the<br />
<strong>database</strong>, using the positions, the intensities and the lower state energy of the JPL catalog [15]. It<br />
should be noted that the hyperfine structure is resolved in these two bands.<br />
3.25. H 2 O 2 (molecule 25)<br />
A line list of hydrogen peroxide covering the pure-rotation region from 0 to 1427 cm 1 ,<br />
prepared by Perrin et al. [7], has been included in the new <strong>HITRAN</strong> edition. This line list contains<br />
the torsional quantum numbers n and t (see the global quanta field in Table 3). It should be noted<br />
that the previous versions of <strong>HITRAN</strong> did not contain lines between 99.8 and 1000 cm 1 , and did<br />
not include the torsional quantum number. Furthermore, the strong Q branch near 93:5cm 1 ,<br />
which is useful for atmospheric applications, was lacking. All these data can be found in the new<br />
line list.<br />
Improvements for the n 6 band can be found in the work of Klee et al. [8]. A calculated line list of<br />
this band could replace the entries currently in <strong>HITRAN</strong> in the future.
ARTICLE IN PRESS<br />
184<br />
L.S. Rothman et al. / Journal of Quantitative Spectroscopy & Radiative Transfer 96 (2005) 139–204<br />
3.26. C 2 H 2 (molecule 26)<br />
Recently, El Hachtouki and Vander Auwera [156] measured line intensities for five bands<br />
observed in the 1:5-mm region. This region, extending from 6448 to 6686 cm 1 , contains the n 1 þ n 3<br />
bands of 12 C 2<br />
H 2 and 12 C 13 CH 2 and three hot bands of 12 C 2<br />
H 2 associated with this combination<br />
band. Because this spectral region corresponds to the emission range of ‘‘telecom’’ diode lasers,<br />
the availability of such data can prove to be useful. <strong>The</strong>refore, those data have been introduced<br />
into the current edition. <strong>The</strong> line positions were calculated using the constants reported by Kou et<br />
al. [157]. It should be noted that accurate line positions with uncertainty not exceeding 5 <br />
10 6 cm 1 are available for lines in the n 1 þ n 3 band of 12 C 2<br />
H 2 and 13 C 2<br />
H 2 [158]. <strong>The</strong> air- and selfbroadened<br />
half-widths, their temperature dependence, and the air pressure-induced line shifts<br />
were calculated using the polynomial expansion and the constants reported by Jacquemart et al.<br />
[6]. Furthermore, we added the parity symbols u or g for the vibrational symmetry for the<br />
isotopologue 12 C 2<br />
H 2 . It is indeed necessary to have this symmetry in order to determine the<br />
intensity alternation and, thus, to be able to calculate the statistical weights of the upper and lower<br />
levels [3].<br />
3.27. C 2 H 6 (molecule 27)<br />
A line list prepared by Pine and Rinsland [159] for lines in the p Q 3<br />
sub-branch in the n 7 band of<br />
ethane has completely replaced the old data in <strong>HITRAN</strong> [1]. It contains line positions, intensities,<br />
lower-state energies, air-broadened half-widths, and air pressure-induced line shift parameters.<br />
<strong>The</strong>se new data represent a significant improvement over those used in earlier atmospheric<br />
applications.<br />
3.28. PH 3 (molecule 28)<br />
<strong>The</strong> line list of phosphine has been completely revised and expanded in the current edition. <strong>The</strong><br />
line positions and line intensities in the 10-mm region are from Ref. [160], while those in the 5-mm<br />
region are from Ref. [161]. <strong>The</strong> air- and self-broadened half-widths from Ref. [160] replace the old<br />
default constant values that previously were listed in the earlier editions of <strong>HITRAN</strong> for this<br />
molecule.<br />
<strong>The</strong> symmetry components Aþ, A , and E of the C 3v group [10,11] have been added in the<br />
rotational field (C field: see Table 4).<br />
3.29. COF 2 (molecule 29)<br />
An unfortunate typographical error was detected in the previous editions of the <strong>database</strong> on the<br />
line list for carbonyl fluoride in the 5:1-mm region. <strong>The</strong> assignment of the rotational quantum<br />
numbers of the lower-state energy level was mistakenly interchanged with the assignment of those<br />
of the upper energy level. This error has been corrected in the current edition, and a new<br />
calculation has been generated [162]. <strong>The</strong> number of lines has more than doubled (28884 versus<br />
13149 in the previous edition) because the degenerate pair of each doublet of lines of the<br />
symmetric top has been kept as separate lines.
ARTICLE IN PRESS<br />
L.S. Rothman et al. / Journal of Quantitative Spectroscopy & Radiative Transfer 96 (2005) 139–204 185<br />
3.30. SF 6 (molecule 30)<br />
For sulfur hexafluoride, rotational quantum numbers J; R; C; N in the previous edition [1] have<br />
been replaced by J; C; a as has been done previously for methane [9]. R and N are not good<br />
quantum numbers, if one were to be able to describe all the transitions of this highly spherically<br />
symmetric molecule. An update has been performed for the only band of SF 6 present in <strong>HITRAN</strong>,<br />
the n 3 band. New positions and intensities for 22901 lines [163,164] replace the <strong>spectroscopic</strong><br />
parameters listed in the previous edition [1] of <strong>HITRAN</strong>. A dedicated effort to find theoretical<br />
solutions for the simulations and analysis of XY 6 spherical top systems has been in progress at the<br />
University of Burgundy in Dijon. Recent success with respect to SF 6 [165] is expected to lead to a<br />
more complete line list including hot bands.<br />
A transcriptional error committed in the earlier editions of <strong>HITRAN</strong> in the list of the selfbroadened<br />
half-widths has been fixed. A single self-broadened half-width of 0:042 cm 1 atm 1<br />
based on Ref. [166] has been assigned to all of the lines.<br />
It should be recognized that the line-by-line parameters for SF 6 are not listed in the main folder<br />
for <strong>HITRAN</strong> line-by-line parameters, but are relegated to a supplemental folder (see Fig. 1). <strong>The</strong><br />
rationale for this is due to the fact that, for such a heavy molecule, there are many very low-lying<br />
vibrational levels, often on the order of kT=hc, which is about 200 cm 1 in terrestrial atmospheric<br />
applications. Most attempts to make high-resolution simulations of spectra would require in<br />
the <strong>database</strong> not only the information on the fundamental bands, but also on a plethora of<br />
hot bands and combination bands. <strong>The</strong>refore, we recommend the use of cross-sections for these<br />
types of molecules; the line-by-line parameters are given for theoretical considerations or very<br />
specific cases.<br />
3.31. H 2 S (molecule 31)<br />
Significant improvements have been implemented in the <strong>database</strong> to the air- and self-broadened<br />
half-widths for hydrogen sulfide. Average values of 0:074 cm 1 atm 1 for the air-broadened halfwidths<br />
and 0:158 cm 1 atm 1 for the self-broadened half-widths, generated as the averages of the<br />
data reported in Refs. [167–170] and Refs. [167,170,171], respectively, have been used for all H 2 S<br />
lines. However, when available, we have adopted the measured values from Refs. [167–170] for<br />
air-broadened half-widths and the measured values from Refs. [167,170,171] for self-broadened<br />
half-widths. <strong>The</strong> experimental values on g air amounted to 88 lines (out of a total of 20,788 lines for<br />
the H 2 S linelist). Experimental values were available for 50 lines for g self . A constant value of 0.75<br />
has been used for n air .<br />
An average value of the air pressure-induced line shift of 0:002 cm 1 atm 1 from Ref. [169]<br />
has been used for all of the lines in the n 2 band, and an average value of 0:003 cm 1 atm 1<br />
from Ref. [168] has been used for all of the lines in the n 1 ; n 3 , and 2n 2 bands. Average values<br />
of d air for the remaining combination and overtone bands were estimated by appropriately<br />
scaling the mean values from Refs. [168,169] according to the band centers. <strong>The</strong> resulting<br />
values are d air ¼ 0:003 cm 1 atm 1 for 110-010 and 030-010, d air ¼ 0:0042 cm 1 atm 1<br />
for 011-000, 110-000, 021-010, and 120-010, and d air ¼ 0:0045 cm 1 atm 1 for 030-000<br />
and 040-010.
ARTICLE IN PRESS<br />
186<br />
L.S. Rothman et al. / Journal of Quantitative Spectroscopy & Radiative Transfer 96 (2005) 139–204<br />
3.32. HCOOH (molecule 32)<br />
<strong>The</strong> spectral parameters of the pure-rotation lines of formic acid observed between 10 and<br />
100 cm 1 were added to the current edition. <strong>The</strong> data on line positions and intensities come from<br />
the calculation of Vander Auwera [172]. <strong>The</strong>se line positions have been substantiated by a recent<br />
study of Winnewisser et al. [173].<br />
<strong>The</strong> new spectral line parameters (positions and intensities) generated by Perrin et al. [174] were<br />
used to update the data on the n 6 band. Such an improvement is particularly important for<br />
atmospheric applications, since the Q branch of the n 6 band located at 1105 cm 1 is used to<br />
quantify HCOOH in the troposphere and lower stratosphere. <strong>The</strong> work of Shepard et al. [175]<br />
illustrates well the improvements obtained when using the new data. Vander Auwera et al. [176]<br />
have reported the measurement of absolute line intensities in the n 6 band, taking the nonnegligible<br />
contribution from the dimer ðHCOOHÞ 2 into account when determining the partial<br />
pressure of the monomer HCOOH.<br />
<strong>The</strong> constant values of 0.1 and 0:4cm 1 atm 1 used for the air-broadened and self-broadened<br />
half-widths, respectively, for the lines in the n 6 band were based on Refs. [177,174] have<br />
been applied to the far-infrared region. Finally, we recognize the recent observations of<br />
the n 7 and n 9 bands near 15:8 mm by Perrin et al. [178], which could be considered for a future<br />
<strong>HITRAN</strong> update.<br />
3.33. HO 2 (molecule 33)<br />
In the previous edition [1] of <strong>HITRAN</strong>, the notation of the rotational quantum numbers<br />
used for the hydroperoxyl radical was inconsistent. In the data provided by Chance et al. [179]<br />
for the lines in the pure-rotation region (from 0 to 909 cm 1 ), N was used instead of J,<br />
and in the symmetry field the þ or meant, respectively, J ¼ F þ 1 and F 1<br />
. For the n 2 2 1; n 2 , and<br />
n 3 bands in <strong>HITRAN</strong> [1] (arising from Refs. [180–182]), N was used instead of J, and in<br />
the hyperfine field the indices 1 or 2 were used, respectively, for J ¼ N þ 1 and N 1.<br />
2 2<br />
In order to make the notation consistent throughout, we have placed the hyperfine<br />
quantum number in the F field, and we have used the character þ and (in the sym field),<br />
respectively, for J ¼ N þ 1 and N 1. This is the same notation as we have adopted for NO 2 2 2<br />
(see Table 4).<br />
3.34. O (molecule 34)<br />
Slight changes have been made in the data for the line positions, intensities, and lower-state<br />
energies of the two transitions of oxygen since the previous edition [1]. <strong>HITRAN</strong> has been updated<br />
with newer values in the JPL catalog [15].<br />
3.35. ClONO 2 (molecule 35)<br />
<strong>The</strong> line parameters of chlorine nitrate are the same as in the previous edition of <strong>HITRAN</strong> [1].<br />
<strong>The</strong> parameters for this molecule are to be found in the supplemental folder.
ARTICLE IN PRESS<br />
L.S. Rothman et al. / Journal of Quantitative Spectroscopy & Radiative Transfer 96 (2005) 139–204 187<br />
3.36. NO þ (molecule 36)<br />
<strong>The</strong> line parameters of NO þ are the same as in the previous edition of <strong>HITRAN</strong> [1].<br />
3.37. HOBr (molecule 37)<br />
<strong>The</strong> line parameters of hydrobromous acid are the same as in the previous edition of<br />
<strong>HITRAN</strong> [1].<br />
3.38. C 2 H 4 (molecule 38)<br />
<strong>The</strong> line parameters of ethylene are the same as in the previous edition of <strong>HITRAN</strong> [1].<br />
3.39. CH 3 OH (molecule 39)<br />
<strong>The</strong> data on methanol make their debut in this edition. In the microwave spectral region, line<br />
positions and intensities of the rotational transitions between 0 and 34 cm 1 within the ground<br />
vibrational level and the n 1 level (the hot band) from Ref. [183] have been used. Furthermore, a<br />
recent work by Xu et al. [184] led to the creation of an empirical line list around 10 mm that has<br />
been used in the current edition. This line list contains 15,234 lines belonging to the following<br />
bands: n 8 ; n 8 þ n 12 n 12 ; n 8 þ 2n 12 2n 12 ; n 7 ; n 7 þ n 12 n 12 ; n 6 n 12 ; n 6 2n 12 ; n 6 þ n 12 n 12 ; n 5 2n 12 ;<br />
3n 12 and 4n 12 . <strong>The</strong> air- and self-broadened half-widths have been fixed, respectively, to assumed<br />
values of 0.1 and 0:4cm 1 atm 1 . <strong>The</strong> value of the exponent n air has been assumed to be 0.75. A<br />
complete review of the quantum number notation used in <strong>HITRAN</strong> for this molecule is given in<br />
Ref. [184].<br />
4. Infrared cross-sections<br />
Many of the infrared cross-sections that were listed in the previous editions have been retained<br />
in this edition of the <strong>HITRAN</strong>. <strong>The</strong> format of the catalogue has also been retained (see Table 1).<br />
<strong>The</strong>refore, only the new and the updated data are described below.<br />
<strong>The</strong> data on each molecule (or chemical compound) are stored in a separate file, which is now<br />
labeled with the chemical symbol followed by an underscore and Irxx.xsc, where xx stands for the<br />
edition that the data were originally introduced or later updated and the file extension xsc signifies<br />
that it is a list of cross-sections. It is to be recalled that the files may have many<br />
temperature–pressure sets for different spectral regions, as indicated by headers throughout the<br />
file. Table 13 is a summary of the <strong>molecular</strong> species and spectral regions covered in the current<br />
edition. It is to be realized that, while the temperature–pressure ðT; pÞ sets are reasonably complete<br />
for many species for an adequate simulation of atmospheric transmission in the spectral regions<br />
where those species are active, for other species, an insufficiency of the ðT; pÞ sets may become<br />
apparent. It is hoped that future measurements at extended sets of ðT; pÞ combinations may help<br />
broaden the coverage in the <strong>database</strong>.
ARTICLE IN PRESS<br />
188<br />
L.S. Rothman et al. / Journal of Quantitative Spectroscopy & Radiative Transfer 96 (2005) 139–204<br />
Table 13<br />
Summary of molecules represented by IR cross-section data in <strong>HITRAN</strong>
ARTICLE IN PRESS<br />
L.S. Rothman et al. / Journal of Quantitative Spectroscopy & Radiative Transfer 96 (2005) 139–204 189<br />
Table 13 (continued)<br />
Note: <strong>The</strong>se data are in the main directory. Additional redundant data for CFC-11 and CFC-12 are stored in a<br />
supplemental sub-directory (see Fig. 1).<br />
<strong>The</strong> cross-sections of chlorine nitrate ðClONO 2 Þ have been entirely updated in the<br />
750–1320 cm 1 region. <strong>The</strong>se data are the measurements by Wagner and Birk [185], who<br />
performed them using spectral resolution between 0.002 and 0:008 cm 1 and at pressures between<br />
0.2 and 117 torr. Data at total pressures less than 1 torr are for pure ClONO 2 , while higher total<br />
pressures are for mixtures of ClONO 2 , which was kept at partial pressures not exceeding 0.8 torr,<br />
and dry air (see Ref. [185] for details). <strong>The</strong>se data have been arranged as two separate sets<br />
covering the 750–830 and 1260–1320 cm 1 regions. <strong>The</strong> cross-sectional data from Ref. [186] in the<br />
1680–1790 cm 1 region, and listed in the previous edition of <strong>HITRAN</strong> [1], have been retained.<br />
Ref. [185] also includes cross-sections of nitrogen pentoxide, N 2 O 5 . <strong>The</strong>se data have been used<br />
to replace the data compiled in the previous edition of <strong>HITRAN</strong>. <strong>The</strong> new <strong>database</strong> is deemed<br />
superior by more than two orders of magnitude, in so far as the spectral resolution and the<br />
spectral coverage, which includes two strong bands and some weaker features in the<br />
540–1380 cm 1 region, are concerned. <strong>The</strong> original data from Ref. [185] contained some negative<br />
numbers for values of the cross-sections, which was due to the noise in the recorded spectra. By<br />
conforming to the format previously adopted by us, we have set all of the negative cross-sections<br />
to zero; users desiring to have the original data should contact the authors of the data.
ARTICLE IN PRESS<br />
190<br />
L.S. Rothman et al. / Journal of Quantitative Spectroscopy & Radiative Transfer 96 (2005) 139–204<br />
HNO 4 (peroxynitric acid, PNA) is an important transient reservoir for NO 2 and HO 2 in the<br />
stratosphere and high-latitude upper troposphere. <strong>The</strong> cross-sections measured by May and<br />
Friedl [187] at 220 K using a spectral resolution of 0:003 cm 1 in the 780–830 cm 1 region are<br />
included in the current edition. <strong>The</strong>se data replace the earlier cross-sections that were measured at<br />
room temperature using a spectral resolution of 0:03 cm 1 . Since HNO 4 was formed by the<br />
reaction between NO 2 and HNO 3 , the total pressure is the sum of the partial pressures of these<br />
three gases. Since broadening of HNO 4 is due to NO 2 and/or HNO 3 , in the present case, we<br />
resorted to listing NOy as the broadener in the file header.<br />
Absorption cross-sections of SF 5 CF 3 (trifluoromethyl sulfur pentafluoride) are included for the<br />
first time in the current version of <strong>HITRAN</strong>. This compound is conceived as a breakdown product<br />
of SF 6 in high-voltage equipment. It may have a potentially higher global warming potential than<br />
SF 6 . While the strongest of the thermal infrared absorption bands, the fundamental and all of the<br />
hot bands of SF 6 are located in a single spectral region around 9:6 mm, SF 5 CF 3 bands are located<br />
throughout the 8–12 mm atmospheric window. <strong>The</strong> cross-sections were measured at 213, 243, 278,<br />
298, and 323 K at a spectral resolution of 0:112 cm 1 in 760 torr of N 2 , in the 520–6500 cm 1 region<br />
at the Pacific Northwest National Laboratory [188]. <strong>The</strong> cross-sections are tabulated for six<br />
wavenumber regions between 599 and 2600 cm 1 at the five temperatures mentioned above. Fig. 4<br />
is a display of the cross-sections in one of the bands, and it is an illustration of the dependence of<br />
the spectral absorption cross-sections of SF 5 CF 3 upon temperature.<br />
<strong>The</strong> distributions of the ðT; pÞ sets for the three molecules ClONO 2 ,N 2 O 5 , and SF 5 CF 3 are<br />
shown in Fig. 5.<br />
Supplemental cross-sections of several other species of interest in the lower and upper<br />
troposphere will soon be added to <strong>HITRAN</strong>. Measurements of PAN ðCH 3 CðOÞO 2 NO 2 Þ by Allen<br />
Fig. 4. Cross-sections of SF 5 CF 3 [188] in the 11-mm region at five temperatures.
ARTICLE IN PRESS<br />
L.S. Rothman et al. / Journal of Quantitative Spectroscopy & Radiative Transfer 96 (2005) 139–204 191<br />
0<br />
1<br />
CLONO 2<br />
N 2 O 5<br />
SF 5 CF 3<br />
Pressure (Torr)<br />
10<br />
100<br />
1000<br />
160 180 200 220 240 260 280 300 320 340<br />
Temperature (K)<br />
Fig. 5. Pressure and temperature pairs for the new ClONO 2 ,N 2 O 5 , and SF 5 CF 3 cross-section data of the <strong>2004</strong><br />
<strong>HITRAN</strong> edition. Each pair corresponds to a complete cross-section data set included in the compilation.<br />
et al. [189] and measurements of acetone ðC 3 H 6 OÞ by Orlando and Tyndall [190] are ongoing.<br />
Cold-temperature cross-sections of PAN and acetone will lead to retrievals of these species at the<br />
cold temperatures commonly encountered in the upper troposphere. Of special interest will be the<br />
application of these cross-sections in analysis of TES (Tropospheric Emission Spectrometer) [191]<br />
and other remote-sensing observations of air columns associated with biomass fires. Fires in the<br />
tropics and boreal regions inject these species (and other organics) into the upper troposphere.<br />
5. Ultraviolet data sets<br />
New cross-sections of a number of molecules in the ultraviolet and visible spectral regions have<br />
been introduced into the <strong>database</strong>. In each case, we have opted to select those data that have<br />
proven to be the most useful in the analyses of atmospheric measurements, especially satellite<br />
observations. This portion of the <strong>HITRAN</strong> <strong>database</strong> is projected to grow, and evolve significantly,<br />
over the near future as <strong>spectroscopic</strong> monitoring of atmospheric pollution tends to become more<br />
advanced.<br />
5.1. O 3<br />
Absorption cross-sections in the Hartley–Huggins bands, including their dependence upon<br />
temperature, are included in the 29,164–40; 798 cm 1 region. <strong>The</strong> data are adopted from Bass and
ARTICLE IN PRESS<br />
192<br />
L.S. Rothman et al. / Journal of Quantitative Spectroscopy & Radiative Transfer 96 (2005) 139–204<br />
Paur [192]. <strong>The</strong>y are corrected from the wavelengths in air to the wavelengths in vacuum<br />
according to Edle´ n [193]. Further wavelength corrections have been made from comparison with<br />
the FTS measurements on ozone by Voigt et al. [194], and they resulted in an additional shift of<br />
the wavelength by þ0:015 0:040 nm.<br />
Bass and Paur [192] presented coefficients for the calculation of temperature-dependent crosssections<br />
versus wavelength using a quadratic formula. <strong>The</strong>ir coefficients are included in this new<br />
<strong>HITRAN</strong> edition in the alternate file on O 3 . For the <strong>HITRAN</strong> primary files, cross-sections have<br />
been calculated for a range of temperatures from 200 to 300 K, and then the data were<br />
interpolated using a fixed increment in the wavenumber. Values were obtained by an interpolation<br />
using a cubic spline of the original data with 2 cm 1 spacing, which corresponds to more than<br />
twice the sampling in the original data.<br />
5.2. NO 3<br />
Cross-sections of nitrogen trioxide at 298 K are taken from Orphal et al. [195]. Note that for the<br />
strongest (0-0) band around 662 nm, the temperature dependence of the cross-section, s, can be<br />
modeled readily as:<br />
sðTÞ=sð298 KÞ ¼½1 e 1096:4=T 2e 529:5=T Š=0:6364, (26)<br />
where T is the absolute temperature in K. This model does not apply for bands outside the<br />
645–675 nm range.<br />
5.3. BrO<br />
Cross-sections for bromine monoxide at 228 and 298 K, at 10 cm 1<br />
taken from Wilmouth et al. [196].<br />
spectral resolution, are<br />
5.4. OClO<br />
Chlorine dioxide cross-sections at two spectral resolutions (1 and 20 cm 1 ) and five<br />
temperatures (213–293 K) are taken from Kromminga et al. [197]. <strong>The</strong> original data are available<br />
at http://www-iup.physik.uni-bremen.de/gruppen/molspec/.<br />
5.5. H 2 CO<br />
Cross-sections of formaldehyde are adopted from Cantrell et al. [198], who give a linear<br />
dependence for calculating cross-sections vs. temperature. <strong>The</strong> wavenumber steps in the original<br />
data are not perfectly regular, and there are 48 gaps or missing points. For the <strong>HITRAN</strong> primary<br />
files, cross-sections have been calculated from the Cantrell et al. data [198] at three temperatures<br />
(280, 290, and 300 K) and then cubic-spline interpolated to an even wavenumber increment of<br />
0:244 cm 1 , corresponding to more than twice the sampling of the original data. <strong>The</strong> original data<br />
are also available in the alternate file folder (see Fig. 1).
ARTICLE IN PRESS<br />
L.S. Rothman et al. / Journal of Quantitative Spectroscopy & Radiative Transfer 96 (2005) 139–204 193<br />
5.6. O 2 –O 2<br />
Cross-sections for the oxygen collision complex at 296 K are adopted from Greenblatt et al.<br />
[199]. (<strong>The</strong> ‘‘cross-sections’’ are in units of cm 5 molecule 2 , since the absorption depends on the<br />
square of the O 2 density.) <strong>The</strong>y are corrected from air to vacuum wavelengths using Edle´ n [193].<br />
For the <strong>HITRAN</strong> primary files, cross-sections are interpolated to even wavenumber increments in<br />
two ranges, 8794.215–9945:540 cm 1 and 15385.100–29823:980 cm 1 , by cubic spline interpolation.<br />
Spacings correspond to more than twice the sampling of the primary data. <strong>The</strong> primary data<br />
are also available in the alternate file folder.<br />
6. Aerosol refractive indices<br />
Refractive indices of water, ice, aqueous sulfuric and nitric acid, solid hydrates (i.e. nitric acid,<br />
mono-, di-, and tri-hydrate), organic nonvolatile aerosol, and crustal material (e.g. quartz,<br />
hematite, and sand) in the previous version of <strong>HITRAN</strong> are discussed by Massie and Goldman<br />
[200]. It is pointed out in Ref. [200] that the specification of refractive indices for ternary<br />
ðH 2 O=H 2 SO 4 =HNO 3 Þ solution droplets, an important type of composition of the so-called ‘‘polar<br />
stratospheric clouds’’ (PSCs), is fairly uncertain, due to the uncertainties in the refractive indices<br />
of aqueous sulfuric and nitric acid at stratospheric temperatures.<br />
Recently, Norman et al. [201] published the real and imaginary refractive indices at 220 K for<br />
six different ternary compositions, and these data have been added to the current <strong>HITRAN</strong><br />
compilation. We show in Fig. 6 the imaginary refractive indices for the six compositions. <strong>The</strong><br />
imaginary refractive indices are presented in the figure, since the wavelength dependence of the<br />
extinction spectrum of a small droplet is similar to the wavelength dependence of the imaginary<br />
Fig. 6. Imaginary refractive indices at 220 K for six different ternary solution ðH 2 O=H 2 SO 4 =HNO 3 Þ compositions [201].
ARTICLE IN PRESS<br />
194<br />
L.S. Rothman et al. / Journal of Quantitative Spectroscopy & Radiative Transfer 96 (2005) 139–204<br />
refractive index. As temperature decreases below 193 K, the percentage weight of HNO 3 in a<br />
ternary droplet increases, and it is expected that the wavelength dependence of its extinction<br />
spectrum will also change.<br />
Prior to Ref. [201], the room temperature measurements of Adams and Downing [202]<br />
for 75% wt H 2 SO 4 , 10% wt HNO 3 , and 15% wt H 2 O, and tabulations of binary (H 2 O=H 2 SO 4<br />
and H 2 O=HNO 3 ) indices (see Ref. [200]) were available. Biermann et al. [203] and Luo et al. [204]<br />
tabulated laboratory measurements of the binary refractive indices, stated a mixing model<br />
(i.e. an algebraic expression for obtaining ternary refractive indices from a mixture of the<br />
binary components), and tested the mixing model using laboratory measurements of<br />
several ternary mixtures. In their measurements, included in <strong>HITRAN</strong>, Norman et al. [201]<br />
specified ternary indices directly, and they can be used to perform additional tests on the mixing<br />
model.<br />
7. Global data<br />
<strong>The</strong>re are some data, which are necessary for the <strong>HITRAN</strong> compilation and apply in a<br />
comprehensive or global manner to the line-by-line parameters or cross-sections. <strong>The</strong>se data are<br />
placed in the folder, ‘‘Global Data Files, Tables, and References,’’ (see Fig. 1). <strong>The</strong>re are five files<br />
in this folder: molparam.txt, bandcent.dat, ref-table<strong>2004</strong>.pdf, TIPS_2003.zip (containing<br />
TIPS_2003.for, BD_TIPS_2003.for, and associated INCLUDE files), and parsum.dat.<br />
<strong>The</strong> text file, molparam.txt, is a table containing the adopted abundance, the partition sum at<br />
296K, the state-independent degeneracy factor, and the molar mass for all the isotopologues/<br />
isotopomers present in <strong>HITRAN</strong>. A list of band centers for all the ro-vibration bands<br />
in the <strong>database</strong> are contained in the file bandcent.dat; this file is used as input for generating<br />
statistics on the contents of <strong>HITRAN</strong>. Ref-table<strong>2004</strong>.pdf is a large list containing all the<br />
references for the six line-by-line parameters (v; S; g air ; g self ; n air , and d air ) and the cross-sections.<br />
<strong>The</strong> pointers in the <strong>HITRAN</strong> line transitions and in the cross-section headers refer to the entries<br />
in this list.<br />
7.1. Total internal partition sums<br />
For this edition of the <strong>database</strong> we provide a comprehensive set of total internal partition sums<br />
(TIPS) for species of atmospheric interest, calculated to a great degree of accuracy and packaged<br />
in a form that allows for easy and rapid recall of the data [205]. Partition sums, QðTÞ, were<br />
calculated for <strong>molecular</strong> species and isotopologues/isotopomers present in the <strong>HITRAN</strong> <strong>database</strong>.<br />
<strong>The</strong> calculations of the partition sums address the corrections suggested by Goldman et al. [206].<br />
<strong>The</strong> correct statistical weights for all isotopologues/isotopomers in the <strong>database</strong> were<br />
implemented, consistent with those used to determine the Einstein A-coefficients [3]. <strong>The</strong><br />
temperature range of the calculations (70–3000 K) was selected to match a variety of remotesensing<br />
needs (for example, planetary atmospheres, combustion gases, and plume detection).<br />
Although there are a number of <strong>molecular</strong> species for which the partition sum at high<br />
temperatures is of no practical importance at present, e.g. ozone or hydrogen peroxide, the aim<br />
was to have a consistent set of partition sums for all <strong>molecular</strong> species in <strong>HITRAN</strong> (partition sums
ARTICLE IN PRESS<br />
L.S. Rothman et al. / Journal of Quantitative Spectroscopy & Radiative Transfer 96 (2005) 139–204 195<br />
are also provided for a number of rare isotopic ozone species which are not currently in the<br />
<strong>HITRAN</strong> <strong>database</strong>).<br />
A new method of recall for the partition sums, Lagrange 4-point interpolation, was<br />
developed. In previous versions of the <strong>HITRAN</strong> compilation, polynomial fits of QðTÞ<br />
were used. However, there were a number of species for which the error introduced by the fits<br />
was greater than the 1% criterion at certain temperatures and no coefficients were reported.<br />
This Lagrange 4-point interpolation method allows all <strong>molecular</strong> species in <strong>HITRAN</strong> to be<br />
considered.<br />
<strong>The</strong> four-point Lagrange interpolation scheme was coded into a FORTRAN program that uses<br />
data tables for QðTÞ at 25 K intervals with extra points provided below 70 K and above 3000 K so<br />
that a four point interpolation can be used throughout the entire temperature range. In addition<br />
to the programs TIPS_2003.for and subroutine BD_TIPS_2003.for, tables at 1 K step size<br />
(parsum.dat) are available in the folder Global Data Files.<br />
8. Conclusions<br />
This new edition of the <strong>HITRAN</strong> compilation is a vastly improved one with respect to the lineby-line<br />
parameters and IR and UV cross-sections. Mechanisms have been set in place to validate<br />
new data being considered for incorporation into the <strong>database</strong>. We have endeavored to make<br />
comparisons with field observations or independent laboratory measurements to verify that the<br />
residuals and consistencies have significantly improved.<br />
<strong>The</strong> new generation of atmospheric remote-sensing satellite instruments is requiring<br />
unprecedented high accuracies of the <strong>molecular</strong> <strong>spectroscopic</strong> parameters. <strong>HITRAN</strong>’s progress<br />
in the future will also require the determination of line parameters for systems of bands in the<br />
near-infrared, extending the applicability of the parameters at all wavelengths to high<br />
temperatures (often tantamount to archiving atmospheric weak lines), addition of collisioninduced<br />
absorption bands, characterization of ‘‘line coupling’’ for more molecules, and<br />
addition of new molecules that are important for terrestrial, planetary, and astrophysical<br />
applications.<br />
Acknowledgements<br />
<strong>The</strong> <strong>HITRAN</strong> <strong>molecular</strong> <strong>database</strong> has been a project with strong international cooperation<br />
during its development. Laboratories throughout the world have contributed both experimental<br />
data and theoretical calculations. We greatly appreciate the major efforts of P.F. Bernath, C.<br />
Boone, J.P. Bouanich, J.W. Brault, C. Camy-Peyret, E.A. Cohen, P.-F. Coheur, M.-R. De<br />
Backer-Barilly, B. Drouin, J. Fischer, M. Fukabori, L. Giver, I. Kleiner, M.-F. Me´ rienne, S.<br />
Mikhailenko, C.E. Miller, L. Régalia-Jarlot, J. Schrœder, M. Sˇ imečková, B. Sumpf, M. Tanaka,<br />
K. Tang, S. Tashkun, J.-L. Teffo, Vl.G. Tyuterev, and L.H. Xu in support of this new edition.<br />
<strong>The</strong> current endeavor has been funded by the NASA Earth Observing System (EOS), under the<br />
grant NAG5-13534, and by the Office of the Secretary of Defense (OSD) High Energy Laser Joint<br />
Technology Office.
ARTICLE IN PRESS<br />
196<br />
L.S. Rothman et al. / Journal of Quantitative Spectroscopy & Radiative Transfer 96 (2005) 139–204<br />
References<br />
[1] Rothman LS, Barbe A, Benner DC, Brown LR, Camy-Peyret C, Carleer MR, Chance KV, Clerbaux C, Dana V,<br />
Devi VM, Fayt A, Flaud JM, Gamache RR, Goldman A, Jacquemart D, Jucks KW, Lafferty WJ, Mandin JY,<br />
Massie ST, Nemtchinov V, Newnham D, Perrin A, Rinsland CP, Schrœder J, Smith K, Smith MAH, Tang K,<br />
Toth RA, Vander Auwera J, Varanasi P, Yoshino K. <strong>The</strong> <strong>HITRAN</strong> <strong>molecular</strong> <strong>spectroscopic</strong> <strong>database</strong>: edition of<br />
2000 including updates through 2001. JQSRT 2003;82:5–44.<br />
[2] Rothman LS, Gamache RR, Goldman A, Brown LR, Toth RA, Pickett HM, Poynter RL, Flaud JM, Camy-<br />
Peyret C, Barbe A, Husson H, Rinsland CP, Smith MAH. <strong>The</strong> <strong>HITRAN</strong> <strong>database</strong>: 1986 edition. Appl Opt<br />
1987;26:4058–97.<br />
[3] Sˇ imecˇ ková M, Jacquemart D, Rothman LS, Gamache RR, Goldman A. Einstein A-coefficients and statistical<br />
weights for <strong>molecular</strong> transitions in the <strong>HITRAN</strong> <strong>database</strong>. JQSRT, to appear.<br />
[4] Herzberg G. Molecular spectra and <strong>molecular</strong> structure, II. Infrared and Raman spectra of polyatomic molecules.<br />
Princeton: D Van Nostrand; 1945.<br />
[5] Rothman LS, Young LDG. Infrared energy levels and intensities of carbon dioxide—II. JQSRT 1981;25:<br />
505–24.<br />
[6] Jacquemart D, Mandin JY, Dana V, Claveau C, Vander Auwera J, Herman M, Rothman LS, Régalia-<br />
Jarlot L, Barbe A. <strong>The</strong> IR acetylene spectrum in <strong>HITRAN</strong>: update and new results. JQSRT 2003;82:<br />
363–82.<br />
[7] Perrin A, Flaud JM, Camy-Peyret C, Schermaul R, Winnewisser M, Mandin JY, Dana V, Badaoui M, Koput J.<br />
Line intensities in the far-infrared spectrum of H 2 O 2 . J Mol Spectrosc 1996;176:287–96.<br />
[8] Klee S, Winnewisser M, Perrin A, Flaud JM. Absolute line intensities for the n 6 band of H 2 O 2 . J Mol Spectrosc<br />
1999;195:154–61.<br />
[9] Brown LR, Benner DC, Champion JP, Devi VM, Fejard L, Gamache RR, Gabard T, Hilico JC, Lavorel B, Loe¨ te<br />
M, Mellau GC, Nikitin A, Pine AS, Predoi-Cross A, Rinsland CP, Robert O, Sams RL, Smith MAH, Tashkun<br />
SA, Tyuterev VG. Methane line parameters in <strong>HITRAN</strong>. JQSRT 2003;82:219–38.<br />
[10] Tarrago G, Dang Nhu M. Ground state rotational energies of C 3v quasi-spherical top molecules: applications to<br />
16 OPF 3 and PH 3 . J Mol Spectrosc 1985;111:425–39.<br />
[11] Tarrago G, Delaveau M. Triad v n ðA 1 Þ; v t ðEÞ; v t 0ðEÞ in C 3v molecules: energy and intensity formulation (computers<br />
programs). J Mol Spectrosc 1986;119:418–25.<br />
[12] Ramsay DA, Rostas J, Zare RN. <strong>The</strong> labeling of parity doublet levels in linear molecules. J Mol Spectrosc<br />
1975;55:500–3.<br />
[13] Champion JP, Loëte M, Pierre G. Spherical top spectra. In: Rao KN, Weber A, editors. Spectroscopy of the<br />
Earth’s atmosphere and interstellar medium. USA: Academic Press; 1992.<br />
[14] Perrin A, Flaud JM, Goldman A, Camy-Peyret C, Lafferty WJ, Arcas Ph, Rinsland CP. NO 2 and SO 2 line<br />
parameters: 1996 <strong>HITRAN</strong> update and new results. JQSRT 1998;60:839–50.<br />
[15] Pickett HM, Poynter RL, Cohen EA, Delitsky ML, Pearson JC, Mu¨ ller HSP. Submillimeter, millimeter, and<br />
microwave spectral line catalog. JQSRT 1998;60:883–90.<br />
[16] Toth RA. Transition frequencies and absolute strengths of H 2 17 O and H 2 18 O in the 6.2-mm region. J Opt Soc Am B<br />
1992;9:462–82.<br />
[17] Pearson JC. Private communication. Jet Propulsion Laboratory, Pasadena CA, USA. 1999.<br />
[18] Coudert LH. Line frequency and line intensity analyses of water vapour. Mol Phys 1999;96:941–54.<br />
[19] Lanquetin R, Coudert LH, Camy-Peyret C. High-lying rotational levels of water: an analysis of the energy levels<br />
of the five first vibrational states. J Mol Spec 2001;206:83–103.<br />
[20] Flaud JM, Piccolo C, Carli B, Perrin A, Coudert LH, Teffo JL, Brown LR. Molecular line parameters for the<br />
MIPAS (Michelson interferometer for passive atmospheric sounding) experiment. Atmos Ocean Opt<br />
2003;16:172–81.<br />
[21] Rothman LS. AFGL atmospheric absorption line parameters compilation: 1980 version. Appl Opt<br />
1981;20:791–5.<br />
[22] Toth RA. Linelists of water vapor parameters from 500 to 8000 cm 1 , see http://mark4sun.jpl.nasa.gov.data/spec/<br />
H2O/
ARTICLE IN PRESS<br />
L.S. Rothman et al. / Journal of Quantitative Spectroscopy & Radiative Transfer 96 (2005) 139–204 197<br />
[23] Camy-Peyret C, Flaud JM, Mandin JY, Bykov A, Naumenko O, Sinitsa L, Voronin B. Fourier-transform<br />
absorption spectrum of the H 2 17 O molecule in the 9711–11335 cm 1 spectral region: the first decade of resonating<br />
states. JQSRT 1999;61:795–812.<br />
[24] Tanaka M, Naumenko O, Brault JW, Tennyson J. Absorption spectrum of H 2 17 O and H 2 18 O in the near-infrared<br />
and visible. J Mol Spectrosc 2005, in press.<br />
[25] Tanaka M, Brault JW, Tennyson J. Absorption spectrum of H 2 18 O in the 12,400–14; 520 cm 1 range. J Mol<br />
Spectrosc 2002;216:77–80.<br />
[26] Schermaul R, Brault JW, Canas AAD, Learner RCM, Polyansky OL, Zobov NF, Belmiloud D, Tennyson<br />
J. Weak line water vapour spectrum in the regions 13,200–15; 000 cm 1 . J Mol Spectrosc 2002;211:169–78.<br />
[27] Me´ rienne MF, Jenouvrier A, Hermans C, Vandaele AC, Carleer M, Clerbaux C, Coheur PF, Colin R, Fally S,<br />
Bach M. Water vapor line parameters in the 13000–9250 cm 1 region. JQSRT 2003;82:99–117.<br />
[28] Coheur PF, Fally S, Carleer M, Clerbaux C, Colin R, Jenouvrier A, Me´ rienne MF, Hermans C, Vandaele AC.<br />
New water vapor line parameters in the 26000–13000 cm 1 region. JQSRT 2002;74:493–510.<br />
[29] Tolchenov RN, Zobov NF, Polyansky OL, Tennyson J, Naumenko O, Carleer M, Coheur PF, Fally S, Clerbaux<br />
C, Jenouvrier A, Vandaele AC. Water vapor line assignments in the 9250–26000 cm 1 frequency range. J Mol<br />
Spectrosc 2005, in press.<br />
[30] Gamache RR, Hartmann JM. An intercomparison of measured pressure-broadening and pressure-shifting<br />
parameters of water vapor. Can J Chem <strong>2004</strong>;82:1013–27.<br />
[31] Robert D, Bonamy J. Short range force effects in semiclassical <strong>molecular</strong> line broadening calculations. J Phys<br />
1979;40:923–43.<br />
[32] Gamache RR, Fischer J. Calculated halfwidths and lineshifts of water-vapor transitions in the 0:7 mm region and<br />
a comparison with published data. J Mol Spectrosc 2001;207:254–62.<br />
[33] Gamache RR, Fischer J. Half-widths of H 2 16 O, H 2 18 O, H 2 17 O, HD 16 O, and D 2 16 O: I Comparison between<br />
isotopomers. JQSRT 2003;78:289–304.<br />
[34] Gamache RR, Fischer J. Half-widths of H 2 16 O, H 2 18 O, H 2 17 O, HD 16 O and D 2 16 O: II Comparison with<br />
measurement. JQSRT 2003;78:305–18.<br />
[35] Gamache RR. Line shape parameters for water vapor in the 3.2–17:76 mm region for atmospheric applications. J<br />
Mol Spectrosc 2005;229:9–18.<br />
[36] Gamache RR, Hartmann JM. Collisional parameters of H 2 O lines: effects of vibration. JQSRT <strong>2004</strong>;83:<br />
119–47.<br />
[37] Jacquemart D, Gamache RR, Rothman LS. Semi-empirical calculation of air-broadened half-widths and<br />
air pressure-induced frequency shifts of water-vapor absorption lines. JQRST, this issue, doi:10.1016/<br />
j.jqsrt.<strong>2004</strong>.11.018<br />
[38] Zou Q, Varanasi P. Laboratory measurement of the <strong>spectroscopic</strong> line parameters of water vapor in the 610–2100<br />
and 3000–4050 cm 1 regions at lower-tropospheric temperatures. JQSRT 2003;82:45–98.<br />
[39] Brown LR, Toth RA, Dulick M. Empirical line parameters of H 2 16 O near 0:94 mm: positions, intensities and airbroadening<br />
coefficients. J Mol Spectrosc 2002;212:57–82.<br />
[40] Toth RA, Brown LR, Smith MAH, Malathy Devi V, Benner DC, Dulick M. Temperature dependence of airbroadened<br />
line widths and shifts of water at 6 mm. 58th International Symposium on Molecular Spectroscopy,<br />
Ohio State University, June 16–20, 2003 (Paper TA01, p. 110).<br />
[41] Tashkun SA, Perevalov VI, Teffo JL, Bykov AD, Lavrentieva NN. CDSD-296, the carbon dioxide <strong>spectroscopic</strong><br />
databank: version for atmospheric applications. XIV Symposium on High Resolution Molecular Spectroscopy,<br />
Krasnoyarsk, Russia, July 6–11, 2003. See also ftp://ftp.iao.ru/pub/CDSD-296/.<br />
[42] Wattson RB, Rothman LS. Direct numerical diagonalization: wave of the future. JQSRT 1992;48:763–80.<br />
[43] Rothman LS, Hawkins RL, Wattson RB, Gamache RR. Energy levels, intensities and linewidths of atmospheric<br />
carbon dioxide bands. JQSRT 1992;48:537–66.<br />
[44] Miller CE, Brown LR. Near infrared spectroscopy of carbon dioxide I. 16 O 12 C 16 O line positions. J Mol Spectrosc<br />
<strong>2004</strong>;228:329–54.<br />
[45] Rothman LS, Gamache RR, Tipping RH, Rinsland CP, Smith MAH, Benner DC, Devi VM, Flaud JM, Camy-<br />
Peyret C, Perrin A, Goldman A, Massie ST, Brown LR, Toth RA. <strong>The</strong> <strong>HITRAN</strong> <strong>molecular</strong> <strong>database</strong>: editions of<br />
1991 and 1992. JQSRT 1992;48:469–507.
ARTICLE IN PRESS<br />
198<br />
L.S. Rothman et al. / Journal of Quantitative Spectroscopy & Radiative Transfer 96 (2005) 139–204<br />
[46] Mandin JY. Interpretation of the CO 2 absorption bands observed in the venus infrared spectrum between 1 and<br />
2:5 mm. J Mol Spectrosc 1977;67:304–21.<br />
[47] Rothman LS, Benedict WS. Infrared energy levels and intensities of carbon dioxide. Appl Opt 1978;17:<br />
2605–11.<br />
[48] Goldman A, Stephen TM, Rothman LS, Giver LP, Mandin JY, Gamache RR, Rinsland CP, Murcray FJ. <strong>The</strong><br />
1-mm CO 2 bands and the O 2 (0-1) X 3 S g a 1 D g and (1-0) X 3 S g b 1 S g bands in the earth atmosphere. JQSRT<br />
2003;82:197–206.<br />
[49] Ding Y, Bertseva E, Campargue A. <strong>The</strong> 2n 1 þ 3n 3 triad of 12 CO 2<br />
. J Mol Spectrosc 2002;212:219–22.<br />
[50] Benner DC. Private communication. College of William and Mary, Williamsburg VA, USA, 2003.<br />
[51] Claveau C, Teffo JL, Hurtmans D, Valentin A, Gamache RR. Line positions and absolute intensities in the laser<br />
bands of carbon-12 oxygen-17 isotopic species of carbon dioxide. J Mol Spectrosc 1999;193:15–32.<br />
[52] Mandin JY, Dana V, Allout JY, Régalia L, Barbe A, Plateaux JJ. Line intensities and self-broadening coefficients<br />
in the 10012-10001 band of 12 C 16 O 2 centered at 2224:657 cm 1 . J Mol Spectrosc 1995;170:604–7.<br />
[53] Claveau C, Teffo JL, Hurtmans D, Valentin A. Infrared fundamental and first hot bands of O 12 C 17 O isotopic<br />
variants of carbon dioxide. J Mol Spectrosc 1998;189:153–95.<br />
[54] Teffo JL, Claveau C, Kou Q, Guelachvili G, Ubelmann A, Perevalov VI, Tashkun SA. Line intensities of 12 C 16 O 2<br />
in the 1.2–1:4 mm spectral region. J Mol Spectrosc 2000;201:249–55.<br />
[55] Teffo JL, Claveau C, Valentin A. Infrared fundamental bands of O 13 C 17 O isotopic variants of carbon dioxide.<br />
JQSRT 1998;59:151–64.<br />
[56] Henningsen J, Simonsen H. <strong>The</strong> (22 0 1-00 0 0) band of CO 2 at 6348 cm 1 : linestrengths, broadening parameters, and<br />
pressure shifts. J Mol Spectrosc 2000;203:16–27.<br />
[57] Kshirsagar RJ, Giver LP, Chackerian C, Brown LR. <strong>The</strong> rovibrational intensities of the 2n 3 band of 16 O 12 C 18 Oat<br />
4639 cm 1 . JQSRT 1999;61:695–701.<br />
[58] Kshirsagar RJ, Giver LP, Chackerian C. Rovibrational intensities of the ð00 0 3Þ ð10 0 0Þ dyad absorption bands<br />
of 12 C 16 O 2 . J Mol Spectrosc 2000;199:230–5.<br />
[59] Giver LP, Brown LR, Chackerian C, Freedman RS. <strong>The</strong> rovibrational intensities of five bands of 12 C 16 O 2 between<br />
5218 and 5349 cm 1 . JQSRT 2003;78:417–36.<br />
[60] Devi VM, Benner DC, Rinsland CP, Smith MAH. Absolute rovibrational intensities of 12 C 16 O 2 absorption bands<br />
in the 3090–3850 cm 1 spectral region. JQSRT 1998;60:741–70.<br />
[61] Campargue A, Charvat A, Permogorov D. Absolute intensity measurement of CO 2 overtone transitions in the<br />
near-infrared. Chem Phys Lett 1994;223:567–72.<br />
[62] Lucchesini A. Private communication, IPCF, Pisa, Italy, <strong>2004</strong>.<br />
[63] Campargue A, Bailly D, Teffo JL, Tashkun SA, Perevalov VI. <strong>The</strong> n 1 þ 5n 3 dyad of 12 CO 2<br />
and 13 CO 2<br />
. J Mol Spec<br />
1999;193:204–12.<br />
[64] Devi VM, Benner DC, Smith MAH, Rinsland CP. Air- and N 2 -broadening coefficients and pressure-shift<br />
coefficients in the 12 C 16 O 2 laser bands. JQSRT 1998;59:137–49.<br />
[65] Miller CE, Montgomery MA, Onorato RM, Johnstone C, McNicholas TP, Kovaric B, Brown LR. Near infrared<br />
spectroscopy of carbon dioxide II. 16 O 13 C 16 O and 16 O 13 C 18 O line positions. J Mol Spectrosc <strong>2004</strong>;228:355–74.<br />
[66] Rodrigues R, Jucks KW, Lacome N, Blanquet G, Walrand J, Traub WA, Khalil B, Le Doucen R, Valentin A,<br />
Camy-Peyret C, Bonamy L, Hartmann JM. Model, software, and <strong>database</strong> for computation of line-mixing effects<br />
in infrared Q-branches of atmospheric CO 2 : I. Symmetric isotopomers. JQSRT 1999;61:153–84.<br />
[67] Jucks KW, Rodrigues R, Le Doucen R, Claveau C, Traub WA, Hartmann JM. Model, software, and <strong>database</strong><br />
for computation of line-mixing effects in infrared Q-branches of atmospheric CO 2 : II. Minor and asymmetric<br />
isotopomers. JQSRT 1999;63:31–48.<br />
[68] Wagner G, Birk M, Schreier F, Flaud JM. Spectroscopic <strong>database</strong> for ozone in the fundamental spectral regions.<br />
J Geophys Res 2002;107:D22.<br />
[69] Mikhailenko S. Institute of Atmospheric Optics, Tomsk, Russia, private communication (2002), using calculation<br />
based on Mikhailenko S, Barbe A, Plateaux JJ, Tyuterev VG. New analysis of 2n 1 þ n 2 ; n 1 þ n 2 þ n 3 , and n 2 þ 2n 3<br />
bands of ozone in the 2600–2900 cm 1 region. J Mol Spectrosc 1999;196:93–101;<br />
Flaud JM, Camy-Peyret C, Devi VM, Rinsland CP, Smith MAH. <strong>The</strong> n 1 and n 3 bands of 16 O 3<br />
line positions and<br />
intensities. J Mol Spectrosc 1987;124:209–17;
ARTICLE IN PRESS<br />
L.S. Rothman et al. / Journal of Quantitative Spectroscopy & Radiative Transfer 96 (2005) 139–204 199<br />
Flaud JM, Camy-Peyret C, Rinsland CP, Smith MAH, Devi VM. Line parameters of 16 O 3<br />
in the 7-mm region. J<br />
Mol Spectrosc 1989;134:106–12.<br />
[70] Flaud JM, Wagner G, Birk M, Camy-Peyret C, Debacker-Barilly MR, Barbe A, Piccollo C. Ozone absorption<br />
around 10 mm. J Geophys Res 2003;108(D9) doi:10.1029/2002JD002755.<br />
[71] Devi VM, Benner DC, Smith MAH, Rinsland CP. Air-broadening and shift coefficients of O 3 lines in the n 2 band<br />
and their temperature dependence. J Mol Spectrosc 1997;182:221–38.<br />
[72] Smith MAH, Devi VM, Benner DC, Rinsland CP. Temperature dependence of air-broadening and shift<br />
coefficients of O 3 lines in the n 1 band. J Mol Spectrosc 1997;182:239–59.<br />
[73] Smith MAH. Characterization of line broadening and shift parameters of ozone for <strong>spectroscopic</strong> <strong>database</strong>s. 56th<br />
International symposium on <strong>molecular</strong> spectroscopy, Ohio State University, June 11–15, 2001 (Paper ME03);<br />
Smith MAH. Infrared <strong>spectroscopic</strong> parameters of ozone and other atmospheric gases. NASA workshop on<br />
laboratory <strong>spectroscopic</strong> needs for atmospheric sensing, San Diego, California, October 22–26, 2001.<br />
[74] Smith MAH, Rinsland CP, Devi VM. Measurements of self-broadening of infrared absorption lines of ozone.<br />
J Mol Spectrosc 1991;147:142–54.<br />
[75] Drouin BJ, Fischer J, Gamache RR. Temperature dependent pressure induced lineshape of O 3 rotational<br />
transitions in air. JQSRT <strong>2004</strong>;83:63–81.<br />
[76] Smith MAH, Rinsland CP, Devi VM, Prochaska ES. Measurements of pressure broadening and shifts of O 3 lines<br />
in the 3-mm region. J Mol Spectrosc 1994;164:239–59.<br />
[77] Smith MAH, Rinsland CP, Devi VM, Prochaska ES. Erratum: measurements of pressure broadening and shifts<br />
of O 3 lines in the 3-mm region. J Mol Spectrosc 1994;165:596.<br />
[78] Toth RA. Linelist of N 2 O parameters from 500 to 7500 cm 1 , see http://mark4sun.jpl.nasa.gov.data/spec/N2O/.<br />
[79] Johns JWC, Lu Z, Weber M, Sirota JM, Reuter DC. Absolute intensities in the n 2 fundamental of N 2 Oat17mm.<br />
J Mol Spectrosc 1996;177:203–10.<br />
[80] Daumont L, Claveau C, Debacker-Barilly MR, Hamdouni A, Régalia-Jarlot L, Teffo JL, Tashkun S, Perevalov<br />
VI. Line intensities of 14 N 2 16 O: the 10 micrometer region revisited. JQSRT 2002;72:37–55.<br />
[81] Lyulin OM, Perevalov V, Teffo JL. Effective dipole moment and band intensities of nitrous oxide. J Mol<br />
Spectrosc 1995;174:566–80.<br />
[82] Toth RA. Line strengths (900–3600 cm 1 ) self-broadened linewidths and frequency shifts (1800–2660 cm 1 )of<br />
N 2 O. Appl Opt 1993;32:7326–65.<br />
[83] Daumont L, Vander Auwera J, Teffo JL, Perevalov V, Tashkun SA. Line intensity measurements in 14 N 2 16 O and<br />
their treatment using the effective dipole moment approach: I. the 4300- to 5200-cm 1 region. J Mol Spectrosc<br />
2001;208:281–91.<br />
[84] Toth RA. Line positions and strengths of N 2 O between 3515 and 7800 cm 1 . J Mol Spectrosc 1999;197:<br />
158–87.<br />
[85] Toth RA. N 2 and air-broadened linewidths and frequency-shifts of N 2 O. JQSRT 2000;66:285–304.<br />
[86] Lacome N, Levy A, Guelachvili G. Fourier transform measurement of self-, N 2 , and O 2 broadening of N 2 O<br />
lines: temperature dependence of linewidths. Appl Opt 1984;23:425–34.<br />
[87] Nemtchinov V, Sun C, Varanasi P. Measurements of line intensities and line widths in the n 3 -fundamental band of<br />
nitrous oxide at atmospheric temperatures. JQSRT 2003;83:267–84.<br />
[88] Brault JW, Brown LR, Chackerian C, Freedman R, Predoi-Cross A, Pine AS. Self-broadened 12 C 16 O line shapes<br />
in the v ¼ 2 0 band. J Mol Spectrosc 2003;222:220–39.<br />
[89] Zou Q, Varanasi P. New laboratory data on the spectral line parameters in the 1-0 and 2-0 bands of 12 C 16 O<br />
relevant to atmospheric remote sensing. JQSRT 2002;75:63–92.<br />
[90] Devi VM, Benner DC, Smith MAH, Rinsland CP, Mantz AW. Determination of self- and H 2 -broadening and<br />
shift coefficients in the 2-0 band of 12 C 16 O using a multispectrum fitting procedure. JQSRT 2002;75:455–71.<br />
[91] Fukabori M, Aoki TA, Aoki TE, Ishida H, Watanabe T. Measurements of the line strengths and halfwidths of<br />
the (2-0) and (3-0) band of CO. Proceedings of the fifth <strong>HITRAN</strong> <strong>database</strong> conference, 23–25 September 1998.<br />
[92] Picque´ N, Guelachvili G, Dana V, Mandin JY. Absolute line intensities, vibrational transition moment, and selfbroadening<br />
coefficients for the 3-0 band of 12 C 16 O. J Mol Struct 2000;517-8:427–34.<br />
[93] Chackerian C, Freedman RS, Giver LP, Brown LR. Absolute rovibrational intensities and self-broadening and<br />
self-shift coefficients for the X 1 S þ V ¼ 3 V ¼ 0 band of 12 C 16 O. J Mol Spectrosc 2001;210:119–26.
ARTICLE IN PRESS<br />
200<br />
L.S. Rothman et al. / Journal of Quantitative Spectroscopy & Radiative Transfer 96 (2005) 139–204<br />
[94] Sung K, Varanasi P. Intensities, collision-broadened half-width, and collision-induced line shifts in the second<br />
overtone band of 12 C 16 O. JQSRT <strong>2004</strong>;82:445–58.<br />
[95] Régalia-Jarlot L, Thomas X, Von der Heyden P, Barbe A. Pressure-broadened line widths and pressure-induced<br />
line shifts coefficients of the (1-0) and (2-0) bands of 12 C 16 O. JQSRT 2005;91:121–31.<br />
[96] Smith MAH, Brown LR, Devi VM, Pittman TJ. CO broadening and shift parameters for TES. Proceedings of the<br />
eighth <strong>HITRAN</strong> <strong>database</strong> conference, Cambridge, MA, June 15–18. <strong>2004</strong>.<br />
[97] Connor BJ, Radford HE. Pressure broadening of the CO J ¼ 1 0 rotational transition by N 2 ; O 2 and air. J Mol<br />
Spectrosc 1986;119:229–31.<br />
[98] Predoi-Cross A, Bouanich JP, Benner DC, May AD, Drummond JR. Broadening, shifting, and line asymmetries<br />
in the 2 0 band of CO and CO–N 2 : experimental results and theoretical calculations. J Chem Phys<br />
2000;113:1–11.<br />
[99] Henningsen J, Simonsen H, Møgelberg T, Trudsø E. <strong>The</strong> 0 ! 3 overtone band of CO: precise linestrengths and<br />
broadening parameters. J Mol Spectrosc 1999;193:354–62.<br />
[100] Swann WC, Gilbert SL. Pressure-induced shift and broadening of 1560–1630-nm carbon monoxide wavelengthcalibration<br />
lines. J Opt Soc Am B 2002;19:2461–7.<br />
[101] Jacquemart D, Mandin JY, Dana V, Picque´ N, Guelachvili G. A multispectrum fitting procedure to deduce<br />
<strong>molecular</strong> line parameters: application to the 3-0 band of 12 C 16 O. Eur Phys J D 2001;14:55–69.<br />
[102] Devi VM, Benner DC, Smith MAH, Rinsland CP. Self-broadening and self-shift coefficients in the fundamental<br />
band of 12 C 16 O. JQSRT 1998;60:815–24.<br />
[103] Sun JNP, Griffiths PR. Temperature dependence of the self-broadening coefficients for the fundamental band of<br />
carbon monoxide. Appl Opt 1981;20:1691–5.<br />
[104] Nakazawa T, Tanaka M. Measurements of intensities and self- and foreign-gas-broadened half-widths of spectral<br />
lines in the CO fundamental band. JQSRT 1982;28:409–16.<br />
[105] Lowder JE. Self-broadened half-width measurements in the CO fundamental. JQSRT 1971;11:1647–57.<br />
[106] Hunt RH, Toth RA, Plyler EK. High-resolution determination of the line widths of the self-broadened lines of<br />
carbon monoxide. J Chem Phys 1968;49:3909–12.<br />
[107] BelBruno JJ, Gelfand J, Radigan W, Verges K. Helium and self-broadening in the first and second overtone<br />
bands of 12 C 16 O. J Mol Spectrosc 1982;94:336–42.<br />
[108] Brown LR. Empirical line parameters of methane from 1.1 to 2.1 mm. JQSRT this issue, doi:10.1016/<br />
j.jqsrt.<strong>2004</strong>.12.037.<br />
[109] Camy-Peyret C, LPMA, Paris, France, private communication based on Camy-Peyret C, Payan S, Jeseck P, Te´<br />
Y, Hawat T. High resolution balloon-borne spectroscopy within the O 2 A-band: observations and radiative<br />
transfer modeling. Paper E4, Proceedings of the international radiation symposium, Saint Petersburg, Russia,<br />
2000.<br />
[110] Goldman A, Brown LR, Schoenfeld WG, Spencer MN, Chackerian Jr C, Giver LP, Dothe H, Rinsland CP,<br />
Coudert LH, Dana V, Mandin JY. Nitric oxide line parameters: review of 1996 <strong>HITRAN</strong> update and new results.<br />
JQSRT 1998;60:825–38.<br />
[111] Gillis JR, Goldman A. Nitric oxide IR line parameters for the upper atmosphere. Appl Opt 1982;21:<br />
1616–27.<br />
[112] Chackerian C, Freedman RS, Giver LP, Brown LR. <strong>The</strong> NO vibrational fundamental band: O 2 -broadening<br />
coefficients. J Mol Spectrosc 1998;192:215–9.<br />
[113] Spencer MN, Chackerian C, Giver LP, Brown LR. <strong>The</strong> nitric oxide fundamental band: frequency and shape<br />
parameters for ro-vibrational lines. J Mol Spectrosc 1994;165:506–24.<br />
[114] Allout MY, Dana V, Mandin JY, Von der Heyden P, De´ catoire D, Plateaux JJ. Oxygen-broadening coefficients<br />
of first overtone nitric oxide lines. JQSRT 1999;61:759–65.<br />
[115] Mandin JY, Dana V, Régalia L, Thomas X, Barbe A. Nitrogen-broadening in the nitric oxide first overtone band.<br />
JQSRT 2000;66:93–100.<br />
[116] Pine AS, Maki AG, Chou NY. Pressure broadening lineshapes and intensity measurements in the 2 0 band of<br />
NO. J Mol Spectrosc 1985;114:132–47.<br />
[117] Spencer MN, Chackerian C, Giver LP, Brown LR. Temperature dependence of nitrogen broadening of the NO<br />
fundamental vibrational band. J Mol Spectrosc 1997;181:307–15.
ARTICLE IN PRESS<br />
L.S. Rothman et al. / Journal of Quantitative Spectroscopy & Radiative Transfer 96 (2005) 139–204 201<br />
[118] Pine AS, Johns JWC, Robiette AG. L-Doubling in the v ¼ 2 0 overtone band in the infrared spectrum of NO.<br />
J Mol Spectrosc 1979;74:52–69.<br />
[119] Chu PM, Wetzel SJ, Lafferty WJ, Perrin A, Flaud JM, Arcas Ph, Guelachvili G. Line intensities for the 8-mm<br />
bands of SO 2 . J Mol Spectrosc 1998;189:55–63.<br />
[120] Sumpf B. Line intensity and self-broadening investigations in the n 1 and the n 3 bands of SO 2 . J Mol Struct<br />
2001;599:39–49.<br />
[121] Henningsen J. Private communication. Danish Institute for Fundamental Metrology, Lyngby, Denmark, <strong>2004</strong>.<br />
[122] Benner DC, Blake TA, Brown LR, Devi VM, Smith MAH, Toth RA. Air-broadening parameters in the n 3 band<br />
of 14 N 16 O 2 using a multispectrum fitting technique. J Mol Spectrosc <strong>2004</strong>;228:593–619.<br />
[123] Kleiner I, Tarrago G, Cottaz C, Sagui L, Brown LR, Poynter RL, Pickett HM, Chen P, Pearson JC, Sams RL,<br />
Blake GA, Matsuura S, Nemtchinov V, Varanasi P, Fusina L, Di Lonardo G. NH 3 and PH 3 line parameters: the<br />
2000 <strong>HITRAN</strong> update and new results. JQSRT 2003;82:293–312.<br />
[124] Zu L, Hamilton PA, Davies PB. Pressure broadening and frequency measurements of nitric acid lines in the<br />
683 GHz region. JQSRT 2002;73:545–56.<br />
[125] Petkie DT, Helminger P, Winnewisser BP, Winnewisser M, Butler RAH, Jucks KW, De Lucia FC. <strong>The</strong><br />
simulation of infrared bands from the analyses of rotational spectra: the 2n 9 n 9 and n 5 n 9 hot bands of HNO 3 .<br />
JQSRT 2005;92:129–41.<br />
[126] Toth RA, Brown LR, Cohen EA. Line intensities of HNO 3 . J Mol Spectrosc 2003;218:151–68.<br />
[127] Rothman LS, Rinsland CP, Goldman A, Massie ST, Edwards DP, Flaud JM, Perrin A, Camy-Peyret C, Dana V,<br />
Mandin JY, Schrœder J, McCann A, Gamache RR, Wattson RB, Yoshino K, Chance KV, Jucks KW, Brown<br />
LR, Nemtchinov V, Varanasi P. <strong>The</strong> <strong>HITRAN</strong> <strong>molecular</strong> <strong>spectroscopic</strong> <strong>database</strong> and HAWKS (<strong>HITRAN</strong><br />
atmospheric workstation): 1996 edition. JQSRT 1998;60:665–710.<br />
[128] Goldman A, Rinsland CP, Perrin A, Flaud JM. HNO 3 Line parameters: 1996 <strong>HITRAN</strong> update and new results.<br />
JQSRT 1998;60:851–61.<br />
[129] Perrin A, Flaud JM, Camy-Peyret C, Winnewisser BP, Klee S, Goldman A, Murcray FJ, Blatherwick RD,<br />
Bonomo FS, Murcray DG. First analysis of the 3n 9 n 9 ; 3n 9 n 5 and 3n 9 2n 9 bands of HNO 3 : torsional<br />
splitting in the n 9 vibrational mode. J Mol Spectrosc 1994;166:224–43.<br />
[130] Flaud JM, Perrin A, Orphal J, Kou Q, Flaud PM, Dutkiewicz Z, Piccolo C. New analysis of the n 5 þ n 9 n 9 hot<br />
band of HNO 3 . JQSRT 2003;77:355–64.<br />
[131] Chackerian C, Sharpe SW, Blake TA. Anhydrous nitric acid integrated absorption cross sections: 820–5300 cm 1 .<br />
JQSRT 2003;82:429–41.<br />
[132] Giver LP, Valero FPJ, Goorvitch D, Bonomo FS. Nitric-acid band intensity and band-model parameters from<br />
610 to 1760 cm 1 . J Opt Soc Am B 1984;1:715–22.<br />
[133] Boone C, Bernath PF, Private communication. University of Waterloo, Canada, <strong>2004</strong>. See also http://<br />
www.ace.uwaterloo.com<br />
[134] Brockman P, Bair CH, Allario F. High resolution spectral measurement of the HNO 3 11.3-mm band using<br />
tunable diode lasers. Appl Opt 1978;17:91–9.<br />
[135] Goldman A, Schoenfeld WG, Goorvitch D, Chackerian C, Dothe H, Me´ len F, Abrams MC, Selby JEA. Updated<br />
line parameters for OH X 2 P—X 2 Pðv 00 ; v 0 Þ transitions. JQSRT 1998;59:453–69.<br />
[136] Colin R, Coheur PF, Kisaleva M, Vandaele AC, Bernath PF. Spectroscopic constants and term values for the<br />
X 2 P i state of OH (v ¼ 0–10). J Mol Spectrosc 2002;214:225–6.<br />
[137] Bulanin MO, Domanskaya AV, Kerl K. High-resolution FTIR measurement of the line parameters in the<br />
fundamental band of HI. J Mol Spectrosc 2003;218:75–9.<br />
[138] Goldman A, Coffey MT, Hannigan JW, Mankin WG, Chance K, Rinsland CP. HBr and HI line parameters<br />
update for atmospheric spectroscopy <strong>database</strong>s. JQSRT 2003;82:313–8.<br />
[139] Régalia-Jarlot L, Hamdouni A, Thomas X, Von der Heyden P, Barbe A. Line intensities of the n 3 ; 4n 2 ; n 1 þ n 3 ; 3n 1 ,<br />
and 2n 1 þ n 2 bands of the 16 O 12 C 32 S molecule. JQSRT 2002;74:455–70.<br />
[140] Vander Auwera J, Fayt A. Absolute line intensities for carbonyl sulfide from 827 to 2939 cm 1 . J Mol Struct 2005,<br />
in press.<br />
[141] Rbaihi E, Belafhal A, Vander Auwera J, Naı¨ m S, Fayt A. Fourier transform spectroscopy of carbonyl sulfide<br />
from 4800 to 8000 cm 1 and new global analysis of 16 O 12 C 32 S. J Mol Spectrosc 1998;191:32–44.
ARTICLE IN PRESS<br />
202<br />
L.S. Rothman et al. / Journal of Quantitative Spectroscopy & Radiative Transfer 96 (2005) 139–204<br />
[142] Strugariu T, Naim S, Fayt A, Bredohl AH, Blavier JF, Dubois I. Fourier transform spectroscopy of 18 O-enriched<br />
carbonyl sulfide from 1825 to 2700 cm 1 . J Mol Spectrosc 1998;189:206–19.<br />
[143] Bermejo D, Domenech JL, Santos J, Bouanich JP, Blanquet G. Absolute line intensities in the 2n 3 band of<br />
16 O 12 C 32 S. J Mol Spectrosc 1997;185:26–30.<br />
[144] Perrin A, Keller K, Flaud JM. New analysis of the n 2 ; n 3 ; n 4 and n 6 bands of formaldehyde H 12 2 C 16 O line positions<br />
and intensities in the 5–10 mm spectral region. J Mol Spectrosc 2003;221:192–8.<br />
[145] Flaud JM, Birk M, Wagner G, Orphal J, Klee S, Lafferty WJ. <strong>The</strong> far-infrared spectrum of HOCl: line positions<br />
and intensities. J Mol Spectrosc 1998;191:362–7.<br />
[146] Vander Auwera J, Kleffmann J, Flaud JM, Pawelke G, Burger H, Hurtmans D, Petrisse R. Absolute n 2 line<br />
intensities of HOCl by simultaneous measurements in the infrared with a tunable diode laser and far-infrared<br />
region using a Fourier transform spectrometer. J Mol Spectrosc 2000;204:36–47.<br />
[147] Shorter JH, Nelson DD, Zahniser MS. Air-broadened linewidth measurements in the n 2 vibrational band of<br />
HOCl. J Chem Soc Faraday Trans 1997;93:2933–5.<br />
[148] Bernath PF. Private communication. University of Waterloo, Canada, <strong>2004</strong>.<br />
[149] Maki AG, Mellau GC, Klee S, Winnewisser M, Quapp W. High-temperature infrared measurements in the region<br />
of the bending fundamental of H 12 C 14 N, H 12 C 15 N, and H 13 C 14 N. J Mol Spectrosc 2000;202:67–82;<br />
Maki AG, Quapp W, Klee S, Mellau GC, Albert S. Infrared transitions of H 12 C 14 N and H 12 C 15 N between 500<br />
and 10000 cm 1 . J Mol Spectrosc 1996;180:323–36.<br />
[150] Devi VM, Benner DC, Smith MAH, Rinsland CP, Sharpe SW, Sams RL. A multispectrum analysis of the n 1 band<br />
of H 12 C 14 N: I. Intensities, self-broadening and self-shift coefficients. JQSRT 2003;82:319–42.<br />
[151] Devi VM, Benner DC, Smith MAH, Rinsland CP, Sharpe SW, Sams RL. A multispectrum analysis of<br />
the 2n 2 spectral region of H 12 C 14 N: intensities, broadening and pressure-shift coefficients. JQSRT <strong>2004</strong>;87:<br />
339–66.<br />
[152] Rinsland CP, Devi VM, Smith MAH, Benner DC, Sharpe SW, Sams RL. A multispectrum analysis of the<br />
n 1 band of H 12 C 14 N: II. Air- and N 2 -broadening, shifts and their temperature dependences. JQSRT 2003;<br />
82:343–62.<br />
[153] Malathy Devi V, Benner DC, Smith MAH, Rinsland CP, Predoi-Cross A, Sharpe SW, Sams RL, Boulet C,<br />
Bouanich JP. A multispectrum analysis of the n 2 band of H 12 C 14 N: Part I. Intensities, broadening and shift<br />
coefficients. J Mol Spectrosc 2005;231:66–84 Bouanich JP, Boulet C, Predoi-Cross A, Sharpe SW, Sams RL,<br />
Smith MAH, Rinsland CP, Benner DC, Malathy Devi V. A multispectrum analysis of the n 2 band of H 12 C 14 N:<br />
Part II. <strong>The</strong>oretical calculations of self-broadening, self-induced shifts and their temperature dependences. J Mol<br />
Spectrosc 2005;231:85–95.<br />
[154] Chackerian C, Brown LR, Lacome N, Tarrago G. Methyl chloride n 5 region line shape parameters and rotational<br />
constants for the n 2 ; n 5 and 2n 3 vibrational bands. J Mol Spectrosc 1998;191:148–57.<br />
[155] Bouanich JP, Blanquet G, Populaire JC, Walrand J. N 2 -Broadening for methyl chloride at low temperature by<br />
diode-laser spectroscopy. J Mol Spectrosc 2001;208:72–8.<br />
[156] El Hachtouki R, Vander Auwera J. Absolute line intensities in acetylene: the 1.5-mm region. J Mol Spectrosc<br />
2002;216:355–62.<br />
[157] Kou Q, Guelachvili G, Abbouti Temsamani M, Herman M. <strong>The</strong> absorption spectrum of C 2 H 2 around n 1 þ n 3 :<br />
energy standards in the 1:5 mm region and vibrational clustering. Can J Phys 1994;72:1241–50.<br />
[158] Nakagawa K, De Labachelerie M, Awaji Y, Kourogi M. Accurate optical frequency atlas of the 1.5 microns band<br />
of acetylene. J Opt Soc Am B 1996;13:2708–14.<br />
[159] Pine AS, Rinsland CP. <strong>The</strong> role of torsional hot bands in modeling atmospheric ethane. JQSRT 1999;62:445–58.<br />
[160] Brown LR, Sams RL, Kleiner I, Cottaz C, Sagui L. Line intensities of the phosphine dyad at 10 mm. J Mol<br />
Spectrosc 2002;215:178–203.<br />
[161] Tarrago G, Lacome N, Levy A, Guelachvili G, Benzard B, Drossart P. Phosphine spectrum at 4–5 mm: analysis<br />
and line-by-line simulation of 2n 2 ; n 2 þ n 4 ; 2n 4 ; n 1 , and n 3 bands. J Mol Spectrosc 1992;154:30–42.<br />
[162] Cohen EA. Private communication. Jet Propulsion Laboratory. 2001.<br />
[163] Acef O, Borde´ CJ, Clairon A, Pierre G, Sartakov B. New accurate fit of an extended set of saturation data for the<br />
n 3 band of SF 6 : comparison of Hamiltonians in the spherical and cubic tensor formalisms. J Mol Spectrosc<br />
2000;199:188–204.
ARTICLE IN PRESS<br />
L.S. Rothman et al. / Journal of Quantitative Spectroscopy & Radiative Transfer 96 (2005) 139–204 203<br />
[164] Boudon V, Pierre G. In: Pandalai SG, editor. Rovibrational spectroscopy of sulphur hexafluoride: a review in<br />
recent research developments in <strong>molecular</strong> spectroscopy. Vol. 1. Trivandrum, India: Transworld Research<br />
Network; 2002; p. 25–55.<br />
[165] Boudon V, Lacome N. High-resolution FTIR spectrum and analysis of the n 2 þ n 4 combination band of 32 SF 6 .J<br />
Mol Spectrosc 2003;222:291–5.<br />
[166] Tejwani GDT, Fox K. Calculated self- and foreign-gas-broadened linewidths for SF 6 . JQSRT 1987;37:541–6.<br />
[167] Sumpf B, Meusel I, Kronfeldt HD. Self- and air-broadening in the n 1 and n 3 bands of H 2 S. J Mol Spectrosc<br />
1996;177:143–5.<br />
[168] Kissel A, Kurtz O, Kronfeldt HD, Sumpf B. Quantum number and perturber dependence of pressure-induced<br />
line shift and line broadening in the 2n 2 ; n 1 , and n 3 bands of H 2 S. 15th International Conference on High<br />
Resolution Molecular Spectroscopy, Prague, Czech Republic, August 30–September 3, 1998.<br />
[169] Kissel A, Sumpf B, Kronfeldt HD, Tikhomirov BA, Ponomarev YN. Molecular-gas-pressure-induced line-shift<br />
and line-broadening in the n 2 -band of H 2 S. J Mol Spectrosc 2002;216:345–54.<br />
[170] Waschull J, Kuhnemann F, Sumpf B. Self-, air- and helium broadening of the n 2 band of H 2 S. J Mol Spectrosc<br />
1994;165:150–8.<br />
[171] Sumpf B. Experimental investigation of the self-broadening coefficients in the n 1 þ n 3 band of SO 2 and the 2n 2<br />
band of H 2 S. J Mol Spectrosc 1997;181:160–7.<br />
[172] Vander Auwera J. ULB, Brussels, Belgium, private communication (<strong>2004</strong>), based on Vander Auwera J. Highresolution<br />
investigation of the far-infrared spectrum of formic acid. J Mol Spectrosc 1992;155:136–42.<br />
[173] Winnewisser M, Winnewisser BP, Stein M, Birk M, Wagner G, Winnewisser G, Yamada KMT, Belov SP,<br />
Baskakov OI. Rotational spectra of cis-HCOOH, trans-HCOOH, and trans-H 13 COOH. J Mol Spectrosc<br />
2002;216:259–65.<br />
[174] Perrin A, Rinsland CP, Goldman A. Spectral parameters for the n 6 region of HCOOH and its measurement in the<br />
infrared tropospheric spectrum. J Geophys Res 1999;104:18661–6.<br />
[175] Shepard MW, Goldman A, Clough SA, Mlawer EJ. Spectroscopic improvements providing evidence of formic<br />
acid in AERI-LBLRTM validation spectra. JQSRT 2003;82:383–90.<br />
[176] Vander Auwera J, Didriche K, Perrin A, Keller F, Flaud JM. Absolute line intensities in the n 6 band of<br />
trans-formic acid. Proceedings of the eighth <strong>HITRAN</strong> <strong>database</strong> conference, Cambridge, MA, 16–18 June, <strong>2004</strong>.<br />
p. 21.<br />
[177] Goldman A, Gillis JR. Line parameters and line-by-line calculations for molecules of stratospheric interest.<br />
Progress report, Department of Physics, University of Denver, 1984.<br />
[178] Perrin A, Flaud JM, Bakri B, Demaison J, Basakov O, Sirota SV, Herman M, Vander Auwera J. New highresolution<br />
analysis of the n 7 and n 9 fundamental bands of trans-formic acid by Fourier transform infrared and<br />
millimeter-wave spectroscopy. J Mol Spectrosc 2002;216:203–13.<br />
[179] Chance K, Jucks KW, Johnson DG, Traub WA. <strong>The</strong> Smithsonian Astrophysical Observatory Database SAO92.<br />
JQSRT 1994;52:447–57.<br />
[180] Yamada C, Endo Y, Hirota E. Difference frequency laser spectroscopy of the n 1 band of the HO 2 radical. J Chem<br />
Phys 1983;78:4379–84.<br />
[181] Nagai K, Endo Y, Hirota E. Diode laser spectroscopy of the HO 2 n 2 band. J Mol Spectrosc 1981;89:520–7.<br />
[182] Nelson DD, Zahniser MS. Diode laser spectroscopy of the n 3 vibration of the HO 2 radical. J Mol Spectrosc<br />
1991;150:527–34.<br />
[183] Mu¨ ller HSP, Thorwirth S, Roth DA, Winnewisser G. <strong>The</strong> Cologne Database for Molecular Spectroscopy.<br />
CDMS. Astronomy & Astrophysics 2001;370:L49–52.<br />
[184] Xu LH, Lees RM, Wang P, Brown LR, Kleiner I, Johns JWC. New assignments, line intensities, and <strong>HITRAN</strong><br />
<strong>database</strong> for CH 3 OH at 10 mm. J Mol Spectrosc <strong>2004</strong>;228:453–70.<br />
[185] Wagner G, Birk M. New infrared <strong>spectroscopic</strong> <strong>database</strong> for chlorine nitrate. JQSRT 2003;82:443–60.<br />
[186] Ballard J, Johnston WB, Gunson MR, Wassell PT. Absolute absorption coefficients of ClONO 2 infrared bands at<br />
stratospheric temperatures. J Geophys Res 1988;93:1659–65.<br />
[187] May RD, Friedl RR. Integrated band intensities of HO 2 NO 2 at 220 K. JQSRT 1993;50:257–66.<br />
[188] Rinsland CP, Sharpe SW, Sams RL. Temperature-dependent cross-sections in the thermal infrared bands of<br />
SF 5 CF 3 . JQSRT 2003;82:483–90.
ARTICLE IN PRESS<br />
204<br />
L.S. Rothman et al. / Journal of Quantitative Spectroscopy & Radiative Transfer 96 (2005) 139–204<br />
[189] Allen G, Remedios JJ, Newnham DA, Smith KM, Monks PS. High resolution mid-infrared cross-sections for<br />
peroxyacetyl nitrate (PAN) vapour. Atmos Chem Phys Discuss <strong>2004</strong>;4:5656–81.<br />
[190] Orlando JJ, Tyndall GS. Private communication. National Center for Atmospheric Research, Boulder CO, USA.<br />
<strong>2004</strong>.<br />
[191] Beer R, Glavich TA, Rider DM. Tropospheric emission spectrometer for the Earth Observing System’s AURA<br />
satellite. Appl Opt 2001;40:2356–67.<br />
[192] Bass AM, Paur RJ. UV absorption cross-sections for ozone: the temperature dependence. J Photochem<br />
1981;17:41;<br />
Bass AM, Paur RJ. <strong>The</strong> ultraviolet cross-sections of ozone: I the measurements. In: Zerefos CS, Ghazi A, editors.<br />
Atmospheric ozone. Dordrecht: Reidel D; 1985. p. 606–10;<br />
Bass AM, Paur RJ. <strong>The</strong> ultraviolet cross-sections of ozone: II results and temperature dependence. In: Zerefos<br />
CS, Ghazi A, editors. Atmospheric ozone. Dordrecht: Reidel D; 1985. p. 611–6.<br />
[193] Edle´ n B. <strong>The</strong> refractive index of air. Metrologia 1966;2:71–80.<br />
[194] Voigt S, Orphal J, Bogumil K, Burrows JP. <strong>The</strong> temperature dependence (203–293 K) of the absorption cross<br />
sections of O 3 in the 230–850 nm region measured by Fourier-transform spectroscopy. J Photochem Photobiol A:<br />
Chem 2001;143:1–9.<br />
[195] Orphal J, Fellows CE, Flaud PM. <strong>The</strong> visible absorption spectrum of NO 3 measured by high-resolution Fouriertransform<br />
spectroscopy. J Geophys Res 2003;108(D3):4077.<br />
[196] Wilmouth DM, Hanisco TF, Donahue NM, Anderson JG. Fourier transform ultraviolet spectroscopy of the A<br />
2 P 3=2<br />
X 2 P 3=2<br />
transition of BrO. J Phys Chem 199; 103:8935–8945.<br />
[197] Kromminga H, Orphal J, Spietz P, Voigt S, Burrows JP. <strong>The</strong> temperature dependence (213–293 K) of the<br />
absorption cross-sections of OClO in the 340–450 nm region measured by Fourier-transform spectroscopy.<br />
J Photochem Photobiol A: Chem 2003;157:149–60.<br />
[198] Cantrell CA, Davidson JA, McDaniel AH, Shetter RE, Calvert JG. Temperature-dependent formaldehyde cross<br />
sections in the near-ultraviolet spectral region. J Phys Chem 1990;94:3902–8.<br />
[199] Greenblatt GD, Orlando JJ, Burkholder JB, Ravishankara AR. Absorption measurements of oxygen between<br />
330 and 1140 nm. J Geophys Res 1990;95:18577–82.<br />
[200] Massie ST, Goldman A. <strong>The</strong> infrared absorption cross-section and refractive-index data in <strong>HITRAN</strong>. JQSRT<br />
2003;82:413–28.<br />
[201] Norman ML, Miller RE, Worsnop DR. Ternary H 2 O/HNO 3 /H 2 O optical constants: new measurements from<br />
aerosol spectroscopy under stratospheric conditions. J Phys Chem 2002;106:6075–83.<br />
[202] Adams RW, Downing HD. Infrared optical constants of ternary system of 75% H 2 SO 4 10% HNO 3 and 15%<br />
H 2 O. J Opt Soc Am 1986;3:22–8.<br />
[203] Biermann UM, Luo BP, Peter T. Absorption spectra and optical constants of binary and ternary solutions of<br />
H 2 SO 4 , HNO 3 , and H 2 O in the mid infrared at atmospheric temperatures. J Phys Chem 2000;104:783–93.<br />
[204] Luo B, Krieger UK, Peter T. Densities and refractive indices of H 2 SO 4 /HNO 3 /H 2 O solutions to stratospheric<br />
temperatures. Geophys Res Lett 1996;23:3707–10.<br />
[205] Fischer J, Gamache RR, Goldman RR, Rothman LS, Perrin A. Total internal partition sums for <strong>molecular</strong><br />
species on the 2000 edition of the <strong>HITRAN</strong> <strong>database</strong>. JQSRT 2003;82:401–12.<br />
[206] Goldman A, Gamache RR, Perrin A, Flaud JM, Rinsland CP, Rothman LS. <strong>HITRAN</strong> partition functions and<br />
weighted transition probabilities. JQSRT 2000;66:455–86.