
Create successful ePaper yourself
Turn your PDF publications into a flip-book with our unique Google optimized e-Paper software.
Singapore Telecommunications Limited and Subsidiary Companies<br />
Annual Report 2013<br />
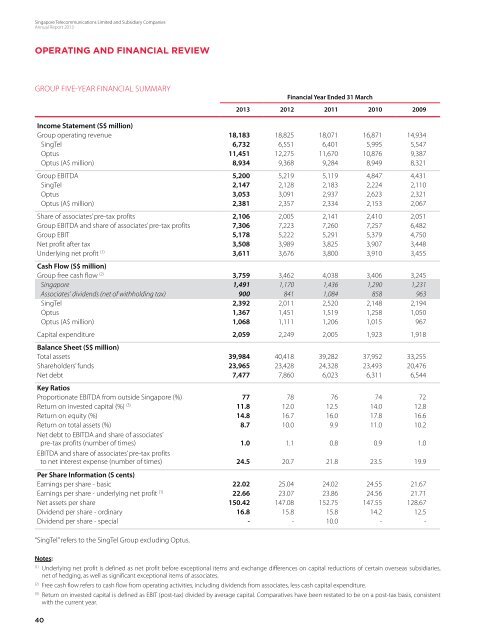
OPERATING AND FINANCIAL REVIEW<br />
Group Five-Year Financial Summary<br />
Financial Year Ended 31 March<br />
2013 2012 2011 2010 2009<br />
Income Statement (S$ million)<br />
Group operating revenue 18,183 18,825 18,071 16,871 14,934<br />
<strong>SingTel</strong> 6,732 6,551 6,401 5,995 5,547<br />
Optus 11,451 12,275 11,670 10,876 9,387<br />
Optus (A$ million) 8,934 9,368 9,284 8,949 8,321<br />
Group EBITDA 5,200 5,219 5,119 4,847 4,431<br />
<strong>SingTel</strong> 2,147 2,128 2,183 2,224 2,110<br />
Optus 3,053 3,091 2,937 2,623 2,321<br />
Optus (A$ million) 2,381 2,357 2,334 2,153 2,067<br />
Share of associates’ pre-tax profits 2,106 2,005 2,141 2,410 2,051<br />
Group EBITDA and share of associates’ pre-tax profits 7,306 7,223 7,260 7,257 6,482<br />
Group EBIT 5,178 5,222 5,291 5,379 4,750<br />
Net profit after tax 3,508 3,989 3,825 3,907 3,448<br />
Underlying net profit (1) 3,611 3,676 3,800 3,910 3,455<br />
Cash Flow (S$ million)<br />
Group free cash flow (2) 3,759 3,462 4,038 3,406 3,245<br />
Singapore 1,491 1,170 1,436 1,290 1,231<br />
Associates’ dividends (net of withholding tax) 900 841 1,084 858 963<br />
<strong>SingTel</strong> 2,392 2,011 2,520 2,148 2,194<br />
Optus 1,367 1,451 1,519 1,258 1,050<br />
Optus (A$ million) 1,068 1,111 1,206 1,015 967<br />
Capital expenditure 2,059 2,249 2,005 1,923 1,918<br />
Balance Sheet (S$ million)<br />
Total assets 39,984 40,418 39,282 37,952 33,255<br />
Shareholders’ funds 23,965 23,428 24,328 23,493 20,476<br />
Net debt 7,477 7,860 6,023 6,311 6,544<br />
Key Ratios<br />
Proportionate EBITDA from outside Singapore (%) 77 78 76 74 72<br />
Return on invested capital (%) (3) 11.8 12.0 12.5 14.0 12.8<br />
Return on equity (%) 14.8 16.7 16.0 17.8 16.6<br />
Return on total assets (%) 8.7 10.0 9.9 11.0 10.2<br />
Net debt to EBITDA and share of associates’<br />
pre-tax profits (number of times) 1.0 1.1 0.8 0.9 1.0<br />
EBITDA and share of associates’ pre-tax profits<br />
to net interest expense (number of times) 24.5 20.7 21.8 23.5 19.9<br />
Per Share Information (S cents)<br />
Earnings per share - basic 22.02 25.04 24.02 24.55 21.67<br />
Earnings per share - underlying net profit (1) 22.66 23.07 23.86 24.56 21.71<br />
Net assets per share 150.42 147.08 152.75 147.55 128.67<br />
Dividend per share - ordinary 16.8 15.8 15.8 14.2 12.5<br />
Dividend per share - special - - 10.0 - -<br />
“<strong>SingTel</strong>” refers to the <strong>SingTel</strong> Group excluding Optus.<br />
Notes:<br />
(1)<br />
Underlying net profit is defined as net profit before exceptional items and exchange differences on capital reductions of certain overseas subsidiaries,<br />
net of hedging, as well as significant exceptional items of associates.<br />
(2)<br />
Free cash flow refers to cash flow from operating activities, including dividends from associates, less cash capital expenditure.<br />
(3)<br />
Return on invested capital is defined as EBIT (post-tax) divided by average capital. Comparatives have been restated to be on a post-tax basis, consistent<br />
with the current year.<br />
40