
Create successful ePaper yourself
Turn your PDF publications into a flip-book with our unique Google optimized e-Paper software.
Singapore Telecommunications Limited and Subsidiary Companies<br />
Annual Report 2013<br />
OPERATING AND FINANCIAL REVIEW<br />
MANAGEMENT DISCUSSION AND ANALYSIS<br />
Blended ARPU was A$42, down A$3 year-on-year, and would<br />
have declined A$1 if excluding the impact of the reduction in<br />
mobile termination rates and the service credits associated with the<br />
device repayment plans. SMS and other data revenue grew to 51%<br />
(FY2012: 46%) of ARPU while non-SMS data revenue increased to<br />
27% (FY2012: 22%) of ARPU.<br />
Business and Wholesale Fixed accounted for 23% of Optus’ operating<br />
revenue and 23% of Optus’ EBITDA. Revenue was stable at A$2.01<br />
billion as Optus continued to exit unprofitable off-net services. The<br />
higher satellite and ICT and managed services revenues were offset<br />
by the lower voice and Data and IP revenues. EBITDA increased<br />
1.4% to A$553 million.<br />
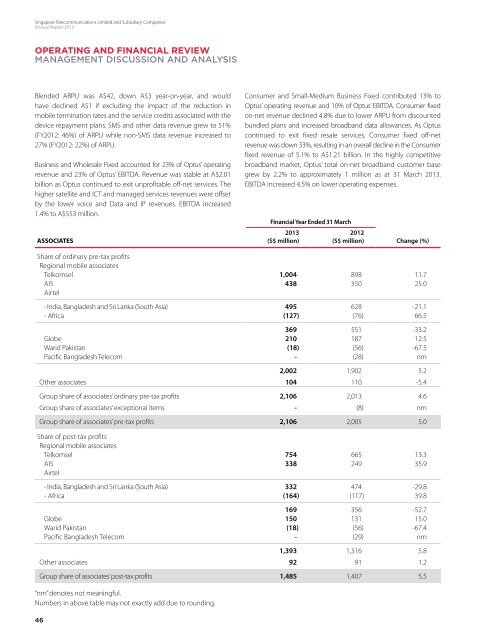
ASSOCIATES<br />
Consumer and Small-Medium Business Fixed contributed 13% to<br />
Optus’ operating revenue and 10% of Optus’ EBITDA. Consumer fixed<br />
on-net revenue declined 4.8% due to lower ARPU from discounted<br />
bundled plans and increased broadband data allowances. As Optus<br />
continued to exit fixed resale services, Consumer fixed off-net<br />
revenue was down 33%, resulting in an overall decline in the Consumer<br />
fixed revenue of 5.1% to A$1.21 billion. In the highly competitive<br />
broadband market, Optus’ total on-net broadband customer base<br />
grew by 2.2% to approximately 1 million as at 31 March 2013.<br />
EBITDA increased 4.5% on lower operating expenses.<br />
Financial Year Ended 31 March<br />
2013<br />
(S$ million)<br />
2012<br />
(S$ million) Change (%)<br />
Share of ordinary pre-tax profits<br />
Regional mobile associates<br />
Telkomsel 1,004 898 11.7<br />
AIS 438 350 25.0<br />
Airtel<br />
- India, Bangladesh and Sri Lanka (South Asia) 495 628 -21.1<br />
- Africa (127) (76) 66.5<br />
369 551 -33.2<br />
Globe 210 187 12.5<br />
Warid Pakistan (18) (56) -67.5<br />
Pacific Bangladesh Telecom - (28) nm<br />
2,002 1,902 5.2<br />
Other associates 104 110 -5.4<br />
Group share of associates’ ordinary pre-tax profits 2,106 2,013 4.6<br />
Group share of associates’ exceptional items - (8) nm<br />
Group share of associates’ pre-tax profits 2,106 2,005 5.0<br />
Share of post-tax profits<br />
Regional mobile associates<br />
Telkomsel 754 665 13.3<br />
AIS 338 249 35.9<br />
Airtel<br />
- India, Bangladesh and Sri Lanka (South Asia) 332 474 -29.8<br />
- Africa (164) (117) 39.8<br />
169 356 -52.7<br />
Globe 150 131 15.0<br />
Warid Pakistan (18) (56) -67.4<br />
Pacific Bangladesh Telecom - (29) nm<br />
1,393 1,316 5.8<br />
Other associates 92 91 1.2<br />
Numbers Group share in above of associates’ table may not post-tax exactly profits add due to rounding.<br />
1,485 1,407 5.5<br />
“nm” denotes not meaningful.<br />
Numbers in above table may not exactly add due to rounding.<br />
46