Annual Report 2005 (6 MB) - Lundin Petroleum
Annual Report 2005 (6 MB) - Lundin Petroleum
Annual Report 2005 (6 MB) - Lundin Petroleum

Create successful ePaper yourself
Turn your PDF publications into a flip-book with our unique Google optimized e-Paper software.
ANNUAL REPORT <strong>2005</strong>
<strong>2005</strong> Highlights - Outlook 2006 1<br />
Letter to shareholders - C. Ashley Heppenstall, CEO 2<br />
Words from the Chairman - Ian H. <strong>Lundin</strong> 4<br />
Vision, strategy, fi nancial objectives 5<br />
Understanding reserves and resources 6<br />
Market description 8<br />
OPERATIONS<br />
Operations review - Alexandre Schneiter, COO 10<br />
United Kingdom 12<br />
Norway 13<br />
France, Netherlands 14<br />
Tunisia 15<br />
Indonesia, Venezuela 16<br />
Sudan, Albania 17<br />
Ireland, Nigeria 18<br />
Exploration new ventures 19<br />
GOVERNANCE , MANAGEMENT<br />
Corporate responsibility 21<br />
Share information 24<br />
Board of directors 26<br />
Management and auditors 30<br />
Corporate governance report 32<br />
Internal control report 34<br />
FINANCIAL<br />
Key fi nancial data 36<br />
Directors’ report 37<br />
Income statement 45<br />
Balance sheet 46<br />
Statement of cash fl ow 47<br />
Statement of changes in equity 48<br />
Accounting principles 50<br />
Notes to the fi nancial statements 57<br />
Auditors’ report 79<br />
Reserve quantity information 80<br />
Financial report dates 81<br />
AGM 2006 81<br />
Defi nitions 81<br />
PRODUCTION (BOEPD)<br />
40,000<br />
30,000<br />
20,000<br />
10,000<br />
0<br />
02 03 04<br />
RESULTS<br />
05<br />
<strong>2005</strong> HIGHLIGHTS<br />
■ Average production increased to 33,190 boepd (28,921 boepd)<br />
■ Operating income increased to MSEK 4,190.2 (MSEK 2,468.3)<br />
■ Net profi t (profi t after tax) increased to MSEK 994 (MSEK 605.3)<br />
■ Operating cash fl ow increased to MSEK 2,627.4 (MSEK 1,502.8)<br />
■ EBITDA of MSEK 2,782.6 (MSEK 1,281.5)<br />
■ Diluted earnings per share was SEK 3.87 (SEK 2.37)<br />
■ Debt/equity ratio was 9% (45%)<br />
2004 in in brackets<br />
OPERATIONS<br />
1,000<br />
750<br />
500<br />
250<br />
PROFIT (MSEK) 1)<br />
■ Proved and probable reserves increased by 12%<br />
■ Broom Phase 2 successfully completed<br />
■ New exploration licences awarded in the United Kingdom and Norway<br />
■ Ongoing development of the Alvheim fi eld in Norway and the Oudna<br />
fi eld in Tunisia<br />
■ Increased global market price for oil and gas<br />
OUTLOOK 2006<br />
■ Capital budget for development and exploration over MUSD 300<br />
■ Active global exploration programme<br />
- 15 wells planned<br />
- Seismic acquisition programmes in United Kingdom and Sudan<br />
■ Ongoing development projects<br />
- Alvheim, off shore Norway<br />
- Oudna, off shore Tunisia<br />
- TBA, off shore Salawati Island Indonesia<br />
■ Further infi ll drilling in the UK North Sea<br />
0<br />
02 03 04<br />
05<br />
1) Adjusted to exclude sale of assets<br />
3,000<br />
2,000<br />
1,000<br />
0<br />
EBITDA (MSEK)<br />
02 03 04 05<br />
CASH FLOW (MSEK)<br />
3,000<br />
2,000<br />
1,000<br />
0<br />
02 03 04 05
LUNDIN PETROLEUM’S CONTINUED GROWTH<br />
A strong and diverse asset base gives us a solid springboard in our<br />
search for new oil and gas reserves. We have the global and local<br />
experience to fi nd and develop these resources in a profi table<br />
and responsible manner. Ongoing exploration, development and<br />
production projects in Europe, Africa, South America and the Far<br />
East will ensure our future as one of Europe’s leading independent<br />
oil companies<br />
YEAR <strong>2005</strong> 2004 2003 2002 2001<br />
Net result, MSEK* 970.0 507.1 218.0 -17.3 -42.0<br />
EBITDA, MSEK 2,782.6 1,281.5 542.8 60.8 -18.0<br />
Cash fl ow, MSEK 2,627.4 1,502.8 634.6 115.1 0.2<br />
Debt/equity ratio, % 9 45 – 89 –<br />
Production in MMboe 12.1 9.8 5.8 1.4 –<br />
Production in boepd 33,190 28,921 16,062 14,010 –<br />
* Excluding result on sale of assets<br />
> 1
LETTER TO SHAREHOLDERS<br />
...fi rst production from the Oudna<br />
fi eld off shore Tunisia and the<br />
Alvheim fi eld off shore Norway will<br />
take <strong>Lundin</strong> <strong>Petroleum</strong> production to<br />
over 50,000 boepd<br />
C. ASHLEY HEPPENSTALL<br />
President and CEO<br />
Dear Fellow Shareholders,<br />
<strong>Lundin</strong> <strong>Petroleum</strong> continued its rapid growth in <strong>2005</strong> generating record<br />
net profi t and operating cash fl ow. Our continued ability to increase<br />
reserves and production coupled with strong world oil prices has driven<br />
the strong fi nancial performance.<br />
Financial performance<br />
<strong>Lundin</strong> <strong>Petroleum</strong> generated a net profi t after taxes of MSEK 994.0<br />
(MUSD 133.3) and an operating cash fl ow of MSEK 2,627.4 (MUSD 352.4)<br />
during <strong>2005</strong>. This represents increases of 64 percent and 75 percent<br />
respectively compared to 2004. The table opposite summarises the<br />
growth achieved by <strong>Lundin</strong> <strong>Petroleum</strong> over the last three years.<br />
Reserves and production<br />
I continue to emphasise that the success of <strong>Lundin</strong> <strong>Petroleum</strong> will be<br />
driven by our ability to increase reserves and production. Despite <strong>2005</strong><br />
being disappointing from an exploration perspective, we continue to be<br />
successful in increasing our reserve base. Primarily as a result of the United<br />
Kingdom development drilling and development studies in Norway, we<br />
announced third party certifi ed reserves as at 1 January 2006 of 146.1<br />
million barrels of oil equivalent (boe) representing a 12 percent increase<br />
on <strong>2005</strong> and a replacement ratio of 126 percent. Our <strong>2005</strong> production<br />
of 33,190 boepd represents a 15 percent increase over 2004 production<br />
but was still below forecast particularly due to United Kingdom related<br />
production facility issues.<br />
Signifi cant growth in production will continue in 2006 and into 2007 with<br />
fi rst production from the Oudna fi eld off shore Tunisia and the Alvheim<br />
fi eld off shore Norway which will take <strong>Lundin</strong> <strong>Petroleum</strong> production to<br />
over 50,000 boepd.<br />
Financial forecast<br />
Independent of acquisitions, additional developments and exploration<br />
success, increased production will lead to a continued growth in the<br />
fi nancial performance of <strong>Lundin</strong> <strong>Petroleum</strong> over this period. Assuming<br />
an average Brent oil price of USD 55 per barrel for 2006, we forecast a net<br />
profi t after taxes of MSEK 1,320 (MUSD 170) for 2006.<br />
Exploration and development<br />
The strong world oil prices over the past couple of years have resulted in<br />
marked changes in the valuation of oil and gas assets. For example the<br />
industry and fi nancial markets are now attributing signifi cant value to<br />
exploration assets and contingent resources (discovered oil and gas that<br />
has yet to be commercialised). <strong>Lundin</strong> <strong>Petroleum</strong> believes that strong<br />
world oil prices will remain and accordingly is aggressively investing in its<br />
existing asset base to generate future growth. In 2006 we will implement<br />
our active investment programme with a capital budget of over USD 300<br />
million which will be fully funded from internally generated cash fl ow.<br />
Over USD 100 million of this budget, which is almost double compared<br />
to the <strong>2005</strong> expenditure, will be spent on exploration with a drilling<br />
programme in Norway, Sudan, Indonesia, France and Ireland. Despite<br />
the <strong>2005</strong> exploration disappointments we continue to strongly believe<br />
that shareholder value can be generated through aggressive exploration<br />
where success can have a material impact on the value of <strong>Lundin</strong><br />
<strong>Petroleum</strong>.<br />
> 2
<strong>2005</strong> 2004 2003<br />
Production Mboepd 33.2 28.9 16.1<br />
Oil price achieved USD per barrel 52.93 37.67 27.35<br />
Operating cash fl ow MSEK 2,627 1,503 635<br />
MUSD 352 205 79<br />
Earnings before interest, tax and depreciation (EBITDA) MSEK 2,783 1,282 543<br />
MUSD 373 175 67<br />
Net profi t (excluding result on sale of assets) MSEK 970 507 218<br />
MUSD 131 69 27<br />
Shareholders’ equity MSEK 3,680 2,367 1,857<br />
MUSD 462 357 257<br />
Average exchange rate used USD/SEK 7.46 7.34 8.08<br />
Closing exchange rate used USD/SEK 7.96 6.62 7.22<br />
We also continue to seek new acquisition opportunities. Our balance sheet is very strong with net debt of less than USD 50 million which<br />
means that we have signifi cant fi nancial liquidity for investment opportunities. Nevertheless, competition is tough with lots of liquidity<br />
in the industry chasing very few deals. We have chosen to remain patient and not to push acquisition prices to levels which we believe<br />
are unsustainable from a technical perspective. Timing is diffi cult to predict but <strong>Lundin</strong> <strong>Petroleum</strong> has both the fi nancial and technical<br />
capacity to complete acquisitions which will enable us to act very quickly if the right opportunity materialises.<br />
In the meantime we continue to grow organically. We have been successful in <strong>2005</strong>, acquiring new exploration acreage in the United<br />
Kingdom, Norway and Ireland and are proactively investing in new seismic acquisition programmes to generate investment opportunities<br />
on new and existing acreage.<br />
Oil industry and people<br />
There has, in my opinion, been a signifi cant under investment in the oil industry for a number of years. The demand for oil continues as<br />
the world economy grows, particularly in the developing world. However this under investment has created material bottlenecks in our<br />
supply chain. Availability of drilling rigs is now at a premium and is likely to remain that way for a few years to come. Similarly the cost of<br />
materials and services has increased, placing pressure on the industry. However the biggest problem facing our industry is the availability<br />
of good technical staff . There has not been suffi cient investment in training and recruitment of personnel over the past few years and the<br />
industry is now paying the price.<br />
I believe that the current state of the industry is an advantage to a growing independent oil company such as <strong>Lundin</strong> <strong>Petroleum</strong>. We have<br />
the fl exibility to provide success oriented remuneration and can provide an environment with short and quick decision making processes.<br />
We have been able to attract an excellent team of individuals and continue to grow our personnel base. We live in a world of scarce oil<br />
reserves and an ever increasing demand which will result in continued high oil prices. The company is still of a size where a project that is<br />
too small to have a material impact on the majors would have a material impact on <strong>Lundin</strong> <strong>Petroleum</strong>. With our strong technical team we<br />
can therefore generate projects which will ensure the continued growth profi le of <strong>Lundin</strong> <strong>Petroleum</strong>.<br />
We continue to put emphasis on safety, environmental and social responsibility within our operations whilst continuing to create<br />
shareholder value. <strong>Lundin</strong> <strong>Petroleum</strong> has been a great success story over the last four years. We retain an important entrepreneurial spirit<br />
within the company and yet are managing the demands associated with the current size of our business. The oil industry remains an<br />
exciting place to work and <strong>Lundin</strong> <strong>Petroleum</strong> provides a dynamic environment in which to take advantage of the numerous opportunities.<br />
I remain positive and look forward to 2006 and the future with optimism.<br />
Best regards<br />
C. Ashley Heppenstall<br />
President and Chief Executive Offi cer<br />
> 3
WORDS FROM THE CHAIRMAN<br />
IAN H. LUNDIN<br />
Chairman<br />
We continue to do what we do best,<br />
explore, develop, produce and acquire<br />
oil and gas reserves wherever they<br />
may be.<br />
Dear Fellow Shareholders,<br />
<strong>2005</strong> was a year of consolidation where we reaped the rewards of the<br />
acquisition of the United Kingdom and Norwegian assets from DNO. The<br />
Broom fi eld was the shining star of the portfolio of acquired producing<br />
assets. The fi eld which came onstream in August 2004 continued to<br />
produce above expectations and acted as the main driver in achieving<br />
an overall production growth of 15 percent in <strong>2005</strong>. We had some<br />
setbacks in <strong>2005</strong> with wells failing to deliver on their exploration<br />
promise, particularly in Nigeria. These failures are another demonstration<br />
of the diffi culty the industry is facing in replacing reserves. However,<br />
despite the lack of exploration successes, <strong>Lundin</strong> <strong>Petroleum</strong> managed to<br />
increase its reserve base by 12 percent in <strong>2005</strong>. This is a result of both<br />
good reservoir management and the conservative approach we take<br />
to reserves evaluation. Future production growth will be driven by two<br />
ongoing developments: the Alvheim project in Norway and the Oudna<br />
fi eld in Tunisia. When these fi elds come onstream in late 2006 and early<br />
2007, overall production should exceed 50,000 boepd or about 50<br />
percent more than the average <strong>2005</strong> production of 33,000 boepd. In<br />
parallel, a number of exploration wells will be drilled in Norway, Sudan,<br />
Indonesia, France and Ireland which have the potential to increase our<br />
reserves base several times over. Of all our exploration plays, Block 5B in<br />
Sudan has the biggest potential. Drilling is expected to commence in the<br />
4th quarter of 2006 on Block 5B, and a discovery would ensure continued<br />
growth in production for years to come.<br />
The oil industry’s hunger for new reserves has resulted in a buying<br />
frenzy of both companies and producing fi elds. It is clear that as long as<br />
these conditions prevail it will be diffi cult to grow through acquisitions.<br />
Therefore concentrating on internally generated growth and maintaining<br />
a high level of exploration activity are the main priorities for the<br />
Company.<br />
<strong>Lundin</strong> <strong>Petroleum</strong> is going from strength to strength as we continue to<br />
generate our own opportunities. This, of course, can only be achieved<br />
with a motivated and hard working management and staff . On behalf of<br />
the Board, I would like to thank all the employees for their eff orts and<br />
their dedication which have allowed the Company to reach its current<br />
position as a leading European independent oil and gas company.<br />
I expect that the demand for oil and gas will continue to grow at a steady<br />
rate of 2–3 percent per year. In parallel, spare production capacity will<br />
continue to shrink resulting in a very tight market which will remain<br />
extremely sensitive to political events.<br />
In my opinion, we can expect spikes in the oil price up to USD 100 per<br />
barrel during the next twelve months.<br />
For <strong>Lundin</strong> <strong>Petroleum</strong>, this only means that we have to continue to do<br />
what we do best, explore, develop, produce and acquire oil and gas<br />
reserves wherever they may be.<br />
Sincerely,<br />
Ian H. <strong>Lundin</strong><br />
Chairman of the Board<br />
> 4
VISION, STRATEGY , FINANCIAL OBJECTIVES<br />
Vision<br />
As an international oil and gas exploration and production company, <strong>Lundin</strong><br />
<strong>Petroleum</strong>’s aim is to explore for and produce oil and gas in the most economically<br />
effi cient, socially responsible and environmentally acceptable way, for the benefi t<br />
of shareholders, employees, and co-venturers.<br />
<strong>Lundin</strong> <strong>Petroleum</strong> applies the same standards to all of its activities worldwide to<br />
satisfy both the commercial and ethical requirements. <strong>Lundin</strong> <strong>Petroleum</strong> strives to<br />
continuously improve its performance and to act in accordance with good oilfi eld<br />
practice and high standards of corporate citizenship.<br />
Strategy<br />
<strong>Lundin</strong> <strong>Petroleum</strong> is pursuing the following strategy:<br />
■ Proactively investing in exploration to organically grow its reserve base. <strong>Lundin</strong><br />
<strong>Petroleum</strong> has an inventory of drillable prospects with large upside potential<br />
and continues to actively pursue new exploration acreage around the world<br />
particularly in areas which have not been fully explored.<br />
■ To exploit its existing asset base with a proactive subsurface strategy to enhance<br />
ultimate hydrocarbon recovery. <strong>Lundin</strong> <strong>Petroleum</strong> is investing actively in mature<br />
assets through infi ll drilling, workovers and enhanced recovery techniques to<br />
maximize profi tability.<br />
■ To acquire new hydrocarbon reserves, resources and exploration acreage where<br />
opportunities exist to enhance value.<br />
Financial objectives<br />
The primary objective of <strong>Lundin</strong> <strong>Petroleum</strong> is to add value for the shareholders,<br />
employees and co-venturers through profi table operations and growth. The<br />
added-value of <strong>Lundin</strong> <strong>Petroleum</strong> will fl ow from a mixture of improved cash fl ow<br />
and profi tability from the producing assets and through exploration and technical<br />
success leading to an increase in reserves. Cash fl ow and profi tability from the<br />
producing assets can be improved through good technical management of the<br />
assets leading to improved production levels and lower production costs. <strong>Lundin</strong><br />
<strong>Petroleum</strong> aims to increase hydrocarbon reserves through exploration and through<br />
acquisitions. <strong>Lundin</strong> <strong>Petroleum</strong> will fund acquisitions through a mixture of internally<br />
generated funds, third party debt and if necessary, through new equity.<br />
The shareholders’ equity of <strong>Lundin</strong> <strong>Petroleum</strong> does not refl ect the underlying value<br />
of its assets as the recorded value relates to part exploration and development<br />
expenditures and part acquisition costs capitalised in accordance with generally<br />
accepted accounting principles (IFRS). The underlying value of <strong>Lundin</strong> <strong>Petroleum</strong>’s<br />
assets is the calculation of discounted cash fl ows based on future production from<br />
its reserves, which cash fl ow is then invested proactively to grow the reserves and<br />
production base.<br />
<strong>Lundin</strong> <strong>Petroleum</strong>’s dividend policy is to give funding priority to ongoing exploration<br />
and development projects and to satisfy the immediate capital requirements of the<br />
Company prior to considering distribution to shareholders. The Company continues<br />
to generate investment opportunities which are utilising such capital resources.<br />
> 5
UNDERSTANDING RESERVES AND RESOURCES<br />
Resource Classifi cation System<br />
Proved<br />
PRODUCTION<br />
RESERVES<br />
Proved &<br />
Probable<br />
CONTINGENT<br />
RESOURCES<br />
PROSPECTIVE<br />
RESOURCES<br />
Proved, Prob.<br />
& Possible<br />
Commercial<br />
Discovered but not<br />
currently commercial<br />
Exploration prospectivity<br />
> 6 <<br />
Reserves<br />
<strong>Lundin</strong> <strong>Petroleum</strong>, like most companies in Europe, calculates<br />
reserves and resources according to the SPE/WPC defi nition<br />
of petroleum resources. This defi nition was fi rst published<br />
in 1997 by the SPE (Society of <strong>Petroleum</strong> Engineers) and<br />
WPC (World <strong>Petroleum</strong> Congress) in an eff ort to standardise<br />
reserves reporting.<br />
Reserves are defi ned as those quantities of petroleum which<br />
are anticipated to be commercially recovered from known<br />
accumulations from a given date forward. Estimation of<br />
reserves is inherently uncertain and to express an uncertainty<br />
range, reserves are subdivided in Proved, Probable and<br />
Possible categories. <strong>Lundin</strong> <strong>Petroleum</strong> reports its reserves as<br />
Proved plus Probable reserves, also abbreviated as 2P.<br />
<strong>Lundin</strong> <strong>Petroleum</strong>’s reserves are calculated using forward<br />
projections of production levels, work programmes and<br />
the associated capital investment, and operating cost<br />
levels. From these projections the last year of economic<br />
production is calculated, given an assumed oil price scenario.<br />
The aggregate production until this economic cut off point<br />
constitutes the reserves. This year <strong>Lundin</strong> <strong>Petroleum</strong> has<br />
used a long term oil price scenario of USD 35 per barrel for<br />
this calculation.<br />
Each year <strong>Lundin</strong> <strong>Petroleum</strong>’s reserves base is certifi ed by<br />
an independent reserves certifi er. Over the last couple of<br />
years Gaff ney, Cline and Associates (GCA) has performed<br />
this service. GCA is one of the largest independent reserves<br />
certifi ers in the world and this year GCA certifi ed 146.1<br />
MMboe (million barrels of oil equivalent) of 2P oil and gas<br />
reserves net to <strong>Lundin</strong> <strong>Petroleum</strong>. This is an increase of<br />
12 percent compared to last year’s reserves and <strong>Lundin</strong><br />
<strong>Petroleum</strong> replaced last year’s production by 126 percent.<br />
Contingent resources<br />
In addition to its certifi ed reserves, <strong>Lundin</strong> <strong>Petroleum</strong> has a<br />
number of discovered oil and gas resources which currently<br />
do not classify as reserves. According to the SPE/WPC these<br />
classify as contingent resources. Contingent resources are<br />
those quantities of petroleum which are estimated, on<br />
a given date, to be potentially recoverable from known<br />
accumulations, but which are not currently considered to be<br />
commercially recoverable.<br />
<strong>Lundin</strong> <strong>Petroleum</strong> has an estimated 131 MMboe of contingent<br />
resources. These resources are not reserves, because further<br />
work is required to mature them. Additional work can be<br />
the drilling of a ‘productivity prover’ in the Heather Triassic,
the shooting of additional seismic in South-West Heather, the<br />
successful application of under balanced drilling techniques<br />
in Villeperdue or additional appraisal drilling in PL006c in<br />
Norway.<br />
<strong>Lundin</strong> <strong>Petroleum</strong> estimates its contingent resources in exactly<br />
the same manner as its reserves. In addition, an associated work<br />
programme is required to mature these into reserves. There is a<br />
chance that identifi ed resources will not mature into reserves.<br />
It is important to realise that <strong>Lundin</strong> <strong>Petroleum</strong> contingent<br />
resources are not the same as <strong>Lundin</strong> <strong>Petroleum</strong>’s exploration<br />
resources. Under the SPE/WPC defi nitions exploration resources<br />
are classifi ed as prospective resources. Prospective resources<br />
are those quantities of petroleum which are estimated, on a<br />
given date, to be potentially recoverable from undiscovered<br />
accumulations.<br />
Prospective resources<br />
<strong>Lundin</strong> <strong>Petroleum</strong> has a large portfolio of exploration blocks.<br />
These exploration blocks are evaluated using techniques like<br />
gravity and magnetic surveys, geochemical surveys, seismic<br />
surveys and basin analysis. This analysis results in a long list<br />
of leads and drillable prospects. Leads are identifi ed potential<br />
hydrocarbon accumulations that will require additional study<br />
before they are matured into prospects and appear in drilling<br />
plans. Prospects are ready to drill. It is important to realise that<br />
prospects and leads carry exploration risks, which result in a<br />
chance of not fi nding commercial hydrocarbons. These risks<br />
are identifi ed by <strong>Lundin</strong> <strong>Petroleum</strong> and help management in<br />
ranking exploration activities.<br />
In 2006 <strong>Lundin</strong> <strong>Petroleum</strong> is planning to drill (operated and<br />
non-operated) 15 exploration wells targeting in total 750<br />
MMboe of unrisked prospective resources net to the Company.<br />
By assuming that about 50 percent of the identifi ed leads in<br />
<strong>Lundin</strong> <strong>Petroleum</strong>’s portfolio do not mature to drillable prospect<br />
status, <strong>Lundin</strong> <strong>Petroleum</strong> estimates a further 1,130 MMboe of<br />
net unrisked prospective resources, which could be targeted<br />
by exploration work programmes in 2007 and beyond.<br />
Organic growth<br />
As an integrated exploration and production company,<br />
<strong>Lundin</strong> <strong>Petroleum</strong> is continuously aiming to grow the<br />
business by identifying exploration targets and maturing<br />
exploration targets into drillable prospects, and thus increase<br />
its prospective resource base. By drilling exploration wells and<br />
discoveries, prospective resources are moved into contingent<br />
resources and after formulating a development strategy and<br />
demonstrating commerciality, contingent resources are moved<br />
into 2P reserves.<br />
> 7 <<br />
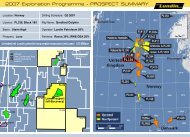
<strong>Lundin</strong> <strong>Petroleum</strong> Proven and Probable Reserves<br />
United Kingdom<br />
Norway<br />
2007<br />
Norway<br />
Venezuela<br />
Tunisia<br />
France<br />
France Paris Basin<br />
United Kingdom<br />
Indonesia<br />
Netherlands<br />
Proven and Probable Reserves 146.1 MMboe<br />
at 1 January 2006<br />
2006<br />
Contingent Resource Estimate<br />
Other<br />
Contingent Resources Internal Estimate 131 MMboe<br />
net <strong>Lundin</strong> <strong>Petroleum</strong><br />
Prospective Resource Estimate<br />
2008 Undefined Timing<br />
Prospective Resources Internal Estimate 1,130 MMboe<br />
net <strong>Lundin</strong> <strong>Petroleum</strong>
MARKET DESCRIPTION<br />
World Oil Production 2004<br />
North America<br />
18%<br />
Russia/Caspian<br />
14%<br />
Asia Pacific<br />
10%<br />
Russia/Caspian<br />
28%<br />
Africa<br />
5%<br />
Africa<br />
11%<br />
South & Central<br />
America 8%<br />
Middle East<br />
31%<br />
Europe<br />
8%<br />
Total Production 80.3 million bopd<br />
World Gas Production 2004<br />
North America<br />
28%<br />
South & Central<br />
America 5%<br />
Europe<br />
12%<br />
Middle East<br />
10%<br />
Asia Pacific<br />
12%<br />
Total Production 2,691.6 billion m 3<br />
World Oil Reserves End 2004<br />
112 101<br />
Africa<br />
South & Central America<br />
Source: BP Statistical Review of World Energy <strong>2005</strong><br />
17<br />
734<br />
41<br />
61<br />
123<br />
Europe<br />
Middle East<br />
Asia Pacific<br />
North America<br />
Russia/Caspian<br />
> 8 <<br />
GLOBAL RESERVES<br />
Crude oil<br />
Crude oil is found on all continents of the world. The Middle<br />
East is by far the region where the largest proven oil reserves<br />
are found, followed by Russia/Caspian and Africa. In total,<br />
global proven oil reserves amounted to 1,189 billion bbls at<br />
the end of 2004, of which 62 percent was attributable to the<br />
Middle East.<br />
Natural gas<br />
As well as oil, natural gas exists on all continents. However, the<br />
reserves of natural gas are distributed diff erently compared<br />
to the oil reserves. At the end of 2004 there was 179.5 trillion<br />
m3 of proven natural gas reserves, of which the Middle East<br />
had 40 percent and Russia/Caspian 32 percent.<br />
The growing gap<br />
The world has up until now been supplied by oil discovered<br />
particularly from 1950 through to the 1970. Despite<br />
signifi cant improvements in technology the industry has<br />
not discovered enough new reserves to replace the oil being<br />
consumed since the mid 1980s (see World Oil Demand<br />
graph). The International Energy Agency (IEA) estimates that<br />
global oil production will increase by less than one percent<br />
up to 2030.<br />
Competition - Partners<br />
The players in the oil and gas market consist of national oil<br />
companies (eg. Aramco, CNPC, Petronas, Statoil), the big<br />
integrated oil companies, the majors (eg. Exxon, Shell, BP)<br />
and independent oil companies such as Talisman Energy,<br />
Tullow Oil and <strong>Lundin</strong> <strong>Petroleum</strong>.<br />
The main strategy of the national oil companies is to secure<br />
the energy supply for their respective countries. They often<br />
have downstream operations i.e. refi neries and distribution<br />
network/petrol stations.<br />
14.1<br />
World Gas Reserves End 2004<br />
7.1 5.8<br />
72.8<br />
14.2<br />
7.3<br />
58.2<br />
Africa<br />
South & Central America<br />
Europe<br />
Middle East<br />
Asia Pacific<br />
North America<br />
Russia/Caspian<br />
Total Oil Reserves 1,189 billion bbls Total Gas Reserves 179.5 trillion m 3
The majors are public companies with both upstream and<br />
downstream operations while the independents are mainly focused<br />
on the upstream business. Their advantage is that they are smaller<br />
and more fl exible and move quicker into new areas. Companies<br />
may be competitors when acquiring new acreage but can become<br />
partners in a later phase of the development.<br />
Sales of crude oil and natural gas<br />
Crude oil is transported globally between producers and consumers<br />
primarily by oil tankers, implying that the prices for diff erent<br />
qualities of crude oil are relatively homogenous on the world<br />
market. Natural gas is primarily transported through pipelines,<br />
making the pricing dependent on the fi eld’s geographical location<br />
in relation to the potential consumer. To a lesser extent natural gas<br />
is also transported by tankers in the form of liquefi ed natural gas.<br />
Global consumption of crude oil and natural gas<br />
The primary driving force behind the demand for oil is economic<br />
growth. To a great extent the world’s energy needs are met by fossil<br />
fuels, of which oil is the dominant fuel. In developing countries,<br />
demand for energy is much in line with economic growth, whereas<br />
in industrialised countries the growth in demand is more volatile<br />
in comparison with economic growth. The consumption per capita<br />
varies greatly between diff erent regions. North America has by far<br />
the greatest consumption per capita, followed by Europe. The world<br />
today consumes over 80 million barrels of oil per day representing<br />
30 billion barrels of oil per year.<br />
Natural gas is consumed primarily in geographical proximity of the<br />
production, resulting in North America, former Soviet Union and<br />
hence Europe being the largest consumers of natural gas.<br />
Oil price development<br />
Oil prices have historically fl uctuated widely. Aside from supply and<br />
demand, factors aff ecting the oil prices include global and regional<br />
economic and political developments in resource-producing<br />
regions as well as the extent to which the Organisation of <strong>Petroleum</strong><br />
Exporting Countries (“OPEC”) and other producing nations<br />
infl uence global production levels. In addition, prices of alternative<br />
fuels, global economic conditions and weather conditions aff ect<br />
the oil prices.<br />
World Oil Demand<br />
140<br />
120<br />
100<br />
80<br />
60<br />
40<br />
20<br />
0<br />
1960<br />
Million Barrels Per Day<br />
1970<br />
Oil Demand<br />
1980<br />
1990<br />
2000<br />
2010<br />
Existing<br />
Production<br />
New<br />
Production<br />
2020<br />
> 9 <<br />
2030<br />
104 million b/d
OPERATIONS REVIEW<br />
<strong>2005</strong> was another very challenging and<br />
busy year for <strong>Lundin</strong> <strong>Petroleum</strong>. In terms<br />
of development projects, the successful<br />
completion of Broom Phase 2 in the United<br />
Kingdom was achieved. Further development<br />
projects in Tunisia and Norway were started<br />
and are on schedule with target dates for<br />
fi rst oil in the fourth quarter 2006 and fi rst<br />
quarter 2007 respectively. These two projects<br />
will enable <strong>Lundin</strong> <strong>Petroleum</strong> to increase<br />
production to over 50,000 boepd by early<br />
2007. Meanwhile, despite no new acquisition<br />
or signifi cant discoveries, <strong>Lundin</strong> <strong>Petroleum</strong><br />
succeeded in replacing its reserves by 126<br />
percent in <strong>2005</strong>.<br />
We continued to invest proactively in<br />
exploration during <strong>2005</strong> but the results<br />
were disappointing, particularly the drilling<br />
results in Nigeria. We will however continue our exploration investment strategy and in<br />
<strong>2005</strong> acquired two new licences off shore Norway and three new licences off shore United<br />
Kingdom. Exploration requires a long term investment perspective and in 2006 our<br />
exploration work programme will increase signifi cantly with participation in 15 new wells<br />
worldwide and seismic acquisition programmes in the United Kingdom and Sudan. We<br />
also continue to invest in exploration personnel with the expansion of our Exploration New<br />
Ventures team in Geneva which is focused upon increasing our asset base in prospective<br />
new areas with the potential for increasing our reserve base.<br />
The production from our operating assets increased by 15 percent from 2004. Nevertheless<br />
production was below forecast in <strong>2005</strong> particularly due to the performance from our assets<br />
in the United Kingdom. From a subsurface perspective the United Kingdom performed<br />
well and I am confi dent that the reserves will be ultimately recovered. The problems were<br />
related to facilities issues where we underestimated the throughput and reliability of<br />
our equipment. We are constantly challenged with facilities issues associated with old<br />
infrastructure particularly in an environment where personnel and equipment are in high<br />
demand. These issues will remain challenging but I believe that with proactive management<br />
and support from our operating services contractor Petrofac we can realise the subsurface<br />
potential of our assets.<br />
I feel privileged to work with such a dynamic, experienced and entrepreneurial group of<br />
people. With this team I am confi dent that we can continue to grow the Company through<br />
solid technical and operational management.<br />
ALEXANDRE SCHNEITER<br />
Executive Vice President & COO<br />
COUNTRY NU<strong>MB</strong>ER OF LICENCES WORKING INTEREST<br />
Albania 1 licence 50%<br />
France 16 licences 33.3 - 100%<br />
Indonesia 6 licences 14.5 - 100%<br />
Ireland 2 licences 12.5 - 30%<br />
Netherlands 20 licences 1.2 - 10%<br />
Nigeria 1 licence 22.5%<br />
Norway 16 licences 7 - 100%<br />
Sudan 1 licence 24.5%<br />
Tunisia 4 licences 40 - 50%<br />
United Kingdom 9 licences 37.5 - 100%<br />
Venezuela 1 licence 12.5%<br />
> 10 <<br />
Venezuela
Ireland<br />
UK<br />
France<br />
Nigeria<br />
Norway<br />
Ireland - Donegal Basin<br />
-1 exploration well to be drilled in this<br />
frontier area in 2006<br />
Netherlands<br />
Albania<br />
Tunisia<br />
Sudan<br />
Norway Alvheim project 2006-2007<br />
-Approximately USD 1.3 billion oil & gas development<br />
-First oil 2007<br />
-3 exploration wells in 2006 in other NCS licences<br />
United Kingdom<br />
-Broom Phase 2 successfully completed<br />
-Further production enhancing activities in 2006<br />
-Extensive 3D seismic acquisition over Heather<br />
Tunisia - Oudna project<br />
-Production through owned FPSO<br />
-First oil scheduled for late 2006<br />
Sudan - Block 5B<br />
-Operations to resume on the block<br />
in 2006 with 2D seismic acquisition<br />
-3 exploration wells planned for 2006<br />
Indonesia<br />
-TBA development fi rst oil in 2006<br />
-7 exploration wells in 2006<br />
> 11 <<br />
Indonesia
OPERATIONS REVIEW<br />
Solan/<br />
Strathmore<br />
Orkney<br />
SCOTLAND<br />
Heather platform<br />
Shetland<br />
Thistle/<br />
Deveron<br />
211/28b<br />
Heather/<br />
Broom 3/1b<br />
9/10c<br />
9/14c&15c<br />
North Sea<br />
UNITED KINGDOM<br />
<strong>Lundin</strong> <strong>Petroleum</strong> has working interests in four production and fi ve exploration<br />
licences in the northern sector of the United Kingdom Continental Shelf<br />
(UKCS). The major operated assets include three mature producing fi elds,<br />
Thistle and Heather, and the Broom fi eld which was brought on stream by<br />
<strong>Lundin</strong> <strong>Petroleum</strong> in 2004 with production in excess of 25,000 bopd (gross).<br />
To optimise the production on Heather and Thistle a variety of techniques have<br />
been used including workovers, artifi cial lift, water injection, development<br />
drilling programmes and maintenance of the topsides facilities.<br />
The discovery and development of new accumulations near existing fi elds is<br />
an important stage in the life of a mature hydrocarbon province such as the<br />
UKCS.<br />
The Broom fi eld, which comprises two accumulations, West Heather and North<br />
Terrace, is an example of what impact new discoveries in the vicinity of old<br />
fi elds can have. The Broom Phase 2 was successfully completed during <strong>2005</strong><br />
increasing the production from the Heather complex. The Broom fi eld will<br />
extend the life of the Heather fi eld and provide substantial production and<br />
reserves of its own via a sub-sea tie back to the Heather platform.<br />
Reserves 54.1 MMboe<br />
<strong>2005</strong> average net production: 20,170 boepd<br />
<strong>2005</strong> highlights<br />
■ Completion of Broom Phase 2 with a sidetrack of the original discovery<br />
well to a new up-dip location on West Heather and the fi rst production<br />
well on North Terrace. Production from the West Heather well commenced<br />
in August <strong>2005</strong> and from the North Terrace well in October <strong>2005</strong>.<br />
■ Outsourced platform operations for both the Heather and Thistle<br />
installations with eff ect from 1 May <strong>2005</strong>.<br />
■ Thistle shutdown to ensure facilities are fi t for purpose for ongoing<br />
operations.<br />
■ Completed third Thistle water injection well workover.<br />
■ Awarded 3 exploration blocks in the 23rd licencing round.<br />
2006 work programme<br />
■ Complete reactivation of Heather drilling rig and carry out 2 well workovers<br />
and drill the fi rst development well of the underlying Triassic reservoir.<br />
■ Acquire 3D seismic over the greater Heather area.<br />
■ Increase produced water handling capacity on both Heather and Thistle<br />
fi elds.<br />
> 12
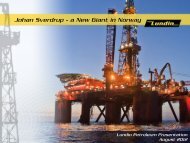
Alvheim FPSO modifi cations at the Keppel shipyard, Singapore<br />
NORWAY<br />
The Norwegian Continental Shelf (NCS) is one of the principal growth areas for <strong>Lundin</strong> <strong>Petroleum</strong> with increased activities planned for<br />
2006.<br />
The existing licences comprise the full spectrum from exploration to mature assets. Recently awarded licences in <strong>2005</strong> consist of exploration<br />
acreage locally associated with existing discoveries. Other licences contain as yet unexploited but proven marginal accumulations of oil<br />
and gas. The PL203 licence contains the Alvheim fi eld complex, which is currently under development with fi rst oil planned for early<br />
2007. Alvheim is an approximate USD 1.3 billion development which will result in oil and gas being produced from a series of good<br />
quality sandstone reservoirs via a fl oating, production, storage and offl oading vessel (FPSO). Gross initial Alvheim production is forecast<br />
to be approximately 85,000 boepd. It is anticipated that Alvheim will become the hub for additional satellite developments in this area.<br />
The nearby Volund discovery (previously named Hamsun) is likely to be tied back to Alvheim, and a development plan will be submitted<br />
to the Norwegian government during 2006.<br />
Alvheim<br />
PL036c<br />
PL203<br />
PL088bs<br />
Volund<br />
PL340<br />
PL338<br />
PL359<br />
PL292<br />
PL335<br />
North Sea<br />
PL363<br />
Jotun & PL103<br />
PL304<br />
PL167 & 167b<br />
PL148<br />
PL006c<br />
NORWAY<br />
0 KM 100<br />
Production from Norway is currently generated from the Jotun fi eld.<br />
Reserves 41.0 MMboe<br />
<strong>2005</strong> average net production: 990 boepd<br />
<strong>2005</strong> highlights<br />
■ The Alvheim FPSO has been modifi ed at the Keppel Shipyard in Singapore and will be<br />
completed with topside modifi cations in Norway.<br />
■ 2 new licences awarded in the APA <strong>2005</strong> licencing round, PL359 and PL363 as<br />
operator.<br />
■ Acquired 60% interest in PL304 from Esso.<br />
■ Completed the sale and leaseback of the Jotun FPSO.<br />
2006 work programme<br />
■ 3 infi ll wells to be drilled 2006/2007 on the Jotun licence.<br />
■ 4 oil producers and 2 water disposal wells are planned to be drilled on the Alvheim<br />
fi eld in 2006. Drilling of development wells will continue into 2007 and 2008.<br />
■ Complete the topside installation and modifi cation on the Alvheim vessel and<br />
commence the hook-up and commissioning.<br />
■ 1 exploration/appraisal well to be drilled on the East Kameleon structure in the<br />
Alvheim fi eld area.<br />
■ 2 exploration wells to be drilled on PL338 and PL335.<br />
■ Submit a Plan for Development and Operation approval for the Volund fi eld (previously<br />
named Hamsun) from the Ministry of <strong>Petroleum</strong> and Energy (MPE).<br />
> 13
OPERATIONS REVIEW<br />
Workover rig, Paris Basin<br />
Zuidwal platform, Netherlands<br />
NETHERLANDS<br />
FRANCE<br />
France is one of the operated producing areas of <strong>Lundin</strong> <strong>Petroleum</strong>. In the Paris<br />
Basin and Aquitaine Basin, production is optimised by using a variety of workover<br />
techniques, water injection and development drilling programmes. Facilities and<br />
infrastructure are in place with excess capacity to enable future development.<br />
Further exploration opportunities and exploitation of contingent resources<br />
are being pursued to provide <strong>Lundin</strong> <strong>Petroleum</strong> with stable production and<br />
cashfl ow.<br />
Through selective drilling programmes, investments in new projects and<br />
continued operational improvements, the French assets will continue to provide<br />
<strong>Lundin</strong> <strong>Petroleum</strong> with long term production.<br />
Reserves: 20.1 MMboe<br />
<strong>2005</strong> average net production: 4,200 boepd<br />
<strong>2005</strong> highlights<br />
■ 1 exploration well drilled in the Nemours licence, La Tonelle-1. The well is under<br />
a long term production test.<br />
■ 2 producers in Vert La Gravelle and Courdemanges converted into injectors.<br />
■ Successfully fractured a Soudron Rhaetian producer using cold water, resulting<br />
in an 8-fold productivity improvement.<br />
■ First oil from the Les Mimosas discovery via temporary production facilities.<br />
2006 work programme<br />
■ Continue cold water fracture campaign in the Paris Basin.<br />
■ Further develop the North-East part of Villeperdue by drilling 3 producers<br />
and 1 injector using under balanced drilling techniques.<br />
■ Continue to optimise water injection pattern in Soudron and Grandville by<br />
converting 2 existing wells into water injectors.<br />
■ Drill an exploration well in the Val des Marais permit.<br />
■ Develop Les Mimosas fi eld with permanent facilities.<br />
The Netherlands is a mature gas province providing <strong>Lundin</strong> <strong>Petroleum</strong> with stable, long term onshore and off shore production. The<br />
production is generated from non-operated interests. Although most of the producing fi elds are mature, additional infi ll drilling and<br />
development opportunities are actively pursued.<br />
The Dutch government continues to provide a market for all discovered gas through its small gas fi eld policy. As a result several<br />
development and exploration projects are ongoing to maintain and increase current production profi les.<br />
Reserves: 5.9 MMboe<br />
<strong>2005</strong> average net production: 2,340 boepd<br />
<strong>2005</strong> highlights<br />
■ 1 development well K5-EC5 well on stream.<br />
■ 1 development well K4-BE4 spudded.<br />
■ 1 exploration well F12/4 spudded.<br />
> 14 <<br />
2006 work programme<br />
■ Drill K4-BE4 well.<br />
■ K4-A5 well to be drilled off shore.<br />
■ Following successful tie-back L4/9 well, fi nalise L4G<br />
development, with tie-back to L4A platform. First gas in 2006.
Ikdam FPSO Oudna-3 wellhead in transit to the fi eld<br />
TUNISIA<br />
<strong>Lundin</strong> <strong>Petroleum</strong> is the operator of four concessions off shore<br />
Tunisia with production from the Isis fi eld and the ongoing<br />
development of the Oudna fi eld where production is due to<br />
commence in the last quarter of 2006 at an expected rate of<br />
20,000 boepd (gross).<br />
The Oudna fi eld was discovered in 1978 when Oudna-1 well<br />
tested 41° API at a rate of 7,000 bopd. The development plan<br />
was approved by the Tunisian government during <strong>2005</strong> and will<br />
consist of a single production and a single water injection well,<br />
tied back to the Ikdam FPSO.<br />
Production from the Isis fi eld continues to decline as projected<br />
and the fi eld will be suspended when the FPSO is moved for<br />
shipyard works in May 2006.<br />
Ikdam FPSO<br />
The Ikdam is an ‘Aframax’ tanker with a storage capacity of<br />
almost 600,000 barrels. The vessel complies with requirements<br />
for operating as a tanker, oil terminal and production facility. The<br />
vessel is owned by Ikdam Production S.A. and the shareholders<br />
are <strong>Lundin</strong> <strong>Petroleum</strong> (40%), PGS (40%) and Brovig (20%). The<br />
commercial arrangements are such that <strong>Lundin</strong> <strong>Petroleum</strong> and<br />
PGS each have a 50 percent commercial interest in the vessel.<br />
> 15 <<br />
Reserves: 4.7 MMboe<br />
<strong>2005</strong> average net production: 970 boepd<br />
<strong>2005</strong> highlights<br />
■ Secured approval for the Oudna development.<br />
■ Signed commercial agreement with state partner ETAP.<br />
■ Commenced detailed Oudna development planning in April.<br />
■ Secured approval from Ministry of Environment for the Isis fi eld<br />
decomissioning plan.<br />
2006 work programme<br />
■ Drill Oudna producer and injector wells in fi rst half 2006.<br />
■ Shut in production on Isis in mid April.<br />
■ Sail Ikdam FPSO to Malta shipyard for refurbishment, upgrade<br />
and re-classifi cation works.<br />
■ Commence decommissioning works on Isis and leave<br />
production wells 7, 8 and 9 ready for abandonment.<br />
■ Re-enter, plug and abandon Isis well 5.<br />
■ Redeploy Ikdam FPSO on Oudna to start production last quarter<br />
2006.
OPERATIONS REVIEW<br />
INDONESIA<br />
<strong>Lundin</strong> <strong>Petroleum</strong> has been operational in Indonesia since 2002<br />
and has a portfolio of production, development and exploration<br />
assets. Production is generated from non-operated assets in the<br />
Salawati Island and Salawati Basin licences.<br />
Development of the TBA fi eld off shore Salawati Island is ongoing<br />
with fi rst production expected mid 2006.<br />
First gas production from the Singa fi eld on the Lematang Block<br />
is expected in 2008. Gas will be exported through Sumatra to<br />
Java phase 1 pipeline. The Heads of Agreement for the sale of the<br />
gas was signed with PT Perusahaan Gas Negara (PGN) in January<br />
2006.<br />
There is further exploration potential and 2006 provides for<br />
an active exploration programme both for operated and non<br />
operated assets.<br />
Reserves: 15.9 MMboe<br />
<strong>2005</strong> average net production: 2,260 boepd<br />
<strong>2005</strong> highlights<br />
■ 14 development wells drilled in Salawati Island/Salawati Basin.<br />
■ 2 development wells drilled in the TBA fi eld.<br />
■ 10 exploration wells drilled in Salawati Island/Salawati Basin<br />
– 3 small discoveries.<br />
■ 1 operated exploration well commenced drilling, Jati-1. Drilling<br />
at year end.<br />
2006 work programme<br />
■ 8 development wells to be drilled in Salawati Basin.<br />
■ 2 development wells to be drilled in Salawati Island.<br />
■ Complete the development of the TBA fi eld off shore Salawati<br />
Island by installing a mobile production unit.<br />
■ 2 exploration wells to be drilled in Salawati Basin.<br />
■ 4 exploration wells to be drilled in Salawati Island.<br />
■ 1 exploration well to be completed, Jati-1 in the Banyumas PSC.<br />
■ 1 exploration well to be drilled, Tengis-1 in the Blora PSC.<br />
> 16 <<br />
VENEZUELA<br />
Venezuela is one of the world’s most prolifi c petroleum regions.<br />
<strong>Lundin</strong> <strong>Petroleum</strong> has a working interest of 12.5 percent in the<br />
Colón Block located in the western edge of the Maracaibo Basin,<br />
near Lake Maracaibo.<br />
Oil and gas is produced from eight individual fi elds in the Colón<br />
Block with the La Palma fi eld being the main producer. Current<br />
export capacity via the pipeline system is approximately 20,000<br />
boepd (gross), although with increasing water production the<br />
concession produces currently at around 13,000 to 14,000<br />
boepd. Ongoing development drilling on La Palma is necessary<br />
to maintain good production rates as the fi eld is characterised<br />
by rapid water breakthrough and oil production decline soon<br />
after drilling. Additional wells are planned for the La Palma fi eld.<br />
Following the decision of the Venezuelan government in <strong>2005</strong><br />
to restructure all operating service agreements in the country,<br />
the Colón Block consortium agreed to commence negotiations<br />
with Petróleos de Venezuela S.A (PDVSA) to create a “mixed<br />
enterprise”. Negotiations are ongoing with PDVSA regarding<br />
this conversion.<br />
Reserves: 4.4 MMboe<br />
<strong>2005</strong> average net production: 2,110 bopd<br />
<strong>2005</strong> highlights<br />
■ Drilling of 2 successful producers in La Palma fi eld Mirador<br />
reservoir (LPT-11 and 12).<br />
■ Drilling of LPT-14 in La Palma fi eld. This well found a full<br />
oil column in the main Mirador reservoir and tested oil from<br />
two deeper reservoirs, not previously drilled in La Palma fi eld<br />
– the well has been on long term test and is producing oil<br />
under natural fl ow.<br />
■ 2 other La Palma fi eld wells were drilled LPT-10 and<br />
13. However, LPT-10 was found to have been swept<br />
due to production from other wells and LPT-13 found the<br />
reservoir unexpectedly deep and was essentially nonproductive.<br />
2006 work programme<br />
■ Drill LPT-15 well in early 2006.<br />
■ Complete long term testing of deep reservoirs in LPT-14 and<br />
formulate plan for further development.<br />
■ Bring on stream the main Mirador reservoir in LPT-14.
Swamp buggy and air boats survey the area of operation<br />
CHAD<br />
LIBYA<br />
CENTRAL<br />
AFRICAN REPUBLIC<br />
CONGO<br />
EGYPT<br />
SUDAN<br />
BLOCK 5B<br />
Port Sudan<br />
Khartoum<br />
Oil fi eld Oil export pipeline<br />
Thar Jath<br />
Discovery<br />
Block 5A<br />
Lehr<br />
Adok<br />
Block 5B<br />
A Barada<br />
Prospect B<br />
Q Kasafa<br />
Oil fi eld Drillable prospect<br />
Play fairway<br />
ETHIOPIA<br />
KENYA<br />
Red Sea<br />
ERITREA<br />
C Umm Dandalo<br />
SUDAN<br />
In 2001 <strong>Lundin</strong> <strong>Petroleum</strong> was awarded a 24.5 percent working interest in Block 5B,<br />
operated by White Nile (5B) <strong>Petroleum</strong> Operating Company Ltd. (WNPOC), a joint<br />
operating company owned by Petronas Carigali White Nile (5B) Ltd. and Sudapet Co.<br />
Ltd..<br />
A comprehensive peace agreement was signed in Sudan in early <strong>2005</strong> between the<br />
government and the Sudan People’s Liberation Army (SPLA). A new government has<br />
been formed with representatives of the major political factions. In addition a National<br />
<strong>Petroleum</strong> Commission has been constituted with representatives of the government<br />
of National Unity, the government of Southern Sudan and representatives of the<br />
local areas where oil activity is taking place. The National <strong>Petroleum</strong> Commission will<br />
oversee petroleum activities in Sudan.<br />
Mobilisation of equipment for a 1,100 kilometre 2D seismic acquisition is currently<br />
under way. Exploration drilling will commence in 2006 with a three well initial drilling<br />
programme to test the large prospectivity of Block 5B.<br />
2006 work Programme<br />
■ 1,100 km 2D seismic acquisition.<br />
■ 3 well exploration drilling programme to commence.<br />
ALBANIA<br />
<strong>Lundin</strong> <strong>Petroleum</strong> signed a production sharing contract for the Durresi Block, off shore<br />
Albania. The Durresi exploration area (4,200 km 2 ) is located off shore Albania between<br />
Cape Rodoni to the north and the Karaburuni Peninsula to the south. Most of the<br />
block is located in shallow water 0 to 100 metres deep. The area has excellent logistics<br />
provided by the ports of Vlora and Durres.<br />
<strong>2005</strong> highlights<br />
■ Acquisition of 400 km 2 of 3D seismic.<br />
2006 work programme<br />
■ Processing and interpretation of 400 km 2 of 3D seismic.<br />
■ Reprocessing 200 km 2D seismic.<br />
■ Mapping, defi nition and reserve calculation of prospect to be drilled in 2007<br />
> 17
OPERATIONS REVIEW<br />
IRELAND<br />
In January <strong>2005</strong> <strong>Lundin</strong> <strong>Petroleum</strong> was granted Frontier Exploration Licence 1/05 in<br />
the Donegal Basin. <strong>Lundin</strong> <strong>Petroleum</strong> will operate the licence, which covers Block<br />
13/7 and part-Blocks 13/11 (NE) and 13/12 (N) off the north western coast of Ireland.<br />
<strong>Lundin</strong> <strong>Petroleum</strong> and partners have a single exploration well commitment on this<br />
licence, to be drilled within two years of the award. Following signifi cant activity in<br />
late <strong>2005</strong>, <strong>Lundin</strong> <strong>Petroleum</strong> has contracted a semi-submersible drilling rig, which<br />
will drill the Inishbeg exploration well in the summer of 2006.<br />
<strong>Lundin</strong> <strong>Petroleum</strong> also holds a 12.5 percent interest in the Seven Heads Oil licensing<br />
option, which lies below the Seven Heads producing gas fi eld. This option has been<br />
extended to end 2006, by which time the partnership has to decide whether or not<br />
to mature it to a full exploration licence or allow the licence to lapse.<br />
<strong>2005</strong> highlights <strong>2005</strong><br />
■ Completed sale of Seven Heads gas fi eld.<br />
■ Award of Frontier Exploration Licence 1/05 in the Donegal Basin.<br />
■ Agreement reached with partners regarding well design, drilling location<br />
and drilling rig selection for 2006 drilling.<br />
2006 work programme<br />
■ Drilling of an exploration well to test the Inishbeg gas prospect scheduled for<br />
summer 2006.<br />
NIGERIA<br />
In January <strong>2005</strong>, <strong>Lundin</strong> <strong>Petroleum</strong> signed an agreement to acquire a 22.5 percent<br />
net revenue interest in Block OML 113 located off shore West Nigeria. The Block is<br />
operated by the indigenous company Yinka Folawiyo <strong>Petroleum</strong> Company and<br />
<strong>Lundin</strong> <strong>Petroleum</strong> acts as a technical advisor on behalf of a consortium of several<br />
international oil and gas companies.<br />
Nigeria is a prolifi c province for oil and gas with an oil production in excess of 2<br />
million bopd. Block OML 113 is located in the Benin Basin, where oil is produced from<br />
the Seme fi eld.<br />
The Aje fi eld was discovered in 1996 by the Aje-1 well which encountered around<br />
300 feet of gas and a thin underlying oil rim within Turonian sandstones reservoir.<br />
Aje-2 located east of Aje-1 confi rmed the presence of gas and oil within the Turonian<br />
reservoir and discovered a new oil accumulation within a deeper Cenomanian<br />
sandstones reservoir. The Aje-3 appraisal well was drilled during <strong>2005</strong>. The presence<br />
of gas in the Turonian reservoir could not be tested due to poor reservoir properties.<br />
The Cenomanian sandstone reservoir was below the water contact.<br />
<strong>2005</strong> work programme<br />
■ Aje-3 appraisal well was drilled.<br />
2006 work programme<br />
■ Re-processing of 3D seismic data.<br />
■ New seismic interpretation of the whole block OML 113 together with a 3D<br />
geological and reservoir model.<br />
> 18
19 <<br />
EXPLORATION NEW VENTURES<br />
<strong>Lundin</strong> <strong>Petroleum</strong>’s strategy is to create value through proactive exploration. In<br />
today’s highly competitive acquisition environment the company is following an<br />
organic growth strategy to increase its exploration exposure. There have been<br />
signifi cant advances in exploration technology over recent years which are now<br />
widely available. The diff erentiating factor is people. We have invested and continue<br />
to invest heavily in a team of focused new venture explorationists who have the<br />
experience, network and high levels of motivation to generate new opportunities.<br />
Depending on the project, <strong>Lundin</strong> <strong>Petroleum</strong> may decide to adjust the working<br />
interest or secure partners to mitigate risk capital exposure, develop strategic<br />
alliances with other companies which provide a competitive advantage to the<br />
consortium, and contemplate creative acreage or asset swaps which leverage our<br />
expertise in one area to gain a new position in another region.<br />
<strong>Lundin</strong> <strong>Petroleum</strong> continues to take a long term view with regards to political risk.<br />
The Company is willing to work in developing countries which at times possess<br />
higher political risk. Oil reserves are becoming more diffi cult to fi nd and as such one<br />
has to go to more challenging locations to fi nd the oil and gas reserves of the future.<br />
We will remain dedicated to upholding the highest standard of social responsibility<br />
as outlined in our Code of Conduct and to endeavour to be the partner of choice for<br />
both industry and government.
OUR PEOPLE ARE OUR STRENGTH<br />
We have been able to attract an excellent<br />
team and continue to grow our personnel<br />
base. We live in a world of scarcer oil<br />
reserves and an ever increasing demand<br />
which will result in continued high oil<br />
prices. The company is still of a size<br />
where a project that is too small to have a<br />
material impact to the majors would have<br />
a material impact to <strong>Lundin</strong> <strong>Petroleum</strong>.<br />
With our strong technical team we can<br />
therefore generate projects which will<br />
ensure the continued growth profi le of<br />
<strong>Lundin</strong> <strong>Petroleum</strong>.<br />
> 20
A COMMITMENT FROM THE TOP<br />
When <strong>Lundin</strong> <strong>Petroleum</strong> was constituted in 2001, the Board of Directors believed it was important<br />
that the Company’s mission and tasks be clearly known to the staff , as well as the manner in which<br />
these were to be conducted. It thus adopted the <strong>Lundin</strong> <strong>Petroleum</strong> Code of Conduct .<br />
The Code establishes to whom <strong>Lundin</strong> <strong>Petroleum</strong> is responsible, i.e. shareholders, employees, host<br />
countries, local communities and society at large, as well as the business principles founded on the<br />
respect of law, fairness and equity, by which the Company is guided. The Code of Conduct is an<br />
integral part of the contract of employment of all Company staff and performance under the Code is<br />
reviewed by management and reported by the CEO to the Board on an annual basis.<br />
The purpose of the Code of Conduct is to give general guidance on how the Company is to perform<br />
its tasks; while the Company relies on the technical competence and effi ciency of its staff and<br />
contractors in carrying out operations, these must also understand potential eff ects and impacts of<br />
operations on the health and safety of the staff and aff ected communities, on the integrity of facilities<br />
and equipment, on the environment, and have measures in place to prevent or mitigate anticipated<br />
impacts.<br />
<strong>Lundin</strong> <strong>Petroleum</strong>’s Health (H) and Safety (S) Environmental (E) and Community Relations (CR) Policies<br />
were developed in order to emphasise the importance of integrating these elements in operational<br />
strategies and planning, while <strong>Lundin</strong> <strong>Petroleum</strong>’s Health, Safety and Environmental (HSE)<br />
Management System (the “Green Book”), modeled after ISO-14001, details how this integration must<br />
take place in practice, i.e. through leadership commitment, attribution of roles and responsibilities,<br />
setting of plans, objectives and targets as well as continuous monitoring and review of performance.<br />
<strong>2005</strong> ACCOMPLISHMENTS<br />
HSE performance is central to the sustainability of the Company operations. One way of tracking<br />
performance is through reporting. Monthly HSE reporting is a corporate requirement which enables<br />
the Company to monitor at all times the manner in which operations are conducted and, when<br />
required, introduce corrective measures.<br />
> 21 <<br />
CORPORATE RESPONSIBILITY<br />
As the Company<br />
continues to grow, so<br />
do the challenges to<br />
keep on operating in a<br />
manner that protects<br />
people, assets and the<br />
environment
CORPORATE RESPONSIBILITY<br />
In view of the variety of operations within the Group, the diff erent<br />
locations and structures under which they are operated, either by<br />
Company staff , by service contractors or joint-venture partners,<br />
<strong>Lundin</strong> <strong>Petroleum</strong> receives diverse HSE data both on a monthly and<br />
ad hoc basis. The Key Performance Indicators (KPIs) reported on<br />
monthly that <strong>Lundin</strong> <strong>Petroleum</strong> uses for the Group’s operated assets<br />
are Fatalities, Lost Time Incidents (LTIs) as well as Oil Spills and Gas<br />
Leaks.<br />
KPI fi gures in themselves do not give a full picture on how operations<br />
are run; therefore monthly reports also include information regarding<br />
HSE training, drills, committee meetings, accident/incident/near<br />
miss reports with root cause analyses, other problems encountered,<br />
remedial measures put in place and initiatives undertaken to improve<br />
HSE performance. As a result, <strong>Lundin</strong> <strong>Petroleum</strong> corporate is well<br />
aware, at any given time, of the status of such issues in all operations<br />
and the areas which require closer surveillance or improvements.<br />
KEY PERFORMANCE INDICATORS (KPIs) IN <strong>2005</strong><br />
<strong>Lundin</strong> <strong>Petroleum</strong>’s HSE framework has been developed in order to<br />
be able to realise its “zero goal” for all its operations:<br />
■ Zero fatalities<br />
There were no Fatalities among Company staff or contractors in<br />
<strong>2005</strong>.<br />
■ Zero injuries<br />
The total Lost Time Incident Frequency Rate (LTIFR, per 200,000<br />
man hours) in operated assets in <strong>2005</strong> was 1.19; none of the incidents<br />
were of a serious nature.<br />
■ Zero oil spills or gas leaks<br />
There was one oil spill (9.25 bbls) constituting a reportable oil spill<br />
under Company rules within the operated assets.<br />
HSE ENHANCEMENT INITIATIVES IN <strong>2005</strong><br />
To achieve and enhance HSE performance requires continuous<br />
attention and the search for improvement measures. A number of<br />
steps were undertaken in <strong>2005</strong> with this objective in mind, among<br />
which:<br />
■ External auditing<br />
In <strong>2005</strong>, <strong>Lundin</strong> <strong>Petroleum</strong>’s operations and facilities in France,<br />
Tunisia and the UK were subjected to third party audits, in order to<br />
ascertain conformity with legal and Company standards and<br />
identify improvement areas (see third party report below).<br />
■ Training<br />
The Company is responsible for providing a safe working<br />
environment for its staff through adequate facilities,<br />
equipment and work procedures. However, overall HSE performance<br />
depends to a great extent on the competence and ability of the<br />
staff to carry out their tasks in a safe manner and in accordance<br />
with legal and Company rules. In order to underline staff ’s<br />
individual responsibility, the Company decided to introduce STOP<br />
training, a behaviour based observation programme which helps<br />
to change staff behaviour by enhancing their observation and<br />
communication skills in its operated areas.<br />
> 22 <<br />
■ Reducing environmental impacts<br />
The main steps to reduce possible adverse impacts on the<br />
environment are carrying out environmental impact assessments<br />
prior to the commencement of operations and having in place<br />
detailed environmental plans which deal with all potential<br />
impacts. Careful planning and effi cient use of the facilities can<br />
help achieve reduction goals. This was the case in the UK, which is<br />
<strong>Lundin</strong> <strong>Petroleum</strong>’s only current area of operations subjected to the<br />
Emissions Trading System (ETS) put in place by the Kyoto Protocol<br />
to the United Nations Framework Convention on Climate Change.<br />
<strong>Lundin</strong> Britain’s CO 2 emissions were well below its allowances.<br />
■ Monitoring of non-operated assets<br />
<strong>Lundin</strong> <strong>Petroleum</strong>’s fi rst and foremost concern is to ensure that it<br />
has a sound HSE system in place in the areas it operates; however,<br />
it is also concerned with HSE performance in non-operated areas. Joint<br />
venture partners are required to have an HSE framework in place<br />
and to demonstrate sound HSE practice. The Company requires<br />
monthly HSE reporting from those entities, in addition to ad hoc<br />
information in the event of an incident which has a detrimental<br />
impact on people, plant or the environment.<br />
STAKEHOLDER ENGAGEMENT IN <strong>2005</strong><br />
As a responsible corporate citizen, <strong>Lundin</strong> <strong>Petroleum</strong> is committed<br />
to foster positive relations with its stakeholders. This takes place<br />
throughout the operational cycle from the acquisition of an asset<br />
through to its abandonment.<br />
At the acquisition stage, once the Company has identifi ed a technically<br />
attractive asset it carries out an analysis of the sociopolitical context<br />
in which the operations would take place, identifying the main<br />
problems in the area, the extent to which operations would be<br />
aff ected by or contribute to these problems, and the measures to put<br />
in place to promote a positive outcome.<br />
In the course of operations, <strong>Lundin</strong> <strong>Petroleum</strong> - or, in the case<br />
of non-operated assets, its partners - is in contact with a variety<br />
of stakeholders, including host authorities, regulators, local<br />
communities, interest groups, etc. It maintains an open dialogue<br />
with anyone who has a legitimate interest in the area and wishes<br />
to cooperate in contributing to improving the status quo. In areas<br />
where there are particular socioeconomic problems, such as Nigeria,<br />
Sudan or Venezuela, the Company contributes and actively supports<br />
community development projects.<br />
At the abandonment stage, the Company meets with regulators<br />
as well as those to whom the property reverts to agree jointly on<br />
rehabilitation measures.<br />
In some instances there is limited interaction between <strong>Lundin</strong><br />
<strong>Petroleum</strong> and host communities, given that some of the activities<br />
occur off shore or are carried out through operators other than <strong>Lundin</strong><br />
<strong>Petroleum</strong>. The Board of Directors thus decided, at the end of <strong>2005</strong>, to<br />
set up a fund to enable <strong>Lundin</strong> <strong>Petroleum</strong> to contribute to projects in<br />
areas or fi elds where the Company has an interest, even if those areas<br />
are not directly impacted by the Company’s activities.
CASE STUDY - HSE audit of <strong>Lundin</strong> <strong>Petroleum</strong>’s Tunisian operations<br />
In October <strong>2005</strong>, RC Consultants (RCC), an independent consultancy company<br />
in the AGR Ability Group, Norway, carried out a third party HSE audit of <strong>Lundin</strong><br />
<strong>Petroleum</strong> AB’s (the Company) Tunisian operations.<br />
Despite the fact that <strong>Lundin</strong> <strong>Petroleum</strong>’s activities are subject to diff erent<br />
national requirements and take place under diff erent environmental and<br />
operating conditions, there is a common platform for all the companies in<br />
the Group- the “Code of Conduct” - which is based on recognised principles of<br />
Corporate Social Responsibility (CSR). The Company promotes a culture and an<br />
organisation that refl ects these principles and seeks to be recognised as fully<br />
capable of performing operations in an orderly and safe manner.<br />
The purpose of carrying out the audit at the national level was to provide management with a clear picture of how<br />
the Health, Safety, Security and Environmental Management System (the HSSEMS) currently contributes to continual<br />
improvements in safety and environmental matters and how it is integrated with critical business processes and<br />
controls. The audit was also used as a basis for developing minimum corporate HSE expectations within the Group.<br />
RCC based the audit on expectations expressed in the “Code of Conduct” and verifi ed compliance with relevant parts<br />
of ISO 14001 (Environmental Management), OHSAS 18001 (Occupational, Health & Safety Management) and ISO<br />
9001 (Quality Management).<br />
The main focus of the audit was to confi rm that governing systems and procedures defi ned and in place in Tunisia<br />
complied with the “Code of Conduct” and recognised industry and regulatory requirements. It was also meant to<br />
assess the competence of the personnel in the organisation and their ability to carry out their tasks in a manner that<br />
caters to safety, that takes care of the environment and that upholds corporate values.<br />
The audit covered 7 main pre-defi ned areas, as per ISO standards: leadership & commitment, policy & objectives,<br />
organisation, resources & documentation, evaluation & risk management, planning & procedures, implementation<br />
& monitoring, auditing & reviewing. The personnel interviewed both in the offi ce in Tunis and off shore on the FPSO<br />
Ikdam was very receptive and open to the audit. Staff ’s eff orts and willingness to share status and performance was<br />
very high.<br />
The results revealed an overall good performance. The auditing process identifi ed areas for improvement and<br />
gave a clearer understanding of priority areas. RCC did not attribute the top score in certain areas, despite the<br />
fact that operations complied fully with international maritime and national legislation, as well as with corporate<br />
requirements, because it decided to measure performance up against the higher ISO standards and thus encourage<br />
continuous improvement of performance. There were two non-conformances registered: the lack of set measurable<br />
objectives as part of the HSSEMS and of a written HSE activity plan. Additional areas for improvements included: risk<br />
management, contractor management and monitoring of operations, which require a more systematic approach.<br />
During the close out meeting in Tunis, everyone demonstrated their intention to follow up on the audit by<br />
immediately starting the discussion of means and ways to work on the fi ndings. An implementation plan was<br />
reported to be in place a short time after the audit, demonstrating the seriousness with which they took the audit.<br />
All these facts and activities contribute to <strong>Lundin</strong> <strong>Petroleum</strong>’s status as an internationally recognised responsible<br />
energy company.<br />
Erik Grantangen,<br />
Senior Consultant HSE & QA, , RC Consultants<br />
Norway, January 2006<br />
> 23
SHARE INFORMATION<br />
<strong>Lundin</strong> <strong>Petroleum</strong> share<br />
<strong>Lundin</strong> <strong>Petroleum</strong>’s shares are listed on the O-list, Attract 40<br />
at the Stockholm Stock Exchange.<br />
Trading and market capitalisation<br />
Trading of <strong>Lundin</strong> <strong>Petroleum</strong> shares takes place on<br />
Stockholmsbörsen. Market capitalisation as of 31 December<br />
<strong>2005</strong> was MSEK 21,857.<br />
Liquidity<br />
High liquidity is important in attracting major institutional<br />
investors to <strong>Lundin</strong> <strong>Petroleum</strong>. During the year a daily<br />
average of 1,200,000 <strong>Lundin</strong> <strong>Petroleum</strong> shares with a<br />
value of MSEK 88.5 were traded on the Stockholm Stock<br />
Exchange.<br />
<strong>Lundin</strong> <strong>Petroleum</strong>’s share price can be monitored daily at<br />
www.lundin-petroleum.com where it is also possible to<br />
follow the Brent oil price.<br />
Share capital and voting rights<br />
The registered share capital at 31 December <strong>2005</strong> amounts<br />
to SEK 2,567,937 represented by 256,793,666 shares with a<br />
quota value of SEK 0.01 each and representing 1 vote each.<br />
All outstanding shares are common shares and carry equal<br />
rights to participation in <strong>Lundin</strong> <strong>Petroleum</strong>’s assets and<br />
earnings. One trading unit consists of 200 shares. As at 31<br />
December <strong>2005</strong> an additional 346,500 shares have been<br />
issued but not registered.<br />
Incentive warrants<br />
The Group operates an employee incentive scheme<br />
whereby incentive warrants are issued to employees<br />
following approval at the <strong>Annual</strong> General Meeting (AGM).<br />
From 2003 the warrants were issued at 110 percent of the<br />
average closing price for the ten days following the AGM.<br />
The warrants are issued for a period of three years and are<br />
not exercisable during the fi rst year of issue. In the event<br />
that all outstanding incentive warrants are exercised<br />
<strong>Lundin</strong> <strong>Petroleum</strong> will receive an amount of MSEK 238.2<br />
and the number of shares will be diluted by 1.8 percent.<br />
2003<br />
programme<br />
2004<br />
programme<br />
<strong>2005</strong><br />
programme<br />
Number of warrants<br />
initially issued 3,400,000 2,250,000 2,900,000<br />
Strike price in SEK 10.10 45.80 60.20<br />
Exercisable as from 31 May 2004 31 May <strong>2005</strong> 15 June 2006<br />
Issued and outstanding<br />
warrants as at 31 Dec <strong>2005</strong> 498,000 1,280,000 2,900,000<br />
Share Price (SEK) Trading Volume (MM Shares)<br />
120<br />
7<br />
100<br />
80<br />
60<br />
40<br />
20<br />
0<br />
> 24 <<br />
<strong>2005</strong> Highlights<br />
Stockholmsbörsen Listing Attract 40<br />
Number of shares issued 257,140,166<br />
Year high/ year low 99.75/38.30<br />
Market capitalisation at 31 Dec <strong>2005</strong> MSEK 21,857<br />
Ticker code, Reuters LUPE.ST<br />
Bloomberg LUPE SS<br />
Jan Feb Mar Apr May Jun Jul Aug Sep Oct Nov Dec<br />
<strong>2005</strong><br />
<strong>Lundin</strong> <strong>Petroleum</strong> AB (LUPE) share price, daily<br />
Stockholm Stock Exchange All-share Index, daily, adjusted<br />
Trading volume, daily<br />
Dividend policy<br />
<strong>Lundin</strong> <strong>Petroleum</strong>’s primary objective is to add value to the<br />
shareholders, employees and co-venturers through profi table<br />
operations and growth. The added value will be expressed partly by<br />
dividends paid and partly by a long-term increase in the share price.<br />
This will be achieved by increased hydrocarbon reserves, developing<br />
discoveries and thereby increasing production and ultimately cash<br />
fl ow and net income.<br />
The size of the dividend has to be determined by <strong>Lundin</strong> <strong>Petroleum</strong>’s<br />
fi nancial position and the possibilities for growth through profi table<br />
investments. Dividends will be paid when <strong>Lundin</strong> <strong>Petroleum</strong> generates<br />
suffi cient sustainable cash fl ow and net income from operations to<br />
maintain long-term fi nancial strength and fl exibility. Over time the<br />
total return to shareholders is expected to accrue to a greater extent<br />
from the increase in share price than from dividends received.<br />
Due to the nature of <strong>Lundin</strong> <strong>Petroleum</strong>’s operations, the dividend<br />
policy is to give funding priority to ongoing projects, and satisfy the<br />
immediate capital requirements of <strong>Lundin</strong> <strong>Petroleum</strong>.<br />
6<br />
5<br />
4<br />
3<br />
2<br />
1<br />
0
Share data<br />
Since the company was incorporated in May 2001 and up to 31 December <strong>2005</strong> the Parent Company share capital has developed as shown below:<br />
Month<br />
and year<br />
Quota value<br />
(SEK)<br />
Change in<br />
number of shares<br />
> 25 <<br />
Total number<br />
of shares<br />
Total share capital<br />
(SEK)<br />
Subscription<br />
price (SEK)<br />
Formation of the Company May 2001 100.00 1,000 1,000 100,000.00 100.00<br />
Share split 10,000:1 June 2001 0.01 9,999,000 10,000,000 100,000.00 -<br />
New share issue June 2001 0.01 92,861,283 102,861,283 1,028,612.83 0.01<br />
New share issue July 2001 0.01 3,342,501 106,203,784 1,062,037.84 0.01<br />
New share issue Nov 2001 0.01 106,203,784 212,407,568 2,124,075.68 3.00<br />
Warrants June 2002 0.01 35,609,748 248,017,316 2,480,173.16 4.50<br />
Incentive warrants 2002 0.01 667,700 248,685,016 2,486,850.16 3.37<br />
Incentive warrants 2003 0.01 2,075,850 250,760,866 2,507,608.66 3.37<br />
Incentive warrants 2003 0.01 764,600 251,525,466 2,515,254.66 4.50<br />
Incentive warrants 2004 0.01 247,300 251,772,766 2,517,727.66 3.37<br />
Incentive warrants 2004 0.01 848,500 252,621,266 2,526,212.66 4.50<br />
Incentive warrants 2004 0.01 1,127,100 253,748,366 2,537,483.66 10.10<br />
Incentive warrants <strong>2005</strong> 0.01 791,900 254,540,266 2,545,402.66 4.50<br />
Incentive warrants <strong>2005</strong> 0.01 1,774,900 256,315,166 2,563,151.66 10.10<br />
Incentive warrants <strong>2005</strong> 0.01 825,000 257,140,166 2,571,401.66 45.80<br />
Total 257,140,166 257,140,166 2,571,401.66<br />
Share ownership structure<br />
<strong>Lundin</strong> <strong>Petroleum</strong> had 41,038 shareholders as at 31 December<br />
<strong>2005</strong>. The proportion of shares held by institutional investors<br />
amounted to 76 percent. Foreign investors held 58 percent of the<br />
shares. During the year the number of shareholders increased by<br />
24 percent.<br />
The 10 largest shareholders<br />
according to VPC, as at<br />
31 December <strong>2005</strong><br />
Numbers<br />
of shares<br />
Subscription<br />
capital/votes,%<br />
Lorito Holdings Ltd 71,435,168 27.8<br />
Landor Participations Inc. 13,407,456 5.2<br />
Mourgue d’Algue et Cie 7,483,730 2.9<br />
Robur Fonder 4,091,521 1.6<br />
Handelsbanken Fonder 3,772,690 1.5<br />
SEB Fonder 3,561,500 1.4<br />
JP Morgan Chase Bank 2,386,364 0.9<br />
SEB Trygg-Liv 2,136,000 0.8<br />
Andra AP Fonden 2,001,120 0.8<br />
Första AP-Fonden 1,990,800 0.8<br />
Other Shareholders 144,527,308 56.3<br />
Total 256,793,666 100<br />
■ The 10 largest shareholders registered with the VPC, the Swedish Securities<br />
Register Center<br />
■ Lorito Holdings Ltd. holds 71,435,168 shares in <strong>Lundin</strong> <strong>Petroleum</strong>. Lorito<br />
Holdings Ltd. is an investment company wholly owned by a trust whose<br />
settler is Adolf H. <strong>Lundin</strong><br />
■ Landor Participations Inc. holds 13,407,456 shares in <strong>Lundin</strong> <strong>Petroleum</strong>.<br />
Landor Participations Inc. is an investment company wholly owned by a trust<br />
whose settler is Ian H. <strong>Lundin</strong>.<br />
■ As per 31 December <strong>2005</strong> 346,500 shares were issued but not registered.<br />
Distribution of shareholdings<br />
Distribution of shareholdings in <strong>Lundin</strong> <strong>Petroleum</strong> according to<br />
VPC, 31 December <strong>2005</strong>.<br />
Size categories as at<br />
31 December <strong>2005</strong><br />
Numbers of<br />
shareholders<br />
Percentage<br />
of shares,%<br />
1–500 24,423 1.8<br />
501–1,000 7,122 2.4<br />
1,001–10,000 8,276 9.9<br />
10,001–50,000 912 7.5<br />
50,001–100,000 135 3.7<br />
100,001– 170 74.7<br />
Total 41,038 100<br />
Analyst coverage<br />
Broker Analyst<br />
ABG Sundal Collier Oystein Oyehaug<br />
oystein.oyehaug@abgsc.no<br />
Carnegie John A. Schj.Olaisen<br />
jo@carnegie.no<br />
Enskilda Securities Julian Beer<br />
julian.beer@enskilda.se<br />
Handelsbanken Anne Gjoen<br />
angj01@handelsbanken.se<br />
Merrill Lynch Andrew Knott<br />
Andrew_knott@ml.com<br />
Swedbank Markets Alexander Vilval<br />
alexander.vilval@swedbank.com<br />
Öhman Fondkomission Joakim Kindahl<br />
joakim.kindahl@ohman.se
BOARD OF DIRECTORS<br />
The <strong>Annual</strong> General Meeting (AGM) elects the Board members<br />
for a period of one year. Board members are nominated in<br />
accordance with the nomination process adopted by the AGM<br />
in <strong>2005</strong> (see below). The composition of the Board of Directors is<br />
decided through a vote of the shareholders during the AGM after<br />
recommendation from the Nomination Committee.<br />
NOMINATION PROCESS<br />
Election to the Board<br />
The <strong>2005</strong> AGM decided upon the Nomination Process which<br />
would take place in 2006, requiring the creation of an external<br />
Nomination Committee. This Nomination Committee was formed<br />
in <strong>2005</strong> and consists of a total of fi ve members, representing<br />
four of the largest shareholders, i.e Magnus Bakke, of Robur<br />
Fonder, Ossian Ekdahl, of Första AP-fonden , Björn Lind, of SEB<br />
Trygg-Liv, Ian H. <strong>Lundin</strong> (of Landor Participation Inc. and Lorito<br />
Holdings Ltd, also Chairman of <strong>Lundin</strong> <strong>Petroleum</strong>) and Magnus<br />
Unger (non-executive Board member) who acts as Chairman of<br />
the committee. Magnus Unger was unanimously selected as the<br />
chairman as it was felt that he had the best knowledge both of<br />
the Company and Swedish requirements and thus could best<br />
represent the shareholders’ interests. The names of the members<br />
of the Nomination Committee were announced and posted on the<br />
website as soon as the representatives had been appointed.<br />
In furtherance of the Nomination Committee’s responsibility<br />
to propose members of the Board to the AGM, the Chairman<br />
undertook on its behalf a systematic evaluation of the work of the<br />
Board and its members through the preparation of a questionnaire<br />
and presented the results and conclusions to the Nomination<br />
Committee. In addition to the functions described above the<br />
Nomination Committee makes recommendations to the AGM<br />
regarding fees for the Chairman and Board members and for<br />
Board committee work, audit fees and election of the Chairman to<br />
the AGM. No remuneration was paid to either the Chairman or any<br />
of the members for their work on the Nomination Committee.<br />
Election of auditors<br />
The audit fi rm PricewaterhouseCoopers AB, Sweden, was<br />
appointed by the <strong>2005</strong> AGM as auditors for the period up until<br />
2008. As part of the function of the Nomination Committee<br />
auditors are recommended for nomination.<br />
THE BOARD OF DIRECTORS<br />
The composition and the functions of the Board of <strong>Lundin</strong><br />
<strong>Petroleum</strong> are described below. The Board adheres to a set of<br />
rules and procedures, the Rules of Procedure, which are updated<br />
> 26 <<br />
on a regular basis to take into account changes in legislation<br />
as well as the structure and orientation of the Company.<br />
The Rules were revised on 15 August <strong>2005</strong>, to make them conform<br />
to the terms of the Swedish Code of Corporate Governance. Major<br />
changes were in the reduction in the number of Board Committees<br />
and the external Nomination Committee replacing the prior<br />
Governance and Nomination Committee.<br />
Composition of the Board<br />
According to the Articles of Association the board shall consist of<br />
a minimum of three and a maximum of ten directors. Nine Board<br />
members were elected at the AGM on 19 May <strong>2005</strong>, including a new<br />
member, Viveca Ax:son Johnson. At the statutory Board meeting,<br />
Ian H. <strong>Lundin</strong> was appointed Chairman. No deputy directors have<br />
been appointed and the CEO is a member of the Board. There are<br />
no members appointed by employee organisations.<br />
As a matter of policy, there is a majority of independent directors<br />
on the Board. The criteria to establish whether a director is<br />
“independent” are those listed under Article 3.2.4 of the Swedish<br />
Code of Governance and the listing requirements of the Stockholm<br />
Stock Exchange.<br />
The Chairman of the Board of Directors is not employed by<br />
the Company and does not receive any salary nor is he eligible<br />
for participation in the Company’s incentive programme. The<br />
Chairman of the Board of Directors up-holds the reporting<br />
instructions for the Company management as drawn up by the<br />
Managing Director and approved by the Board of Directors and<br />
does not take part in the day-to-day decision-making concerning<br />
the business operations of the Company.<br />
REMUNERATION OF BOARD ME<strong>MB</strong>ERS<br />
Remuneration of the Chairman of the Board and Board members is<br />
in accordance with the resolution adopted by the <strong>Annual</strong> General<br />
Meeting. The remuneration of the Board of Directors is stated in<br />
the <strong>Annual</strong> <strong>Report</strong>’s note to fi nancial statements (see Note 38,<br />
Remuneration to Board of Directors and Management).<br />
Rules of Procedures for the Board<br />
The Rules of Procedure are adopted annually and reviewed when<br />
necessary. In order to be in full conformity with the Code of<br />
Corporate Governance, the Rules of Procedure were thoroughly<br />
reviewed and revised by the Board on 15 August <strong>2005</strong>.<br />
The Rules of Procedure set out the details of how the Board is<br />
to conduct its work, including the number of Board meetings,<br />
Audit<br />
Compensation Independent of<br />
Name Function Elected Committee Committee Company<br />
Carl Bildt Director 2001 Yes<br />
Viveca Ax:son Johnson Director <strong>2005</strong> Yes<br />
C. Ashley Heppenstall President & CEO 2001 No<br />
Kai Hietarinta Director 2001 Yes Yes<br />
Adolf H. <strong>Lundin</strong> Honorary Chairman 2001 No<br />
Ian H. <strong>Lundin</strong> Chairman 2001 Yes No<br />
Lukas H. <strong>Lundin</strong> Director 2001 Yes Yes*<br />
William Rand Director 2001 Yes Yes Yes<br />
Magnus Unger Director 2001 Yes Yes Yes<br />
* No professional ties to <strong>Lundin</strong> <strong>Petroleum</strong> but linked to dominant shareholder by family ties.
the division of duties within the Board of Directors, the Board<br />
composition and functioning, etc.<br />
The Functions of the Board<br />
The Board of Directors’ primary duties are the organisation of the<br />
Company and the management of the Company’s operations<br />
including:<br />
■ Decisions regarding focus of the business and adoption of<br />
Company policies.<br />
■ Supply of capital.<br />
■ Appointment and regular evaluation of the work of the<br />
Managing Director (also referred to as chief executive offi cer<br />
“CEO”) and Company management.<br />
■ Approval of the reporting instructions for the Company<br />
management.<br />
■ Ensuring that the Company’s external communications are<br />
open, objective and appropriate for target audiences.<br />
■ Ensuring that there is an eff ective system for follow-up and<br />
control of the Company’s operations and fi nancial position vis-àvis<br />
the established goals.<br />
■ Follow-up and monitoring that operations are carried out within<br />
established limits in compliance with laws, regulations, stock<br />
exchange rules, and customary practice on the securities<br />
market.<br />
■ Ensuring that the necessary guidelines governing the Company’s<br />
ethical conduct are established.<br />
The Board of Directors ensures that the Company’s organisation in<br />
respect of accounting, management of funds and the Company’s<br />
fi nancial position in general include satisfactory systems of internal<br />
control.<br />
The Board of Directors further ensures that there is systematic and<br />
structured evaluation of its work on an annual basis.<br />
Board meetings<br />
The Board of Directors normally holds at least fi ve ordinary<br />
meetings per calendar year. At each of these meetings, the<br />
following matters are addressed:<br />
■ Review and approval of the minutes from the preceding<br />
meeting.<br />
■ <strong>Report</strong> of the Managing Director regarding:<br />
- Status of the business<br />
- Prospects<br />
- Economic and Commercial report<br />
- Financial report<br />
■ <strong>Report</strong>s from the Committees of the Board of Directors.<br />
■ Items related to decisions (e.g. concerning investments,<br />
acquisition and sale of companies, formation of<br />
subsidiaries and increases in capital of subsidiaries, loans and<br />
guarantees, and also structural and organisational matters).<br />
■ Miscellaneous issues of material importance for the Company.<br />
During <strong>2005</strong> fi ve board meetings took place, including the<br />
statutory meeting. One executive session whereby the Board was<br />
given the opportunity to interact directly with the management<br />
was also held. This meeting was held in conjunction with a visit to<br />
the Norwegian operations.<br />
> 27 <<br />
Committees<br />
The Board has a Compensation Committee and an Audit<br />
Committee, each with its clear mandate as described below.<br />
Compensation Committee<br />
The function of the Compensation Committee is to receive<br />
information on and determine matters regarding compensation<br />
to the Group Management. The guiding philosophy of the<br />
Committee in determining compensation for executives is the<br />
need to provide a compensation package that is competitive<br />
and motivating, will attract and retain qualifi ed executives, and<br />
encourage and motivate performance.<br />
Members: William A. Rand (Chairman), Lukas H. <strong>Lundin</strong>, Kai<br />
Hietarinta and Magnus Unger<br />
Audit Committee<br />
The function of the Audit Committee is to review on behalf of the<br />
Board, the Company’s quarterly (fi rst and third) interim fi nancial<br />
statements, review and make recommendations to the Board<br />
in relation to the Company’s six month and yearly accounts,<br />
review audit fees, ensure maintenance of, and compliance<br />
with, the Company’s internal control systems and liaise with the<br />
Group’s external auditors as part of the annual audit process.<br />
Members: William A. Rand (Chairman), Ian H. <strong>Lundin</strong> and Magnus<br />
Unger<br />
Meeting attendance<br />
Name Board<br />
Audit<br />
Committee<br />
Compensation<br />
Committee<br />
Carl Bildt 4/5<br />
Viveca Ax:son Johnson 3/5*<br />
C. Ashley Heppenstall 5/5<br />
Kai Hietarinta 5/5 2/2<br />
Adolf H. <strong>Lundin</strong> 4/5<br />
Ian H. <strong>Lundin</strong> 5/5 2/4**<br />
Lukas H. <strong>Lundin</strong> 4/5 2/2<br />
William Rand 5/5 4/4 2/2<br />
Magnus Unger 5/5 4/4 2/2<br />
* Joined the Board in May <strong>2005</strong><br />
** Joined the Audit Committee in August <strong>2005</strong><br />
Systematic evaluation of the Board’s work<br />
A formal review of the work of the Board was carried out in the<br />
course of <strong>2005</strong>. Through a questionnaire submitted to all the<br />
members, diff erent aspects of Board work were considered<br />
including working procedures, working climate, need of special<br />
competence and information. The results and conclusions were<br />
presented to the Nomination Committee. The overall conclusions<br />
from the review process were the following:<br />
■ Existing composition of the Board is good for the tasks at hand<br />
■ Presentation materials and Board meetings are of professional<br />
quality<br />
■ Positive atmosphere during Board meetings conducive to open<br />
and frank discussions during meetings
BOARD OF DIRECTORS<br />
From left to right William A. Rand, Viveca Ax:son Johnson, Ian H. <strong>Lundin</strong>, Magnus Unger, Kai Hietarinta, Lukas H. <strong>Lundin</strong>, Carl Bildt, C. Ashley Heppenstall<br />
PRESENTATION OF THE BOARD OF DIRECTORS<br />
The Board of Directors consists of nine elected Board members.<br />
The President and CEO is the only executive member.<br />
Ian H. <strong>Lundin</strong>, Director since 2001, Chairman since 2002<br />
Born 1960<br />
Other board duties: Vostok Nafta Investment Ltd.<br />
Bachelor of Science degree in <strong>Petroleum</strong> Engineering from the<br />
University of Tulsa.<br />
Shares in <strong>Lundin</strong> <strong>Petroleum</strong>: nil 1<br />
Incentive warrants: 150,000*<br />
Adolf H. <strong>Lundin</strong>, (not in photographs)<br />
Chairman 2001-2002, Honorary Chairman since 2002<br />
Born 1932<br />
Other signifi cant board duties: Chairman of Vostok Nafta<br />
Investment Ltd. Board member of Canadian Gold Hunter Corp.,<br />
<strong>Lundin</strong> Mining Corp., Tenke Mining Corp., Valkyries <strong>Petroleum</strong><br />
Corp.<br />
Master of Science degree (Department of Engineering) from<br />
the Royal Institute of Technology, Stockholm. <strong>MB</strong>A degree from<br />
Centre d´Etudes Industrielles, Geneva<br />
Shares in <strong>Lundin</strong> <strong>Petroleum</strong>: nil 2<br />
Incentive warrants: nil<br />
1<br />
Landor Participations Inc holds 13,407,456 shares in <strong>Lundin</strong> <strong>Petroleum</strong>.<br />
Landor Participations Inc. is an investment company wholly owned by a<br />
trust whose settler is Ian H. <strong>Lundin</strong>.<br />
2<br />
Lorito Holdings Ltd. holds 71,435,168 shares in <strong>Lundin</strong> <strong>Petroleum</strong>. Lorito<br />
Holdings Ltd. is an investment company wholly owned by a trust whose<br />
settler is Adolf H. <strong>Lundin</strong><br />
* Issued in 2003<br />
> 28 <<br />
Viveca Ax:son Johnson , Director since <strong>2005</strong><br />
Born 1963<br />
Other board duties: Chairman of Axel and Margret Ax:son<br />
Johnson Foundation, deputy Chairman of Nordstjernan AB.<br />
Board member of GP Förvaltnings AB, Sirius Machinery AB,<br />
Skanditek Industriförvaltning AB, Välinge Holding AB and<br />
Heerema Trust.<br />
Shares in <strong>Lundin</strong> <strong>Petroleum</strong>: nil<br />
Incentive warrants: nil<br />
Carl Bildt, Director since 2001<br />
Born 1949<br />
Other board duties: Chairman of Kreab AB, Nordic Venture<br />
Network and Teleoptimering AB. Board member of HiQ AB,<br />
E. Öhman J:or AB, Vostok Nafta Investment Ltd., Legg Mason Inc.<br />
Member of the Board of Trustees of the Rand Corporation and<br />
member of the International Advisory Board of the Council on<br />
Foreign Relations in New York.<br />
Member of the Swedish Parliament 1979–2001. Prime Minister of<br />
Sweden 1991–1994. UN Secretary General’s Special Envoy for the<br />
Balkans 1999–2001.<br />
Shares in <strong>Lundin</strong> <strong>Petroleum</strong>: nil<br />
Incentive warrants: nil
Board members at the executive session in Norway<br />
Lukas <strong>Lundin</strong>, Ashley Heppenstall and Ian <strong>Lundin</strong> boarding<br />
the helicopter to fl y to the Thistle Platform, off shore UK.<br />
C. Ashley Heppenstall, President and Chief Executive Offi cer. Director since 2001<br />
Born 1962<br />
Other board duties: Valkyries <strong>Petroleum</strong> Corp. and Matrix Rm Fund.<br />
Bachelor of Science degree in Mathematics from the University of Durham.<br />
Shares in <strong>Lundin</strong> <strong>Petroleum</strong>: 1,143,250<br />
Incentive warrants: 550,000<br />
Kai Hietarinta, Director since 2001<br />
Born 1932<br />
Other board duties: Vostok Nafta Investment Ltd.<br />
Master of Science degree in Engineering from Helsinki University of Technology.<br />
<strong>MB</strong>A from Helsinki School of Economics. Dr of Economics HC from the School of<br />
Economics and Business Administration in Turku.<br />
Shares in <strong>Lundin</strong> <strong>Petroleum</strong>: nil<br />
Incentive warrants: nil<br />
Lukas H. <strong>Lundin</strong>, Director since 2001<br />
Born 1958<br />
Other signifi cant board duties: Chairman of Tanganyika Oil Co. Ltd., Canadian<br />
Gold Hunter Corp., International Uranium Corporation, Tenke Mining Corp.,<br />
Valkyries <strong>Petroleum</strong> Corp. and <strong>Lundin</strong> Mining Corp. Board member of Vostok<br />
Nafta Investment Ltd and Atacama Minerals Corp.<br />
Graduate from New Mexico Institution of Mining, Technology and Engineering.<br />
Shares in <strong>Lundin</strong> <strong>Petroleum</strong>: 708,478<br />
Incentive warrants: nil<br />
William A. Rand, Director since 2001<br />
Born 1942<br />
Other signifi cant board duties: <strong>Lundin</strong> Mining Corp., Tenke Mining Corp., Vostok<br />
Nafta Investment Ltd., International Uranium Corp., Canadian Gold Hunter Corp.,<br />
Pender Financial Group Corporation and Dome Ventures Corp.<br />
Commerce degree (Honours Economics) from McGill University. Law degree from<br />
Dalhousie University. Master of Law degree in International Law from the London<br />
School of Economics.<br />
Shares in <strong>Lundin</strong> <strong>Petroleum</strong>: 50,000<br />
Incentive warrents: nil<br />
Magnus Unger, Director since 2001<br />
Born 1942<br />
Other board duties: Chairman of Strategic Leap AB and CAL-Konsult AB. Board<br />
member of System Separation AB and Quartz Pro AB<br />
<strong>MB</strong>A from the Stockholm School of Economics.<br />
Shares in <strong>Lundin</strong> <strong>Petroleum</strong>: 50,000<br />
Incentive warrants: nil<br />
> 29
MANAGEMENT<br />
Standing from left to right: Chris Bruijnzeels, Geoff rey Turbott,<br />
Jeff rey Fountain, Christine Batruch, Tim Coulter.<br />
Sitting from left to right: C. Ashley Heppenstall, Alexandre Schneiter<br />
MANAGEMENT AND COMPANY STRUCTURE<br />
The President and CEO, who is a member of both the Board of Directors<br />
as well as of the Group management, has overall responsibility for<br />
the <strong>Lundin</strong> <strong>Petroleum</strong> Group. The President and CEO is assisted in his<br />
functions by the Group Management (see below). All the managers in the<br />
Company are responsible for working in compliance with the company’s<br />
strategies and procedures.<br />
The main responsibility for the operation of Company assets, ensuring<br />
that approved budgets are maintained and that all of <strong>Lundin</strong> <strong>Petroleum</strong>’s<br />
internal rules and principles are followed, rests with the manager of<br />
each geographical business unit (General Manager) as well as with the<br />
Group management. General Managers regularly report on all technical,<br />
commercial, HSE, fi nancial and legal issues to the Group management.<br />
Remuneration<br />
<strong>Lundin</strong> <strong>Petroleum</strong>’s aim is to recruit, motivate and retain high calibre<br />
executives capable of achieving the objectives of the Group, and to<br />
encourage and appropriately reward superior performance in a manner<br />
that enhances shareholder value. Accordingly, the Group operates<br />
a Policy on Remuneration which ensures that there is a clear link to<br />
performance and a close alignment with shareholder interests, and aims<br />
to ensure that senior executives are rewarded fairly for their contribution<br />
to the Group’s performance (see Note 38, Remuneration to Board of<br />
Directors’ and Management).<br />
Changes in management<br />
Marco Zanella left the Company in January <strong>2005</strong>. Andrew Harber, Vice<br />
President Corporate Services transferred to the role of General Manager<br />
of the Company’s Indonesian operation during March <strong>2005</strong> and the role<br />
of Vice President Corporate Services was withdrawn with the functions<br />
of the role being redistributed among other positions. During <strong>2005</strong> Tim<br />
Coulter has been appointed Vice President Operations.<br />
> 30
Group Management<br />
Ashley Heppenstall, President and Chief Executive Offi cer, born<br />
1962<br />
As President and Chief Executive Offi cer, Ashley Heppenstall<br />
is responsible for the overall leadership, strategy and vision of<br />
<strong>Lundin</strong> <strong>Petroleum</strong>.<br />
See Board of Directors<br />
Alexandre Schneiter, Executive Vice President and<br />
Chief Operating Offi cer, born 1962<br />
As Chief Operating Offi cer Alex Schneiter leads an experienced<br />
team of oil and gas professionals and is ultimately responsible for<br />
<strong>Lundin</strong> <strong>Petroleum</strong>’s worldwide operations.<br />
Shares in <strong>Lundin</strong> <strong>Petroleum</strong>: 50,000<br />
Incentive warrants outstanding: 550,000<br />
Geoff rey Turbott, Vice President Finance and Chief Financial<br />
Offi cer, born 1963<br />
Geoff rey Turbott is directly responsible for <strong>Lundin</strong> <strong>Petroleum</strong>’s<br />
administration, fi nancial reporting, internal audit, risk<br />
management, tax and treasury function.<br />
Shares in <strong>Lundin</strong> <strong>Petroleum</strong>: 2,000<br />
Incentive warrants outstanding: 165,000<br />
Christine Batruch, Vice President Corporate Responsibility, born<br />
1959<br />
Christine Batruch is responsible for <strong>Lundin</strong> <strong>Petroleum</strong>’s strategy<br />
in HSE and for overseeing implementation of the Company’s<br />
policies and procedures. She is also responsible for relations with<br />
local communities and relevant interest groups.<br />
Shares in <strong>Lundin</strong> <strong>Petroleum</strong>: 2,000<br />
Incentive warrants outstanding: 105,000<br />
Chris Bruijnzeels, Vice President Reservoir and Production, born<br />
1959<br />
Chris Bruijnzeels is responsible for <strong>Lundin</strong> <strong>Petroleum</strong>’s reservoir<br />
management, production forecasting and commercial and<br />
economic evaluation.<br />
Shares in <strong>Lundin</strong> <strong>Petroleum</strong>: nil<br />
Incentive warrants outstanding: 90,000<br />
Tim Coulter, Vice President Operations, born 1953<br />
Tim Coulter is responsible for engineering, drilling and<br />
production operations for <strong>Lundin</strong> <strong>Petroleum</strong>.<br />
Shares in <strong>Lundin</strong> <strong>Petroleum</strong>: nil<br />
Incentive warrants outstanding: 50,000<br />
Jeff rey Fountain, Vice President Legal, born 1969<br />
Jeff rey Fountain is responsible for all legal matters pertaining to<br />
the <strong>Lundin</strong> <strong>Petroleum</strong> .<br />
Shares in <strong>Lundin</strong> <strong>Petroleum</strong>: nil<br />
Incentive warrants outstanding: 120,000<br />
> 31 <<br />
AUDITORS<br />
PricewaterhouseCoopers AB, Lilla Bommen 5,<br />
Gothenburg, Sweden<br />
Carl-Eric Bohlin, born 1946<br />
Authorised Public Accountant<br />
<strong>Lundin</strong> <strong>Petroleum</strong> auditor since 2001<br />
PricewaterhouseCoopers AB, Stockholm<br />
Klas Brand, born 1956<br />
Authorised Public Accountant<br />
<strong>Lundin</strong> <strong>Petroleum</strong> auditor since 2001<br />
PricewaterhouseCoopers AB, Gothenburg<br />
Deputy Auditor<br />
Bo Hjalmarsson, born 1960<br />
Authorised Public Accountant<br />
<strong>Lundin</strong> <strong>Petroleum</strong> auditor since 2001<br />
PricewaterhouseCoopers AB, Stockholm
CORPORATE GOVERNANCE REPORT- Chairman’s introduction<br />
In late 2004, the Code Group (appointed by the Swedish<br />
government to develop a framework for good governance for<br />
Swedish companies), issued the Code of Governance (the Code),<br />
which came into eff ect on 1 July <strong>2005</strong>. <strong>Lundin</strong> <strong>Petroleum</strong>’s Board<br />
of Directors thoroughly analysed the Code to ascertain how it<br />
should be adopted by <strong>Lundin</strong> <strong>Petroleum</strong> AB.<br />
The conclusion reached by the Board was that the Code generally<br />
refl ected <strong>Lundin</strong> <strong>Petroleum</strong>’s existing views and practice in this<br />
fi eld, and that the Company should therefore adopt the Code and<br />
make the necessary changes to conform in all relevant aspects to<br />
the Code.<br />
As a result of this decision, a number of concrete steps were taken<br />
by <strong>Lundin</strong> <strong>Petroleum</strong> in <strong>2005</strong>.<br />
Firstly, the Code was reviewed by the management in the spring<br />
of <strong>2005</strong> with a view to assess the formal changes which would<br />
have to be made to conform to the Code.<br />
Secondly, the Rules of Procedure for the Board were amended<br />
to conform to the Code and adopted at a special Board meeting<br />
organised for this purpose on 15 August <strong>2005</strong>. These amendments<br />
consisted of defi ning more clearly the primary duties and<br />
responsibilities of the Board of Directors and the division of duties<br />
within the Board of Directors, as well as the restructuring of Board<br />
Committees.<br />
Thirdly, as per the Code of Governance requirement and the<br />
instruction of the <strong>2005</strong> AGM, an independent Nomination<br />
Committee was created. The main functions of the Nomination<br />
Committee are to assess the work of the Board and propose<br />
candidates to the Board and the auditors at the AGM. As<br />
Chairman of the Board, following the decision of the <strong>2005</strong><br />
AGM, I invited a number of institutional shareholders to take<br />
part in the new Nomination Committee to be made up of fi ve<br />
members. As a result of this invitation three persons who do not<br />
sit on the Board but represent some of the largest shareholders<br />
External Audit Shareholders by the AGM<br />
Board of Directors<br />
CEO and Group Management<br />
> 32 <<br />
agreed to join the Committee, namely, Magnus Bakke for Robur<br />
Foundation, Ossian Ekdahl for Första AP Fonden and Björn Lind<br />
for SEB Trygg-Liv. Myself, as representative of the two largest<br />
shareholders (Lorito Holdings Ltd. and Landor Particpations Inc.).<br />
and Magnus Unger, also a Director, are the two other members of<br />
the Committee. The decision to have Magnus Unger as chairman<br />
was taken unanimously as it was felt that he had the necessary<br />
knowledge both of Swedish Corporate Governance and company<br />
practice. The Committee members had several informal meetings<br />
and discussions before meeting formally for the fi rst time on 15<br />
December <strong>2005</strong>.<br />
As a result of the above changes the Finance Committee and<br />
Governance/Nomination Committee (which previously reported<br />
to the Board), were disbanded as their functions were essentially<br />
those of the independent Nomination Committee. There are<br />
now only two Committees that report directly to the Board (the<br />
Compensation Committee and the Audit Committee).<br />
Finally the instructions for the Chief Executive Offi cer (CEO) and<br />
Executive Vice President have been elaborated and a review of<br />
the performance of the CEO will be performed on annual basis.<br />
With regard to the work of the Board during <strong>2005</strong>, fi ve meetings<br />
took place, including the statutory meeting. An executive session<br />
whereby management could interact directly with the Board was<br />
also held. A Board review was carried out and the results and<br />
conclusions were presented to the Nomination Committee.<br />
Corporate Governance at <strong>Lundin</strong> <strong>Petroleum</strong> is an evolving issue<br />
primarily designed to protect shareholder rights. We will ensure<br />
to remain true to its vocation.<br />
Ian H. <strong>Lundin</strong><br />
Chairman of the Board<br />
Nomination procedure (Nomination Committee)<br />
Audit Committee<br />
Renumeration Committee<br />
Internal Audit
Since its creation, <strong>Lundin</strong> <strong>Petroleum</strong> AB (the “Company”) has been<br />
guided by general principles of corporate governance designed<br />
to:<br />
■ Protect shareholder rights<br />
■ Provide a safe and rewarding working environment to all<br />
employees<br />
■ Carry out business (i.e. oil & gas exploration and production) in a<br />
professional and effi cient manner keeping in mind the<br />
protection of the environment<br />
■ Contribute to the development and improvement of living<br />
standards of communities in all areas of operations.<br />
In addition, <strong>Lundin</strong> <strong>Petroleum</strong> abides to principles of corporate<br />
governance elaborated internally and externally. They are to be<br />
found in the following documents:<br />
The Swedish Code of Corporate Governance (“Code of<br />
Governance”)<br />
The Code of Governance is based on the Swedish Companies<br />
Act and the tradition of self-regulation. This document was<br />
issued in late 2004 by the Code Group on behalf of the Swedish<br />
government (ref: SOU 2004:130) and integrated in the listing<br />
agreement with the Stockholm Stock Exchange 1 July <strong>2005</strong>.<br />
There are two instances in which the Company does not<br />
abide strictly to the terms of the Code of Governance though<br />
in substance it does. Firstly, because the Managing Director<br />
is not fl uent in Swedish, his presentation during the<br />
AGM is delivered in English, not Swedish as the Code requires.<br />
Nonetheless, Swedish subtitles are provided concurrently<br />
on the overhead slides. The second departure is that a board<br />
member serves as the chairman of the Nomination Committee,<br />
as the Committee felt he was the best candidate to carry out<br />
the task.<br />
The Exchange Rules<br />
The Exchange Rules form an integral part of the Listing<br />
Agreement between the Company and Stockholmsbörsen<br />
AB. Details regarding the Exchange Rules can be found on the<br />
following website www.stockholmsborsen.se.<br />
The Listing Agreement is an agreement between Stockholmbörsen<br />
and the Company regarding the requirements of being<br />
listed at the Stockholm Stock Exchange.<br />
> 33 <<br />
CORPORATE GOVERNANCE REPORT<br />
<strong>Lundin</strong> <strong>Petroleum</strong>’s Code of Conduct (“Code”)<br />
The Code is a set of principles formulated by the Board to give<br />
overall guidance to employees, contractors and partners on<br />
how the Company is to conduct business. The Code was adopted<br />
at the formation of <strong>Lundin</strong> <strong>Petroleum</strong> in 2001. Compliance with<br />
the Code is reviewed on an annual basis by the Board. The Code<br />
can be found on the Company’s website www.lundin-petroleum.<br />
com.<br />
The Code was developed by <strong>Lundin</strong> <strong>Petroleum</strong> at a time<br />
when there were no formal requirements in Sweden regarding<br />
corporate governance. The Company decided to make its values,<br />
principles and commitment explicit in order to set the necessary<br />
framework for ethical conduct, against which the Company<br />
could be assessed and evaluated.<br />
<strong>Lundin</strong> <strong>Petroleum</strong>’s Policies & Management System<br />
The Company has policies covering Communication, Finance,<br />
HSE (Health, Safety and Environment,) Information Technology,<br />
Internal Control and Personnel issues. It also has a dedicated<br />
Health, Safety and Environmental Management System<br />
(“Green Book”), which gives guidance to Management about<br />
the Company’s intentions and expectations in HSE matters.<br />
While the Code provides the Company’s ethical framework,<br />
dedicated policies have been developed internally to provide<br />
specifi c guidelines applicable in the diff erent business areas.<br />
In the HSE fi eld, this is complemented by a management system<br />
modeled after the ISO 14001 standard.<br />
The Board ensures the quality of the fi nancial reports through a<br />
system of internal controls as outlined in the Boards report on<br />
internal control for <strong>2005</strong> on page 34–35 and maintains appropriate<br />
communication with the Company’s auditors through its audit<br />
committee, see page 27.<br />
The <strong>Lundin</strong> <strong>Petroleum</strong> Articles of Association, Code of Conduct<br />
and the Green Book are available at www. lundin-petroleum.com.<br />
The Corporate Governance <strong>Report</strong> has not been subject to an<br />
audit.
INTERNAL CONTROL REPORT<br />
THE BOARD OF DIRECTORS’ REPORT ON INTERNAL CONTROL<br />
OVER FINANCIAL REPORTING FOR THE FINANCIAL YEAR <strong>2005</strong><br />
According to the Swedish Company’s Act and the Swedish Code<br />
of Conduct the board is responsible for the internal control of the<br />
company. This report has been prepared in accordance with the<br />
requirements of the Swedish Code of Corporate Governance and<br />
is accordingly limited to internal control over fi nancial reporting.<br />
This report describes the fi nancial internal control function but<br />
does not comment on its eff ectiveness. This will be included in the<br />
report issued for the 2006 accounting year. This report is not part<br />
of the formal fi nancial statements and has not been subject to an<br />
audit.<br />
The internal control system for fi nancial reporting has been created<br />
to ensure that objectives such as eff ectiveness and effi ciency of<br />
the accounting processes and the reliability of fi nancial reporting<br />
as well as compliance with applicable laws and regulations are<br />
met. Such a system can only provide reasonable and not absolute<br />
assurance against material misstatement or loss, and is designed<br />
to manage rather than eliminate the risk of failure to achieve the<br />
fi nancial reporting objectives.<br />
<strong>Lundin</strong> <strong>Petroleum</strong>’s Financial <strong>Report</strong>ing Internal Control System<br />
consists of fi ve key components and is based upon “COSO”, which<br />
is the generally accepted framework for internal controls systems<br />
instigated by the Committee of Sponsoring Organisations of the<br />
Treadway Commission.<br />
Control environment<br />
The control environment establishes the overall tone for the<br />
organization and is the foundation for all of the other components<br />
of internal control. Sub-components of the control environment<br />
are:<br />
■ Integrity and ethical values<br />
■ Commitment to competence and development of people<br />
■ Management’s philosophy and operating style<br />
■ Organisational structure<br />
■ Assignment of authority and responsibility<br />
■ Human resources policies and procedures<br />
■ Participation by those charged with governance (i.e., board of<br />
directors, audit committee)<br />
The Board adopted the <strong>Lundin</strong> Code of Conduct in 2001 when<br />
the <strong>Lundin</strong> <strong>Petroleum</strong> Group was formed. Through this Code the<br />
Board has stated the Group’s vision and values and the standards<br />
of integrity, ethical value and competence at which the Group’s<br />
employees must operate.<br />
The inclusion of independent directors within the Board of<br />
Directors provides an objective view and monitoring of the<br />
Companies processes and application thereof.<br />
The responsibility for maintaining an eff ective control<br />
environment and for operating the system of internal control and<br />
risk management is delegated to the President and CEO and the<br />
management at varying levels. The managers are responsible for<br />
> 34 <<br />
internal control and risk management within their respective<br />
areas of responsibility.<br />
The Board has approved an anti-fraud policy outlining the<br />
employees’ responsibilities with regard to fraud prevention,<br />
what to do if fraud is suspected and what action will be taken by<br />
management in the case of suspected or actual fraud.<br />
Together with laws and external regulations, these internal<br />
guidelines form the control environment which is the foundation<br />
of the internal control and risk-management process.<br />
All employees are accountable for compliance with these<br />
guidelines, principles and values within their areas of control and<br />
risk management.<br />
Risk assessment<br />
<strong>Lundin</strong> <strong>Petroleum</strong> has reviewed and analysed the risks that exist<br />
within the fi nancial reporting process and has structured its<br />
internal control systems around the risks identifi ed.<br />
Some of the risks in the fi nancial reporting process that have been<br />
identifi ed, assessed and addressed are:<br />
■ control and valuation of inventory<br />
■ existence and valuation of assets and liabilities<br />
■ incurrence of expenditure<br />
■ completeness of accounting<br />
■ cash processing and cash balances<br />
■ changes to the accounting framework (i.e. from Swedish GAAP<br />
to IFRS)<br />
■ valuation and reporting of fi nancial instruments used to reduce<br />
the risk of currency, interest rate and oil price fl uctuations<br />
A principal consideration in the review of risks in the fi nancial<br />
reporting process is the possibility of fraud.<br />
Following the identifi cation and evaluation of a risk a control<br />
activity must be implemented to minimize the eff ect on the<br />
fi nancial reporting process.<br />
Control activities<br />
Control activities are the methods and activities for securing<br />
assets, controlling the accuracy and reliability of reports, fostering<br />
effi ciency and ensuring compliance with defi ned accounting<br />
principles and other directives given by the management.<br />
The control activities involve:<br />
■ approvals<br />
■ authorisations<br />
■ verifi cations<br />
■ reconciliations<br />
■ reviews of operating performance<br />
■ security of assets<br />
■ segregation of duties and reporting systems and processes.<br />
The degree of compliance with these control activities indicates<br />
the level of risk that exists within the fi nancial reporting process.
Information and communication<br />
The information and communication component includes<br />
the systems that support the identifi cation, capture, and<br />
exchange of information in a form and time frame that enable<br />
personnel to ascertain and carry out their responsibilities and<br />
for fi nancial reports to be generated accurately. Information<br />
and communication also spans all of the other components of<br />
internal control. Communicating relevant data throughout all<br />
levels of the company and to the appropriate external parties is<br />
an important part of internal control. Management has focused<br />
on understanding the systems and processes that are important<br />
in the accumulation of fi nancial data, including the system of<br />
controls that safeguard information, the processes for authorizing<br />
transactions, and the system for maintaining records.<br />
The control activities described under the previous paragraph are<br />
supported by:<br />
■ accounting systems<br />
■ fi nancial reporting manuals<br />
■ formalised processes (including hedging)<br />
■ management reports<br />
■ accounting policy updates<br />
■ staff meetings<br />
■ training<br />
The communication is continuous and the information is spread<br />
through the Group regularly.<br />
Monitoring<br />
An internal control system must be monitored to ensure that it is<br />
being correctly applied and that it remains relevant and eff ective.<br />
A regular review of the application of internal control activities<br />
must be carried out to ensure that the systems are being complied<br />
with. Regulatory or operational changes may make a control<br />
activity ineff ective or irrelevant and therefore a regular review of<br />
the internal control system must also be carried out.<br />
The Board of Directors<br />
The Board reviews and evaluates comprehensive fi nancial<br />
information regarding the Group as a whole and the entities<br />
it comprises. The Board also reviews, primarily through the<br />
Audit Committee, the most important accounting principles<br />
applied by the Group in fi nancial reporting, as well as changes<br />
to these principles. Minutes are taken at all meetings of the<br />
Audit Committee and are available to all Board members and the<br />
auditors.<br />
The working procedures determined by the Board include detailed<br />
instructions regarding the type of internal fi nancial reports that<br />
shall be submitted to the Board.<br />
The Board reviews and approves the interim reports for Quarter 2<br />
and Quarter 4 and the annual report. The Quarter 1 and Quarter 3<br />
reports are reviewed and approved by the Audit committee.<br />
> 35 <<br />
External auditing and monitoring<br />
<strong>Lundin</strong> <strong>Petroleum</strong>’s fi nancial statements are audited by their<br />
external auditors on an annual basis for inclusion within the<br />
annual report. A limited review is carried out on the half year<br />
report. The external auditors meet regularly with the management<br />
of the company and attend the Audit Committee meetings for the<br />
review and approval of the half and full year fi nancial statements.<br />
The external auditors meet the Board of the company without<br />
management present at least once a year.<br />
In addition to the interim and annual reports the following are<br />
issued to the public thereby enabling shareholders to monitor<br />
the activities of the company:<br />
■ Press releases on all important matters which could materially<br />
aff ect the share price<br />
■ Presentations and telephone conferences for analysts, investors<br />
and media representatives on the day of publication of the<br />
quarterly and full-year results, and in connection with release of<br />
important news<br />
Monitoring of the control activities<br />
Compliance with the control activities is monitored at all levels<br />
from departmental management up to the Board of Directors.<br />
<strong>Lundin</strong> <strong>Petroleum</strong> acknowledges that it is necessary to review<br />
the eff ectiveness of the control activities and the compliance<br />
therewith and as such believes that an internal audit function<br />
is necessary. During <strong>2005</strong>, as part of this internal audit function,<br />
<strong>Lundin</strong> <strong>Petroleum</strong> commenced an internal review of the<br />
accounting procedures in each of its offi ces to evaluate the<br />
extent to which the accounting policies of the group where being<br />
followed. Reviews were conducted in fi ve of <strong>Lundin</strong> <strong>Petroleum</strong>’s<br />
seven offi ces during <strong>2005</strong> and no material divergences from<br />
<strong>Lundin</strong> <strong>Petroleum</strong>’s procedures were reported. The remaining<br />
offi ces will be reviewed during 2006. On a go forward basis it<br />
is planned that a review of varying aspects of the accounting<br />
processes will be carried out in a selection of offi ces on an<br />
annual basis. <strong>Lundin</strong> <strong>Petroleum</strong> has utilised external consultants<br />
to conduct the reviews during <strong>2005</strong>. In 2006 <strong>Lundin</strong> <strong>Petroleum</strong><br />
intends to recruit an employee who will be given the responsibility<br />
to manage the internal audit function.<br />
Improving on a continuous basis<br />
The monitoring processes of the fi nancial reporting have created<br />
a continuous evaluation of the activities within the internal<br />
control and provide a basis for improvements. The evaluation<br />
work involves internal as well as external benchmarking.
KEY FINANCIAL DATA<br />
Data per share <strong>2005</strong> 2004 2003* 2002* 2001*<br />
Shareholders’ equity SEK per share 1 14.32 9.34 7.38 3.70 4.15<br />
Operating cash fl ow SEK per share 2 10.22 5.89 2.52 0.49 0.01<br />
Cash fl ow from operations SEK per share 3 9.89 4.59 0.98 1.09 0.14<br />
Earnings SEK per share 4 3.89 2.39 3.73 -0.07 -0.39<br />
Earnings SEK per share fully diluted 5 3.87 2.37 3.71 -0.07 -0.39<br />
Dividend per share<br />
Quoted price at the end of the fi nancial year<br />
– – – – –<br />
(regards the parent company), SEK 85.00 38.20 34.30 9.20 4.25<br />
Number of shares at year end 257,140,166 253,748,366 251,525,466 248,685,016 212,407,568<br />
Weighted average number of shares for the year 6 255,685,730 252,727,926 249,401,389 232,150,181 105,142,301<br />
Weighted average number of shares for the year<br />
(fully diluted) 6<br />
256,974,123 255,134,255 251,041,951 233,235,711 105,813,439<br />
1 The Group’s shareholders’ equity divided by the number of shares at year end.<br />
2 The Group’s operating income less production costs and less current taxes divided by the weighted average number of shares for the<br />
year.<br />
3 Cash fl ow from operations in accordance with the consolidated statement of cash fl ow divided by the weighted average number of<br />
shares for the year.<br />
4 The Group’s net result divided by the weighted average number of shares for the year.<br />
5 The Group’s net result divided by the weighted average number of shares for the year after considering the dilution eff ect of outstanding<br />
warrants.<br />
6 The number of shares at the beginning of the year with new issue of shares weighted for the proportion of the period they are in issue.<br />
Key data group <strong>2005</strong> 2004 2003* 2002* 2001*<br />
Return on equity, % 7 33 29 67 -2 -6<br />
Return on capital employed, % 8 49 32 50 -3 -6<br />
Debt/equity ratio, % 9 9 45 – 89 –<br />
Equity ratio, % 10 47 41 69 34 96<br />
Share of risk capital, % 11 70 60 78 44 96<br />
Interest coverage ratio, % 12 4,231 2,276 1,559 -342 –<br />
Operating cash fl ow/interest ratio 13 5,833 3,862 1,011 822 –<br />
Yield 14 – – – – –<br />
Key Financial Ratio Defi nitions<br />
7 The Group’s net result divided by the Group’s average total equity.<br />
8 The Group’s income before tax plus interest expenses plus/less exchange diff erences on fi nancial loans divided by the average capital<br />
employed (the average balance sheet total less non-interest bearing liabilities).<br />
9 The Group’s interest bearing liabilities in relation to shareholders’ equity.<br />
10 The Group’s total equity in relation to balance sheet total.<br />
11 The sum of the total equity and the deferred tax provision divided by the balance sheet total.<br />
12 The Group’s result after fi nancial items plus interest expenses plus/less exchange diff erences on fi nancial loans divided by interest<br />
expenses.<br />
13 The Group’s operating income less production costs and less current taxes divided by the interest charge for the year.<br />
14 Dividend in relation to quoted share price at the end of the fi nancial year.<br />
* The fi nancial statements for the years <strong>2005</strong> and 2004 have been prepared in accordance with International Financial <strong>Report</strong>ing Standards (IFRS) (see page 50).<br />
The fi nancial statements for the years 2001, 2002 and 2003 have been prepared under Swedish GAAP and are not in conformity with years <strong>2005</strong> and 2004.<br />
> 36
Group Structure as at 31 December <strong>2005</strong><br />
<strong>Lundin</strong> Nigeria Ltd<br />
(Ni)<br />
<strong>Lundin</strong> Gascogne SNC<br />
(F)<br />
(B)<br />
(F)<br />
(N)<br />
(Ni)<br />
(No)<br />
(S)<br />
Bermuda<br />
France<br />
Netherlands<br />
Nigeria<br />
Norway<br />
Sweden<br />
(Sw) Switzerland<br />
(UK) United Kingdom<br />
(V) Venezuela<br />
<strong>Lundin</strong> Norway AS<br />
(No)<br />
<strong>Lundin</strong><br />
Heather Ltd<br />
(UK)<br />
<strong>Lundin</strong> Britain Ltd<br />
(UK)<br />
Indonesia<br />
Branch<br />
<strong>Lundin</strong><br />
Thistle Ltd<br />
(UK)<br />
<strong>Lundin</strong> Munir BV<br />
(N)<br />
Ikdam<br />
Production SA<br />
(F)<br />
<strong>Lundin</strong> <strong>Petroleum</strong> AB<br />
(S)<br />
<strong>Lundin</strong> <strong>Petroleum</strong> BV<br />
(N)<br />
<strong>Lundin</strong> Holdings SA<br />
(F)<br />
<strong>Lundin</strong> International SA<br />
(F)<br />
<strong>Lundin</strong> Netherlands Holding BV<br />
(N)<br />
<strong>Lundin</strong> Albania BV <strong>Lundin</strong> Blora BV <strong>Lundin</strong> Lematang BV <strong>Lundin</strong> Banyumas BV<br />
(N) (N)<br />
(N) (N)<br />
Note: the Group structure shows signifi cant subsidiaries only<br />
FORMATION<br />
<strong>Lundin</strong> <strong>Petroleum</strong> AB was formed in connection with the SEK 4<br />
billion take-over of <strong>Lundin</strong> Oil AB by Talisman Energy Inc. during<br />
2001. As a result of the transaction <strong>Lundin</strong> Oil AB shareholders<br />
received SEK 36.50 in cash plus one share in <strong>Lundin</strong> <strong>Petroleum</strong> AB<br />
for each share held in <strong>Lundin</strong> Oil AB.<br />
On 6 September 2001 the shares of <strong>Lundin</strong> <strong>Petroleum</strong> AB started<br />
trading on the Nya Marknaden (New Market) administered<br />
by Stockholmbörsen. On 2 October 2003 the shares in <strong>Lundin</strong><br />
<strong>Petroleum</strong> AB were listed on the O-list of Stockholmbörsen. On<br />
1 July 2004 the shares in <strong>Lundin</strong> <strong>Petroleum</strong> AB were transferred to<br />
the Attract 40 list.<br />
On 19 September 2002 the Company completed the acquisition<br />
of 95.3% of the outstanding shares of <strong>Lundin</strong> International SA<br />
(formerly Coparex International SA) from BNP Paribas. On 13<br />
January 2003 the Company completed the acquisition of 75.8%<br />
of OER oil AS. OER oil AS subsequently acquired interests in two<br />
producing fi elds off shore Norway and a 100% interest in OER<br />
energy AS (formerly called Aker Energy AS). On 23 November<br />
2004, <strong>Lundin</strong> <strong>Petroleum</strong> divested its shareholding in OER oil AS to<br />
Endeavour International.<br />
On 13 February 2004, <strong>Lundin</strong> <strong>Petroleum</strong> completed the acquisition<br />
from DNO ASA of its UK and Irish oil and gas interests. On 17 June<br />
40%<br />
> 37 <<br />
DIRECTORS’ REPORT<br />
LUNDIN PETROLEUM AB (PUBL) REG NO. 556610-8055<br />
<strong>Lundin</strong> Oil Services SA<br />
(Sw)<br />
<strong>Lundin</strong><br />
Netherlands BV<br />
(N)<br />
Tunisia<br />
Branch<br />
<strong>Lundin</strong> Investments Ltd<br />
(B)<br />
<strong>Lundin</strong> Exploration BV<br />
<strong>Lundin</strong> Block 5B BV<br />
(N)<br />
(N)<br />
<strong>Lundin</strong> Services BV<br />
(N)<br />
6.1%<br />
93.9%<br />
<strong>Lundin</strong><br />
Indonesia BV<br />
(N)<br />
48.73%<br />
51.27%<br />
<strong>Lundin</strong><br />
Latina de<br />
Petroleos SA<br />
(V)<br />
2004, <strong>Lundin</strong> <strong>Petroleum</strong> completed the acquisition of certain<br />
Norwegian assets from DNO ASA.<br />
The address of <strong>Lundin</strong> <strong>Petroleum</strong> AB registered offi ce is<br />
Hovslagargatan 5, Stockholm, Sweden.<br />
OPERATIONS<br />
The main business of <strong>Lundin</strong> <strong>Petroleum</strong> is the exploration for, the<br />
development of and the production of oil and natural gas.<br />
In accordance with <strong>Lundin</strong> <strong>Petroleum</strong>’s stated objective of<br />
increasing reserves through a strategy of acquisitions and<br />
exploration, reserves were acquired during 2002 through<br />
the acquisition of <strong>Lundin</strong> International SA (formerly Coparex<br />
International SA). Further reserves were acquired during 2003<br />
in Norway through OER oil AS. During 2004, reserves were<br />
acquired through the purchase of all of the UK and Irish assets<br />
and substantially all of the Norwegian assets of DNO ASA. <strong>Lundin</strong><br />
<strong>Petroleum</strong> maintains a portfolio of oil and gas production assets<br />
and development projects in various countries with exposure to<br />
further exploration opportunities.<br />
The Group does not carry out any research and development and<br />
maintains branches in most of its areas of operation. The Parent<br />
Company has no foreign branches.
DIRECTORS’ REPORT<br />
PRODUCTION AND DEVELOPMENT<br />
United Kingdom<br />
The net production to <strong>Lundin</strong> <strong>Petroleum</strong> for the year ended 31<br />
December <strong>2005</strong> amounted to 20,165 bopd representing over 60<br />
percent of the total production for the Group. Production during<br />
the fourth quarter of <strong>2005</strong> was 18,685 bopd and was adversely<br />
aff ected by the Thistle shutdown and by the lack of water injection<br />
on the Heather and West Heather fi elds as a result of pump capacity<br />
issues. The Thistle fi eld resumed production in mid-December at<br />
production rates in excess of 5,000 bopd. Net production during<br />
the fourth quarter of <strong>2005</strong> for Broom amounted to 15,606 bopd,<br />
for Heather 2,349 bopd and for Thistle 730 bopd.<br />
During <strong>2005</strong> <strong>Lundin</strong> <strong>Petroleum</strong> entered into an alliance with<br />
Petrofac Facilities Management Limited (“Petrofac”) for the<br />
provision of production operations services on the Heather and<br />
Thistle platforms. The deal was completed successfully with the<br />
transfer of duty holder responsibility for the facilities to Petrofac<br />
on 1 May <strong>2005</strong>.<br />
The performance of the Broom fi eld (<strong>Lundin</strong> <strong>Petroleum</strong> Working<br />
Interest (WI) 55%) has exceeded expectations and resulted in a<br />
24% reserve increase at the year end of <strong>2005</strong>. Net production from<br />
the Broom fi eld averaged 14,100 bopd for the year. Phase 1 of the<br />
Broom development was successfully completed during <strong>2005</strong><br />
with the completion of the second water injection well. This was<br />
followed by the successful completion of Phase 2 of the Broom<br />
development which included the sidetrack of the original West<br />
Heather 2/05-18 well and the completion of the fi rst North Terrace<br />
well 2/05-23 which are now both producing via the Broom subsea<br />
manifold and tied back to the Heather platform.<br />
Production from the existing Broom production wells is declining<br />
in line with expectations as water production has begun. However<br />
it is likely that following the acquisition of 3D seismic over the<br />
Broom fi eld in 2006 a further infi ll drilling programme will be<br />
undertaken.<br />
Production from the Thistle fi eld (WI 99%) averaged 3,400 bopd<br />
during the year. The three month shutdown of Thistle in the second<br />
half of <strong>2005</strong> was successful in debottlenecking production and<br />
separation capacity. Further work is ongoing to increase the life of<br />
Thistle fi eld production particularly related to drilling operations<br />
and power generation.<br />
Production from the Heather fi eld (WI 100%) averaged 2,650 bopd<br />
during the year and was adversely impacted by the limitations on<br />
water injection capacity due to pump related issues. New pump<br />
capacity has been installed in the fi rst quarter of 2006 which has<br />
allowed water injection to recommence. A capital investment<br />
programme to reinstall the Heather platform drilling rig<br />
commenced in <strong>2005</strong> and will be completed in the fi rst half of 2006<br />
following which a drilling programme of new wells and workovers<br />
will commence.<br />
<strong>Lundin</strong> <strong>Petroleum</strong> has acquired new exploration licences in the<br />
United Kingdom 23rd Licensing Round where interests in three<br />
new blocks were awarded.<br />
> 38 <<br />
Norway<br />
The production from the Jotun fi eld (WI 7%) off shore Norway<br />
averaged 987 bopd for the year <strong>2005</strong>. In <strong>2005</strong> the Jotun fi eld<br />
partners sold their interests in the Jotun fl oating, production,<br />
storage and offl oading vessel (FPSO) to Bluewater/Exxon Mobil.<br />
Under a separate agreement the Jotun fi eld partners have leased<br />
back the vessel for up to fi fteen years.<br />
The development of the Alvheim fi eld (WI 15%) off shore Norway<br />
has progressed well during <strong>2005</strong>. The Alvheim FPSO conversion<br />
was completed in the fourth quarter of <strong>2005</strong> in Singapore and the<br />
vessel is currently en-route to Norway for topsides installation.<br />
Development drilling on Alvheim will commence in the fi rst half<br />
of 2006. It is still anticipated that fi rst production from Alvheim will<br />
take place in early 2007 at a forecast gross rate of 85,000 boepd.<br />
The proposed Alvheim drilling programme includes further<br />
exploration drilling on the existing fi elds and new prospects which<br />
has the potential to increase the current 180 million barrels of oil<br />
equivalent forecast for the fi eld.<br />
The Hamsun fi eld (renamed Volund) (WI 35%) to the south of<br />
Alvheim will submit a plan of development to the Norwegian<br />
government in 2006. Further studies in <strong>2005</strong> have resulted in<br />
reserve increases in the <strong>2005</strong> year end reserve study. Commercial<br />
discussions are ongoing regarding the development options with<br />
a tie back to the nearby Alvheim facilities being the most likely<br />
option.<br />
<strong>Lundin</strong> <strong>Petroleum</strong> has agreed, subject to Norwegian government<br />
approval, to reduce its interest in PL338 from 100% to 50%<br />
through agreements with Revus Energy and RWE. An exploration<br />
well will be drilled on PL338 in the second half of 2006 and <strong>Lundin</strong><br />
<strong>Petroleum</strong> will pay a lower percentage of costs related to the well<br />
than its 50% working interest.<br />
<strong>Lundin</strong> <strong>Petroleum</strong> continues to be actively involved in Norway<br />
in respect of new exploration activity. Two new licences were<br />
awarded in the fourth quarter of <strong>2005</strong> in the APA <strong>2005</strong> round and a<br />
further application is pending in the 19th Licensing Round. Three<br />
exploration wells will be drilled in 2006 for which rig slots are<br />
already secured.<br />
France<br />
In the Paris Basin the net production for <strong>2005</strong> was 2,845 bopd. The<br />
La Tonelle-1 exploration well is on a long term production test.<br />
Temporary production facilities have been constructed and the<br />
well is now producing at limited rates on a long term production<br />
test basis to determine the appraisal/development plan for the<br />
fi eld. During 2006 a four well infi ll drilling programme will be<br />
completed in the Villeperdue fi eld (WI 100%). In the Aquitaine<br />
Basin (WI 50%) the net production for <strong>2005</strong> was 1,357 bopd. In<br />
2006 full development of the Mimosa fi eld will be completed.
Indonesia<br />
Salawati Island and Basin (Papua)<br />
The net production from Salawati (Salawati Island WI 14.5% and<br />
Salawati Basin WI 25.9%) was 2,261 boepd in <strong>2005</strong>. First production<br />
from the TBA fi eld off shore Salawati Island is now expected in 2006<br />
following the conversion of a FPSO currently being completed in<br />
Singapore. The fi eld will add 1,000 boepd net to <strong>Lundin</strong> <strong>Petroleum</strong>.<br />
An ongoing programme of development and exploration drilling<br />
on Salawati Basin and Island has, despite some exploration success,<br />
yielded disappointing results in <strong>2005</strong>.<br />
Banyumas (Java)<br />
The Jati-1 exploration well (WI 25%) was spudded in <strong>2005</strong> and is<br />
testing a large exploration prospect in an under explored basin<br />
onshore Southern Java. The well has reached a total depth of<br />
4,023 meters. Due to drilling problems the well is currently being<br />
sidetracked and <strong>Lundin</strong> <strong>Petroleum</strong> decided to plug and abandon<br />
the well. <strong>Lundin</strong> <strong>Petroleum</strong>’s partner, Star Energy, has opted, under<br />
sole risk provisions, to continue drilling. In the event of a successful<br />
discovery <strong>Lundin</strong> <strong>Petroleum</strong> has the option to buy back into the<br />
well by paying a disproportionate level of the Star Energy costs.<br />
Blora (Java)<br />
An exploration well Tengis-1 (WI 43.3%) will be drilled in 2006<br />
following the resolution of certain land related issues necessary to<br />
commence the site preparation operations.<br />
Lematang (South Sumatra)<br />
A heads of agreement in relation to the sale of gas from the Singa<br />
gas fi eld (WI 15.88%) has been signed with state gas distribution<br />
company PT Persusahaan Gas Negara (PGN) to supply gas to<br />
PGN customers in West Java for 10 years starting in 2008. A<br />
development plan for the Singa project has been agreed and will<br />
be initiated once the gas sales arrangements have been fi nalised.<br />
The Netherlands<br />
Gas production from the Netherlands for <strong>2005</strong> was 2,344 boepd.<br />
The Luttelgeest-1 exploration well in the onshore Lemmer-<br />
Marknesse exploration licence (WI 10%) was tested with<br />
unsatisfactory results during the third quarter of <strong>2005</strong> and the well<br />
was plugged and abandoned.<br />
The exploration well drilled on Block F-12 (WI 10%) has been<br />
plugged and abandoned as a dry hole in January 2006.<br />
Tunisia<br />
The net oil production from the Isis fi eld (WI 40%) for <strong>2005</strong><br />
continues to decline as anticipated as the fi eld approaches the end<br />
of its economic life. The fi eld will stop production in the second<br />
quarter of 2006 when the Ikdam FPSO currently employed on the<br />
Isis fi eld is redeployed on the Oudna fi eld.<br />
The development drilling on the Oudna fi eld (WI 50%) off shore<br />
Tunisia commenced in early 2006. The Ikdam FPSO will undergo<br />
upgrade and re-classifi cation works in drydock and will then be<br />
redeployed on the Oudna fi eld where production is scheduled to<br />
> 39 <<br />
start in the fourth quarter of 2006. Initial net production from the<br />
Oudna fi eld is forecast at 10,000 bopd.<br />
Venezuela<br />
Production from the Colón Block (WI 12.5%) was 2,108 boepd<br />
during <strong>2005</strong>. Development drilling on the La Palma fi eld is<br />
ongoing. During <strong>2005</strong> one of the new development wells was<br />
deepened and tested oil from new reservoirs below the existing<br />
producing La Palma fi eld.<br />
In <strong>2005</strong> the Venezuelan government decided to restructure all<br />
operating services agreements in the country. <strong>Lundin</strong> <strong>Petroleum</strong><br />
and its partners have signed a Transitional Agreement with<br />
Venezuelan national oil company PDVSA Petròleo SA relating<br />
to entering into good faith negotiations for conversion of the<br />
Operating Services Agreement into a joint venture company.<br />
Whilst <strong>Lundin</strong> <strong>Petroleum</strong> and its partners have been assured by<br />
the Venezuelan Ministry of Energy and <strong>Petroleum</strong> that the new<br />
regime will preserve our asset value under the Operating Services<br />
Agreement the fi nal eff ect of this transition on <strong>Lundin</strong> <strong>Petroleum</strong>’s<br />
Venezuelan assets and values remains uncertain.<br />
Ireland<br />
<strong>Lundin</strong> <strong>Petroleum</strong> completed the sale of its 12.5% interest in the<br />
Seven Heads gas project plus certain other Irish licence interests<br />
to Island Oil & Gas plc during <strong>2005</strong>. The consideration for the sale<br />
was four million shares of Island Oil & Gas plc corresponding to a<br />
current market value in excess of GBP 3 million.<br />
During <strong>2005</strong> <strong>Lundin</strong> <strong>Petroleum</strong> acquired a new exploration licence<br />
in the Donegal Basin (WI 30% operator). A rig has been secured to<br />
drill a large gas prospect called Inishbeg in 2006.<br />
OPERATION - EXPLORATION<br />
Albania<br />
A 400 km 2 3D seismic acquisition programme on the Durresi<br />
Block (WI 50%) was completed in <strong>2005</strong>. Following the processing<br />
and interpretation of the acquired seismic exploration drilling is<br />
expected to commence in 2007.<br />
Nigeria<br />
In early <strong>2005</strong> <strong>Lundin</strong> <strong>Petroleum</strong> acquired a 22.5% net revenue<br />
interest in OML 113 off shore Nigeria containing the Aje oil and gas<br />
discovery. The Aje-3 appraisal well was drilled in the third quarter<br />
of <strong>2005</strong>. The two main reservoirs which tested hydrocarbons<br />
successfully in both Aje-1 and Aje-2 were found to be down dip<br />
from the discovery well as well as below the existing oil water<br />
contact defi ned on the Aje-2 well at the Cenomanian reservoir.<br />
The Turonian reservoir was above the gas water contact but<br />
the presence of gas in the reservoir was not tested due to poor<br />
reservoir properties at the Aje-3 well location. Technical and<br />
commercial studies are ongoing to determine whether a further<br />
Aje fi eld appraisal well will be drilled. A six month extension has<br />
been granted by the Aje fi eld operator Yinka Folawiyo <strong>Petroleum</strong><br />
(YFP) such that the decision to drill will be made in the fourth<br />
quarter of 2006.
DIRECTORS’ REPORT<br />
Sudan<br />
A comprehensive peace agreement was signed in Sudan in early<br />
<strong>2005</strong> between the government and the Sudan People’s Liberation<br />
Army (SPLA). A new government has been formed containing<br />
representatives of the major political factions. In addition a<br />
National <strong>Petroleum</strong> Commission has been formed comprising<br />
of the President of Sudan, representatives of the National<br />
government and the government of Southern Sudan and<br />
representatives of the local area where oil activity is taking place.<br />
The National <strong>Petroleum</strong> Commission will oversee petroleum<br />
activities in Sudan.<br />
Mobilisation of equipment for a 1,100 kilometre 2D seismic<br />
acquisition is currently underway. Exploration drilling will<br />
commence in 2006 with a three well initial drilling programme to<br />
test the large prospectivity of Block 5B.<br />
Future Outlook<br />
The Company is actively pursuing opportunities to further expand<br />
its oil and gas portfolio and increasing its reserves through<br />
acquisition of producing properties, exploration activity and<br />
exploitation of existing assets.<br />
ENVIRONMENT<br />
<strong>Lundin</strong> <strong>Petroleum</strong> and its international exploration and production<br />
affi liates conduct their international exploration and production<br />
operations, at a minimum, in accordance with all applicable<br />
environmental procedures and programmes. The Group has no<br />
operations in Sweden.<br />
THE GROUP<br />
Result and cash fl ow<br />
<strong>Lundin</strong> <strong>Petroleum</strong> reports a net result for the year ended 31<br />
December <strong>2005</strong> of MSEK 994.0 (MSEK 605.3) representing earnings<br />
per share on a fully diluted basis of SEK 3.87 (SEK 2.37) for the year<br />
ended 31 December <strong>2005</strong>. Operating cashfl ow for the year ended<br />
31 December <strong>2005</strong> amounted to MSEK 2,627.4 (MSEK 1,502.8).<br />
Operating cashfl ow per share on a fully diluted basis amounted<br />
to SEK 10.22 (SEK 5.89) for the year ended 31 December <strong>2005</strong>.<br />
Revenue<br />
Net sales of oil and gas for the year ended 31 December <strong>2005</strong><br />
amounted to MSEK 3,995.5 (MSEK 2,344.0). Production for<br />
the period amounted to 12,083,451 (9,755,455) barrels of oil<br />
equivalent (boe) representing 33,190 (28,921) boe per day<br />
(boepd). The average price achieved for a barrel of oil equivalent<br />
for the year ended 31 December <strong>2005</strong> amounted to USD 52.93<br />
(USD 37.67).<br />
The average Dated Brent price for the year ended 31 December<br />
<strong>2005</strong> amounted to USD 54.54 (USD 38.27) per barrel resulting in a<br />
charge to the income statement for the post-tax negative hedge<br />
settlement of MSEK 261.7 (MSEK 97.1).<br />
> 40 <<br />
Other operating income for the year ended 31 December <strong>2005</strong><br />
amounted to MSEK 194.7 (MSEK 124.3). This amount includes tariff<br />
income from the United Kingdom, France and the Netherlands<br />
and income for maintaining strategic inventory levels in France.<br />
Tariff income has increased from the comparative period of 2004<br />
primarily due to the increased production from the Broom fi eld in<br />
the United Kingdom.<br />
Sales for the year ended 31 December <strong>2005</strong> were comprised as<br />
follows:<br />
Sales<br />
Average price per barrel *<br />
expressed in USD<br />
United Kingdom<br />
- Quantity in boe<br />
- Average price per boe<br />
France<br />
- Quantity in boe<br />
- Average price per boe<br />
Norway<br />
- Quantity in boe<br />
- Average price per boe<br />
Netherlands<br />
- Quantity in boe<br />
- Average price per boe<br />
Indonesia<br />
- Quantity in boe<br />
- Average price per boe<br />
Tunisia<br />
- Quantity in boe<br />
- Average price per boe<br />
Ireland<br />
- Quantity in boe<br />
- Average price per boe<br />
Total<br />
- Quantity in boe<br />
- Average price per boe<br />
Group<br />
<strong>2005</strong><br />
7,240,996<br />
54.56<br />
1,563,840<br />
53.75<br />
372,356<br />
51.45<br />
855,397<br />
37.45<br />
495,852<br />
48.90<br />
328,627<br />
62.53<br />
24,107<br />
33.31<br />
10,881,175<br />
52.93<br />
Group<br />
2004<br />
3,674,000<br />
41.75<br />
1,563,576<br />
36.90<br />
870,746<br />
37.92<br />
948,548<br />
25.43<br />
579,522<br />
34.79<br />
677,923<br />
38.65<br />
121,371<br />
26.24<br />
8,435,686<br />
37.67<br />
* The average sales price per barrel is excluding the result on the hedge settlement.<br />
Income from Venezuela is derived by way of a service fee and<br />
interest income. For the year ended 31 December <strong>2005</strong>, the<br />
service fee earned by <strong>Lundin</strong> <strong>Petroleum</strong> amounted to USD 22.16<br />
(USD 18.67) per barrel for the 771,146 boe (837,648 boe) that were<br />
sold.
Production cost<br />
Production<br />
United Kingdom<br />
- Quantity in boe<br />
- Quantity in boepd<br />
France<br />
- Quantity in boe<br />
- Quantity in boepd<br />
Norway<br />
- Quantity in boe<br />
- Quantity in boepd<br />
Netherlands<br />
- Quantity in boe<br />
- Quantity in boepd<br />
Venezuela<br />
- Quantity in boe<br />
- Quantity in boepd<br />
Indonesia<br />
- Quantity in boe<br />
- Quantity in boepd<br />
Tunisia<br />
- Quantity in boe<br />
- Quantity in boepd<br />
Ireland<br />
- Quantity in boe<br />
- Quantity in boepd<br />
Total<br />
- Quantity in boe<br />
- Quantity in boepd<br />
Number of days production<br />
UK<br />
Ireland<br />
DNO’s Norwegian assets<br />
OER<br />
Group<br />
<strong>2005</strong><br />
7,360,726<br />
20,165<br />
1,533,674<br />
4,202<br />
360,175<br />
987<br />
855,397<br />
2,344<br />
769,364<br />
2,108<br />
825,099<br />
2,261<br />
354,794<br />
972<br />
24,222<br />
151<br />
12,083,451<br />
33,190<br />
365<br />
160<br />
365<br />
–<br />
Group<br />
2004<br />
3,973,761<br />
12,341<br />
1,561,409<br />
4,266<br />
898,519<br />
3,189<br />
948,548<br />
2,592<br />
827,492<br />
2,261<br />
840,167<br />
2,296<br />
574,042<br />
1,568<br />
131,517<br />
408<br />
9,755,455<br />
28,921<br />
322<br />
322<br />
197<br />
328<br />
The number of barrels produced diff ers from the number of barrels<br />
sold for a number of reasons. There are timing diff erences between<br />
sales and production in fi eld areas such as Tunisia and Norway<br />
where production is into a Floating Production Storage Offl oading<br />
vessel (FPSO). Sales are recorded when a lifting takes place and<br />
these can be at varying intervals and will not always be equal to<br />
the production at the end of a fi nancial quarter. The accounting<br />
eff ect of the timing diff erences between sales and production are<br />
refl ected in the movements in the hydrocarbons inventory and<br />
the under/overlift position. Over time, the total sales will equal the<br />
production. There are permanent diff erences between production<br />
and sales in some of the fi eld areas. The production reported for<br />
the UK is the platform production. This is the amount of crude oil<br />
that is produced from the fi eld into the pipeline system that takes<br />
the crude to the onshore terminal. Once the fi eld’s crude enters the<br />
pipeline system it is commingled with the crude oil produced from<br />
other fi elds in the pipeline system that produce the blend of crude<br />
> 41 <<br />
that is sold. The crude that is pumped into the pipeline system is<br />
tested against the blend of crude that arrives at the terminal and<br />
an adjustment is made to the number of barrels allocated to each<br />
fi eld to refl ect the relative quality of the crude oil input into the<br />
system. There is an approximate quality adjustment of minus<br />
fi ve percent applied to the UK crude oil produced. In Indonesia,<br />
production is allocated under a Production Sharing Contract (PSC)<br />
where, as part of the commercial terms of the agreement, a part of<br />
the working interest production is allocated to the host country as<br />
a type of royalty payment.<br />
Production costs for the year ended 31 December <strong>2005</strong> expressed<br />
in US dollars were comprised as follows:<br />
Production cost and depletion in<br />
TUSD<br />
Group<br />
<strong>2005</strong><br />
Group<br />
2004<br />
Cost of operations 148,570 124,006<br />
Tariff and transportation expenses 17,906 16,173<br />
Direct production taxes 4,803 3,821<br />
Changes in inventory/overlift 4,563 2,398<br />
Total production costs 175,842 146,398<br />
Depletion 101,064 51,946<br />
Total 276,906 198,344<br />
Production cost and depletion in<br />
USD per boe<br />
Group<br />
<strong>2005</strong><br />
Group<br />
2004<br />
Cost of operations 12.30 12.71<br />
Tariff and transportation expenses 1.48 1.66<br />
Direct production taxes 0.40 0.39<br />
Changes in inventory/overlift 0.38 0.25<br />
Total production costs 14.56 15.01<br />
Depletion 8.36 5.32<br />
Total cost per boe 22.92 20.33<br />
Production costs for the year ended 31 December <strong>2005</strong> amounted<br />
to MSEK 1,310.9 (MSEK 1,074.5). The reported cost of operations<br />
amounted to USD 12.30 per barrel (USD 12.71 per barrel) for the<br />
year ended 31 December <strong>2005</strong>.<br />
Depletion<br />
Depletion of oil and gas properties for the year ended 31 December<br />
<strong>2005</strong> amounted to MSEK 753.4 (MSEK 381.3). The depletion charge<br />
has increased from the comparative period following the inclusion<br />
of the UK assets acquired from DNO in 2004. The depletion cost<br />
per barrel has increased from 2004 following a revision of cost and<br />
reserve estimates used in the calculation of the depletion rate and<br />
because the UK was only included within the depletion charge for<br />
fi ve months in 2004, distorting the average depletion rate for the<br />
year.
DIRECTORS’ REPORT<br />
Write off<br />
Write off of oil and gas properties amounted to MSEK 208.1<br />
(MSEK 150.1) for the year ended 31 December <strong>2005</strong>. Whilst <strong>Lundin</strong><br />
<strong>Petroleum</strong> retains an interest in Block OML 113 in Nigeria and is<br />
reviewing the information that was obtained from drilling the<br />
Aje-3 well, it was decided to write off all of the costs amounting<br />
to MSEK 158.2 in <strong>2005</strong> following the disappointing well results as<br />
described within this report. The other material cost written off in<br />
<strong>2005</strong> relates to the Luttelgeest exploration well that was drilled<br />
in the Netherlands in 2004. After testing of the well in August<br />
<strong>2005</strong> the decision was made to plug and abandon the well and<br />
the costs incurred of MSEK 30.2 were written off . During 2004 the<br />
decision was made to write off the costs incurred in Iran as well as<br />
other exploration project costs resulting in a charge to the income<br />
statement for the year ended 31 December 2004 of MSEK 150.1.<br />
Sale of asset<br />
On 1 July <strong>2005</strong> <strong>Lundin</strong> <strong>Petroleum</strong> entered into a sale and leaseback<br />
agreement for the Jotun vessel utilised in the Jotun fi eld off shore<br />
Norway resulting in a pre-tax gain of MSEK 192.1 and a post<br />
tax gain of MSEK 24.0. The transaction has also resulted in a tax<br />
charge detailed below. On 23 November 2004, <strong>Lundin</strong> <strong>Petroleum</strong><br />
completed the sale of its investment in the Norwegian company<br />
OER for MSEK 189.9 recording an accounting profi t of MSEK 98.2 in<br />
the income statement for the year ended 31 December 2004.<br />
Other income<br />
Other income for the year ended 31 December <strong>2005</strong> amounted to<br />
MSEK 6.4 (MSEK 17.7) and represents fees and costs recovered by<br />
<strong>Lundin</strong> <strong>Petroleum</strong> from third parties.<br />
General, administrative and depreciation expenses<br />
General, administrative and depreciation expenses for the year<br />
ended 31 December <strong>2005</strong> amounted to MSEK 103.1 (MSEK 130.0).<br />
Included within the <strong>2005</strong> costs is an accounting charge of<br />
MSEK 19.0 for employee incentive warrants issued in 2004 and<br />
<strong>2005</strong> following the adoption of IFRS. The comparative period has<br />
been restated to include MSEK 10.7 in relation to the incentive<br />
warrants issued in 2004. Depreciation charges included in the<br />
general and administrative expenses amounted to MSEK 9.8<br />
(MSEK 5.5) for the year ended 31 December <strong>2005</strong>. The general and<br />
administration costs for the year of 2004 included an amount of<br />
MSEK 17.5 for OER. OER was sold in the fourth quarter of 2004.<br />
Financial income<br />
Financial income for the year ended 31 December <strong>2005</strong> amounted<br />
to MSEK 44.0 (MSEK 58.5). Interest income for the year ended 31<br />
December <strong>2005</strong> amounted to MSEK 31.2 (MSEK 11.5) and mainly<br />
comprises of interest received on bank accounts of MSEK 12.5<br />
(MSEK 5.5), interest received on a loan to an associated company<br />
for an amount of MSEK 3.8 (MSEK 2.6), interest received in relation<br />
to tax repayments for an amount of MSEK 9.4 (MSEK –) and the<br />
interest fee received from Venezuela for an amount of MSEK 5.4<br />
(MSEK 2.5). Dividend income received of MSEK 12.8 (MSEK 10.9)<br />
for the year ended 31 December <strong>2005</strong> relates to distributions<br />
received from an unconsolidated investment in a company<br />
owning an interest in the Dutch gas processing and transportation<br />
infrastructure (NOGAT).<br />
> 42 <<br />
Financial expense<br />
Financial expenses for the year ended 31 December <strong>2005</strong><br />
amounted to MSEK 196.5 (MSEK 60.0). Interest expense for the year<br />
ended 31 December <strong>2005</strong> amounted to MSEK 45.0 (MSEK 53.1) and<br />
mainly relates to the bank loan facility. The impact of the change<br />
in market value of the interest rate hedge for the year ended 31<br />
December <strong>2005</strong> amounted to a gain of MSEK 7.9 (MSEK 17.2).<br />
The amortisation of fi nancing fees amounted to MSEK 15.2<br />
(MSEK 7.2) for the year ended 31 December <strong>2005</strong>. The fi nancing<br />
fees are in relation to the bank loan facility and are amortised over<br />
the life of the bank loan facility. Net exchange losses for the year<br />
ended 31 December <strong>2005</strong> amounted to MSEK 104.6 (MSEK -36.1).<br />
The exchange losses for the year ended 31 December <strong>2005</strong> are<br />
mainly the result of the revaluation of the USD loan outstanding<br />
into the EUR and NOK reporting currency of the entities in which<br />
the funds were drawn. During the year ended 31 December<br />
<strong>2005</strong> the devaluation of the NOK and the EUR against the USD<br />
amounted to approximately 12% and 13% respectively.<br />
Tax<br />
The tax charge for the year ended 31 December <strong>2005</strong> amounted<br />
to MSEK 866.7 (MSEK 241.6). The current corporation tax charge<br />
of MSEK 240.7 (MSEK -46.1) comprises current corporation tax<br />
charges in, primarily the United Kingdom, the Netherlands,<br />
France, Indonesia and Venezuela. During <strong>2005</strong> the tax losses<br />
carried forward in the UK have been fully utilised resulting<br />
in a current corporation tax charge of MSEK 209.1 (MSEK –).<br />
Corporation tax in Venezuela has historically been charged at<br />
34% in accordance with the local tax legislation. During <strong>2005</strong>,<br />
the Venezuelan tax authorities stated that companies utilising<br />
Operating Service Agreements (OSA) should pay tax under the<br />
hydrocarbon exploitation tax regime and issued tax assessments<br />
to all 32 OSA’s operating in Venezuela for the period 2001 to 2004.<br />
The hydrocarbon exploitation regime carries a tax rate of 67% up<br />
to 2001 and 50% thereafter. Whilst <strong>Lundin</strong> <strong>Petroleum</strong> does not<br />
accept the retrospective change in tax regime, <strong>Lundin</strong> <strong>Petroleum</strong><br />
has decided to comply with the demands of the Venezuelan tax<br />
authorities. Accordingly <strong>Lundin</strong> <strong>Petroleum</strong> has accrued and paid<br />
the tax assessed for the period up to 2004 of MSEK 15.0 and has<br />
accrued corporation tax at the higher rate for <strong>2005</strong> resulting in an<br />
additional charge for the year of MSEK 12.3.<br />
The deferred corporate tax charge for the year ended 31 December<br />
<strong>2005</strong> of MSEK 647.1 (MSEK 295.6) comprises principally of a charge<br />
of MSEK 343.2 in the UK for the utilisation of tax losses acquired<br />
with the UK companies and capital allowances generated from the<br />
capitalised expenditure on the UK fi elds and a deferred tax charge<br />
in relation to the result on the sale and leaseback agreement for the<br />
Jotun vessel for an amount of MSEK 168.2. During 2004, a deferred<br />
tax asset was recorded for tax loss carry forwards in Tunisia to the<br />
extent that it was believed that they would be utilised. During the<br />
year ended 31 December <strong>2005</strong> the tax charge generated for Tunisia<br />
has exceeded the recorded tax asset necessitating the recording<br />
of a further deferred tax asset of MSEK 14.9 with a corresponding<br />
credit to the income statement to restore the deferred tax asset in<br />
relation to tax losses carry forward as at 31 December <strong>2005</strong>.
The petroleum tax charge for the year ended 31 December <strong>2005</strong><br />
amounts to MSEK 11.3 (MSEK -62.9). The deferred petroleum<br />
tax charge for the year ended 31 December <strong>2005</strong> amounts to<br />
MSEK -32.3 (MSEK 55.1).<br />
The Group operates in various countries and fi scal regimes where<br />
corporate income tax rates are diff erent from the regulations in<br />
Sweden. Corporate income tax rates for the Group vary between<br />
28% and 78%. Currently the majority of the Group’s profi t is<br />
derived from the United Kingdom where the eff ective tax rate<br />
amounts to 40%. The eff ective tax rate for the Group for the year<br />
ended 31 December <strong>2005</strong> amounts to approximately 47%. The<br />
eff ective tax rate for the year ended 31 December <strong>2005</strong> excluding<br />
the Jotun sale and leaseback transaction and the cost relating to<br />
the write off for Nigeria amounts to approximately 38%.<br />
Minority interest<br />
The net result attributable to minority interest for the year ended<br />
31 December <strong>2005</strong> amounted to MSEK 0.5 (MSEK 7.0) and relates<br />
to the 0.14% of <strong>Lundin</strong> International SA that is owned by minority<br />
shareholders. The comparative period included the 25% of OER<br />
that was not owned by the Group. The investment in OER was sold<br />
in November 2004.<br />
BALANCE SHEET<br />
Tangible fi xed assets<br />
Tangible fi xed assets as at 31 December <strong>2005</strong> amounted to<br />
MSEK 5,827.0 (MSEK 4,334.0) of which MSEK 5,732.9 (MSEK 4,296.0)<br />
relates to oil and gas properties and are detailed in Note 9 to the<br />
Financial Statements. Development and exploration expenditure<br />
incurred for the year ended 31 December <strong>2005</strong> can be summarised<br />
as follows:<br />
Group<br />
Group<br />
Development expenditure in MSEK <strong>2005</strong><br />
2004<br />
United Kingdom 619.8 702.3<br />
France 24.2 85.1<br />
Norway 596.2 81.2<br />
Netherlands 49.0 44.3<br />
Indonesia 59.8 22.9<br />
Tunisia 72.5 3.9<br />
Venezuela 35.5 12.7<br />
Ireland – 2.6<br />
Development expenditure 1,457.0 955.0<br />
> 43 <<br />
Exploration expenditure<br />
in MSEK<br />
Group<br />
<strong>2005</strong><br />
Group<br />
2004<br />
United Kingdom 17.2 2.0<br />
France 16.8 41.1<br />
Norway 69.6 30.6<br />
Netherlands 16.6 24.7<br />
Indonesia 61.2 63.6<br />
Tunisia 2.0 –<br />
Iran 6.0 51.9<br />
Albania 24.5 4.1<br />
Ireland 2.6 –<br />
Sudan 7.8 5.6<br />
Nigeria 158.2 –<br />
Other 12.8 9.2<br />
Exploration expenditure 395.3 232.8<br />
Other tangible fi xed assets as at 31 December <strong>2005</strong> amounted to<br />
MSEK 94.1 (MSEK 38.0).<br />
Financial fi xed assets<br />
Financial fi xed assets as at 31 December <strong>2005</strong> amounted to MSEK<br />
502.5 (MSEK 481.0). Restricted cash as at 31 December <strong>2005</strong><br />
amounted to MSEK 23.8 (MSEK 35.7) and represents the cash<br />
amount deposited to support a letter of credit issued in support<br />
of exploration work commitments in Sudan. Restricted cash at<br />
31 December 2004 included an additional amount of MSEK 15.9<br />
deposited for the Iranian work commitments which was refunded<br />
during <strong>2005</strong>. Shares and participations amount to MSEK 151.9<br />
(MSEK 21.2) as at 31 December <strong>2005</strong>. The increase during the<br />
period relates to the write up of book value of the investment in<br />
NOGAT to fair value in accordance with IFRS and to the shares in<br />
Island Oil and Gas plc that the Group received as consideration<br />
in relation to the sale of the interest in the Seven Heads gas<br />
fi eld off shore Ireland. Under IFRS an unconsolidated investment<br />
must be recorded at its estimated fair value with any increase<br />
in value being recorded against equity. During the period the<br />
investments in NOGAT and Island Oil and Gas plc were written up<br />
by MSEK 99.1. Deferred fi nancing fees relate to the costs incurred<br />
establishing the bank credit facility and are being amortised<br />
over the period of the loan. The deferred tax asset comprises<br />
tax losses carried forward in the Tunisia, France and Norway. The<br />
deferred tax asset as at 31 December 2004 included an amount<br />
of MSEK 240.7 for corporate tax loss carry forwards in the UK.<br />
This amount was utilised during the fi rst half of <strong>2005</strong>. Deferred<br />
taxes on tax losses are only recorded when there is a reasonable<br />
certainty of utilising them against future taxable income. Hedging<br />
instruments valued at fair value amounted to MSEK 1.8 (MSEK nil)<br />
and relate to the interest rate hedging contracts. Other fi nancial<br />
fi xed assets amount to MSEK 8.2 (MSEK 6.0) and are funds held by<br />
joint venture partners in anticipation of future expenditures.<br />
Current receivables and inventories<br />
Current receivables and inventories amounted to MSEK 1,043.5<br />
(MSEK 768.9) as at 31 December <strong>2005</strong>. Inventories include
DIRECTORS’ REPORT<br />
hydrocarbons and consumable well supplies. Trade receivables<br />
have increased from 31 December 2004 to 31 December <strong>2005</strong><br />
primarily due to the higher average sale prices achieved in the<br />
fourth quarter of <strong>2005</strong>. Taxes receivable as at 31 December <strong>2005</strong><br />
amounted to MSEK 117.3 (MSEK 117.6) and related to tax refunds<br />
due in Norway and the Netherlands. Joint venture debtors<br />
amounted to MSEK 181.0 (MSEK 74.1) refl ecting the development<br />
activities in progress in Norway, Tunisia and Indonesia.<br />
Cash and bank<br />
Cash and bank as at 31 December <strong>2005</strong> amounted to MSEK 389.4<br />
(MSEK 268.4).<br />
Non-current liabilities<br />
Provisions as at 31 December <strong>2005</strong> amounted to MSEK 2,087.3<br />
(MSEK 1,497.7). This amount includes a provision for site<br />
restoration of MSEK 329.2 (MSEK 296.0). The increase of this<br />
provision compared to 31 December 2004 is mainly caused by<br />
the devaluation of the SEK against the USD in addition to the<br />
unwinding of the provision during the year. The provision for<br />
deferred tax amounted to MSEK 1,735.1 (MSEK 1,166.1) and is<br />
mainly arising on the excess of book value over the tax value of oil<br />
and gas properties and the fair value of the hedging instruments.<br />
Long term interest bearing debt amounted to MSEK 736.2 (MSEK<br />
1,343.0) as at 31 December <strong>2005</strong>. On 16 August 2004, <strong>Lundin</strong><br />
<strong>Petroleum</strong> entered into a seven-year credit facility agreement to<br />
borrow up to MUSD 385.0 comprising MUSD 35.0 for Letters of<br />
Credit in support of future site restoration costs payable to former<br />
owners of the Heather fi eld, off shore UK, and cash drawings of<br />
MUSD 350.0. The amount of cash drawings outstanding under the<br />
facility at 31 December <strong>2005</strong> amounted to MUSD 92.5.<br />
Current liabilities<br />
Current liabilities as at 31 December <strong>2005</strong> amounted to MSEK<br />
1,256.3 (MSEK 641.4). Tax payables increased from 31 December<br />
2004 to 31 December <strong>2005</strong> primarily due to the fact that tax<br />
losses carry forward in the UK have been fully utilised resulting<br />
in a current corporation tax charge and corresponding liability.<br />
Following the adoption of IAS 39 as at 1 January <strong>2005</strong>, a liability<br />
has been recorded to recognise the market value of fi nancial<br />
instruments outstanding at the reporting date. As at 31 December<br />
<strong>2005</strong>, an amount of MSEK 193.8 (MSEK 10.6) has been accounted<br />
for and is primarily relating to the oil price hedging contracts.<br />
Joint venture creditors amounted to MSEK 389.9 (MSEK 203.8) and<br />
mainly relates to the development activities in progress in Norway,<br />
Tunisia and Indonesia.<br />
PARENT COMPANY<br />
The business of the Parent Company is investment in and<br />
management of oil and gas assets. The net result for the parent<br />
company amounted to a gain of MSEK 6.3 (MSEK -28.7) for the year<br />
ended 31 December <strong>2005</strong>.<br />
The result included administrative expenses of MSEK 52.1 (MSEK<br />
71.2) off set by net fi nancial income and expenses of MSEK 39.6<br />
(MSEK 30.8). Interest income derived from loans to subsidiary<br />
> 44 <<br />
companies amounted to MSEK 37.2 (MSEK 29.9). Currency<br />
exchange gains amounted to MSEK 2.4 (MSEK 0.5).<br />
No deferred tax asset has been recorded against the historic losses<br />
incurred by the Parent Company because of uncertainty as to the<br />
timing of their utilisation.<br />
DIVIDEND<br />
The Directors propose that no dividend be paid for the year. For<br />
details of the dividend policy refer to the share information page.<br />
TREATMENT OF RESULT<br />
The Board of Directors and the President propose that the net<br />
result of the Parent Company for the year of TSEK 6,265 will be<br />
added to the retained earnings.<br />
ANNUAL GENERAL MEETING<br />
The <strong>Annual</strong> General Meeting will be held in Stockholm on 17 May<br />
2006.<br />
FINANCIAL STATEMENTS<br />
The result of the Group and the Parent Company’s operations and<br />
their fi nancial position at the end of the fi nancial year are shown<br />
in the following income statements, balance sheets, statements of<br />
cash fl ow, statement of changes in equity and related notes.
INCOME STATEMENT<br />
CONSOLIDATED AND PARENT COMPANY INCOME STATEMENTS FOR THE FINANCIAL YEAR ENDED 31 DECE<strong>MB</strong>ER<br />
Parent<br />
Parent<br />
Group<br />
Group<br />
Company<br />
Company<br />
Expressed in TSEK<br />
Operating income<br />
Note<br />
<strong>2005</strong><br />
2004<br />
<strong>2005</strong><br />
2004<br />
Net sales of oil and gas 1 3,995,477 2,344,005 – –<br />
Other operating income 1 194,707 124,281 18,776 11,547<br />
Cost of sales<br />
4,190,184 2,468,286 18,776 11,547<br />
Production costs 2 -1,310,905 -1,074,491 – –<br />
Depletion of oil and gas properties 3 -753,428 -381,252 – –<br />
Write off of oil and gas properties 4 -208,135 -150,065 – –<br />
Gross profi t 1,917,716 862,478 18,776 11,547<br />
Sale of assets 192,122 98,192 – –<br />
Other income<br />
General, administration and<br />
6,438 17,710 – 213<br />
depreciation expenses 5 -103,118 -129,978 -52,141 -71,228<br />
Operating profi t 2,013,158 848,402 -33,365 -59,468<br />
Result from fi nancial investments<br />
Financial income 6 44,012 58,492 39,846 30,795<br />
Financial expenses 7 -196,461 -60,033 -216 –<br />
-152,449 -1,541 39,630 30,795<br />
Profi t before tax 1,860,709 846,861 6,265 -28,673<br />
Corporation tax 8 -887,784 -249,470 – –<br />
<strong>Petroleum</strong> tax 8 21,050 7,867 – –<br />
-866,734 -241,603 – –<br />
Net result 993,975 605,258 6,265 -28,673<br />
Net result attributable to :<br />
Shareholders of the parent company 993,507 598,245 6,265 -28,673<br />
Minority interest 468 7,013 – –<br />
Net result 993,975 605,258 6,265 -28,673<br />
Earnings per share – SEK 1 33 3.89 2.37 0.02 -0.11<br />
Diluted earnings per share – SEK 1 33 3.87 2.34 0.02 -0.11<br />
1 Based on net result attributable to shareholders of the parent company.<br />
> 45
BALANCE SHEET<br />
CONSOLIDATED AND PARENT COMPANY BALANCE SHEETS AT 31 DECE<strong>MB</strong>ER<br />
TSEK<br />
Note<br />
Group<br />
<strong>2005</strong><br />
> 46 <<br />
Group<br />
2004<br />
Parent<br />
Company<br />
<strong>2005</strong><br />
Parent<br />
Company<br />
2004<br />
ASSETS<br />
Tangible fi xed assets<br />
Oil and gas properties 9 5,732,871 4,296,024 – –<br />
Other tangible fi xed assets 10 94,136 38,001 – –<br />
Total tangible fi xed assets 5,827,007 4,334,025 – –<br />
Financial fi xed assets<br />
Shares in subsidiaries 11 – – 184,491 184,491<br />
Shares in associated companies 12 – – – –<br />
Other shares and participations 13 151,928 21,153 – –<br />
Long term receivables 14 – – 690,746 615,545<br />
Restricted cash 15 23,827 35,722 – –<br />
Deferred fi nancing fees 16 18,905 21,797 – –<br />
Deferred tax asset 17 297,788 396,347 – –<br />
Derivative instruments 18 1,825 – – –<br />
Other fi nancial fi xed assets 19 8,201 6,022 – –<br />
Total fi nancial fi xed assets 502,474 481,041 875,237 800,036<br />
Current assets<br />
Inventories 20 99,943 88,568 – –<br />
Trade receivables 523,315 366,105 – 2<br />
Prepaid expenses and accrued income 21 27,276 11,790 37 158<br />
Derivative instruments 18 13,430 – – –<br />
Current receivables 22 379,513 302,407 11,099 3,294<br />
Cash and bank 389,415 268,377 10,856 10,289<br />
Total current assets 1,432,892 1,037,247 21,992 13,743<br />
TOTAL ASSETS 7,762,373 5,852,313 897,229 813,779<br />
EQUITY AND LIABILITIES<br />
Equity<br />
Share capital * 2,571 2,537 2,571 2,537<br />
Additional paid in capital 1,121,029 1,055,213 – –<br />
Statutory reserve * – – 861,306 824,163<br />
Other reserves 212,376 -126,389 – –<br />
Retained earnings 1,350,133 837,676 23,118 10,712<br />
Net Profi t 993,507 598,245 6,265 -28,673<br />
Shareholders equity 3,679,616 2,367,282 893,260 808,739<br />
Minority interest 3,050 2,931 – –<br />
Total equity 3,682,666 2,370,213 893,260 808,739<br />
Non-current liabilities<br />
Site restoration 23 329,173 296,024 – –<br />
Pension 24 13,810 14,518 – –<br />
Deferred tax 8 1,735,058 1,166,132 – –<br />
Other provisions 25 9,209 19,628 – –<br />
Derivative instruments 18 – 1,390 – –<br />
Bank loans 26 736,151 1,343,021 – –<br />
Total non-current liabilities 2,823,401 2,840,713 – –<br />
Current liabilities<br />
Trade payables 135,394 72,701 988 643<br />
Liabilities to Group companies – – – 93<br />
Current tax liability 8 117,691 35,350 – –<br />
Derivative instruments 18 193,777 10,563 – –<br />
Accrued expenses and prepaid income 29 298,124 215,329 2,543 3,733<br />
Other current liabilities 30 511,320 307,444 438 571<br />
Total current liabilities 1,256,306 641,387 3,969 5,040<br />
TOTAL EQUITY AND LIABILITIES 7,762,373 5,852,313 897,229 813,779<br />
Pledged assets 31 1,128,763 1,124,388 1,128,763 1,124,388<br />
Contingent liabilities 32 – – – –<br />
* Share capital and statutory reserve are part of the Parent Company’s Restricted Equity. The remaining equity items of the Parent Company are unrestricted equity.
STATEMENT OF CASH FLOW<br />
CONSOLIDATED AND PARENT COMPANY STATEMENTS OF CASH FLOW FOR THE FINANCIAL YEAR ENDED 31 DECE<strong>MB</strong>ER<br />
Parent<br />
Parent<br />
Group<br />
Group<br />
Company<br />
Company<br />
TSEK<br />
Cash fl ow from operations<br />
Note<br />
<strong>2005</strong><br />
2004<br />
<strong>2005</strong><br />
2004<br />
Net result 993,975 605,258 6,265 -28,673<br />
Adjustments for<br />
Change in other provisions -1,286 -4,326 – –<br />
Write off of oil and gas properties 208,135 150,065 – –<br />
Depletion, depreciation and amortisation 763,209 381,252 – 33<br />
Amortisation of deferred fi nancing fees 3,737 7,224 – –<br />
Other non-cash items 34 656,679 381,971 18,981 10,712<br />
Unrealised exchange gains -2,200 2,037 -2,200 -1,389<br />
Gain on sale of assets/investments -192,122 -101,769 – –<br />
Changes in working capital<br />
Increase/decrease in current assets -92,639 -288,916 -7,683 663<br />
Decrease/increase in current liabilities 203,856 37,367 -1,381 -1,660<br />
Total cash fl ow from/used for operations 2,541,344 1,170,163 13,982 -20,314<br />
Cash fl ow used for investments<br />
Investment in subsidiary assets 35 -236 -1,220,191 – –<br />
Sale of assets/investments 192,122 182,091 – –<br />
Investment/divestment of real estate -40,190 44,640 – –<br />
Change in other fi nancial fi xed assets 16,850 2,092 -72,911 -99,492<br />
Other payments -13,419 -1,219 – –<br />
Investment in oil and gas properties -1,852,415 -1,628,813 – –<br />
Investment in offi ce equipment and other assets -16,137 -30,423 - 62<br />
Total cash fl ow used for investments -1,713,425 -2,651,823 -72,911 -99,430<br />
Cash fl ow from/used for fi nancing<br />
Changes in long-term bank loan -822,240 1,464,797 – –<br />
Paid fi nancing fees – -28,260 – –<br />
Proceeds from share issues 59,275 16,035 59,275 16,035<br />
Total cash fl ow from/used for fi nancing -762,965 1,452,572 59,275 16,035<br />
Change in cash and bank 64,954 -29,088 346 -103,709<br />
Cash and bank at the beginning of the period 268,377 301,589 10,289 112,609<br />
Currency exchange diff erence in cash and bank 56,084 -4,124 221 1,389<br />
Cash and bank at the end of the year 389,415 268,377 10,856 10,289<br />
The eff ects of acquisitions and divestments of subsidiary companies have been excluded from the changes in the balance sheet items.<br />
The eff ects of currency exchange diff erences due to the translation of foreign group companies have also been excluded as these eff ects<br />
do not aff ect the cash fl ow. Cash and bank comprise cash and short-term deposits maturing within less than three months.<br />
Interest income received amounted to TSEK 28,773 (TSEK 7,638) for the Group and TSEK 82 (TSEK 114) for the Parent Company. Paid<br />
interest expenses amounted to TSEK 64,875 (TSEK 40,673) for the Group and TSEK - (TSEK -) for the Parent Company. Taxes paid amounted<br />
to TSEK 160,023 (TSEK 2,793) for the Group and TSEK - (TSEK -) for the Parent Company.<br />
> 47
STATEMENT OF CHANGES IN EQUITY<br />
CONSOLIDATED AND PARENT COMPANY STATEMENTS OF CHANGES IN EQUITY<br />
Share<br />
Additional<br />
paid-in Other Retained<br />
Net Minority Total<br />
Total Equity comprises:<br />
capital capital reserves earnings result interest equity<br />
Balance at 1 January 2004 2,515 1,039,200 -55,088 -103,265 930,229 20,036 1,833,627<br />
Transfer of prior year net result – – – 930,229 -930,229 – –<br />
Currency translation diff erence – – -71,301 – – -136 -71,437<br />
Net result<br />
Total recognised income and expense for<br />
– – – – 598,245 7,013 605,258<br />
the period – – -71,301 – 598,245 6,877 533,821<br />
Issuance of shares 22 16,013 – – – – 16,035<br />
Share based payments – – – 10,712 – – 10,712<br />
Disinvestment – – – – – -23,982 -23,982<br />
Balance at 31 December 2004 2,537 1,055,213 -126,389 837,676 598,245 2,931 2,370,213<br />
Change in accounting policy – – -98,194 – – – -98,194<br />
Balance at 1 January <strong>2005</strong> 2,537 1,055,213 -224,583 837,676 598,245 2,931 2,272,019<br />
Transfer of prior year net result – – – 598,245 -598,245 – –<br />
Transfer of hedge reserve – – 98,194 -98,194 – – –<br />
Currency translation diff erence – – 301,587 – – 531 302,118<br />
Change in fair value<br />
Income and expenses recognised directly<br />
– – 37,178 – – – 37,178<br />
in equity – – 338,765 – – 531 339,296<br />
Net result<br />
Total recognised income and expense for<br />
– – – – 993,507 468 993,975<br />
the period – – 338,765 – 993,507 999 1,333,271<br />
Issuance of shares 34 59,241 – – – – 59,275<br />
Transfer of share based payments – 6,575 – -6,575 – – –<br />
Share based payments – – – 18,981 – – 18,981<br />
Investments – – – – – -880 -880<br />
Balance at 31 December <strong>2005</strong> 2,571 1,121,029 212,376 1,350,133 993,507 3,050 3,682,666<br />
> 48 <<br />
Group
Other reserves comprises: Group<br />
Available-forsale<br />
reserve<br />
> 49 <<br />
Hedge<br />
reserve<br />
Currency translation<br />
reserve<br />
Total other<br />
reserves<br />
Balance at 31 December 2004 – – -126,389 -126,389<br />
Change in accounting policy – -98,194 – -98,194<br />
Balance at 1 January <strong>2005</strong> – -98,194 -126,389 -224,583<br />
Change in fair value 99,109 -61,931 – 37,178<br />
Transfer to retained earning – 98,194 – 98,194<br />
Currency translation diff erence – – 301,587 301,587<br />
Balance at 31 December <strong>2005</strong> 99,109 -61,931 175,198 212,376<br />
Restricted Equity<br />
Parent Company<br />
Unrestricted equity Total equity<br />
Share Capital Statutory reserve* Retained earnings Net result<br />
Balance at 1 January 2004 2,515 958,297 – -150,147 810,665<br />
Transfer of prior year net result – -150,147 – 150,147 –<br />
New share issuance 22 16,013 – – 16,035<br />
Share based payments – – 10,712 – 10,712<br />
Net result – – – -28,673 -28,673<br />
Balance at 31 December 2004 2,537 824,163 10,712 -28,673 808,739<br />
Transfer of prior year net result – -28,673 – 28,673 –<br />
New share issuance ** 34 59,241 – – 59,275<br />
Transfer of share based payments – 6,575 -6,575 – –<br />
Share based payments – – 18,981 – 18,981<br />
Net result – – – 6,265 6,265<br />
Balance at 31 December <strong>2005</strong> *** 2,571 861,306 23,118 6,265 893,260<br />
* The share premium reserve as at 31 December 2004 has been reclassifi ed to statutory reserve in line with the Swedish Company Act.<br />
** Included in the amount of new shares issued at 31 December <strong>2005</strong> are 346,500 shares which had been issued but not registered.<br />
*** <strong>Lundin</strong> <strong>Petroleum</strong> AB’s share capital at 31 December <strong>2005</strong> amounts to SEK 2,571,402 represented by 257,140,166 shares with a quota value of SEK 0.01 each.
ACCOUNTING PRINCIPLES<br />
Introduction<br />
In June 2002 the European Union (EU) adopted International<br />
Financial <strong>Report</strong>ing Standards (IFRS) for all companies listed on<br />
a stock exchange within the European Union with eff ect from<br />
1 January <strong>2005</strong>, the adoption date. <strong>Lundin</strong> <strong>Petroleum</strong>’s <strong>Annual</strong><br />
<strong>Report</strong> for <strong>2005</strong> has been prepared in full compliance with IFRS,<br />
including one year of comparative fi gures in line with IFRS 1. As<br />
a result, <strong>Lundin</strong> <strong>Petroleum</strong>’s date of transition is 1 January 2004.<br />
The fi nancial statements of the group have been prepared in<br />
accordance with prevailing IFRS standards and International<br />
Financial <strong>Report</strong>ing Standards Committee (IFRIC) interpretations<br />
adopted by the EU Commission at the end of December <strong>2005</strong>. The<br />
consolidated fi nancial statements have been prepared under the<br />
historical cost convention, as modifi ed by the revaluation of held<br />
for sale fi nancial assets.<br />
The preparation of fi nancial statements in conformity with IFRS<br />
requires the use of certain critical accounting estimates and also<br />
requires management to exercise its judgement in the process<br />
of applying the Group’s accounting policies. The areas involving<br />
a higher degree of judgement or complexity, or areas where<br />
assumptions and estimates are signifi cant to the consolidated<br />
fi nancial statements, are disclosed under the headline “Critical<br />
accounting estimates and judgements”.<br />
The fi nancial statements of the Parent Company are prepared<br />
in accordance with accounting principles generally accepted<br />
in Sweden, applying RR 32 issued by the Swedish Financial<br />
Accounting Standards Council and the <strong>Annual</strong> Accounts Act. RR 32<br />
requires the Parent Company to use similar accounting principles<br />
as for the Group, i.e. IFRS to the extent allowed by RR 32. The<br />
Parent Company’s accounting principles deviate from the Group’s<br />
in respect of Pensions where FAR 4 is applied and valuation of<br />
shares in subsidiaries, which are valued at cost.<br />
IFRS Transition<br />
IFRS 1 provides fi rst time adopters of IFRS with exemptions from<br />
full retrospective application of the newly adopted standards.<br />
<strong>Lundin</strong> <strong>Petroleum</strong> has utilised the following exemptions:<br />
IFRS 2 – Shared based payments. This standard will not be applied<br />
to the Group’s incentive warrants programme granted before 7<br />
November 2002. The 2004 programme granted after 7 November<br />
2002 and not yet vested before 1 January <strong>2005</strong> will be recognised<br />
in line with this standard.<br />
IFRS 3 – Business Combinations. This standard has not been applied<br />
to business combinations prior to 31 March 2004.<br />
IFRS 5 – Non Current assets held-for-sale and discontinued operations.<br />
This standard has been adopted prospectively as from 1 January<br />
<strong>2005</strong> and therefore the comparative numbers have not been<br />
restated.<br />
IAS 21 – The eff ect of changes in foreign exchange rates. At the date<br />
of transition to IFRS the cumulative historic translation diff erences<br />
are deemed to be zero. The gain or loss on a subsequent disposal<br />
of any foreign operation will exclude translation diff erences<br />
> 50 <<br />
that arose before the date of transition to IFRS but will include<br />
translation diff erences arising after this date.<br />
IAS 39 – Financial Instruments, as adopted by the EU, has been<br />
applied as from 1 January <strong>2005</strong> and therefore the comparative<br />
numbers have not been restated.<br />
Changes in accounting principles on the adoption of IFRS<br />
IFRS 2 – Shared based payments<br />
Under Swedish GAAP <strong>Lundin</strong> <strong>Petroleum</strong> did not recognise<br />
employee incentive warrants issued as compensation cost<br />
when the exercise price was equal to or at a premium to the<br />
market price at the time of issue. IFRS 2 requires a charge to be<br />
recorded in the income statement to record the issue of employee<br />
incentive warrants as well as a liability in relation to the employee<br />
incentive warrants programme. As a result of the transition to IFRS,<br />
shareholders equity as at 31 December 2004 included a credit of<br />
MSEK 10.7. The result for the year 2004 included a charge of MSEK<br />
10.7 in the personnel costs.<br />
IFRS 3 – Business combinations<br />
This statement deals with the business combinations and the<br />
treatment of any excess purchase price over the allocated asset<br />
values. Under IFRS 3 the excess purchase price is recorded as<br />
goodwill whereas under Swedish GAAP the excess value was<br />
allocated to the acquired assets. There was no change required to<br />
the treatment of assets currently recorded by <strong>Lundin</strong> <strong>Petroleum</strong>.<br />
IAS 1 – Presentation of fi nancial statements<br />
In accordance with this standard some classifi cation and layout<br />
changes have been implemented in the annual report <strong>2005</strong>. Below<br />
the signifi cant ones are disclosed:<br />
Minority interests are included in shareholders’ equity as a separate<br />
component and are included in the net result for the year in the<br />
income statement. The shares in Associated companies has been<br />
removed from Other shares and participations and are shown on a<br />
separate line in the Balance Sheet.<br />
Changes in fair values and revaluation of assets have been<br />
specifi ed in the statement of changes in equity and in the notes.<br />
IAS 21 – The eff ect of changes in foreign exchange rates<br />
This statement deals with the eff ects of foreign exchange rates.<br />
The eff ects of recording a change in functional currency of<br />
certain subsidiaries within the <strong>Lundin</strong> <strong>Petroleum</strong> Group are in<br />
line with the requirements of this standard, related to the oil and<br />
gas assets recognised in these companies. The negative eff ect<br />
on shareholders’ equity net of deferred tax at 1 January 2004<br />
amounted to MSEK 11.5 and MSEK 4.6 at 31 December 2004. The<br />
positive eff ect net of deferred tax on the result for the year ended<br />
31 December 2004 amounted to MSEK 8.2.<br />
At the date of transition to IFRS the cumulative historic<br />
translation diff erences are deemed to be zero. The gain or loss<br />
on a subsequent disposal of any foreign operation will exclude<br />
translation diff erences that arose before the date of transition to<br />
IFRS but will include translation diff erences arising after this date.
IAS 36 – Impairment of assets<br />
Under GAAP used for the preparation of the 2004 fi nancial<br />
statements, <strong>Lundin</strong> <strong>Petroleum</strong> has based their impairment testing<br />
on a country by country cost pool basis under the full cost method<br />
of accounting.<br />
In accordance with IAS 36 impairment testing is carried out on<br />
a fi eld by fi eld basis. The recoverable amount is the higher of an<br />
assets’ fair value less costs to sell and value in use. Exploration costs<br />
can no longer be carried as capitalised costs within a cost pool<br />
unless the capitalised costs can be supported by future cash fl ows<br />
from that cost pool. If there is no decision to continue with a fi eld<br />
specifi c exploration programme then the costs will be expensed at<br />
the time the decision is made.<br />
<strong>Lundin</strong> <strong>Petroleum</strong> has incurred exploration costs in France and<br />
Indonesia which under the adoption of IFRS have been expensed<br />
in the fi nancial statements for 2004.<br />
The eff ect on shareholders’ equity amounted to MSEK -16.1 net<br />
of deferred tax at 1 January 2004 and the impact on the result for<br />
the year ended 31 December 2004 amounted to MSEK -19.4 net of<br />
deferred tax.<br />
IAS 32 and 39 – Derivative fi nancial instruments<br />
IAS 32 and 39 deal with the recognition, measurement, disclosure<br />
and presentation of fi nancial instruments. In accordance with<br />
IAS 39 all derivative instruments are initially recognised at fair<br />
value on the date a derivative contract is entered into and are remeasured<br />
at their fair value at each reporting date. The method<br />
of recognising the resulting gain or loss depends on whether or<br />
not the derivative is designated as a hedging instrument. The<br />
<strong>Lundin</strong> <strong>Petroleum</strong> Groups’ foreign exchange forward contracts are<br />
example of derivatives that do no qualify for hedge accounting.<br />
<strong>Lundin</strong> <strong>Petroleum</strong> had in place in 2004 and <strong>2005</strong> cash fl ow hedges<br />
by means of interest rate hedging contracts and oil price hedging<br />
contracts. Under Swedish GAAP, <strong>Lundin</strong> <strong>Petroleum</strong> had treated the<br />
hedging contracts as off -balance sheet instruments, whereas IFRS<br />
requires these contracts to be recorded in the fi nancial statements<br />
valuing these contracts at fair value. The impact on the opening<br />
balance of the hedging reserve within shareholders’ equity at 1<br />
January <strong>2005</strong> amounted to MSEK -98.2 net of deferred tax. The<br />
fi nancial fi xed assets increased with MSEK 64.5 mainly due to the<br />
related deferred tax assets, the current receivables increased with<br />
MSEK 1.9 relating to a short term hedge asset and the current<br />
liabilities increased with MSEK 162.3 in connection to short term<br />
hedge liabilities.<br />
IFRS 6 Exploration for and Evaluation of Mineral Resources<br />
This standard became eff ective at 1 January 2006. The group has<br />
elected to early adopt this Standard in <strong>2005</strong>, with no eff ect on<br />
the net result or shareholders’ equity. IFRS 6 permits an entity to<br />
develop an accounting policy for exploration and evaluation assets<br />
without specifi cally considering the requirements of paragraphs<br />
11 and 12 of IAS 8 Accounting Policies, Changes in Accounting<br />
Estimates and Errors. Thus, an entity adopting IFRS 6 may continue<br />
> 51 <<br />
to use the accounting policies applied immediately before<br />
adopting the IFRS. This includes continuing to use recognition and<br />
measurement practices that are part of those accounting policies.<br />
IFRS 6 also sets the disclosure demands on the assets, liabilities,<br />
income and expenses arising from the exploration and evaluation<br />
of mineral resources.<br />
Reconciliation from Swedish GAAP to IFRS<br />
Group<br />
Net result in TSEK<br />
2004<br />
Parent Company<br />
2004<br />
Net result under Swedish GAAP 620,154 -17,961<br />
Reclassifi cation of minority<br />
interest 7,013 –<br />
Share based payments<br />
Eff ects of changes in functional<br />
-10,712 -10,712<br />
currency 8,230 –<br />
Impairment of assets -22,359 –<br />
Taxes 2,932 –<br />
Net result under IFRS 605,258 -28,673<br />
Group equity in TSEK<br />
Total equity under<br />
Swedish GAAP<br />
1 Jan<br />
2004<br />
31 Dec<br />
2004<br />
1 Jan<br />
<strong>2005</strong><br />
1,841,195 2,407,375 2,407,375<br />
Reclassifi cation of<br />
minority interest<br />
20,036 2,931 2,931<br />
Change in functional<br />
currency<br />
-11,547 -4,610 -4,610<br />
Impairment of assets -16,057 -35,483 -35,483<br />
Adjustment for fi nancial<br />
instruments<br />
– – -98,194<br />
Total equity under IFRS 1,833,627 2,370,213 2,272,019<br />
Parent Company equity<br />
in TSEK<br />
Total equity under<br />
Swedish GAAP<br />
1 Jan<br />
2004<br />
31 Dec<br />
2004<br />
1 Jan<br />
<strong>2005</strong><br />
810,665 808,739 808,739<br />
Reclassifi cation of<br />
minority interest<br />
– – –<br />
Change in functional<br />
currency<br />
– – –<br />
Impairment of assets – – –<br />
Adjustment for fi nancial<br />
instruments<br />
– – –<br />
Total equity under IFRS 810,665 808,739 808,739
ACCOUNTING PRINCIPLES<br />
ACCOUNTING PRINCIPLES ADOPTED BY THE GROUP<br />
Principles of consolidation<br />
Subsidiaries<br />
Subsidiaries are all entities over which the Group has the sole right<br />
to exercise control over the operations and govern the fi nancial<br />
policies generally accompanying a shareholding of more than half<br />
of the voting rights. The existence and eff ect of potential voting<br />
rights that are currently exercisable or convertible are considered<br />
when assessing the Group’s control. Subsidiaries are fully<br />
consolidated from the date on which control is transferred to the<br />
Group and are de-consolidated from the date that control ceases.<br />
The consolidated fi nancial statements of the <strong>Lundin</strong> <strong>Petroleum</strong><br />
Group have been prepared using the purchase method of<br />
accounting. The cost of an acquisition is measured as the fair<br />
value of the assets given, equity instruments issued and liabilities<br />
incurred or assumed at the date of exchange, plus costs directly<br />
attributable to the acquisition. Identifi able assets acquired<br />
and liabilities and contingent liabilities assumed in a business<br />
combination are measured initially at their fair values at the<br />
acquisition date, irrespective of the extent of any minority interest.<br />
The excess of the cost of acquisition over the fair value of the<br />
Group’s share of the identifi able net assets acquired is recorded as<br />
goodwill. If the cost of acquisition is less than the fair value of the<br />
net assets of the subsidiary acquired, the diff erence is recognised<br />
directly in the income statement.<br />
The minority interest in a subsidiary represents the portion of the<br />
subsidiary not owned by the Company. The equity of the subsidiary<br />
relating to the minority shareholders is shown as a separate item<br />
within equity for the Group.<br />
All intercompany profi ts, transactions and balances are eliminated<br />
on consolidation. Unrealised losses are also eliminated unless<br />
the transaction provides evidence of an impairment of the asset<br />
transferred. Accounting policies of subsidiaries have been changed<br />
where necessary to ensure consistency with the policies adopted<br />
by the Group.<br />
Associated companies<br />
An investment in an associated company is an investment in an<br />
undertaking where the Group exercises signifi cant infl uence but<br />
not control, generally accompanying a shareholding of at least<br />
20% but not more than 50% of the voting rights. Such investments<br />
are accounted for in the consolidated fi nancial statements in<br />
accordance with the equity method. The diff erence between<br />
the acquisition cost of shares in an associated company and the<br />
net fair value of the assets, liabilities and contingent liabilities of<br />
the associated company recognised at the date of acquisition<br />
is recognised as goodwill. The goodwill is included within the<br />
carrying amount of the investment and is assessed for impairment<br />
as part of the investment. The Group’s share in the post-acquisition<br />
results of the associated company is recognised in the income<br />
statement and the Group’s share in post-acquisition movements<br />
in the equity of the associated company are recognised the<br />
> 52 <<br />
Group’s equity. When the Group’s accumulated share of losses<br />
in an associated company equals or exceeds its interest in the<br />
associated company, the Group does not recognise further losses,<br />
unless it has incurred obligations or made payments on behalf of<br />
the associate.<br />
Other shares and participations<br />
Investments where the shareholding is less than 20% of the voting<br />
rights are treated as fi nancial instruments.<br />
Jointly controlled entities<br />
Oil and gas operations are conducted by the Group as co-licensees<br />
in unincorporated joint ventures with other companies. The<br />
Group’s fi nancial statements refl ect the relevant proportions of<br />
production, capital costs, operating costs and current assets and<br />
liabilities of the joint venture applicable to the Group’s interests.<br />
Foreign currencies<br />
Items included in the fi nancial statements of each of the Group’s<br />
entities are measured using the currency of the primary economic<br />
environment in which the entity operates (‘functional currency’).<br />
The consolidated fi nancial statements are presented in SEK, which<br />
is the currency the Group has elected to use as the presentation<br />
currency.<br />
Functional currency<br />
Monetary assets and liabilities denominated in foreign currencies<br />
are translated at the rates of exchange prevailing at the balance<br />
sheet date and recognised in the income statement. Transactions<br />
in foreign currencies are translated at exchange rates prevailing<br />
at the transaction date. Exchange diff erences are included in the<br />
income statement.<br />
Presentation currency<br />
The balance sheets and income statements of foreign subsidiary<br />
companies are translated for consolidation using the current rate<br />
method. All assets and liabilities of the subsidiary companies are<br />
translated at the balance sheet date rates of exchange, whereas<br />
the income statements are translated at weighted average rates of<br />
exchange for the year. The translation diff erences which arise are<br />
taken directly to the foreign currency translation reserve within<br />
shareholders’ equity. On a disposal of a foreign operation the<br />
translation diff erences relating to that operation will be transferred<br />
from equity to the income statement and included in the result<br />
on sale. Translation diff erences on long term intercompany loans,<br />
used for fi nancing exploration activities, are taken directly to<br />
shareholders’ equity.<br />
For the preparation of the annual fi nancial statements, the<br />
following currency exchange rates have been used.<br />
Average Period end<br />
1 Euro equals SEK 9.2800 9.3885<br />
1 USD equals SEK 7.4550 7.9584
Classifi cation<br />
Fixed assets, long-term liabilities and provisions consist for the<br />
most part solely of amounts that are expected to be recovered<br />
or paid more than twelve months after the balance sheet date.<br />
Current assets and current liabilities consist solely of amounts that<br />
are expected to be recovered or paid within twelve months after<br />
the balance sheet date.<br />
General<br />
Assets and liabilities are included at their acquisition cost and<br />
nominal amounts respectively unless stated otherwise. Trade<br />
receivables are recognised initially at fair value and subsequently<br />
measured at amortised cost less provision for impairment.<br />
Oil and gas properties<br />
Oil and gas operations are recorded at historic cost less depletion.<br />
All costs for acquiring concessions, licences or interests in<br />
production sharing contracts and for the survey, drilling and<br />
development of such interests are capitalised on a fi eld area cost<br />
centre basis.<br />
Net capitalised costs to reporting date, together with anticipated<br />
future capital costs for the development of the proved and<br />
probable reserves determined at the balance sheet date price<br />
levels, are depleted based on the year’s production in relation<br />
to estimated total proved and probable reserves of oil and gas<br />
in accordance with the unit of production method. Depletion of<br />
a fi eld area is charged to the income statement once production<br />
commences.<br />
Proved reserves are those quantities of petroleum which, by<br />
analysis of geological and engineering data, can be estimated with<br />
reasonable certainty to be commercially recoverable, from a given<br />
date forward, from known reservoirs and under current economic<br />
conditions, operating methods and governmental regulations.<br />
Proved reserves can be categorised as developed or undeveloped.<br />
If deterministic methods are used, the term reasonable certainty is<br />
intended to express a high degree of confi dence that the quantities<br />
will be recovered. If probabilistic methods are used, there should<br />
be at least a 90% probability that the quantities actually recovered<br />
will equal or exceed the estimates.<br />
Probable reserves are those unproved reserves which analysis of<br />
geological and engineering data suggests are more likely than not<br />
to be recoverable. In this context, when probabilistic methods are<br />
used, there should be at least a 50% probability that the quantities<br />
actually recovered will equal or exceed the sum of estimated<br />
proved plus probable reserves.<br />
Proceeds from the sale or farm-out of oil and gas concessions are<br />
off set against the related capitalised costs of each cost centre in<br />
the exploration stage with any excess of net proceeds over all<br />
costs capitalised included in the income statement. A gain or loss<br />
is recognised on the sale or farm-out of producing areas when the<br />
depletion rate is changed by more than 20 percent.<br />
> 53 <<br />
Impairment tests are carried out at least annually to determine<br />
that the net book value of capitalised cost within each fi eld area<br />
cost centre less any provision for site restoration costs, royalties<br />
and deferred production or revenue related taxes is covered<br />
by the anticipated future net revenue from oil and gas reserves<br />
attributable to the Group’s interest in the related fi eld areas.<br />
Capitalised costs can not be carried within a fi eld cost pool unless<br />
those costs can be supported by future cash fl ows from that<br />
fi eld. Provision is made for any impairment, where the net book<br />
value, according to the above, exceeds the estimated future<br />
discounted net cash fl ows using prices and cost levels used by<br />
Group management in their internal forecasting or fair value less<br />
costs to sell. If there is no decision to continue with a fi eld specifi c<br />
exploration programme, the costs will be expensed at the time the<br />
decision is made.<br />
Other tangible fi xed assets<br />
Other tangible fi xed assets are stated at cost less accumulated<br />
depreciation. Depreciation is based on cost and is calculated on a<br />
straight line basis over the estimated useful life.<br />
The carrying amount is written down immediately to its<br />
recoverable amount when the carrying amount is higher. The<br />
recoverable amount is the higher of an asset’s fair value less cost to<br />
sell and value in use.<br />
Non-current assets held for sale<br />
To classify as non-current asset held-for-sale the carrying amount<br />
needs to be assumed to be recovered through a sale transaction<br />
rather than through continuing use. It also must be available for<br />
immediate sale in its present condition and sale must be highly<br />
probable. If classifi ed as non-current held-for-sale the assets will<br />
be valued at the lower of its carrying value and fair value less<br />
estimated cost of sale.<br />
Financial instruments<br />
<strong>Lundin</strong> <strong>Petroleum</strong> recognises the following fi nancial instruments:<br />
■ Loans and receivables are valued at the amounts they are<br />
expected to realise. Translation diff erences are reported in the<br />
income statement except for the translation diff erences on long<br />
term intercompany loans, used for fi nancing exploration<br />
activities, which are taken directly in shareholders’ equity.<br />
■ Other shares and participations (available for sale fi nancial<br />
assets) are valued at fair value and any change in fair value is<br />
recorded directly in shareholders’ equity until realised. Where<br />
the other shares and participations do not have a quoted<br />
market price in an active market and whose fair value cannot be<br />
measured reliably, they are accounted for at cost less impairment<br />
if applicable.<br />
■ Derivative instruments. Derivatives are initially recognised at<br />
fair value on the date a derivative contract is entered into and<br />
are subsequently remeasured at their fair value. The method<br />
of recognising the resulting gain or loss depends on whether<br />
the derivative is designated as a hedging instrument.
ACCOUNTING PRINCIPLES<br />
The Group categorises derivatives as follows:<br />
1. Fair value hedge<br />
Changes in the fair value of derivatives that qualify as fair value<br />
hedging instruments are recorded in the income statement,<br />
together with any changes in the fair value of the hedged asset<br />
or liability.<br />
2. Cash fl ow hedge<br />
The eff ective portion of changes in the fair value of derivatives<br />
that qualify as cash fl ow hedges are recognised in shareholders´<br />
equity. The gain or loss relating to the ineff ective portion is<br />
recognised immediately in the income statement. Amounts<br />
accumulated in shareholders´ equity are transferred to the<br />
income statement in the period when the hedged item will<br />
aff ect the income statement. When a hedging instrument no<br />
longer meets the requirements for hedge accounting, expires or<br />
is sold, any accumulated gain or loss recognised in shareholders´<br />
equity is transferred to the income statement when the forecast<br />
transaction is ultimately recognised in the income statement.<br />
When a forecast transaction is no longer expected to occur,<br />
the accumulated gain or loss reported in equity is immediately<br />
transferred to the income statement.<br />
3. Net investment hedge<br />
Hedges of net investments in foreign operations are accounted<br />
for in a similar manner as cash fl ow hedges. The gain or loss<br />
accumulated in equity is transferred to the income statement at<br />
the time the foreign operation is disposed of.<br />
4. Derivatives that do no qualify for hedge accounting<br />
When derivatives do not qualify for hedge accounting,<br />
changes in fair value are recognised immediately in the income<br />
statement.<br />
Restricted cash<br />
Restricted cash represents cash amounts that have a conditional<br />
restriction on their withdrawal and are shown as a fi nancial fi xed<br />
asset in the balance sheet.<br />
Inventories<br />
Inventories of consumable well supplies are stated at the lower<br />
of cost and net realisable value, cost being determined on a fi rst<br />
in fi rst out (FIFO) basis. Inventories of hydrocarbons are stated at<br />
the lower of cost and net realisable value. Under- or overlifted<br />
positions of hydrocarbons are valued at market prices prevailing<br />
at the balance sheet date. An underlift of production from a fi eld<br />
is included in the current receivables and valued at the reporting<br />
date spot price or prevailing contract price and an overlift of<br />
production from a fi eld is included in the current liabilities and<br />
valued at the reporting date spot price or prevailing contract<br />
price.<br />
Cash and Bank<br />
Cash and bank includes cash at bank, cash in hand and highly<br />
liquid interest bearing securities with original maturities of three<br />
months or less.<br />
Equity<br />
Share capital consists of the registered share capital for the<br />
parent company. Share issue costs associated with the issuance of<br />
new equity are treated as a direct reduction of proceeds. Excess<br />
> 54 <<br />
contribution in relation to the issuance of shares is accounted for<br />
in the item Additional paid-in-capital.<br />
The change in fair value of shares and participations is accounted<br />
for in the fair value reserve. Upon the crystallisation of a change in<br />
value, the change in fair value recorded will be transferred to the<br />
income statement. The change in fair value of hedging instruments<br />
is accounted for in the hedge reserve. Upon settlement of the<br />
hedge instrument, the change in fair value is transferred to the<br />
income statement. The currency translation reserve contains<br />
unrealised translation diff erences due to the conversion of the<br />
functional currencies into the reporting currency.<br />
Retained earnings contain the accumulated results attributable to<br />
the shareholders of the parent company.<br />
Provisions<br />
A provision is reported when the company has a formal or informal<br />
obligation as a consequence of an event and when it is more likely<br />
than not that an outfl ow of resources is required to settle the<br />
obligation and a reliable estimate can be made of the amount.<br />
On fi elds where the Group is required to contribute to site<br />
restoration costs, a provision is created to recognise the future<br />
liability. At the date of acquisition of the fi eld or at fi rst production,<br />
an asset, as part of oil and gas properties, is created to represent<br />
the discounted value of the anticipated site restoration liability<br />
and depleted over the life of the fi eld on a unit of production<br />
basis. The corresponding accounting entry to the creation of the<br />
asset recognises the discounted value of the future liability. The<br />
discount applied to the anticipated site restoration liability is<br />
subsequently released over the life of the fi eld and is charged to<br />
fi nancial expenses. Changes in site restoration costs and reserves<br />
are treated prospectively.<br />
Revenue<br />
Revenues from the sale of oil and gas are recognised in the income<br />
statement net of royalties taken in kind. Sales of oil and gas are<br />
recognised upon delivery of products and customer acceptance<br />
or on performance of services. Incidental revenues from the<br />
production of oil and gas are off set against capitalised costs of the<br />
related cost centre until quantities of proven and probable reserves<br />
are determined and commercial production has commenced.<br />
Service income, generated by providing technical and<br />
management services to joint ventures, is recognised as other<br />
income.<br />
The fi scal regime in the area of operations defi nes whether<br />
royalties are payable in cash or in kind. Royalties payable in cash<br />
are accrued in the accounting period in which the liability arises.<br />
Royalties taken in kind are subtracted from production for the<br />
period to which they relate.<br />
Borrowing costs<br />
Borrowing costs directly attributable to the acquisition,<br />
construction or production of qualifying assets are added to the<br />
cost of those assets. Qualifying assets are assets that necessarily
take a substantial period of time to get ready for their intended use<br />
or sale. Investment income earned on the temporary investment<br />
of specifi c borrowings pending to be used for the qualifying asset<br />
is deducted from the borrowing costs eligible for capitalisation.<br />
This applies on the interest on borrowings to fi nance fi elds under<br />
development which is capitalised within oil and gas properties<br />
until production commences. All other borrowing costs are<br />
recognised in profi t or loss in the period in which they occur.<br />
Interest on borrowings to fi nance the acquisition of producing oil<br />
and gas properties is charged to income as incurred.<br />
Leases<br />
For a lease to qualify as a fi nance lease, substantially all of the risks<br />
and benefi ts of ownership must pass to the lessee. In all other<br />
cases the lease will be classifi ed as an operating lease. Payments<br />
made under operating leases (net of any incentives received from<br />
the lessor) are charged to the income statement on a straight-line<br />
basis over the period of the lease.<br />
Employment benefi ts<br />
Short term employee benefi ts<br />
Short-term employment benefi ts such as salaries, social premiums<br />
and holiday pay, are expensed when incurred.<br />
Pension obligations<br />
Pensions are the most common long-term employee benefi t.<br />
The pension schemes are funded through payments to insurance<br />
companies. The Group’s pension obligations consist mainly of<br />
defi ned contribution plans. A defi ned contribution plan is a<br />
pension plan under which the Group pays fi xed contributions. The<br />
Group has no further payment obligations once the contributions<br />
have been paid. The contributions are recognised as an expense<br />
when they are due.<br />
The Group has one obligation under a defi ned benefi t plan. The<br />
relating liability recognised in the balance sheet is valued at the<br />
discounted estimated future cash outfl ows as calculated by an<br />
external actuarial expert. Actuarial gains and losses are charged to<br />
the income statement. The Group does not have any designated<br />
plan assets.<br />
Share-based payments<br />
<strong>Lundin</strong> <strong>Petroleum</strong> recognises cash-settled share-based payments<br />
in the income statement as expenses and as a liability in relation<br />
to the incentive warrants programme. The liability in relation to<br />
incentive warrants programmes is valued at fair value at grant date<br />
of the options using the Black & Scholes option pricing method.<br />
The fair value of the incentive warrant programme is charged<br />
to personnel costs over the vesting period. The fair value of the<br />
liability under the incentive warrant programme is remeasured at<br />
each reporting date recognising changes that aff ect the number<br />
of options expected to vest. At vesting date the liability is adjusted<br />
for the fi nal number of options vested.<br />
Income taxes<br />
The main components of tax are current and deferred. Current tax<br />
is tax that is to be paid or received for the year in question and<br />
> 55 <<br />
also includes adjustments of current tax attributable to previous<br />
periods.<br />
Deferred income tax is provided in full, using the liability method,<br />
on temporary diff erences arising between the tax bases of assets<br />
and liabilities and their carrying amounts in the consolidated<br />
fi nancial statements. However, the deferred income tax is not<br />
accounted for if it arises from initial recognition of an asset or<br />
liability in a transaction other than a business combination that at<br />
the time of the transaction aff ects neither accounting nor taxable<br />
profi t or loss. Deferred income tax is determined using tax rates<br />
(and laws) that have been enacted or substantially enacted by<br />
the balance sheet and are expected to apply when the related<br />
deferred income tax asset is realised or the deferred income tax<br />
liability is settled.<br />
Deferred income tax assets are recognised to the extent that it is<br />
probable that future taxable profi t will be available against which<br />
the temporary diff erences can be utilised.<br />
<strong>Lundin</strong> <strong>Petroleum</strong> divides the tax accounts between corporation<br />
tax and petroleum tax. <strong>Petroleum</strong> Revenue Tax (PRT) is classifi ed<br />
as <strong>Petroleum</strong> tax and charged as a tax expense on taxable fi eld<br />
profi ts included in the income statement.<br />
Segment reporting<br />
The primary basis the Group uses for segmental reporting is at a<br />
country level due to the unique nature of each countries operations,<br />
commercial terms or fi scal environment. The secondary basis the<br />
Group uses for segmental reporting is oil and gas operations for<br />
which reference is made to the fi nancial statements as a whole.<br />
Related party transactions<br />
<strong>Lundin</strong> <strong>Petroleum</strong> recognises the following related parties:<br />
associated companies, jointly controlled entities, members or the<br />
family of the key management personnel or other parties that are<br />
partly, direct or indirect, controlled by key management personnel<br />
or of its family.<br />
Critical accounting estimates and judgements<br />
The management of <strong>Lundin</strong> <strong>Petroleum</strong> has to make estimates<br />
and judgements when preparing the Financial Statements of the<br />
Group. Uncertainties in the estimates and judgements could have<br />
an impact on the carrying amount of assets and liabilities and the<br />
Group’s result. The most important estimates and judgements in<br />
relation thereto are:<br />
Estimates in oil and gas reserves<br />
The business of the Group is the exploration for, development<br />
of and production of oil and gas reserves. Estimates of oil and<br />
gas reserves are used in the calculations for impairment tests<br />
and accounting for depletion and site restoration. Changes in<br />
estimates in oil and gas reserves, resulting in diff erent future<br />
production profi les, will aff ect the discounted cash fl ows used in<br />
impairment testing, the anticipated date of site decommissioning<br />
and restoration and the depletion charges in accordance with the<br />
unit of production method.
ACCOUNTING PRINCIPLES<br />
Site restoration provision<br />
Amounts used in recording a provision for site restoration are<br />
estimates based on current legal and constructive requirements<br />
and current technology and price levels for the removal of facilities<br />
and plugging and abandoning of wells. Due to changes in relation<br />
to these items, the future actual cash outfl ows in relation to the site<br />
decommissioning and restoration can be diff erent. To refl ect the<br />
eff ects due to changes in legislation, requirements and technology<br />
and price levels, the carrying amounts of site restoration provisions<br />
are reviewed on a regular basis.<br />
The eff ects of changes in estimates do not give rise to prior year<br />
adjustments and are dealt with prospectively over the estimated<br />
remaining commercial reserves of each fi eld. While the Group uses<br />
its best estimates and judgment, actual results could diff er from<br />
these estimates.<br />
Events after the balance sheet date<br />
All events up to the date when the fi nancial statements were<br />
authorised for issue and which have a material eff ect in the<br />
fi nancial statements have been disclosed.<br />
Coming IFRS accounting principles<br />
The following new standards, amendments and interpretations<br />
to existing standards have been approved by the EU and are<br />
mandatory for the Group’s accounting periods beginning on or<br />
after 1 January 2006.<br />
■ IAS 1 Presentation of Financial Statements – Capital Disclosures,<br />
eff ective from 1 January 2007. The IAS 1 amendment on capital<br />
requires that the following is disclosed: the entity’s objectives,<br />
policies and processes for managing capital; quantitative data<br />
about what the entity regards as capital; whether the entity<br />
has complied with any capital requirements; and if it has not<br />
complied, the consequences of such non-compliance. The<br />
group will apply the amendment on Capital Disclosure on<br />
annual periods beginning 1 January 2007.<br />
> 56 <<br />
■ IAS 19 Employee Benefi ts - actuarial gains and losses,<br />
amendment, eff ective from 1 January 2006. This standard<br />
introduces the option of an alternative recognition approach for<br />
actuarial gains and losses and adds new disclosure requirements.<br />
The group does not intend to change the accounting policy<br />
adopted for recognition of actuarial gains and losses and<br />
adoption of this amendment will only impact the disclosures.<br />
The Group will apply this amendment from annual periods<br />
beginning 1 January 2006.<br />
■ IAS 39 Cash Flow Hedge Accounting of Forecast Intragroup<br />
Transactions, amendment, eff ective from 1 January 2006. This<br />
amendment is not relevant to the Groups operations.<br />
■ IAS 39 Financial instruments - The Fair Value Option, amendment,<br />
eff ective from 1 January 2006. This amendment is not relevant<br />
to the Groups operations.<br />
■ IFRS 4 Financial Guarantee Contracts, amendment, eff ective<br />
from 1 January 2006. This amendment is not relevant to the<br />
Groups operations.<br />
■ IFRS 7 Financial Instruments: Disclosures, eff ective from 1<br />
January 2007. IFRS 7 requires the disclosure of qualitative and<br />
quantitative information about exposure to risks arising from<br />
fi nancial instruments, including specifi ed minimum disclosures<br />
about credit risk, liquidity risk and market risk. The group will<br />
apply this standard from annual periods beginning 1 January<br />
2007.<br />
■ IFRIC 4 Determining whether an Arrangement contains a Lease,<br />
eff ective from 1 January 2006. IFRIC 4 is not relevant to the<br />
Groups operations.<br />
■ IFRIC 5 Rights to Interests arising from Decommissioning,<br />
Restoration and Environmental Rehabilitation Funds, eff ective<br />
from 1 January 2006. IFRIC 5 is not relevant to the Groups<br />
operations.<br />
■ IFRIC 6 Liabilities arising from Participating in a Specifi c Market-<br />
Waste Electrical and Electronic Equipment, eff ective from 1<br />
December <strong>2005</strong>. IFRIC 6 is not relevant to the Groups<br />
operations.
NOTE 1 – SEGMENTAL INFORMATION (TSEK)<br />
Group<br />
<strong>2005</strong><br />
> 57 <<br />
Group<br />
2004<br />
Parent<br />
Company<br />
<strong>2005</strong><br />
NOTES<br />
Parent<br />
Company<br />
2004<br />
Operating income<br />
Net sales of:<br />
Crude oil<br />
- United Kingdom 2,908,682 1,128,193 – –<br />
- France 629,842 426,457 – –<br />
- Norway 140,713 243,808 – –<br />
- Indonesia 179,673 149,645 – –<br />
- Tunisia 153,751 194,746 – –<br />
4,012,661 2,142,849 – –<br />
Condensate<br />
- United Kingdom 36,527 20,007 – –<br />
- Norway – 3,368 – –<br />
- Netherlands 3,467 10,143 – –<br />
- Indonesia 1,234 – – –<br />
41,228 33,518 – –<br />
Gas<br />
- Norway 1,746 2,851 – –<br />
- Netherlands 229,617 175,729 – –<br />
- Indonesia 1,328 4,129 – –<br />
- Ireland 5,776 23,372 – –<br />
238,467 206,081 – –<br />
Service fee<br />
- Venezuela 127,408 114,797 – –<br />
Oil price hedging settlement -424,287 -153,240 – –<br />
3,995,477 2,344,005 – –<br />
Other income:<br />
- United Kingdom 146,931 74,624 – –<br />
- France 14,627 25,131 – –<br />
- Norway 14,276 7,074 – –<br />
- Netherlands 12,927 9,224 – –<br />
- Tunisia – 7,179 – –<br />
- Other 5,946 1,049 18,776 11,547<br />
194,707 124,281 18,776 11,547<br />
Total operating income 4,190,184 2,468,286 18,776 11,547<br />
Operating profi t contribution<br />
- United Kingdom 1,397,827 437,941 – –<br />
- France 277,100 151,547 – –<br />
- Norway 267,559 167,909 – –<br />
- Netherlands 62,206 81,487 – –<br />
- Venezuela 57,146 62,397 – –<br />
- Indonesia 119,655 58,168 – –<br />
- Tunisia 57,899 66,205 – –<br />
- Ireland 4,222 8,902 – –<br />
- Nigeria -158,174 – – –<br />
- Iran -6,078 -132,051 – –<br />
- Other -66,204 -54,103 -33,365 -59,468<br />
Total operating profi t contribution 2,013,158 848,402 -33,365 -59,468<br />
Intercompany sales amounts to TSEK nil (TSEK nil) and intercompany purchases amounts to TSEK nil (TSEK nil).
NOTES<br />
<strong>2005</strong><br />
SEK<br />
Average crude sales price, per barrel or boe<br />
- United Kingdom 406.74 54.56 306.42 41.75<br />
- France 400.71 53.75 270.83 36.90<br />
- Norway 383.56 51.45 278.31 37.92<br />
- Netherlands 279.19 37.45 186.64 25.43<br />
- Indonesia 364.55 48.90 255.34 34.79<br />
- Tunisia 466.16 62.53 283.67 38.65<br />
- Ireland 248.33 33.31 192.59 26.24<br />
Combined 394.59 52.93 276.48 37.67<br />
Average depletion cost, per barrel or boe<br />
- United Kingdom 69.11 9.27 44.21 6.02<br />
- France 44.13 5.92 35.65 4.86<br />
- Norway 74.03 9.93 42.66 5.81<br />
- Netherlands 82.83 11.11 65.01 8.86<br />
- Indonesia 19.61 2.63 10.60 1.44<br />
- Tunisia 53.08 7.12 21.46 2.92<br />
- Venezuela 58.15 7.80 34.67 4.72<br />
Combined 62.32 8.36 39.05 5.32<br />
<strong>2005</strong><br />
2004<br />
Total assets<br />
TSEK<br />
TSEK<br />
United Kingdom 3,124,289 2,667,129<br />
France 1,146,890 1,063,666<br />
Norway 1,560,495 709,501<br />
Netherlands 789,338 746,330<br />
Indonesia 429,200 144,049<br />
Tunisia 197,018 132,277<br />
Ireland 2,850 37,872<br />
Venezuela 277,733 237,974<br />
Albania 46,912 4,085<br />
Nigeria 34,770 –<br />
Iran 117 17,030<br />
Sudan 54,758 41,250<br />
Other 98,003 51,150<br />
Group total 7,762,373 5,852,313<br />
> 58 <<br />
<strong>2005</strong><br />
USD<br />
2004<br />
SEK<br />
2004<br />
USD
<strong>2005</strong><br />
2004<br />
Total equity and liabilities<br />
TSEK<br />
TSEK<br />
United Kingdom 1,951,801 1,585,790<br />
France 323,613 293,576<br />
Norway 1,156,224 497,594<br />
Netherlands 248,260 892,170<br />
Indonesia 189,030 100,093<br />
Tunisia 62,445 33,093<br />
Ireland – 13,900<br />
Venezuela 61,413 22,627<br />
Albania 33,738 –<br />
Nigeria 25,721 –<br />
Iran 438 13,057<br />
Sudan 2,195 1,702<br />
Other 24,829 28,498<br />
Total liabilities 4,079,707 3,482,100<br />
Shareholders’ equity 3,679,616 2,367,282<br />
Minority interest 3,050 2,931<br />
Total equity 3,682,666 2,370,213<br />
Group total 7,762,373 5,852,313<br />
NOTE 2 – PRODUCTION COSTS (TSEK)<br />
Parent<br />
Parent<br />
Group<br />
Group<br />
Company<br />
Company<br />
Production costs comprise:<br />
<strong>2005</strong><br />
2004<br />
<strong>2005</strong><br />
2004<br />
Cost of operations 1,107,591 910,141 – –<br />
Tariff and transportation expenses 133,492 118,702 – –<br />
Direct production taxes 35,805 28,045 – –<br />
Change in lifting position 39,481 12,873 – –<br />
Inventory movement – hydrocarbons -4,935 5,962 – –<br />
Inventory movement – well supplies -529 -1,232 – –<br />
1,310,905 1,074,491 – –<br />
NOTE 3 – DEPLETION OF OIL AND GAS PROPERTIES (TSEK)<br />
Parent<br />
Parent<br />
Group<br />
Group<br />
Company<br />
Company<br />
Depletion of oil and gas properties per country:<br />
<strong>2005</strong><br />
2004<br />
<strong>2005</strong><br />
2004<br />
United Kingdom 508,519 175,680 – –<br />
France 67,651 55,665 – –<br />
Norway 26,663 38,328 – –<br />
Netherlands 70,834 61,669 – –<br />
Indonesia 16,192 8,903 – –<br />
Tunisia 18,831 12,319 – –<br />
Venezuela 44,738 28,688 – –<br />
753,428 381,252 – –<br />
> 59
NOTES<br />
NOTE 4 – WRITE-OFF OF OIL AND GAS PROPERTIES (TSEK)<br />
Parent<br />
Parent<br />
Group<br />
Group<br />
Company<br />
Company<br />
Oil and gas properties written off were as follows:<br />
<strong>2005</strong><br />
2004<br />
<strong>2005</strong><br />
2004<br />
Nigeria 158,174 – – –<br />
Netherlands 30,162 – – –<br />
Iran 6,040 123,820 – –<br />
Indonesia 855 22,360 – –<br />
Other – project appraisal 12,904 3,885 – –<br />
208,135 150,065 – –<br />
Whilst <strong>Lundin</strong> <strong>Petroleum</strong> retains an interest in Block OML 113 in Nigeria and is reviewing the information that was obtained from drilling<br />
the Aje-3 well, it was decided to write off all of the costs amounting to MSEK 158.2 in <strong>2005</strong> following the disappointing well results. The<br />
other material cost written off in <strong>2005</strong> relates to the Luttelgeest exploration well that was drilled in the Netherlands in 2004. After testing<br />
of the well in August <strong>2005</strong> the decision was made to plug and abandon the well and the costs incurred of MSEK 30.2 were written off .<br />
During 2004 the decision was made to write off the costs incurred in Iran as well as other exploration project costs resulting in a charge to<br />
the income statement for the year ended 31 December 2004 of MSEK 150.1.<br />
NOTE 5 – REMUNERATION TO THE GROUP’S AUDITORS (TSEK)<br />
Remuneration to the<br />
Group’s auditors for<br />
Audit fees<br />
Group<br />
<strong>2005</strong><br />
> 60 <<br />
Group<br />
2004<br />
Parent<br />
Company<br />
<strong>2005</strong><br />
Parent<br />
Company<br />
2004<br />
- PricewaterhouseCoopers 4,289 5,152 1,023 1,114<br />
- Other 52 741 – –<br />
4,341 5,893 1,023 1,114<br />
Other<br />
- PricewaterhouseCoopers 498 879 498 206<br />
- KPMG – 9 – –<br />
- Other 47 1,418 – –<br />
545 2,306 498 206<br />
Total 4,886 8,199 1,521 1,320<br />
NOTE 6 – FINANCIAL INCOME (TSEK)<br />
Parent<br />
Parent<br />
Group<br />
Group<br />
Company<br />
Company<br />
Financial income comprise:<br />
<strong>2005</strong><br />
2004<br />
<strong>2005</strong><br />
2004<br />
Interest income 31,195 11,468 37,243 30,005<br />
Dividends received 12,817 10,899 – –<br />
Foreign exchange gain, net – 36,125 2,603 523<br />
Other fi nancial income – – – 267<br />
44,012 58,492 39,846 30,795<br />
Included in the interest income for the Parent Company is an amount of TSEK 37,161 (TSEK 29,944) received from Group companies.
NOTE 7 –FINANCIAL EXPENSES (TSEK)<br />
Parent<br />
Parent<br />
Group<br />
Group<br />
Company<br />
Company<br />
Financial expenses comprise:<br />
<strong>2005</strong><br />
2004<br />
<strong>2005</strong><br />
2004<br />
Loan interest expenses 45,003 53,092 – –<br />
Change in market value interest rate hedge -7,949 -17,171 – –<br />
Unwind site restoration discount 17,082 14,503 – –<br />
Amortisation of deferred fi nancing fees 15,182 7,224 – –<br />
Foreign exchange loss, net 104,575 – 216 –<br />
Loss on currency rate hedge 17,396 – – –<br />
Other fi nancial expenses 5,172 2,385 – –<br />
196,461 60,033 216 –<br />
NOTE 8 – TAXES (TSEK)<br />
Group<br />
<strong>2005</strong><br />
> 61 <<br />
Group<br />
2004<br />
Parent<br />
Company<br />
<strong>2005</strong><br />
Parent<br />
Company<br />
2004<br />
The tax charge comprises:<br />
Corporation tax – current<br />
- United Kingdom -209,135 – – –<br />
- France -9,296 -5,393 – –<br />
- Norway 54,295 -5,821 – –<br />
- Netherlands -19,332 78,883 – –<br />
- Indonesia -1,153 -7,513 – –<br />
- Venezuela -54,996 -12,778 – –<br />
- Switzerland -1,036 -1,292 – –<br />
-240,653 46,086 – –<br />
Corporation tax - deferred<br />
- United Kingdom -343,221 -147,645 – –<br />
- France -82,805 23,935 – –<br />
- Norway -210,766 -77,299 – –<br />
- Netherlands 7,666 -69,012 – –<br />
- Indonesia -17,460 -25,144 – –<br />
- Venezuela -545 -391 – –<br />
-647,131 -295,556 – –<br />
Total corporation tax -887,784 -249,470 – –<br />
<strong>Petroleum</strong> tax - current<br />
- United Kingdom – 59,572 – –<br />
- Netherlands -11,270 3,367 – –<br />
-11,270 62,939 – –<br />
<strong>Petroleum</strong> tax – deferred<br />
- United Kingdom 42,799 -59,122 – –<br />
- Netherlands -10,479 4,050 – –<br />
32,320 -55,072 – –<br />
Total petroleum tax 21,050 7,867 – –<br />
Total tax charge -866,734 -241,603 – –
NOTES<br />
The tax on the Group’s profi t before tax diff ers from the theoretical amount that would arise using the tax rate of Sweden as follows:<br />
Group<br />
<strong>2005</strong><br />
> 62 <<br />
Group<br />
2004<br />
Parent<br />
Company<br />
<strong>2005</strong><br />
Parent<br />
Company<br />
2004<br />
Profi t before tax 1,860,709 846,861 6,265 -28,673<br />
Tax calculated at the corporate tax rate in Sweden (28%) -521,001 -237,121 -1,754 8,028<br />
Eff ect of foreign tax rates -302,208 -159,738 – –<br />
Tax eff ect of expenses non-deductible for tax purposes -5,759 948 – –<br />
Tax eff ect of deduction for petroleum tax 32,831 3,798 – –<br />
Tax eff ect of income not subject to tax 18,634 62,180 – –<br />
Tax eff ect of utilisation of unrecorded tax losses – 82,379 1,754 –<br />
Tax eff ect of creation of unrecorded tax losses -78,898 -7,991 – -8,028<br />
Adjustments to prior year deferred taxes -14,863 -4,726 – –<br />
Adjustments to prior year tax assessments -16,520 10,801 – –<br />
-887,784 -249,470 – –<br />
Group<br />
Group<br />
Current tax liability<br />
Corporation tax<br />
<strong>2005</strong><br />
2004<br />
United Kingdom 63,550 –<br />
France – 1,867<br />
Netherlands – 1,934<br />
Indonesia 2,413 –<br />
Venezuela 44,917 15,146<br />
Total corporation tax liability, current 110,880 18,947<br />
<strong>Petroleum</strong> tax<br />
Netherlands 6,811 16,403<br />
Total petroleum tax liability, current 6,811 16,403<br />
Total current tax liability 117,691 35,350<br />
Group<br />
Group<br />
Deferred tax liability<br />
Corporation tax<br />
<strong>2005</strong><br />
2004<br />
United Kingdom 912,695 683,659<br />
France 129,197 89,775<br />
Norway 436,294 157,290<br />
Netherlands 148,663 136,714<br />
Indonesia 88,723 37,302<br />
Venezuela -3,565 -3,447<br />
Total corporation tax liability, deferred 1,712,007 1,101,293<br />
<strong>Petroleum</strong> tax<br />
United Kingdom 12,264 53,835<br />
Netherlands 10,787 11,004<br />
Total petroleum tax liability, deferred 23,051 64,839<br />
Total deferred tax liability 1,735,058 1,166,132
The wholly owned French companies have been consolidated for tax purposes within France from 1 January 2003. The taxation liability<br />
of a French company can be reduced wholly or in part by the surrender of losses from another French company. Losses incurred by a<br />
company prior to tax consolidation can only be carried forward and utilised against that company’s income indefi nitely.<br />
During <strong>2005</strong> the Swedish taxation authority (Skatteverket) conducted a tax audit of <strong>Lundin</strong> <strong>Petroleum</strong> AB for the fi nancial years 2002 to<br />
2003. The tax authorities have disallowed a portion of expenses recharged to <strong>Lundin</strong> <strong>Petroleum</strong> AB by <strong>Lundin</strong> Oil Services SA for costs<br />
associated with services performed by the management of the <strong>Lundin</strong> <strong>Petroleum</strong> Group. As <strong>Lundin</strong> <strong>Petroleum</strong> AB is in a tax loss position,<br />
this disallowance of the expenses reduces the tax losses carried forward but does not result in a current tax charge. The tax losses<br />
incurred have not been recorded as deferred tax assets due to the uncertainty as to the timing of their utilisation. The tax authorities<br />
have charged penalties on the value of the taxable eff ect of the disallowed costs amounting to TSEK 5,038.1. The company is challenging<br />
the assessment of the penalties and the disallowance of the management costs as the company believes that they are a valid charge to<br />
the Parent Company of the <strong>Lundin</strong> <strong>Petroleum</strong> Group and as such, <strong>Lundin</strong> <strong>Petroleum</strong> has not made a provision in the accounts for the<br />
penalties charged.<br />
A deferred tax benefi t for the amount of TSEK 42,028 has been accounted for directly in equity. The deferred tax liability arises on the<br />
excess of book value over the tax value of oil and gas properties and the fair value of the derivate instruments.<br />
Group<br />
Group<br />
Specifi cation of deferred tax assets and tax liabilities<br />
Deferred tax assets<br />
<strong>2005</strong><br />
2004<br />
Unused tax loss carry forwards 172,705 361,669<br />
Site restoration provision 68,509 27,657<br />
Royalties 5,060 4,862<br />
Overlift 2,785 –<br />
Fair value of derivative instruments 45,125 406<br />
Other deductible temporary diff erences 3,603 1,753<br />
Deferred tax liabilities<br />
297,788 396,347<br />
Accelerated allowances 1,723,501 1,129,549<br />
Fair value of derivative instruments 3,097 –<br />
Exchange gains and losses – 30,246<br />
Capitalised acquisition cost 8,360 6,262<br />
Other taxable temporary diff erences 100 75<br />
1,735,058 1,166,132<br />
Unrecognised tax losses<br />
The Group has Swedish and Dutch tax loss carry forwards, including tax losses in the current fi nancial year, of MSEK 420.8 which in part<br />
are not yet assessed. The tax losses can be utilised indefi nitely. A deferred tax asset relating to the tax losses carry forward has not been<br />
recognised as at 31 December <strong>2005</strong> due to the uncertainty as to the timing and the extent of their utilisation. This treatment is consistent<br />
with the comparative year’s accounts.<br />
NOTE 9 – OIL AND GAS PROPERTIES (TSEK)<br />
Group<br />
<strong>2005</strong><br />
> 63 <<br />
Group<br />
2004<br />
Parent<br />
Company<br />
<strong>2005</strong><br />
Parent<br />
Company<br />
2004<br />
Production cost pools 5,541,704 4,246,283 – –<br />
Non-production cost pools 191,167 49,741 – –<br />
5,732,871 4,296,024 – –
NOTES<br />
<strong>2005</strong> Production cost pools UK France Netherlands Tunisia Indonesia Norway Venezuela Ireland Total<br />
Cost<br />
1 January 2,193,340 985,066 624,948 76,555 107,707 564,521 233,829 31,419 4,817,385<br />
Acquired on consolidation<br />
Additions - production/<br />
– – – – – -781 – – -781<br />
development 637,067 40,998 65,572 2 103,599 665,813 35,470 – 1,548,521<br />
Disinvestments – -1,364 -1,980 – – – – -32,708 -36,052<br />
Reclassifi cations<br />
Currency translation<br />
– -993 – – 195 – – – -798<br />
diff erence 463,096 40,100 25,879 3,121 55,456 52,090 49,575 1,289 690,606<br />
31 December 3,293,503 1,063,807 714,419 79,678 266,957 1,281,643 318,874 – 7,018,881<br />
Depletion<br />
1 January<br />
Depletion charge for<br />
-158,520 -146,630 -138,326 -39,242 -29,362 -15,810 -43,212 – -571,102<br />
the year -508,519 -67,651 -70,834 -18,831 -16,192 -26,663 -44,738 – -753,428<br />
Write-off s – – -30,162 – – – – – -30,162<br />
Disinvestments<br />
Currency translation<br />
– 1,364 1,978 – – – – – 3,342<br />
diff erence -66,310 -6,152 -6,445 -1,819 -31,770 -1,590 -11,741 – -125,827<br />
31 December -733,349 -219,069 -243,789 -59,892 -77,324 -44,063 -99,691 – -1,477,177<br />
Net book value 2,560,154 844,738 470,630 19,786 189,633 1,237,580 219,183 – 5,541,704<br />
2004 Production cost pools<br />
Cost<br />
UK France Netherlands Tunisia<br />
Group<br />
Indonesia Norway Venezuela Ireland Total<br />
1 January – 850,740 555,507 80,532 52,014 160,038 240,220 – 1,939,051<br />
Acquired on acquisition<br />
Additions - production/<br />
1,663,419 – – – – 458,429 – 30,024 2,151,872<br />
development 704,350 126,202 68,994 – 72,565 111,739 12,734 2,622 1,099,206<br />
Disinvestment – -858 – -3,787 -2,801 -190,077 – – -197,523<br />
Changes in estimates<br />
Currency translation<br />
– 16,170 4,928 301 – 19,117 – – 40,516<br />
diff erence -174,429 -7,188 -4,481 -491 -14,071 5,275 -19,125 -1,227 -215,737<br />
31 December 2,193,340 985,066 624,948 76,555 107,707 564,521 233,829 31,419 4,817,385<br />
Depletion<br />
1 January<br />
Depletion charge for<br />
– -92,978 -77,873 -27,242 -11,410 -23,176 -22,382 – -255,061<br />
the year -175,680 -55,665 -61,669 -12,319 -8,903 -38,328 -28,688 – -381,252<br />
Write-off s – – – – -13,861 – – – -13,861<br />
Disinvestment<br />
Currency translation<br />
– 858 – – 2,801 47,204 – – 50,863<br />
diff erence 17,160 1,155 1,216 319 2,011 -1,510 7,858 – 28,209<br />
31 December -158,520 -146,630 -138,326 -39,242 -29,362 -15,810 -43,212 – -571,102<br />
Net book value 2,034,820 838,436 486,622 37,313 78,345 548,711 190,617 31,419 4,246,283<br />
> 64 <<br />
Group
65 <<br />
Group<br />
<strong>2005</strong><br />
Non-production cost pools 1 January Additions Write-off s<br />
Currency<br />
translation<br />
diff erence 31 December<br />
Indonesia 14,657 17,469 -855 11,543 42,814<br />
Tunisia 3,760 74,493 – 1,045 79,298<br />
Albania 4,085 24,476 – 1,708 30,269<br />
Nigeria – 158,174 -158,174 – –<br />
Iran – 6,040 -6,040 – –<br />
Sudan 20,802 7,798 – 157 28,757<br />
Other 6,437 15,444 -12,197 345 10,029<br />
49,741 303,894 -177,266 14,798 191,167<br />
2004<br />
Non-production cost pools<br />
Indonesia 14,199 13,972 -8,499 -5,015 14,657<br />
Tunisia – 3,805 – -45 3,760<br />
Albania – 4,132 – -47 4,085<br />
Iran 70,965 51,717 -123,820 1,138 –<br />
Sudan 17,261 5,576 – -2,035 20,802<br />
Other 1,265 9,232 -3,885 -175 6,437<br />
103,690 88,434 -136,204 -6,179 49,741<br />
Acquired on acquisition includes the values assigned to the oil and gas properties acquired through the purchase of the shares in <strong>Lundin</strong><br />
Britain Ltd (formerly DNO Britain Ltd) and <strong>Lundin</strong> Ireland Ltd (formerly Island <strong>Petroleum</strong> Developments Ltd) and certain Norwegian assets<br />
from DNO ASA during 2004. Acquired on consolidation relate to adjustments made in <strong>2005</strong> to the values assigned to the oil and gas<br />
assets acquired through this acquisition.<br />
Capitalised interest<br />
The capitalised interest costs included within the costs of oil and gas properties amounts to MSEK 13.7 (MSEK -) and relates to oil and gas<br />
assets in Norway.<br />
Exploration expenditure commitments<br />
The Group participates in joint ventures with third parties in oil and gas exploration activities. The Group is contractually committed<br />
under various concession agreements to complete certain exploration programmes. The Directors estimate the present commitments to<br />
be no more than MSEK 216.9 of which third parties who are joint venture partners have contractually agreed to contribute approximately<br />
MSEK 79.2.<br />
Risk and uncertainties<br />
The Group faces a number of risks and uncertainties in the areas of operation which may have an adverse impact on its ability to<br />
successfully pursue its exploration, appraisal and development plans as well as on its production of oil and gas.<br />
■ Nature of oil and gas exploration and production. Oil and gas exploration, development and production involve high operational and<br />
fi nancial risks, which even a combination of experience, knowledge and careful evaluation may not be able to fully eliminate or which<br />
are beyond the Company’s control. In addition, there is no assurance that commercial quantities of oil and gas will be recovered.<br />
■ Property and/or border disputes. The exact location and jurisdictions within which the Group’s concessions exist could become the<br />
subject of dispute.<br />
■ Military and political disturbances. Certain of the countries in which the Group is operating have experienced military or political<br />
diffi culties in the recent past.<br />
■ Political uncertainties. Certain aspects of the Group’s operations require the consent or favourable decisions of governmental bodies.<br />
■ Environmental impacts. Exploration, development and production of oil and gas could cause harm to the environment. Under applicable<br />
laws and regulations as well as exploration and production sharing agreements, the Company may be held liable.<br />
■ Liabilities and obligations under exploration and production agreements. The Company and its partners in joint ventures for oil and gas<br />
exploration and production, are joint and several liable for obligations and liabilities under relating agreements. In case joint venture<br />
partners are not able to meet their liabilities and obligations, the agreement may be terminated.
NOTES<br />
Venezuela<br />
In November 2002, <strong>Lundin</strong> <strong>Petroleum</strong> commenced arbitration proceedings against one of its partners in the Colón Unit in Venezuela in<br />
respect of a dispute over pre-emptive rights under the Colón Unit joint operating agreement. The arbitration hearing was completed in<br />
2004 and as a result <strong>Lundin</strong> <strong>Petroleum</strong>’s working interest in the Colón Unit has remained at 12.5%.<br />
In <strong>2005</strong> the Venezuelan government decided to restructure all operating services agreements in the country. <strong>Lundin</strong> <strong>Petroleum</strong> and its<br />
partners have signed a Transitional Agreement with Venezuelan national oil company PDVSA Petròleo SA. This agreement is relating to<br />
entering into good faith negotiations for conversion of the Operating Services Agreement into a joint venture company. The fi nal eff ect<br />
of this transition on <strong>Lundin</strong> <strong>Petroleum</strong>’s Venezuelan assets and values remains uncertain although <strong>Lundin</strong> <strong>Petroleum</strong> and its partners have<br />
been assured by the Venezuelan Ministry of Energy and <strong>Petroleum</strong> that the new regime will preserve our asset value under the Operating<br />
Services Agreement.<br />
NOTE 10 – OTHER TANGIBLE ASSETS (TSEK)<br />
Other tangible fi xed assets:<br />
Assets under<br />
construction<br />
(real estate)<br />
<strong>2005</strong> 2004<br />
Office<br />
equipment and<br />
other assets Total<br />
> 66 <<br />
Assets under<br />
construction<br />
(real estate)<br />
Office<br />
equipment and<br />
other assets Total<br />
Group<br />
Cost<br />
1 January 10,905 39,365 50,270 41,614 24,005 65,619<br />
Acquired on acquisition – – – – 1,617 1,617<br />
Disinvestments – – – -41,821 – -41,821<br />
Additions 40,190 16,453 56,643 12,088 19,518 31,606<br />
Write-off – -9 -9 – -2,286 -2,286<br />
Reclassifi cation – 798 798 – – –<br />
Currency translation diff erence 4,912 6,860 11,772 -976 -3,489 -4,465<br />
31 December 56,007 63,467 119,474 10,905 39,365 50,270<br />
Depreciation<br />
1 January – -12,269 -12,269 -754 -9,509 -10,263<br />
Disinvestments – – – 758 – 758<br />
Depreciation charge for the year – -9,781 -9,781 – -5,287 -5,287<br />
Write-off – – – – 1,445 1,445<br />
Currency translation diff erence – -3,288 -3,288 -4 1,082 1,078<br />
31 December – -25,338 -25,338 – -12,269 -12,269<br />
Net book value 56,007 38,129 94,136 10,905 27,096 38,001<br />
Parent Company<br />
Cost<br />
1 January – – – – 158 158<br />
Additions – – – – 131 131<br />
Write-off s – – – – -289 -289<br />
31 December – – – – – –<br />
Depreciation<br />
1 January – – – – -63 -63<br />
Depreciation charge for the year – – – – -33 -33<br />
Write-off s – – – – 96 96<br />
31 December – – – – – –<br />
Net book value – – – – – –<br />
Depreciation charge for the year refl ects depreciation according to plan which is based on cost and an estimated useful life of 10 years<br />
for real estate and 3 to 5 years for offi ce equipment and other assets. Depreciation is included within the general, administration and<br />
depreciation line in the income statement.<br />
Acquired on acquisition includes the values assigned to the offi ce equipment and other fi xed assets acquired through the purchase of the<br />
shares in <strong>Lundin</strong> Britain Ltd (formerly DNO Britain Ltd) during 2004.
NOTE 11 – SHARES IN SUBSIDIARIES (TSEK)<br />
Registration<br />
number Registered offi ce<br />
Directly owned<br />
<strong>Lundin</strong> Energy AB 556619-<br />
2299<br />
> 67 <<br />
Number of<br />
shares Percentage<br />
Nominal<br />
value per<br />
share<br />
Book<br />
amount<br />
31 Dec <strong>2005</strong><br />
Book<br />
amount<br />
31 Dec 2004<br />
Stockholm, Sweden 10,000,000 100 SEK 0.01 100 100<br />
<strong>Lundin</strong> Investment Ltd EC-14476 Hamilton, Bermuda 12,000 100 USD 1.00 585 585<br />
<strong>Lundin</strong> <strong>Petroleum</strong> B.V. BV 1216140 The Hague, Netherlands 180 100 EUR 100.00 183,806 183,806<br />
Indirectly owned<br />
184,491 184,491<br />
<strong>Lundin</strong> Britain Ltd 3628497 London, United Kingdom 24,265,203 100 GBP 1.00<br />
- <strong>Lundin</strong> Heather Ltd 2748866 London, United Kingdom 9,701,000 100 GBP 1.00<br />
- <strong>Lundin</strong> (Heather Oilfi eld) Ltd 1216554 London, United Kingdom 101 100 GBP 1.00<br />
- <strong>Lundin</strong> Thistle Ltd 4487223 London, United Kingdom 100 100 GBP 1.00<br />
- <strong>Lundin</strong> UK Ltd 1006812 London, United Kingdom 5,004 100 GBP 1.00<br />
- <strong>Lundin</strong> UK Exploration Ltd 999917 London, United Kingdom 502,501 100 GBP 1.00<br />
<strong>Lundin</strong> Sudan B.V. BV 1225619 The Hague, Netherlands 180 100 EUR 100.00<br />
<strong>Lundin</strong> Sudan Ltd EC 15676 Hamilton, Bermuda 12,000 100 USD 1.00<br />
<strong>Lundin</strong> Block 5B B.V. BV 1225618 The Hague, Netherlands 180 100 EUR 100.00<br />
- <strong>Lundin</strong> Sudan (Block 5B) Ltd EC-30543 Hamilton, Bermuda 12,000 100 USD 1.00<br />
<strong>Lundin</strong> Norway AS 986 209 409 Oslo, Norway 1,320,000 100 NOK 100.00<br />
<strong>Lundin</strong> Nigeria Ltd RC 615830 Lagos, Nigeria 10,000,000 100 N 1.00<br />
<strong>Lundin</strong> Oil Services SA 1731/1999 Geneva, Switzerland 1,000 100 CHF 100.00<br />
<strong>Lundin</strong> New Ventures B.V. BV 1272860 The Hague, Netherlands 180 100 EUR 100.00<br />
<strong>Lundin</strong> Exploration B.V. BV 1303454 The Hague, Netherlands 180 100 EUR 100.00<br />
<strong>Lundin</strong> Services B.V. BV 1229867 The Hague, Netherlands 180 100 EUR 100.00<br />
<strong>Lundin</strong> Sudan (Halaib) Ltd EC-16775 Hamilton, Bermuda 12,000 100 USD 1.00<br />
<strong>Lundin</strong> Holdings SA Nanterre<br />
B442423448 Montmirail, France 1,853,700 100 EUR 10.00<br />
- <strong>Lundin</strong> International SA Nanterre<br />
B572199164 Montmirail, France 1,660,662 99.86 EUR 15.00<br />
- <strong>Lundin</strong> Latina de Petroleos SA N 6 Volume<br />
8-A-Qto Caracas, Venezuela 8,047,951 100 Bs 1,000<br />
- <strong>Lundin</strong> Gascogne SNC Nanterre<br />
B419619077 Montmirail, France 100 100 EUR 152.45<br />
- <strong>Lundin</strong> Netherlands Holding B.V. BV 87466 The Hague, Netherlands 150 100 EUR 450.00<br />
- <strong>Lundin</strong> Netherlands B.V. BV 86811 The Hague, Netherlands 30,000 100 EUR 450.00<br />
- <strong>Lundin</strong> Indonesia B.V. BV 471132 The Hague, Netherlands 1,065 100 EUR 450.00<br />
- <strong>Lundin</strong> Munir B.V. BV 1225617 The Hague, Netherlands 180 100 EUR 100.00<br />
- <strong>Lundin</strong> Lematang B.V. BV 547158 The Hague, Netherlands 40 100 EUR 450.00<br />
- <strong>Lundin</strong> Oil & Gas B.V. BV 547156 The Hague, Netherlands 40 100 EUR 450.00<br />
- <strong>Lundin</strong> Blora B.V. BV 561660 The Hague, Netherlands 40 100 EUR 450.00<br />
- <strong>Lundin</strong> Sareba B.V. BV 608284 The Hague, Netherlands 40 100 EUR 450.00<br />
- <strong>Lundin</strong> South Sokang B.V. BV 614572 The Hague, Netherlands 40 100 EUR 450.00<br />
- <strong>Lundin</strong> Behara B.V. BV 1102917 The Hague, Netherlands 182 100 EUR 100.00<br />
- <strong>Lundin</strong> Banyumas B.V. BV 1140222 The Hague, Netherlands 182 100 EUR 100.00<br />
- <strong>Lundin</strong> Marine B.V. BV 1310579 The Hague, Netherlands 180 100 EUR 100.00<br />
- <strong>Lundin</strong> Albania B.V. BV 1310581 The Hague, Netherlands 180 100 EUR 100.00<br />
The following companies were entered into liquidation during the year ending 31 December <strong>2005</strong>:<br />
- <strong>Lundin</strong> <strong>Petroleum</strong> Holdings Ltd<br />
- <strong>Lundin</strong> Technical Services Ltd<br />
- <strong>Lundin</strong> Ireland Ltd<br />
- <strong>Lundin</strong> Munir Ltd<br />
<strong>Lundin</strong> Ile-de-France SA was merged with <strong>Lundin</strong> International SA on 1 January <strong>2005</strong>.<br />
There were no movements in shares in subsidiaries of the Parent Company in the year ending 31 December <strong>2005</strong>.
NOTES<br />
NOTE 12 – SHARES IN ASSOCIATED COMPANIES (TSEK)<br />
Number of<br />
Share<br />
Book amount<br />
Book amount<br />
Associated companies comprise:<br />
shares<br />
% 31 December <strong>2005</strong> 31 December 2004<br />
- Ikdam Production SA 1,600 40.00 – –<br />
– –<br />
The net result of Ikdam Production SA for the year ended 31 December 2004 amounted to TSEK 151,159 and total equity amounted to<br />
TSEK -77,343. As <strong>Lundin</strong> <strong>Petroleum</strong> has no obligation to cover for its interest in the negative total equity, the investment has been written<br />
off to TSEK nil.<br />
31 December <strong>2005</strong><br />
Aggregated balance sheet information of<br />
associated companies Total assets Net result <strong>2005</strong><br />
> 68 <<br />
Group<br />
Equity, excl. net<br />
result <strong>2005</strong> Liabilities<br />
Total equity and<br />
liabilities<br />
- Ikdam Production SA 178,200 74,757 -54,508 157,951 178,200<br />
NOTE 13 – OTHER SHARES AND PARTICIPATIONS (TSEK)<br />
Number of<br />
Share<br />
Book amount<br />
Book amount<br />
Other shares and participation comprise:<br />
shares<br />
% 31 December <strong>2005</strong> 31 December 2004<br />
- Noorderlijke Aardgas Transportmij B.V. 11,098,015 1.81 105,769 18,383<br />
- Cofraland B.V. 31 7.75 2,841 2,728<br />
- Aardgas Verkoopmij Leeuwarden – 7.23 – 15<br />
- Island Oil and Gas plc 4,000,000 6.76 43,286 –<br />
- Maison de la géologie 2 1.25 32 27<br />
151,928 21,153<br />
The fair value amounted to MSEK 88.3 as at 31 December 2004.<br />
The fair value of Island Oil & Gas plc is calculated using the quoted share price at the London Stock Exchange and the fair value of the<br />
shares in NOGAT is based on the discounted expected cash fl ow.<br />
As at 31 December <strong>2005</strong>, the other shares and participations include MSEK 2.9 recognised at cost because their fair value can not be<br />
measured reliably since there is no quoted share price and due to the uncertainty of the timing of the future cash fl ows from these<br />
companies.<br />
NOTE 14 – LONG TERM RECEIVABLES (TSEK)<br />
Parent<br />
Parent<br />
Group<br />
Group<br />
Company<br />
Company<br />
Long term receivables comprises:<br />
31 December <strong>2005</strong> 31 December 2004 31 December <strong>2005</strong> 31 December 2004<br />
Long term receivables from subsidiaries – – 690,746 615,545<br />
– – 690,746 615,545<br />
Long term receivables due from subsidiaries represents funding of operations within the subsidiaries for which repayment is not foreseen<br />
within an agreed repayment schedule.<br />
NOTE 15 – RESTRICTED CASH<br />
Restricted cash includes cash amounts deposited to support letters of credit issued in support of exploration work commitments. The<br />
amount as at 31 December <strong>2005</strong> relates to the bank guarantee outstanding issued to the Minister of Energy and Mining, representing<br />
the Republic of Sudan, in relation to the fi rst commitment period in Block 5B, Sudan. The bank guarantee has been supported by a cash<br />
deposit that can not be withdrawn whilst the guarantee remains outstanding. As at 31 December 2004 an additional bank guarantee was<br />
issued to Edison as operator of the Munir concession in Iran in relation to work commitments on this concession. The amount has been<br />
refunded during <strong>2005</strong> following the fulfi llment of the work commitments.<br />
Group
NOTE 16 – DEFERRED FINANCING FEES (TSEK)<br />
The deferred fi nancing fees relate to the costs of the bank credit facility and are being amortised over the period of the loan. Amortisation<br />
expenses amounted to TSEK 15,182 (TSEK 7,224).<br />
NOTE 17 – DEFERRED TAX ASSET (TSEK)<br />
The deferred tax asset is primarily relating to loss carry forwards in Norway for an amount of TSEK 163,895 (TSEK 110,078), France for an<br />
amount of TSEK 37,691 (TSEK 28,235) and Tunisia for an amount of TSEK 15,917 (TSEK 15,867). As at 31 December 2004, a deferred tax<br />
asset was included for the United Kingdom amounting to TSEK 240,661. Deferred tax assets in relation to tax loss carry forwards are only<br />
recognised in so far that there is a reasonable certainty as to the timing and the extent of their realisation.<br />
NOTE 18 – DERIVATIVE INSTRUMENTS (TSEK)<br />
As an international oil and gas exploration and production company operating globally, <strong>Lundin</strong> <strong>Petroleum</strong> is exposed to fi nancial risks<br />
such as fl uctuations in currency rates, oil price, interest rates as well as credit fi nancing. The Company shall seek to control these risks<br />
through sound management practice and the use of internationally accepted fi nancial instruments, such as oil price hedges and interest<br />
rate hedges. <strong>Lundin</strong> <strong>Petroleum</strong> uses fi nancial instruments solely for the purpose of minimising risks in the Company’s business.<br />
Currency risk<br />
<strong>Lundin</strong> <strong>Petroleum</strong>’s policy on currency rate hedging is, in case of currency exposure, to consider setting the rate of exchange for known<br />
costs in non-US dollar currencies to US dollars in advance so that future US dollar cost levels can be forecasted with a reasonable degree<br />
of certainty. The Company will take into account the current rates of exchange and market expectations in comparison to historic trends<br />
and volatility in making the decision to hedge.<br />
Oil price risk<br />
<strong>Lundin</strong> <strong>Petroleum</strong>’s policy is to adopt a fl exible approach towards oil price hedging, based on an assessment of the benefi ts of the hedge<br />
contract in specifi c circumstances. Based on analysis of the circumstances <strong>Lundin</strong> <strong>Petroleum</strong> will assess the benefi ts of forward hedging<br />
monthly sales contracts for the purpose of establishing cash fl ow. If it believes that the hedging contract will provide an enhanced cash<br />
fl ow then it may choose to enter into an oil price hedge.<br />
Interest rate risk<br />
<strong>Lundin</strong> <strong>Petroleum</strong> will assess the benefi ts of interest rate hedging on borrowings on a continuous basis. If the hedging contract provides<br />
a reduction in the interest rate risk at a price that is deemed acceptable to the Company, then <strong>Lundin</strong> <strong>Petroleum</strong> may choose to enter into<br />
an interest hedge.<br />
Credit risk<br />
<strong>Lundin</strong> <strong>Petroleum</strong>’s policy is to limit credit risk by limiting the counter-parties to major banks and oil companies. Where it is determined<br />
that there is a credit risk for oil and gas sales, the policy is to require an irrevocable letter of credit for the full value of the sale. The policy<br />
on joint venture parties is to rely on the provisions of the underlying joint operating agreements to take back possession of the licence or<br />
the joint venture partner’s share of production for non-payment of cash calls or other amounts due.<br />
Liquidity risk<br />
On 16 August 2004, the Group entered into a MUSD 385 loan facility to fund the DNO acquisition and to provide further funds for<br />
corporate purposes. The MUSD 385 loan facility has been used to provide Letters of Credit in the amount of MUSD 35 as security for the<br />
payment of future site restoration costs to former owners of the Heather fi eld, off shore UK, and to provide funds for corporate purposes.<br />
The amount of cash drawings outstanding at 31 December <strong>2005</strong> amounted to MUSD 92.5. The Group has entered into oil price, interest<br />
rate and currency hedges to remove a portion of market risk from the future cash fl ows. It is expected that the Group’s operating cash<br />
fl ows will be suffi cient to meet the Group’s current development and exploration expenditure requirements, but if the cash fl ow should<br />
be insuffi cient the Group can utilise the undrawn portion of the loan facility.<br />
Fair value of outstanding derivative<br />
31 December <strong>2005</strong> 31 December 2004<br />
instruments in the balance sheet:<br />
Assets Liabilities Assets Liabilities<br />
Interest rate swaps 15,255 4,373 – 8,408<br />
Oil hedge contracts – 170,833 – 3,545<br />
Foreign exchange forward contracts – 18,571 – –<br />
Total 15,255 193,777 – 11,953<br />
Non-current 1,825 – – 1,390<br />
Current 13,430 193,777 – 10,563<br />
Total 15,255 193,777 – 11,953<br />
As at 31 December 2004, the fair value of the derivative instruments amounted to MSEK 167.7. As IAS 39 has been applied as from<br />
1 January <strong>2005</strong>, this fair value has not been recorded at 31 December 2004.<br />
> 69
NOTES<br />
The Group has entered into the following oil price hedges:<br />
Contract<br />
date<br />
USD per barrel<br />
Dated Brent<br />
Barrels<br />
per day<br />
3/2004 28.40 3,000 1/1/<strong>2005</strong> 31/12/<strong>2005</strong><br />
4/2004 29.60 3,000 1/2/<strong>2005</strong> 31/12/<strong>2005</strong><br />
1/<strong>2005</strong> 45.00 5,000 1/2/<strong>2005</strong> 31/12/<strong>2005</strong><br />
3/<strong>2005</strong> 51.00 5,000 8/3/<strong>2005</strong> 31/12/<strong>2005</strong><br />
3/<strong>2005</strong> 53.19 5,000 1/1/2006 31/12/2006<br />
12/<strong>2005</strong> 61.40 5,000 1/1/2006 31/12/2006<br />
Under the criteria of IAS 39, the oil price hedges are eff ective and qualify for hedge accounting. Changes in fair value of these contracts<br />
are charged directly to the shareholders’ equity. Upon settlement the relating part of the reserve is released to the income statement.<br />
The Group has entered into the following interest rate hedging contracts to tie the LIBOR based fl oating rate part of the Company’s USD<br />
borrowings to a fi xed LIBOR rate of interest.<br />
Contract<br />
date<br />
USD Libor<br />
interest rate<br />
Amount<br />
hedged<br />
10/2002 3.49% 85,000,000 4/1/<strong>2005</strong> 5/7/<strong>2005</strong><br />
10/2002 3.49% 75,000,000 5/7/<strong>2005</strong> 3/1/2006<br />
10/2002 3.49% 65,000,000 3/1/2006 3/7/2006<br />
10/2002 3.49% 55,000,000 3/7/2006 2/1/2007<br />
3/2004 2.32% 40,000,000 1/4/2004 2/4/2007<br />
The 3.49% interest rate contract had been entered into in relation to a previous credit facility, which was repaid and cancelled in 2003. As<br />
of 1 January 2004, this contract has been recorded at fair value with changes in fair value being recorded in the income statement.<br />
The 2.32% interest rate contract relates to the current credit facility. As from 1 January <strong>2005</strong>, the contract met the conditions of IAS 39<br />
to qualify for hedge accounting with changes in fair value being charged directly to shareholders’ equity. Following the repayment of<br />
the underlying portion of the loan in <strong>2005</strong>, the 2.32% interest rate contract became ineff ective in the fourth quarter of <strong>2005</strong> and hedge<br />
accounting could no longer be applied. As from this date, changes in fair value of this contract are therefore charged to the income<br />
statement.<br />
The Group has entered into the following currency hedging contracts:<br />
Buy Sell<br />
Average contractual<br />
exchange rate Settlement period<br />
MGBP 35.2 MUSD 66.2 1.8795 20 Jan <strong>2005</strong> – 20 Nov <strong>2005</strong><br />
MEUR 13.2 MUSD 17.6 1.3330 20 Jan <strong>2005</strong> – 20 Nov <strong>2005</strong><br />
MCHF 10.2 MUSD 8.8 0.8665 20 Jan <strong>2005</strong> – 20 Nov <strong>2005</strong><br />
MNOK 35.0 MUSD 5.7 0.1628 15 Feb <strong>2005</strong> – 15 Nov <strong>2005</strong><br />
MGBP 36.0 MUSD 63.3 1.7588 20 Dec <strong>2005</strong> – 20 Nov 2006<br />
MEUR 14.4 MUSD 18.3 1.2716 20 Dec <strong>2005</strong> – 20 Nov 2006<br />
MCHF 10.0 MUSD 7.7 0.7711 20 Dec <strong>2005</strong> – 20 Nov 2006<br />
The currency hedging contracts are treated as being ineff ective and therefore do not qualify for hedge accounting under IAS 39. Changes<br />
in fair value of these contracts are directly charged to the income statement.<br />
NOTE 19 – OTHER FINANCIAL FIXED ASSETS (TSEK)<br />
This item mainly relates to funds held by joint venture partners in anticipation of future expenditures for an amount of TSEK 8,201<br />
(TSEK 5,924).<br />
> 70 <<br />
Start<br />
date<br />
Start<br />
date<br />
End<br />
date<br />
End<br />
date
NOTE 20 – INVENTORIES (TSEK)<br />
Group<br />
Group Parent Company Parent Company<br />
31 December<br />
31 December<br />
31 December<br />
31 December<br />
Inventories comprise:<br />
<strong>2005</strong><br />
2004<br />
<strong>2005</strong><br />
2004<br />
Hydrocarbon stocks 62,485 53,557 – –<br />
Drilling equipment and consumable materials 37,458 35,011 – –<br />
99,943 88,568 – –<br />
NOTE 21 – PREPAID EXPENSES AND ACCRUED INCOME (TSEK)<br />
Group<br />
Group Parent Company Parent Company<br />
31 December<br />
31 December<br />
31 December<br />
31 December<br />
Prepaid expenses and accrued income comprises:<br />
<strong>2005</strong><br />
2004<br />
<strong>2005</strong><br />
2004<br />
Prepaid rent 4,538 400 – –<br />
Joint venture balances 478 5,179 – –<br />
Prepaid insurances 1,902 2,517 – –<br />
Accrued income 14,883 1,279 – –<br />
Other 5,475 2,415 37 158<br />
27,276 11,790 37 158<br />
NOTE 22 – CURRENT RECEIVABLES (TSEK)<br />
Group<br />
Group Parent Company Parent Company<br />
31 December<br />
31 December<br />
31 December<br />
31 December<br />
Current receivables comprises:<br />
<strong>2005</strong><br />
2004<br />
<strong>2005</strong><br />
2004<br />
Underlift 49,482 35,073 – –<br />
Current tax asset 117,283 117,587 – –<br />
Joint venture debtors 180,989 74,055 – –<br />
Due from Group companies – – 9,881 2,333<br />
VAT recoverables 17,363 18,438 1,218 927<br />
Other current assets 14,396 57,254 – 34<br />
379,513 302,407 11,099 3,294<br />
NOTE 23– SITE RESTORATION (TSEK)<br />
Group<br />
<strong>2005</strong><br />
> 71 <<br />
Group<br />
2004<br />
Parent Company<br />
<strong>2005</strong><br />
Parent Company<br />
2004<br />
1 January 296,024 110,643 – –<br />
Acquired on acquisition – 195,403 – –<br />
Unwinding of discount (Note 7) 17,082 14,503 – –<br />
Payments -254 – – –<br />
Changes in estimates – 40,516 – –<br />
Disinvestments -11,187 -57,531 – –<br />
Currency translation diff erence 27,508 -7,510 – –<br />
31 December 329,173 296,024 – –<br />
NOTE 24 – PENSION (TSEK)<br />
In May 2002 the Compensation Committee recommended to the Board of Directors, and the Board of Directors approved that a pension<br />
to be paid to Mr Adolf H. <strong>Lundin</strong> upon his resignation as Chairman of the Board of Directors and his appointment as Honorary Chairman.<br />
The pension amount agreed consists of monthly payments totalling an annual amount of TCHF 206 (TSEK 1,236) for the duration of his
NOTES<br />
life. It was further agreed that upon the death of Mr Adolf H. <strong>Lundin</strong>, monthly payments totalling an annual amount of TCHF 138 (TSEK<br />
827) would be paid to his wife, Mrs Eva <strong>Lundin</strong> for the duration of her life. The Company may, at its option, buy out the obligation to<br />
make the pension payments through a lump sum payment in the amount of TCHF 2,000 (TSEK 11,986). With the adoption of the Swedish<br />
recommendation RR29 a provision has been accounted for resulting in a reduction to the 2004 retained earnings brought forward of<br />
MSEK 15.7.<br />
Group<br />
Group Parent Company Parent Company<br />
Pension provision<br />
<strong>2005</strong><br />
2004<br />
<strong>2005</strong><br />
2004<br />
1 January 14,518 – – –<br />
Adoption of RR 29 – 15,737 – –<br />
Instalments paid -1,236 -1,219 – –<br />
Currency translation diff erence 528 – – –<br />
31 December 13,810 14,518 – –<br />
NOTE 25 – OTHER PROVISIONS (TSEK)<br />
Other provisions comprises:<br />
Termination<br />
indemnity provision Other Total<br />
1 January <strong>2005</strong> 4,865 14,763 19,628<br />
Additions 1,111 – 1,111<br />
Payments – -13,039 -13,039<br />
Currency translation diff erence 981 528 1,509<br />
31 December <strong>2005</strong> 6,957 2,252 9,209<br />
The termination indemnity provision represents <strong>Lundin</strong> <strong>Petroleum</strong>’s share of the provision for employment termination costs within the<br />
Salawati joint ventures in Indonesia. This provision is supported in full by cash deposits held by the joint venture that are included within<br />
fi nancial fi xed assets.<br />
As at 31 December 2004 an amount of MSEK 12.7 was accounted for in relation to transfer taxes on certain French assets originating<br />
before the time of acquisition of the Coparex group by <strong>Lundin</strong> <strong>Petroleum</strong>.<br />
NOTE 26 – BANK LOANS (TSEK)<br />
Group<br />
Group Parent Company Parent Company<br />
31 December<br />
31 December<br />
31 December<br />
31 December<br />
Bank loans comprises:<br />
Current<br />
<strong>2005</strong><br />
2004<br />
<strong>2005</strong><br />
2004<br />
Repayment within one year – – – –<br />
Long term<br />
Repayment within 2 – 5 years 736,151 629,147 – –<br />
Repayment after fi ve years – 713,874 – –<br />
736,151 1,343,021 – –<br />
Loan repayments are made based upon a net present value calculation of the assets future cash fl ows. No loan repayments are currently<br />
forecasted under this calculation. The loan repayments as shown in the table are driven by the loan reduction schedule. The eff ective<br />
interest rate, after consideration taken to interest rate swaps, at the balance sheet date was 4.21% (4.85%). The fair value as at 31 December<br />
<strong>2005</strong> amounted to MSEK 746.5 (MSEK 1,352.0), based on the borrowing rate of 5.3%.<br />
The Group’s credit facility agreement provides that an “event of default” occurs where the Group does not comply with certain material<br />
covenants or where certain events occur as specifi ed in the agreement, as are customary in fi nancing agreements of this size and nature.<br />
If such an event of default occurs and subject to any applicable cure periods, the external lenders may take certain specifi ed actions to<br />
enforce their security, including accelerating the repayment of outstanding amounts under the credit facility.<br />
> 72 <<br />
Group
NOTE 27 – FINANCE LEASE (TSEK)<br />
There are no fi nance leases within the Group.<br />
NOTE 28 – OPERATING LEASE (TSEK)<br />
Operating lease payments in the income statement amounts to MSEK 2.3 (MSEK - ) and relates to the sale and leaseback transaction of<br />
a vessel in Norway. The payments for the coming years have been based on the assumption of a 7% interest in the vessel. The operating<br />
lease expires on 1 July 2010. <strong>Lundin</strong> <strong>Petroleum</strong> has an option to lease the vessel for a further 10 years.<br />
Group<br />
Group<br />
Lease payments during 2006 and forward 31 December <strong>2005</strong> 31 December 2004<br />
Under 1 year 36,601 –<br />
2 – 5 year 115,841 –<br />
Total 152,442 –<br />
NOTE 29 – ACCRUED EXPENSES AND PREPAID INCOME (TSEK)<br />
Accrued expenses and prepaid income<br />
comprises:<br />
Group<br />
31 December <strong>2005</strong><br />
> 73 <<br />
Group<br />
31 December 2004<br />
Parent Company<br />
31 December <strong>2005</strong><br />
Parent Company<br />
31 December 2004<br />
Holiday pay 6,496 3,996 – –<br />
Operating costs 277,255 190,208 – –<br />
General and administrative costs 747 1,119 – –<br />
Social security charges 6,000 328 442 467<br />
Salaries and wages 413 7,121 – 1,000<br />
Other 7,213 12,557 2,101 2,266<br />
298,124 215,329 2,543 3,733<br />
NOTE 30 – OTHER CURRENT LIABILITIES (TSEK)<br />
Group<br />
Group Parent Company Parent Company<br />
Other current liabilities comprises:<br />
31 December <strong>2005</strong> 31 December 2004 31 December <strong>2005</strong> 31 December 2004<br />
Overlift 67,911 45,562 – –<br />
Acquisition liabilities 38,615 37,102 – –<br />
Joint venture creditors 389,896 203,819 – –<br />
VAT payable 5,201 4,942 – –<br />
Social charges payable 7,744 9,595 – –<br />
Other 1,953 6,424 438 571<br />
511,320 307,444 438 571<br />
NOTE 31 – PLEDGED ASSETS<br />
During 2004, the Group had entered into a MUSD 385 loan facility under which an amount of MUSD 92.5 was outstanding as at 31<br />
December <strong>2005</strong>. This facility was secured by a pledge over the shares of the asset holding companies of the Group and future cash fl ows<br />
generated from the pledged companies.<br />
The amount stated for pledged assets of TSEK 1,128,763 as at 31 December <strong>2005</strong>, represents the net asset book values of the pledged<br />
companies.<br />
NOTE 32 – CONTINGENT LIABILITIES<br />
During 2002 the Group completed the acquisition of 95.3% of the outstanding shares in <strong>Lundin</strong> International SA (formerly Coparex<br />
International SA) for a cash payment of MUSD 172.5 and a deferred consideration of up to MUSD 27.5 payable depending upon the<br />
performance of certain Tunisian assets. An amount of TSEK 38,615 has been recorded against the purchase price of the shares for <strong>Lundin</strong><br />
<strong>Petroleum</strong>’s estimate of the amount payable under the deferred consideration. The contingent liability to pay the deferred consideration<br />
continued up to 31 December <strong>2005</strong> and after that the deferred consideration has been fully accrued.
NOTES<br />
NOTE 33 – EARNINGS PER SHARE<br />
Earnings per share is calculated by dividing the result of the Group attributable to the shareholders of the Parent Company by the<br />
weighted average number of shares for the year.<br />
> 74 <<br />
<strong>2005</strong> 2004<br />
The result of the Groups attributable to the shareholders of the Parent Company (in SEK) 993,506,862 598,244,995<br />
Weighted average number of shares for the year 255,685,730 252,727,926<br />
Earnings per share 3.89 2.37<br />
Diluted earnings per share is calculated by adjusting the weighted average number of shares for the year with the dilution eff ect of<br />
outstanding warrants and to divide the result of the Group attributable to shareholders of the Parent Company by the diluted weighted<br />
shares.<br />
<strong>2005</strong> 2004<br />
The result of the Groups attributable to the shareholders of the Parent Company (in SEK) 993,506,862 598,244,995<br />
Weighted average number of shares for the year 255,685,730 252,727,926<br />
Dilution eff ect of outstanding warrants<br />
Weighted average number of shares for the year after considering the dilution eff ect of<br />
1,288,393 2,406,329<br />
outstanding warrants. 256,974,123 255,134,255<br />
Earnings per share (diluted) 3.87 2.34<br />
NOTE 34 – CASH FLOW ANALYSIS – OTHER NON CASH ITEMS (TSEK)<br />
Group<br />
<strong>2005</strong><br />
Group<br />
2004<br />
Parent Company<br />
<strong>2005</strong><br />
Parent Company<br />
2004<br />
Deferred tax 618,610 350,628 – –<br />
Site restoration discount 17,085 14,503 – –<br />
Share based payments 18,981 10,712 18,981 10,712<br />
Other non-cash items 2,003 6,128 – –<br />
656,679 381,971 18,981 10,712<br />
NOTE 35 – CASH FLOW ANALYSIS - INVESTMENTS IN SUBSIDIARY ASSETS (TSEK)<br />
Group<br />
<strong>2005</strong><br />
Group<br />
2004<br />
Parent Company<br />
<strong>2005</strong><br />
Parent Company<br />
2004<br />
Oil and gas assets – 1,734,720 – –<br />
Other fi xed assets – 1,791 – –<br />
Financial fi xed assets – 269,611 – –<br />
Other current assets – 172,280 – –<br />
Provisions – -722,259 – –<br />
Long term liabilities – - – –<br />
Current liabilities – -221,295 – –<br />
Minority interest – – – –<br />
Shares in subsidiary 236 – – –<br />
Purchase price 236 1,234,848 – –<br />
Cash in acquired company – -14,657 – –<br />
236 1,220,191 – –
<strong>2005</strong><br />
The amount recorded for <strong>2005</strong> relates to the purchase of shares in <strong>Lundin</strong> International SA. If this investment had been done in 2004 the<br />
eff ect on the Group’s result for 2004 would not have been material.<br />
2004<br />
The values shown in the table represent the values assigned to the assets and liabilities of <strong>Lundin</strong> Britain Ltd (formerly DNO Britain Ltd)<br />
and <strong>Lundin</strong> Ireland Ltd (formerly Island <strong>Petroleum</strong> Developments Ltd) as at the date of acquisition by <strong>Lundin</strong> <strong>Petroleum</strong> for the purposes<br />
of consolidating into the Group accounts of <strong>Lundin</strong> <strong>Petroleum</strong> AB. If the acquisitions had occurred on 1 January 2004, the eff ect on net<br />
sales and net result would not have been material.<br />
NOTE 36 – RELATED PARTY TRANSACTIONS<br />
The Group has entered into transactions with related parties on an arms length basis as described below:<br />
The Group paid TSEK 402 (TSEK 345) to Namdo Management Services Ltd., a private corporation owned by Lukas H. <strong>Lundin</strong>, a director<br />
of the Company, pursuant to a services agreement. Namdo has approximately 12 employees and provides administration and fi nancial<br />
services to a number of public companies. Accordingly, there is no basis for allocating the amounts paid to Namdo to Mr Lukas H. <strong>Lundin</strong><br />
directly. The outstanding payable amount at balance date amounts to TSEK 185.<br />
The Group received TSEK 2,334 (TSEK 2,412 ) from Vostok Nafta Investment Ltd and related companies, for the provision of offi ce and<br />
accounting services. Vostok Nafta is considered a related party because the Honorary Chairman of <strong>Lundin</strong> <strong>Petroleum</strong> AB, Mr Adolf H.<br />
<strong>Lundin</strong> has signifi cant investment within this company. The outstanding receivable at balance date amounts to TSEK 80.<br />
NOTE 37 – AVERAGE NU<strong>MB</strong>ER OF EMPLOYEES, SALARIES, OTHER REMUNERATION AND SOCIAL SECURITY COSTS (TSEK)<br />
<strong>2005</strong> 2004<br />
Average number of employees per country Total employees of which men Total employees of which men<br />
Parent company<br />
Sweden – – 2 –<br />
Total parent company – – 2 –<br />
Subsidiary companies in Sweden – – – –<br />
Subsidiary foreign companies<br />
United Kingdom 62 55 149 132<br />
France 50 40 51 41<br />
Norway 16 12 25 20<br />
Switzerland 35 23 31 20<br />
Netherlands 6 3 5 3<br />
Indonesia 16 11 16 11<br />
Tunisia 12 9 10 6<br />
Albania – – 1 1<br />
Total subsidiary companies 197 153 288 234<br />
Total Group 197 153 290 234<br />
For the Group, a total of 20 persons held senior management and board positions (2004: 19 persons and 2003: 15 persons). Two women<br />
are included in these positions in <strong>2005</strong> (One woman during 2004, 2003 and 2002).<br />
> 75
NOTES<br />
Salaries, other remuneration and social<br />
security costs per country<br />
Parent company<br />
Salaries and other<br />
remuneration<br />
<strong>2005</strong> 2004<br />
> 76 <<br />
Social security<br />
costs<br />
Salaries and other<br />
remuneration<br />
Social security<br />
costs<br />
Sweden 5,268 1,243 4,923 1,687<br />
Total parent company 5,268 1,243 4,923 1,687<br />
Subsidiary companies in Sweden – – – –<br />
Subsidiary foreign companies<br />
United Kingdom 85,166 7,082 60,756 13,642<br />
France 16,237 8,275 18,798 9,435<br />
Norway 18,906 2,542 25,087 3,241<br />
Switzerland 42,293 3,279 39,526 2,556<br />
Netherlands 5,776 214 5,566 651<br />
Indonesia 8,860 79 4,792 284<br />
Tunisia 9,221 – 7,828 1,029<br />
Albania – – 309 –<br />
Total subsidiary companies 186,459 21,471 162,662 30,838<br />
Total Group 191,727 22,714 167,585 32,525<br />
of which defi ned contribution plan cost 8,450 11,321<br />
of which defi ned benefi t plan cost 1,236 1,219<br />
Salaries, other remuneration per country<br />
split between the Board of Directors/MD<br />
and other employees<br />
Parent company<br />
Board of Directors<br />
and MD<br />
<strong>2005</strong> 2004<br />
Other<br />
employees<br />
Board of Directors<br />
and MD<br />
Other<br />
employees<br />
Sweden 5,268 – 4,151 772<br />
Total parent company 5,268 – 4,151 772<br />
Subsidiary companies in Sweden – – – –<br />
Subsidiary foreign companies<br />
United Kingdom 2,684 82,482 6,826 53,930<br />
France – 16,237 – 18,798<br />
Norway 2,237 16,669 4,532 20,555<br />
Switzerland 8,451 33,842 10,806 28,720<br />
Netherlands 1,873 3,903 3,189 2,377<br />
Indonesia 3,009 5,851 1,306 3,486<br />
Tunisia 3,310 5,911 2,794 5,034<br />
Albania – – 309 –<br />
Total subsidiary companies 21,564 164,895 29,762 132,900<br />
Total Group 26,832 164,895 33,913 133,672
NOTE 38 – REMUNERATION TO BOARD OF DIRECTORS’ AND MANAGEMENT<br />
The Board of Directors of <strong>Lundin</strong> <strong>Petroleum</strong> has established a Compensation Committee to administer the Company’s executive<br />
compensation programme. The Committee is composed of four non-management directors and meets at least annually to receive<br />
information on and determine matters regarding executive compensation, in accordance with policies approved by the Board. The<br />
guiding philosophy of the Committee in determining compensation for executives is the need to provide a compensation package that<br />
is competitive and motivating; will attract and retain qualifi ed executives; and encourages and motivates performance. Performance<br />
includes achievement of the Company’s strategic objective of growth and the enhancement of shareholder value through increases in<br />
the stock price resulting from advances in the Company’s business, continued low cost operations and enhanced cash fl ow and earnings.<br />
In establishing compensation for executive offi cers, the Committee takes into consideration individual performance, responsibilities,<br />
length of service and levels of compensation provided by industry competitors. The committee can recommend bonus payments to<br />
executive management in respect of work related to individual projects or in special circumstances. There is no policy for the guaranteed<br />
payment of an annual bonus.<br />
Please see the page 27 for further information on the compensation committee.<br />
Salaries and other remuneration to<br />
non-executive directors (TSEK) Fees Other 1 Benefits<br />
> 77 <<br />
Pension<br />
payments 2 Total <strong>2005</strong> Total 2004<br />
Ian H. <strong>Lundin</strong> 700 2,280 – – 2,980 3,804<br />
Adolf H. <strong>Lundin</strong> 20 – – 1,236 1,256 1,239<br />
Magnus Unger 438 – – – 438 904<br />
Carl Bildt 350 – – – 350 293<br />
Kai Hietarinta 375 – – – 375 303<br />
Lukas <strong>Lundin</strong> 385 – – – 385 303<br />
William Rand 525 – – – 525 313<br />
Viveca Ax:son Johnson 195 – – – 195 –<br />
1 Other remuneration paid during <strong>2005</strong> relates to fees paid for special projects undertaken on behalf of the Group. The payment of such fees was in accordance<br />
with fees approved at the 2004 AGM.<br />
2 The pension payment to Adolf H. <strong>Lundin</strong> is described in more detail in Note 24 – Pensions.<br />
There are no severance pay agreements in place for any of the Directors.<br />
Salaries and other remuneration<br />
to Executive Management (TSEK) Salary Bonuses 4 Benefits 1<br />
Total<br />
<strong>2005</strong><br />
Total<br />
2004<br />
Pensions<br />
<strong>2005</strong> 2<br />
Pensions<br />
2004<br />
C. Ashley Heppenstall 3,236 270 464 3,970 4,578 387 304<br />
Other management3 8,622 765 757 10,144 10,995 1,142 932<br />
1 Benefi ts paid include school fees and health insurance.<br />
2 Pension contributions are payments to non-contributory pension funds of approximately fi ve times above the minimum Swiss statutory levels.<br />
3 Other management comprise the 6 Vice Presidents in offi ce during the year.<br />
4 In December <strong>2005</strong> the Compensation Committee awarded a bonus for <strong>2005</strong> of one month’s salary to the CEO and to the Vice Presidents. In January 2006 the<br />
Compensation Committee met and reassessed the bonus payments made for <strong>2005</strong> considering the employee’s contributions to the results of the Company and<br />
the achievement of personal targets. The committee awarded C. Ashley Heppenstall an additional bonus of TSEK 1,348 equal to fi ve months salary and awarded<br />
bonuses to the 6 Vice Presidents of TSEK 1,744 equal to between one and three months salary. The additional bonuses are not included in the table above.<br />
There are no severance pay agreements in place for any of the members of the executive management.<br />
The following incentive warrants have been issued to the board of directors and executive management.<br />
Incentive warrants issued Incentive warrants outstanding 31 December <strong>2005</strong><br />
2003<br />
2004<br />
<strong>2005</strong><br />
2003<br />
2004<br />
<strong>2005</strong><br />
Non-executive Directors programme programme programme<br />
programme programme programme<br />
Ian H. <strong>Lundin</strong> 400,000 – – 150,000 – –<br />
The non-executive directors received incentive warrants whilst employed in an executive management position.<br />
Executive Management<br />
2003<br />
programme<br />
Incentive warrants issued Incentive warrants outstanding 31 December <strong>2005</strong><br />
2004<br />
programme<br />
<strong>2005</strong><br />
programme<br />
2003<br />
programme<br />
2004<br />
programme<br />
<strong>2005</strong><br />
programme<br />
C. Ashley Heppenstall 600,000 350,000 400,000 – 150,000 400,000<br />
Other management 795,000 500,000 650,000 50,000 380,000 650,000<br />
For incentive warrants, see also note 39.
NOTES<br />
NOTE 39 – INCENTIVE WARRANTS PROGRAMME<br />
The Company runs an incentive programme for employees whereby warrants are issued to employees enabling them to buy shares in the<br />
company. The warrants were issued at a price equal to or at a premium to the average share price for the ten trading days following the<br />
AGM. The warrants are valid for three years but can not be exercised within the fi rst year of issue. Issued warrants to employees leaving<br />
the Company within the fi rst year of issue, are forfeited.<br />
Movements in the number of incentive warrants outstanding and their related weighted average exercise prices are as follows:<br />
Average weighted<br />
exercise price in<br />
SEK per share<br />
<strong>2005</strong> 2004<br />
Incentive warrants<br />
outstanding<br />
> 78 <<br />
Average weighted<br />
exercise price in<br />
SEK per share<br />
Incentive warrants<br />
outstanding<br />
At 1 January 24.11 5,249,800 4.15 5,247,300<br />
Granted 60.20 2,900,000 45.80 2,250,000<br />
Forfeited – – 45.80 -65,000<br />
Exercised 17.48 -3,391,800 7.16 -2,182,500<br />
Lapsed 45.80 -80,000 – –<br />
At 31 December 50.93 4,678,000 24.11 5,249,800<br />
The weighted average share price relating to the incentive warrants exercised during <strong>2005</strong> amounted to SEK 68.77 per share.<br />
The fair value of incentive warrants granted during the period using Black & Scholes method valuation model amounted to TSEK 21,286<br />
based on an assessed volatility of 27% and the continuously compounded Swedish government bond interest rate of 2.38%. The total<br />
expense accounted for during the period amounted to TSEK 18,981.<br />
Incentive warrants outstanding at the end of the year have the following expiry date and exercise prices:<br />
Issued 2003 Issued 2004 Issued <strong>2005</strong><br />
Exercise price (SEK) 10.10 45.80 60.20<br />
Exercise period 31 May 2004–<br />
31 May <strong>2005</strong>–<br />
15 June 2006–<br />
31 May 2006<br />
31 May 2007<br />
31 May 2008<br />
Valuation per warrant 1 2.53 7.97 7.34<br />
1 The valuation has been calculated using the Black & Scholes method.<br />
NOTE 40 – SUBSEQUENT EVENTS<br />
In the UK Budget 2006 dated 22 March 2006 it was announced that the oil and gas supplemental tax will be increased from 10% to 20%<br />
in 2006. This will increase the eff ective tax rate for the UK oil and gas properties from 40% to 50%. The eff ects of this increase will be<br />
accounted for during the year ended 31 December 2006.<br />
At 7 April 2006, the Board of Directors and the President of <strong>Lundin</strong> <strong>Petroleum</strong> AB have adopted this annual report for the fi nancial year<br />
ended 31 December <strong>2005</strong>.<br />
Stockholm, 7 April 2006<br />
Ian H. <strong>Lundin</strong> C. Ashley Heppenstall Carl Bildt<br />
Chairman of the Board President & CEO<br />
Adolf H. <strong>Lundin</strong> Lukas H. <strong>Lundin</strong> Kai Hietarinta<br />
Honorary Chairman<br />
Viveca Ax:son Johnson William A. Rand Magnus Unger
To the annual meeting of the shareholders of <strong>Lundin</strong> <strong>Petroleum</strong> AB (publ)<br />
Corporate identity number 556610-8055<br />
We have audited the annual accounts, the consolidated accounts, the accounting records and the administration of the board of directors<br />
and the managing director of <strong>Lundin</strong> <strong>Petroleum</strong> AB for the year <strong>2005</strong>. The board of directors and the managing director are responsible<br />
for these accounts and the administration of the company as well as for the application of the <strong>Annual</strong> Accounts Act when preparing the<br />
annual accounts and the application of international fi nancial reporting standards IFRS as adopted by the EU and the <strong>Annual</strong> Accounts<br />
Act when preparing the consolidated accounts. Our responsibility is to express an opinion on the annual accounts, the consolidated<br />
accounts and the administration based on our audit.<br />
We conducted our audit in accordance with generally accepted auditing standards in Sweden. Those standards require that we plan<br />
and perform the audit to obtain reasonable assurance that the annual accounts and the consolidated accounts are free of material<br />
misstatement. An audit includes examining, on a test basis, evidence supporting the amounts and disclosures in the accounts. An audit<br />
also includes assessing the accounting principles used and their application by the board of directors and the managing director and<br />
signifi cant estimates made by the board of directors and the managing director when preparing the annual accounts and consolidated<br />
accounts as well as evaluating the overall presentation of information in the annual accounts and the consolidated accounts. As a basis<br />
for our opinion concerning discharge from liability, we examined signifi cant decisions, actions taken and circumstances of the company<br />
in order to be able to determine the liability, if any, to the company of any board member or the managing director. We also examined<br />
whether any board member or the managing director has, in any other way, acted in contravention of the Companies Act, the <strong>Annual</strong><br />
Accounts Act or the Articles of Association. We believe that our audit provides a reasonable basis for our opinion set out below.<br />
The annual accounts have been prepared in accordance with the <strong>Annual</strong> Accounts Act and give a true and fair view of the company’s<br />
fi nancial position and results of operations in accordance with generally accepted accounting principles in Sweden. The consolidated<br />
accounts have been prepared in accordance with international fi nancial reporting standards IFRSs as adopted by the EU and the <strong>Annual</strong><br />
Accounts Act and give a true and fair view of the group’s fi nancial position and results of operations. The statutory administration report is<br />
consistent with the other parts of the annual accounts and the consolidated accounts.<br />
We recommend to the annual meeting of shareholders that the income statements and balance sheets of the parent company and the<br />
group be adopted, that the profi t of the parent company be dealt with in accordance with the proposal in the Directors’ report and that<br />
the members of the board of directors and the managing director be discharged from liability for the fi nancial year.<br />
Stockholm, 7 April 2006<br />
Carl-Eric Bohlin Klas Brand<br />
Authorised Public Accountant Authorised Public Accountant<br />
PricewaterhouseCoopers AB PricewaterhouseCoopers AB<br />
> 79 <<br />
AUDITORS’ REPORT
SUPPLEMENTAL INFORMATION – RESERVE QUANTITY INFORMATION<br />
UNAUDITED<br />
Proved and probable oil<br />
reserves<br />
Total<br />
Mbbl<br />
UK<br />
Mbbl<br />
France<br />
Mbbl<br />
Netherlands<br />
Mbbl<br />
> 80 <<br />
Tunisia<br />
Mbbl<br />
Norway<br />
Mbbl<br />
Venezuela<br />
Mbbl<br />
Indonesia<br />
Mbbl<br />
1 January 2004 56,616 – 26,006 42 6,218 4,768 8,180 11,402 –<br />
Changes during the year<br />
- acquisitions 85,131 54,283 – – – 30,848 – – –<br />
- sales -4,509 – – – -397 -4,112 – – –<br />
- revisions -5,875 – -3,558 767 -95 – -2,393 -596 –<br />
- extensions and discoveries 3,055 – 2,287 – – – – 768 –<br />
- production -8,566 -3,974 -1,561 -4 -574 -870 -753 -830 –<br />
69,236 50,309 -2,832 763 -1,066 25,866 -3,146 -658 –<br />
31 December 2004 125,852 50,309 23,174 805 5,152 30,634 5,034 10,744 –<br />
<strong>2005</strong><br />
Changes during the year<br />
- acquisitions – – – – – – – – –<br />
- sales – – – – – – – – –<br />
- revisions 10,815 6,616 -1,590 -646 -68 4,395 -175 2,283 –<br />
- extensions and discoveries 4,510 4,510 – – – – – – –<br />
- production -11,127 -7,361 -1,534 -13 -355 -337 -716 -811 –<br />
4,198 3,765 -3,124 -659 -423 4,058 -891 1,472 –<br />
31 December <strong>2005</strong> 130,050 54,074 20,050 146 4,729 34,692 4,143 12,216 –<br />
Proved and probable gas<br />
reserves 1<br />
Total<br />
MMscf<br />
UK<br />
MMscf<br />
France<br />
MMscf<br />
Netherlands<br />
MMscf<br />
Tunisia<br />
MMscf<br />
Norway<br />
MMscf<br />
Venezuela<br />
MMscf<br />
Indonesia<br />
MMscf<br />
1 January 2004 95,173 – – 48,468 – 12,572 5,526 28,607 –<br />
Ireland<br />
Mbbl<br />
Ireland<br />
MMscf<br />
Changes during the year<br />
- acquisitions 68,907 – – – – 34,107 – – 34,800<br />
- sales -12,429 – – – – -12,429 – – –<br />
- revisions -43,854 – – -5,214 – – -3,089 -1,711 -33,840<br />
- extensions and discoveries – – – – – – – – –<br />
- production -7,127 – – -5,665 – -169 -449 -64 -780<br />
5,497 – – -10,879 – 21,509 -3,538 -1,775 180<br />
31 December 2004 100,670 – – 37,589 – 34,081 1,988 26,832 180<br />
<strong>2005</strong><br />
Changes during the year<br />
- acquisitions – – – – – – – – –<br />
- sales -35 – – – – – – – -35<br />
- revisions 1,187 – – 2,145 – 3,877 -363 -4,472 –<br />
- extensions and discoveries – – – – – – – – –<br />
- production -5,740 – – -5,054 – -140 -317 -84 -145<br />
-4,588 – – -2,909 – 3,737 -680 -4,556 -180<br />
31 December <strong>2005</strong> 96,082 – – 34,680 – 37,818 1,308 22,276 –<br />
1 The Company has used a conversion factor of 6,000 scf equals one boe.<br />
Of the total proved and probable oil and gas reserves at 31 December <strong>2005</strong>, 58 Mbbl and 82 MMscf of gas are attributable to minority<br />
shareholders of certain subsidiaries of the Group.<br />
Reserves as at 31 December <strong>2005</strong> of 146.1 MMboe have been certifi ed by Gaff ney, Cline & Associates.
FINANCIAL REPORT DATES<br />
<strong>Lundin</strong> <strong>Petroleum</strong> will publish the following interim reports:<br />
■ 16 May 2006 Three month report 2006.<br />
■ 16 August 2006 Six month report 2006.<br />
■ 15 November 2006 Nine month report 2006.<br />
■ February 2007 Year End report 2006.<br />
The reports are available on <strong>Lundin</strong> <strong>Petroleum</strong>’s website, www.lundinpetroleum.com<br />
direct after public announcement in Swedish and<br />
English. The reports are sent automatically to shareholders who have<br />
requested the information.<br />
ANNUAL GENERAL MEETING<br />
The <strong>Annual</strong> General Meeting (AGM) is held within six months from the<br />
close of the fi nancial year. All shareholders who are registered in the<br />
shareholders’ registry and who have duly notifi ed their intention to<br />
attend the AGM may do so and vote in accordance with their level of<br />
shareholding. Shareholders who cannot participate personally may be<br />
represented by proxy.<br />
The AGM of the shareholders is to be held on Wednesday, 17 May 2006<br />
at 13.00 (Swedish time). Location: China Teatern (for registration Berns<br />
main entrance, 1 fl oor down) Berzelii Park, in Stockholm.<br />
Attendance at the meeting<br />
Shareholders wishing to attend the meeting shall:<br />
■ be recorded in the share register maintained by the Swedish Central<br />
Securities Depository (VPC) on Thursday 11 May 2006; and<br />
■ notify <strong>Lundin</strong> <strong>Petroleum</strong> of their intention to attend the meeting no<br />
later than Friday 12 May 2006<br />
Confi rmation of attendance<br />
■ in writing to <strong>Lundin</strong> <strong>Petroleum</strong> AB, Hovslagargatan 5,<br />
SE-111 48 Stockholm, Sweden<br />
■ by telephone: +46-8-440 54 50<br />
■ by fax: +46-8-440 54 59<br />
■ by e-mail: bolagsstamma@lundin.ch<br />
When registering please give your name, personal social security<br />
number/company registration no., address and daytime telephone<br />
number.<br />
Shareholders whose shares are registered in the name of a nominee must<br />
temporarily register the shares in their own names in the shareholders’<br />
register. Such registration must be eff ected by 11 May 2006.<br />
Printed in Sweden<br />
Landsten Reklam – Vindspelet Grafi ska<br />
Photography: André Longchamp, Ulf Blomberg, Kaia Moens<br />
DEFINITIONS<br />
An extensive list of defi nitions can be found on the <strong>Lundin</strong> <strong>Petroleum</strong> website<br />
www.lundin-petroleum.com under the heading “Defi nitions”<br />
Abbreviations<br />
SEK Swedish krona<br />
USD US dollar<br />
CHF Swiss franc<br />
NOK Norwegian krona<br />
GBP British pound<br />
TSEK Thousand SEK<br />
TUSD Thousand USD<br />
TCHF Thousand CHF<br />
MSEK Million SEK<br />
MUSD Million USD<br />
Oil related terms and measurements<br />
bbl Barrel (1 barrel = 159 litres)<br />
bcf Billion cubic feet (1 cubic foot = 0.028 m 3 )<br />
boe Barrels of oil equivalents<br />
boepd Barrels of oil equivalents per day<br />
bopd Barrels of oil per day<br />
Mbbl Thousand barrels (in Latin mille)<br />
MMbo Million barrels of oil<br />
MMboe Million barrels of oil equivalents<br />
MMbopd Million barrels of oil per day<br />
Mcf Thousand cubic feet<br />
Mcfpd Thousand cubic feet per day<br />
MMscf Million standard cubic feet<br />
Probable reserves<br />
Probable reserves are those unproved reserves which analysis of geological and<br />
engineering data suggests are more likely than not to be recoverable.In this<br />
context, when probablistic methods are used, there should be at least a 50%<br />
probability that the quantities actually recovered will equal or exceed the sum<br />
of estimated proved plus probable reserves.<br />
Proved reserves<br />
Proved reserves are those quantities of petroleum which, by analysis of<br />
geological and engineering data, can be estimated with reasonable certainty to<br />
be commercially recoverable, from a given date forward, from known reservoirs<br />
and under current economic conditions, operating methods and governmental<br />
regulations. Proved reserves can be categorised as developed or undeveloped.<br />
If deterministic methods are used, the term reasonable certainty is intended<br />
to express a high degree of confi dence that the quantities will be recovered. If<br />
probablistic methods are used, there should be at least a 90% probability that<br />
the quantities actually recovered will equal or exceed the estimates.
Corporate Head Offi ce<br />
<strong>Lundin</strong> <strong>Petroleum</strong> AB (publ)<br />
Hovslagargatan 5<br />
SE - 111 48 Stockholm<br />
Sweden<br />
Telephone: 46-8-440 54 50<br />
Telefax: 46-8-440 54 59<br />
E-mail: info@lundin.ch<br />
www.lundin-petroleum.com<br />
President’s Offi ce<br />
<strong>Lundin</strong> <strong>Petroleum</strong> AB (publ)<br />
5 chemin de la Pallanterie<br />
CH - 1222 Vésenaz<br />
Switzerland<br />
Telephone: 41-22-595 10 00<br />
Telefax 41-22-595 10 05<br />
E-mail: info@lundin.ch