the full publication PDF - Korea Economic Institute
the full publication PDF - Korea Economic Institute
the full publication PDF - Korea Economic Institute

Create successful ePaper yourself
Turn your PDF publications into a flip-book with our unique Google optimized e-Paper software.
Lee: The South <strong>Korea</strong>n Perspective | 151<br />
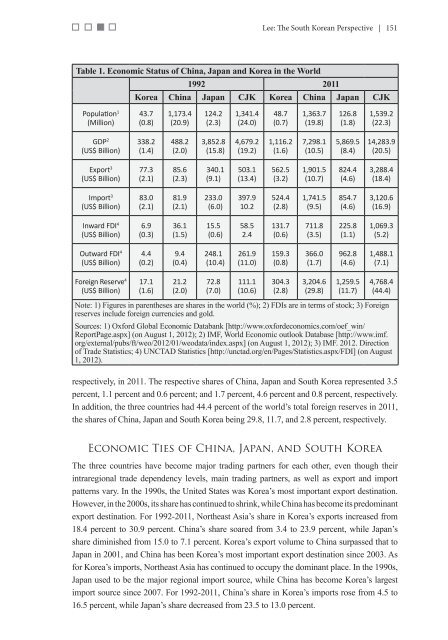
Table 1. <strong>Economic</strong> Status of China, Japan and <strong>Korea</strong> in <strong>the</strong> World<br />
1992 2011<br />
<strong>Korea</strong> China Japan CJK <strong>Korea</strong> China Japan CJK<br />
Population 1<br />
(Million)<br />
43.7<br />
(0.8)<br />
1,173.4<br />
(20.9)<br />
124.2<br />
(2.3)<br />
1,341.4<br />
(24.0)<br />
48.7<br />
(0.7)<br />
1,363.7<br />
(19.8)<br />
126.8<br />
(1.8)<br />
1,539.2<br />
(22.3)<br />
GDP 2<br />
(US$ Billion)<br />
338.2<br />
(1.4)<br />
488.2<br />
(2.0)<br />
3,852.8<br />
(15.8)<br />
4,679.2<br />
(19.2)<br />
1,116.2<br />
(1.6)<br />
7,298.1<br />
(10.5)<br />
5,869.5<br />
(8.4)<br />
14,283.9<br />
(20.5)<br />
Export 3<br />
(US$ Billion)<br />
77.3<br />
(2.1)<br />
85.6<br />
(2.3)<br />
340.1<br />
(9.1)<br />
503.1<br />
(13.4)<br />
562.5<br />
(3.2)<br />
1,901.5<br />
(10.7)<br />
824.4<br />
(4.6)<br />
3,288.4<br />
(18.4)<br />
Import 3<br />
(US$ Billion)<br />
83.0<br />
(2.1)<br />
81.9<br />
(2.1)<br />
233.0<br />
(6.0)<br />
397.9<br />
10.2<br />
524.4<br />
(2.8)<br />
1,741.5<br />
(9.5)<br />
854.7<br />
(4.6)<br />
3,120.6<br />
(16.9)<br />
Inward FDI 4<br />
(US$ Billion)<br />
6.9<br />
(0.3)<br />
36.1<br />
(1.5)<br />
15.5<br />
(0.6)<br />
58.5<br />
2.4<br />
131.7<br />
(0.6)<br />
711.8<br />
(3.5)<br />
225.8<br />
(1.1)<br />
1,069.3<br />
(5.2)<br />
Outward FDI 4<br />
(US$ Billion)<br />
4.4<br />
(0.2)<br />
9.4<br />
(0.4)<br />
248.1<br />
(10.4)<br />
261.9<br />
(11.0)<br />
159.3<br />
(0.8)<br />
366.0<br />
(1.7)<br />
962.8<br />
(4.6)<br />
1,488.1<br />
(7.1)<br />
Foreign Reserve 4<br />
(US$ Billion)<br />
17.1<br />
(1.6)<br />
21.2<br />
(2.0)<br />
72.8<br />
(7.0)<br />
111.1<br />
(10.6)<br />
304.3<br />
(2.8)<br />
3,204.6<br />
(29.8)<br />
1,259.5<br />
(11.7)<br />
4,768.4<br />
(44.4)<br />
Note: 1) Figures in paren<strong>the</strong>ses are shares in <strong>the</strong> world (%); 2) FDIs are in terms of stock; 3) Foreign<br />
reserves include foreign currencies and gold.<br />
Sources: 1) Oxford Global <strong>Economic</strong> Databank [http://www.oxfordeconomics.com/oef_win/<br />
ReportPage.aspx] (on August 1, 2012); 2) IMF, World <strong>Economic</strong> outlook Database [http://www.imf.<br />
org/external/pubs/ft/weo/2012/01/weodata/index.aspx] (on August 1, 2012); 3) IMF. 2012. Direction<br />
of Trade Statistics; 4) UNCTAD Statistics [http://unctad.org/en/Pages/Statistics.aspx/FDI] (on August<br />
1, 2012).<br />
respectively, in 2011. The respective shares of China, Japan and South <strong>Korea</strong> represented 3.5<br />
percent, 1.1 percent and 0.6 percent; and 1.7 percent, 4.6 percent and 0.8 percent, respectively.<br />
In addition, <strong>the</strong> three countries had 44.4 percent of <strong>the</strong> world’s total foreign reserves in 2011,<br />
<strong>the</strong> shares of China, Japan and South <strong>Korea</strong> being 29.8, 11.7, and 2.8 percent, respectively.<br />
<strong>Economic</strong> Ties of China, Japan, and South <strong>Korea</strong><br />
The three countries have become major trading partners for each o<strong>the</strong>r, even though <strong>the</strong>ir<br />
intraregional trade dependency levels, main trading partners, as well as export and import<br />
patterns vary. In <strong>the</strong> 1990s, <strong>the</strong> United States was <strong>Korea</strong>’s most important export destination.<br />
However, in <strong>the</strong> 2000s, its share has continued to shrink, while China has become its predominant<br />
export destination. For 1992-2011, Nor<strong>the</strong>ast Asia’s share in <strong>Korea</strong>’s exports increased from<br />
18.4 percent to 30.9 percent. China’s share soared from 3.4 to 23.9 percent, while Japan’s<br />
share diminished from 15.0 to 7.1 percent. <strong>Korea</strong>’s export volume to China surpassed that to<br />
Japan in 2001, and China has been <strong>Korea</strong>’s most important export destination since 2003. As<br />
for <strong>Korea</strong>’s imports, Nor<strong>the</strong>ast Asia has continued to occupy <strong>the</strong> dominant place. In <strong>the</strong> 1990s,<br />
Japan used to be <strong>the</strong> major regional import source, while China has become <strong>Korea</strong>’s largest<br />
import source since 2007. For 1992-2011, China’s share in <strong>Korea</strong>’s imports rose from 4.5 to<br />
16.5 percent, while Japan’s share decreased from 23.5 to 13.0 percent.