APROMAS JSC - miepo
APROMAS JSC - miepo
APROMAS JSC - miepo

Create successful ePaper yourself
Turn your PDF publications into a flip-book with our unique Google optimized e-Paper software.
Apromas <strong>JSC</strong><br />
PUBLIC COMPANIES PRIVATISATION SERIES<br />
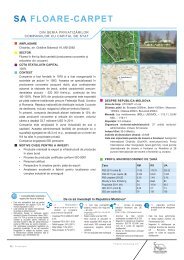
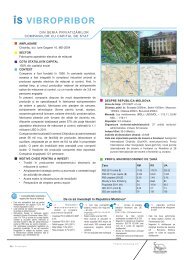
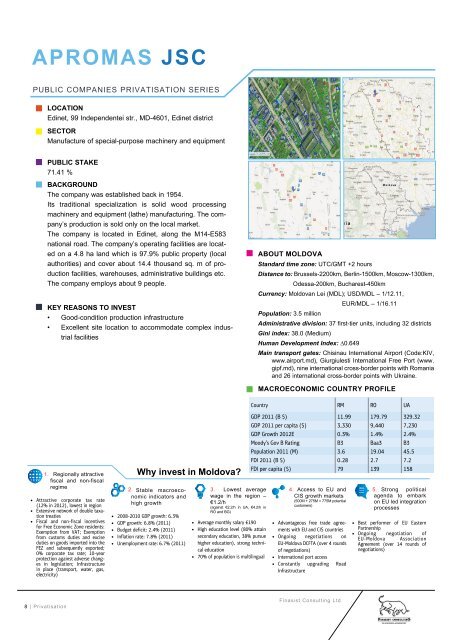
LOCATION<br />
Edinet, 99 Independentei str., MD-4601, Edinet district<br />
SECTOR<br />
Manufacture of special-purpose machinery and equipment<br />
PUBLIC STAKE<br />
71.41 %<br />
BACKGROUND<br />
The company was established back in 1954.<br />
Its traditional specialization is solid wood processing<br />
machinery and equipment (lathe) manufacturing. The company’s<br />
production is sold only on the local market.<br />
The company is located in Edinet, along the M14-E583<br />
national road. The company’s operating facilities are located<br />
on a 4.8 ha land which is 97.9% public property (local<br />
authorities) and cover about 14.4 thousand sq. m of production<br />
facilities, warehouses, administrative buildings etc.<br />
The company employs about 9 people.<br />
KEY REASONS TO INVEST<br />
• Good-condition production infrastructure<br />
• Excellent site location to accommodate complex industrial<br />
facilities<br />
About Moldova<br />
Standard time zone: UTC/GMT +2 hours<br />
Distance to: Brussels-2200km, Berlin-1500km, Moscow-1300km,<br />
Odessa-200km, Bucharest-450km<br />
Currency: Moldovan Lei (MDL); USD/MDL – 1/12.11,<br />
EUR/MDL – 1/16.11<br />
Population: 3.5 million<br />
Administrative division: 37 first-tier units, including 32 districts<br />
Gini index: 38.0 (Medium)<br />
Human Development Index: ∆0.649<br />
Main transport gates: Chisinau International Airport (Code:KIV,<br />
www.airport.md), Giurgiulesti International Free Port (www.<br />
gipf.md), nine international cross-border points with Romania<br />
and 26 international cross-border points with Ukraine.<br />
Macroeconomic Country Profile<br />
Country RM RO UA<br />
1. Regionally attractive<br />
fiscal and non-fiscal<br />
regime<br />
• Attractive corporate tax rate<br />
(12% in 2012), lowest in region<br />
• Extensive network of double taxation<br />
treaties<br />
• Fiscal and non-fiscal incentives<br />
for Free Economic Zone residents:<br />
Exemption from VAT; Exemption<br />
from customs duties and excise<br />
duties on goods imported into the<br />
FEZ and subsequently exported;<br />
0% corporate tax rate; 10-year<br />
protection against adverse changes<br />
in legislation; Infrastructure<br />
in place (transport, water, gas,<br />
electricity)<br />
Why invest in Moldova<br />
2. Stable macroeconomic<br />
indicators and<br />
CIS growth markets<br />
3. Lowest average 4. Access to EU and 5.<br />
(500M + 275M = 775M potential<br />
high growth<br />
customers)<br />
• 2008-2010 GDP growth: 6.3%<br />
• GDP growth: 6.8% (2011)<br />
• Budget deficit: 2.4% (2011)<br />
• Inflation rate: 7.8% (2011)<br />
• Unemployment rate: 6.7% (2011)<br />
wage in the region –<br />
€1.2/h<br />
(against €2.2/h in UA, €4.2/h in<br />
RO and BG)<br />
• Average monthly salary €190<br />
• High education level (80% attain<br />
secondary education, 38% pursue<br />
higher education), strong technical<br />
education<br />
• 70% of population is multilingual<br />
GDP 2011 (B $) 11.99 179.79 329.32<br />
GDP 2011 per capita ($) 3,330 9,440 7,230<br />
GDP Growth 2012E 0.3% 1.4% 2.4%<br />
Moody’s Gov B Rating B3 Baa3 B3<br />
Population 2011 (M) 3.6 19.04 45.5<br />
FDI 2011 (B $) 0.28 2.7 7.2<br />
FDI per capita ($) 79 139 158<br />
• Advantageous free trade agreements<br />
with EU and CIS countries<br />
• Ongoing negotiations on<br />
EU-Moldova DCFTA (over 4 rounds<br />
of negotiations)<br />
• International port access<br />
• Constantly upgrading Road<br />
Infrastructure<br />
Strong political<br />
agenda to embark<br />
on EU led integration<br />
processes<br />
• Best performer of EU Eastern<br />
Partnership<br />
• Ongoing negotiation of<br />
EU-Moldova Association<br />
Agreement (over 14 rounds of<br />
negotiations)<br />
8 | Privatisation<br />
Finasist Consulting Ltd.
Key financials<br />
BALANCE SHEET (USD*) 2009 2010 2011<br />
1 LONG-TERM ASSETS<br />
1.1 Intangible assets 010 0 0 0<br />
1.2 Amortization of intangible assets 011 0 0 0<br />
1.3 Long-term tangible assets 020 1.429.120 1.415.633 1.329.583<br />
1.4 Depreciation of long-term tangible 021 713.719 694.082 598.261<br />
assets<br />
1.5 Long-term financial assets 030 0 0 0<br />
Total for section 1 040 715.401 721.550 731.322<br />
2 CURRENT ASSETS<br />
2.1 Stocks of goods and materials 050 152.591 158.378 170.860<br />
2.2 Short-term receivables 060 6.772 1.082 663<br />
2.3 Short-term receivables related to 070 326 3 0<br />
budget settlements<br />
2.4 Short-term investments 080 0 0 0<br />
2.5 Cash 090 450 335 303<br />
2.6 Other short-term assets 100 0 633 590<br />
Total for section 2 110 160.138 160.432 172.416<br />
TOTAL FOR ASSETS 120 875.539 881.982 903.737<br />
3 SHAREHOLDER'S EQUITY<br />
3.1 Share capital 130 687.655 696.017 722.068<br />
3.2 Unpaid capital 140 0 0 0<br />
3.3 Withdrawn capital 150 0 0 0<br />
3.4 Reserves 160 165.659 167.674 173.950<br />
3.5 Corrections of prior period results 170 0 0 0<br />
3.6 Retained earnings (uncovered loss) 180 -1.100 -101 -13.714<br />
of previous years<br />
3.7 Net income (net loss) of the reporting<br />
190 1.001 -13.118 -8.478<br />
year<br />
3.8 Net income used in the reporting 200 0 0 0<br />
year<br />
3.9 Additional capital 210 0 0 0<br />
3.10 Secondary capital 220 0 0 0<br />
Total for section 3 230 853.214 850.472 873.826<br />
4 LONG-TERM LIABILITIES<br />
4.1 Long-term financial debt 240 0 0 0<br />
4.2 Calculated long-term debt 250 0 0 0<br />
Total for section 4 260 0 0 0<br />
5 SHORT-TERM LIABILITIES<br />
5.1 Financial liabilities 270 0 0 0<br />
5.2 Trade liabilities 280 1.549 1.465 1.314<br />
5.3 Liabilities on wages 290 9.522 16.405 8.006<br />
5.4 Liabilities on insurance 300 2.096 5.950 11.558<br />
5.5 Liabilities on budget settlements 310 6.227 6.524 7.865<br />
5.6 Other calculated liabilities 320 2.932 1.166 1.168<br />
Total for section 5 330 22.326 31.510 29.911<br />
TOTAL FOR EQUITY & LIABILITIES 340 875.539 881.982 903.737<br />
* values in USD are calculated based on MDL data presented by the companies using the exchange rate MDL/USD at the end of each year<br />
Full-time privatization promotion<br />
and investment attraction team<br />
Angela Susanu<br />
Deputy Director of Moldovan Public<br />
Property Agency<br />
office@app.gov.md<br />
Tel. +373 22 234350<br />
Octavian Berzan<br />
Deputy Director of Moldovan Investment<br />
and Export Promotion Organisation<br />
office@<strong>miepo</strong>.md<br />
Tel. +373 22 232703<br />
CONTACTS<br />
Leadership team<br />
Valeriu Lazar<br />
Deputy Prime Minister<br />
Minister of Economy of the Republic<br />
of Moldova<br />
Tudor Copaci<br />
Director of Public Property Agency of<br />
Moldova<br />
Denis Jelimalai<br />
Director of Moldovan Investment and<br />
Export Promotion Organisation<br />
GENERAL DISCLOSURE<br />
This company profile teaser is essential reading for any<br />
serious investor, providing comprehensive financial information<br />
on a company’s performance, position and cash<br />
flows over the past 3 years. This information, extracted<br />
from reported financial statements, forms the building<br />
blocks for any analysis undertaken by investment professionals.<br />
The information in this presentation is subject to updating,<br />
revision, further verification and amendment without notice.<br />
No reliance may be placed for any purpose whatsoever on<br />
the information or opinions contained in this investment<br />
profile or any other document or oral statement or on the<br />
completeness, accuracy or fairness of the information and/<br />
or opinions therein. This research is based on current<br />
public information that is considered reliable. Investors<br />
shouldn’t consider this report as a single factor in making<br />
their investment decision.<br />
This research is not an offer to sell or the solicitation of<br />
an offer to buy. It does not constitute a personal recommendation<br />
or take into account the particular investment<br />
objectives, financial situations, or needs of individual<br />
investor. One should consider whether any advice or recommendation<br />
in this research is suitable for their particular<br />
circumstances and, if appropriate, seek professional<br />
advice, including tax advice. Past performance is not a<br />
guide to future performance, future returns are not guaranteed,<br />
and a loss of original capital may occur. Fluctuations<br />
in exchange rates could have adverse effects on the value<br />
or price of, or income derived from, certain investments.<br />
PROFIT & LOSS STATEMENT (USD*) 2009 2010 2011<br />
Net Sales 010 13.902 11.167 9.572<br />
Cost of sales 020 12.038 9.319 7.815<br />
Gross profit (loss) 030 1.864 1.848 1.757<br />
Other operating incomes 040 6.752 2.985 22.002<br />
Selling and marketing expenses 050 673 0 0<br />
General and administrative expenses 060 29.560 19.204 24.033<br />
Other operating expenses 070 54 324 15.603<br />
Operating result: profit (loss) 080 -21.671 -14.695 -15.877<br />
Investing result: profit (loss) 090 22.520 1.577 6.331<br />
Financing result: profit (loss) 100 152 0 1.069<br />
Financial-economic result: profit 110 1.001 -13.118 -8.478<br />
(loss)<br />
Extraordinary result: profit (loss) 120 0 0 0<br />
Profit (loss) of the reporting period 130 1.001 -13.118 -8.478<br />
before taxation<br />
Expenses (savings) on income tax 140 0 0 0<br />
Net profit (loss) 150 1.001 -13.118 -8.478<br />
GROWTH RATES (YOY)<br />
Total assets 0,7% 2,5%<br />
Long-term assets 0,9% 1,4%<br />
Current assets 0,2% 7,5%<br />
Total equity -0,3% 2,7%<br />
Total liabilities 41,1% -5,1%<br />
Net sales -19,7% -14,3%<br />
Net profit -1410,9% -35,4%<br />
RATIOS<br />
ROE 0,1% -1,5% -1,0%<br />
ROA 0,1% -1,5% -0,9%<br />
ROS 7,2% -117,5% -88,6%<br />
Current liquidity ratio 13,9% 19,6% 17,3%<br />
* values in USD are calculated based on MDL data presented by the companies using the exchange rate MDL/USD at the end of each year<br />
Public Property Agency of Republic of Moldova<br />
Moldovan Investment and Export Promotion Organization<br />
Privatisation | 9