Book Information / Sample Chapter(s) (PDF) - Textbook Media
Book Information / Sample Chapter(s) (PDF) - Textbook Media
Book Information / Sample Chapter(s) (PDF) - Textbook Media

You also want an ePaper? Increase the reach of your titles
YUMPU automatically turns print PDFs into web optimized ePapers that Google loves.
<strong>Chapter</strong> 4 Demand and Supply<br />
71<br />
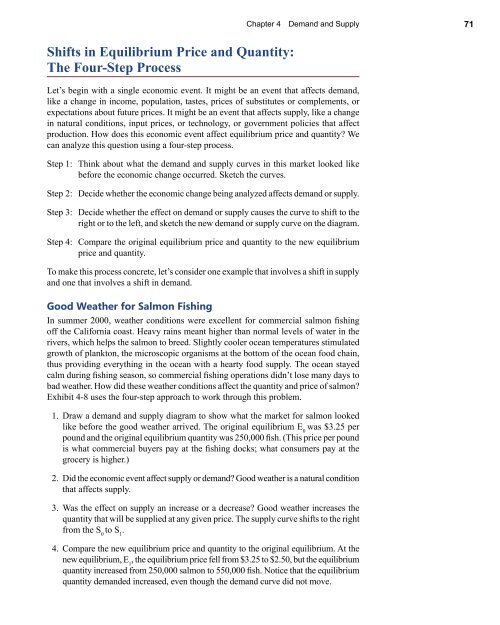
Shifts in Equilibrium Price and Quantity:<br />
The Four-Step Process<br />
Let’s begin with a single economic event. It might be an event that affects demand,<br />
like a change in income, population, tastes, prices of substitutes or complements, or<br />
expectations about future prices. It might be an event that affects supply, like a change<br />
in natural conditions, input prices, or technology, or government policies that affect<br />
production. How does this economic event affect equilibrium price and quantity We<br />
can analyze this question using a four-step process.<br />
Step 1: Think about what the demand and supply curves in this market looked like<br />
before the economic change occurred. Sketch the curves.<br />
Step 2: Decide whether the economic change being analyzed affects demand or supply.<br />
Step 3: Decide whether the effect on demand or supply causes the curve to shift to the<br />
right or to the left, and sketch the new demand or supply curve on the diagram.<br />
Step 4: Compare the original equilibrium price and quantity to the new equilibrium<br />
price and quantity.<br />
To make this process concrete, let’s consider one example that involves a shift in supply<br />
and one that involves a shift in demand.<br />
Good Weather for Salmon Fishing<br />
In summer 2000, weather conditions were excellent for commercial salmon fishing<br />
off the California coast. Heavy rains meant higher than normal levels of water in the<br />
rivers, which helps the salmon to breed. Slightly cooler ocean temperatures stimulated<br />
growth of plankton, the microscopic organisms at the bottom of the ocean food chain,<br />
thus providing everything in the ocean with a hearty food supply. The ocean stayed<br />
calm during fishing season, so commercial fishing operations didn’t lose many days to<br />
bad weather. How did these weather conditions affect the quantity and price of salmon<br />
Exhibit 4-8 uses the four-step approach to work through this problem.<br />
1. Draw a demand and supply diagram to show what the market for salmon looked<br />
like before the good weather arrived. The original equilibrium E 0<br />
was $3.25 per<br />
pound and the original equilibrium quantity was 250,000 fish. (This price per pound<br />
is what commercial buyers pay at the fishing docks; what consumers pay at the<br />
grocery is higher.)<br />
2. Did the economic event affect supply or demand Good weather is a natural condition<br />
that affects supply.<br />
3. Was the effect on supply an increase or a decrease Good weather increases the<br />
quantity that will be supplied at any given price. The supply curve shifts to the right<br />
from the S 0<br />
to S 1<br />
.<br />
4. Compare the new equilibrium price and quantity to the original equilibrium. At the<br />
new equilibrium, E 1<br />
, the equilibrium price fell from $3.25 to $2.50, but the equilibrium<br />
quantity increased from 250,000 salmon to 550,000 fish. Notice that the equilibrium<br />
quantity demanded increased, even though the demand curve did not move.