Book Information / Sample Chapter(s) (PDF) - Textbook Media
Book Information / Sample Chapter(s) (PDF) - Textbook Media
Book Information / Sample Chapter(s) (PDF) - Textbook Media

You also want an ePaper? Increase the reach of your titles
YUMPU automatically turns print PDFs into web optimized ePapers that Google loves.
80 <strong>Chapter</strong> 4 Demand and Supply<br />
Price (dollars per housing unit)<br />
p 2<br />
p 3<br />
p 0<br />
p 1<br />
E 0<br />
E 3<br />
E 1<br />
D 1<br />
q 0<br />
q 1<br />
q 2<br />
q 3<br />
Quantity (housing units)<br />
that price ceilings and price floors often have unintended, undesirable consequences of<br />
creating surpluses and shortages, can also suggest alternate public policies that do not<br />
have these same trade-offs.<br />
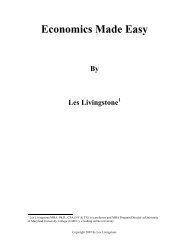
Let’s return to the issue of rent control. If the goal is to have an expanded supply<br />
of affordable housing, then a rightward shift in a demand curve, a supply curve, or both<br />
as shown in Exhibit 4-12, can accomplish this goal. A shift to the right in the supply<br />
of affordable housing from S 0<br />
to S 1<br />
, for example, might be achieved if a government<br />
grants subsidies to builders who construct apartment buildings that include have<br />
relatively smaller rental units, which will have a more affordable price in the market.<br />
This step taken alone would cause a shift to the right from the original equilibrium,<br />
E 0,<br />
to the new equilibrium, E 1<br />
, and would increase the quantity of housing from q 0<br />
to<br />
q 1<br />
. A shift to the right in the demand curve from D 0<br />
to D 1<br />
might be achieved by giving<br />
a subsidy to low-income renters, perhaps in the form of cash or of a voucher that the<br />
renters could use to pay some of the rent, so that low-income renters could then have<br />
more to spend on housing. This step taken alone would cause a shift to the right from<br />
the original equilibrium, E 0<br />
, to the new equilibrium, E 2<br />
, and would increase the quantity<br />
of affordable housing from q 0<br />
to q 2<br />
. Instituting both sets of policies would shift supply<br />
from S 0<br />
to S 1<br />
, demand from D 0<br />
to D 1<br />
, the equilibrium from the original E 0<br />
to E 3<br />
, and the<br />
quantity of affordable housing from q 0<br />
to q 3<br />
.<br />
Any combination of these policies is likely to be more useful in expanding affordable<br />
housing than rent control, because these policies tend to increase the quantity of<br />
affordable housing, whereas rent control tends to decrease it. Moreover, these alternative<br />
policies sidestep many of the problems that arise when suppliers and demanders react<br />
to price controls.<br />
Similarly, there are a number of alternative policies to support farmers or rural<br />
areas that do not involve setting price floors for crops. For example, the government<br />
could provide income directly to farmers, especially to those with lower incomes.<br />
The government might also assist rural economies in many other ways: establishing<br />
new branches of state colleges and universities in agricultural areas, creating parks or<br />
D 0<br />
Exhibit 4-12 Policies<br />
for Affordable Housing:<br />
Alternatives to Rent<br />
Control<br />
The original equilibrium is the<br />
intersection of demand D 0<br />
and<br />
supply S 0<br />
at the equilibrium<br />
E 0<br />
. Providing subsidies to lowincome<br />
buyers of housing will<br />
shift the demand curve from<br />
D 0<br />
to D 1<br />
, leading to a new<br />
equilibrium at E 2<br />
. Alternatively,<br />
a policy of providing subsidies<br />
to builders of affordable<br />
housing would shift the<br />
supply curve from S 0<br />
to S 1<br />
,<br />
leading to a new equilibrium<br />
at E 1<br />
. Undertaking both<br />
demand-side and supplyside<br />
policies would move<br />
the market to equilibrium<br />
E 3<br />
, at the intersection of<br />
the new demand curve D 1<br />
and the new supply curve<br />
S 1<br />
. As drawn here, both of<br />
these policies will increase<br />
the equilibrium quantity<br />
of affordable housing. An<br />
increase in demand will also<br />
raise the price of affordable<br />
housing, but as long as the<br />
subsidy received by buyers is<br />
larger than the higher price,<br />
buyers will not be adversely<br />
affected by the higher price<br />
that occurs from an increase<br />
in demand.