R8-21_World_Bank_Nigeria_Household_Survey_2010
R8-21_World_Bank_Nigeria_Household_Survey_2010
R8-21_World_Bank_Nigeria_Household_Survey_2010
You also want an ePaper? Increase the reach of your titles
YUMPU automatically turns print PDFs into web optimized ePapers that Google loves.
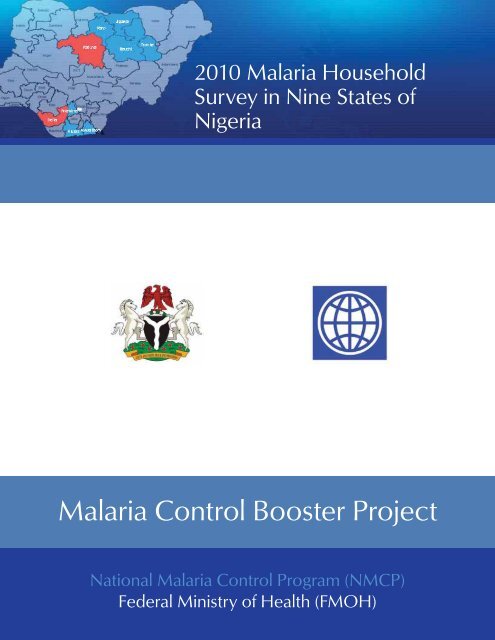
<strong>2010</strong> Malaria <strong>Household</strong><br />
<strong>Survey</strong> in Nine States of<br />
<strong>Nigeria</strong><br />
Malaria Control Booster Project<br />
National Malaria Control Program (NMCP)<br />
Federal Ministry of Health (FMOH)
The <strong>2010</strong> Malaria <strong>Household</strong> <strong>Survey</strong> in Nine States of <strong>Nigeria</strong> was implemented by the National Malaria Control<br />
Programme (NMCP). The study was conducted between April and July <strong>2010</strong>. Public Health Services and Solutions<br />
(PHSS) provided technical assistance to the project, and funding was made available by the <strong>World</strong> <strong>Bank</strong>–supported<br />
Malaria Control Booster Project (MCBP).<br />
Further information about the <strong>2010</strong> Malaria <strong>Household</strong> Sur vey in Nine States of <strong>Nigeria</strong> can be obtained<br />
from the NMCP, PHSS, and <strong>World</strong> <strong>Bank</strong>, Abuja, <strong>Nigeria</strong>. The full details of the survey are available at<br />
www.nmcpnigeria.org, www.thephss.org, and www.worldbank.org/nigeria.<br />
ii<br />
Malaria Control Booster Project
National Malaria Control Programme<br />
Federal Ministry of Health<br />
Abuja, <strong>Nigeria</strong><br />
<strong>World</strong> <strong>Bank</strong>, <strong>Nigeria</strong><br />
<strong>2010</strong> MALARIA HOUSEHOLD SURVEY<br />
IN NINE STATES OF NIGERIA<br />
APRIL 2011<br />
<strong>2010</strong> Malaria <strong>Household</strong> <strong>Survey</strong> in Nine States of <strong>Nigeria</strong> iii
FOREWORD<br />
High morbidity and mortality among children under<br />
five years and pregnant women are major public<br />
health concerns in <strong>Nigeria</strong>. Major childhood killer<br />
diseases such as malaria, pneumonia, diarrhea, and<br />
vaccine-preventable diseases contribute to the high<br />
mortality rate in children under five years. Malaria<br />
contributes the most to childhood and under-age-five<br />
mortality, at 30 percent and 25 percent, respectively,<br />
and more than 10 of 100 deaths in pregnant women<br />
are attributable to malaria. The burden of malaria<br />
continues to constitute a major public health burden<br />
in <strong>Nigeria</strong>.<br />
In 2006, the federal government of <strong>Nigeria</strong> (FGN) received<br />
a credit from the International Development<br />
Agency (IDA), a member of the <strong>World</strong> <strong>Bank</strong> Group,<br />
to finance the <strong>Nigeria</strong>n Malaria Control Booster Project<br />
(MCBP) to improve access to and utilization of<br />
a well-defined set of Malaria Package Plus (MPP) interventions<br />
in seven states in <strong>Nigeria</strong>. These MPP interventions<br />
consist of key maternal and child health<br />
interventions that can reduce morbidity and mortality<br />
with marginal cost increase compared to malariaspecific<br />
interventions alone.<br />
A survey was conducted during October and November<br />
2006 to establish baseline measures of key indicators<br />
set by the project. In <strong>2010</strong>, a follow-up survey was<br />
conducted to document progress made since 2006.<br />
I am pleased that the <strong>2010</strong> Malaria <strong>Household</strong> <strong>Survey</strong><br />
report is completed and results are presented. The<br />
results show significant progress since 2006, particularly<br />
in the areas of long-lasting insecticide–treated<br />
nets, intermittent preventive therapy, and health education<br />
and promotion. Progress has been observed<br />
in the area of malaria treatment with artemisininbased<br />
combination therapy and health care–seeking<br />
behavior in the target states. However, the program<br />
requires intensified action to achieve its goals and objectives<br />
before the end of the project.<br />
The findings of the <strong>2010</strong> Malaria <strong>Household</strong> <strong>Survey</strong> in<br />
Nine States of <strong>Nigeria</strong> further strengthen the case for<br />
investing in malaria control. The achievements thus<br />
far need to be sustained, and more successes need to<br />
be recorded.<br />
Professor Onyebuchi Chukwu<br />
Honorable Minister<br />
Federal Ministry of Health<br />
Abuja, <strong>Nigeria</strong><br />
<strong>2010</strong> Malaria <strong>Household</strong> <strong>Survey</strong> in Nine States of <strong>Nigeria</strong> v
Acknowledgments<br />
We thank the Honorable Minister of Health, the Honorable<br />
Minister of State for Health, and the Permanent<br />
Secretary and the Director of Public Health, Federal<br />
Ministry of Health, for their leadership roles and<br />
support to the National Malaria Control Programme.<br />
We are grateful to all Roll Back Malaria partners, especially<br />
the <strong>World</strong> <strong>Bank</strong>, for their continuous technical<br />
and financial support, particularly during the survey.<br />
Our sincere thanks go to Dr. N. Dinesh and Dr. W.<br />
Odutolu of <strong>World</strong> <strong>Bank</strong> <strong>Nigeria</strong> for their technical<br />
and management support to mobilize resources for<br />
the survey. In addition, <strong>World</strong> <strong>Bank</strong> Consultants Mr.<br />
William Vargas and Dr. Sridhar Srikantiah provided<br />
valuable technical input during training, data collection,<br />
hand tabulation analysis, and report writing. We<br />
would like to express appreciation to Dr. Mizan Siddiqi<br />
and the team of Public Health Services and Solutions<br />
for providing technical support throughout the<br />
process.<br />
I wish to thank my staff and the monitoring and evaluation<br />
team for providing valuable support in the areas<br />
of questionnaire development, training of personnel,<br />
and supervision of data collectors. The survey could<br />
not have been possible without the active participation<br />
and logistics support of the State Ministries of<br />
Health and Malaria Control Booster Project units of<br />
the ministries.<br />
We are grateful to all of the LGA data collectors and<br />
supervisors, who worked very hard during the survey.<br />
Finally, our thanks go to all of the mothers and caregivers<br />
who provided valuable information during the<br />
survey.<br />
Dr. Babajide Coker<br />
National Coordinator<br />
National Malaria Control Programme<br />
April 2011<br />
<strong>2010</strong> Malaria <strong>Household</strong> <strong>Survey</strong> in Nine States of <strong>Nigeria</strong> vii
Contents<br />
Foreword..............................................................................................................................v<br />
Acknowledgments.....................................................................................................................vii<br />
TABLES AND FIGURES....................................................................................................................... xi<br />
ACRONYMS.................................................................................................................................... xiii<br />
Executive Summary...................................................................................................................... 1<br />
Introduction................................................................................................................................................ 3<br />
SURVEY IMPLEMENTATION............................................................................................................... 4<br />
Geographic Area...........................................................................................................................................4<br />
Sample Design..............................................................................................................................................4<br />
Questionnaires..............................................................................................................................................6<br />
Pretest Activities............................................................................................................................................6<br />
Training of Field Staff.....................................................................................................................................6<br />
Fieldwork.......................................................................................................................................................7<br />
Data Processing and Analysis.........................................................................................................................7<br />
RESULTS AND DISCUSSION................................................................................................................ 9<br />
Demographic and Socioeconomic Characteristics of the Respondents...........................................................9<br />
Long-Lasting Insecticide-Treated Net (LLIN).................................................................................................11<br />
<strong>Household</strong> Indoor Residual Spraying (IRS)...................................................................................................11<br />
Antenatal Care (ANC) and Intermittent Preventive Therapy (IPT).................................................................12<br />
Fever and Artemisinin-Based Combination Therapy (ACT)...........................................................................13<br />
Breastfeeding..............................................................................................................................................15<br />
Diarrhea and Oral Rehydration Therapy (ORT).............................................................................................15<br />
Vaccination of Infants..................................................................................................................................16<br />
Behavior Change and Communication (BCC)..............................................................................................16<br />
Progress by Selected Indicators....................................................................................................................17<br />
Analysis of Project Outcome Indicators .......................................................................................................17<br />
References...................................................................................................................................... 19<br />
Contributors................................................................................................................................... 19<br />
Annex 1. Demographic and Socioeconomic Characteristics by State........................................... 20<br />
Annex 2: Selected Indicators by State........................................................................................... 22<br />
Annex 3. List of Supervisors, Interviewers, and Monitors............................................................ 23<br />
Annex 4. Sampled Local Government Areas.................................................................................. 31<br />
<strong>2010</strong> Malaria <strong>Household</strong> <strong>Survey</strong> in Nine States of <strong>Nigeria</strong> ix
Tables and Figures<br />
Table 1. Sampled LGAs by State and Sample Size . . . . . . . . . . . . . . . . . . . . . . . . . . . . . . . . . . . . . . . . . . . . . . .5<br />
Table 2. Questionnaire of <strong>2010</strong> Malaria <strong>Household</strong> <strong>Survey</strong> . . . . . . . . . . . . . . . . . . . . . . . . . . . . . . . . . . . . . . . .6<br />
Table 3. Demographic and Socioeconomic Characteristics . . . . . . . . . . . . . . . . . . . . . . . . . . . . . . . . . . . . . . .10<br />
Table 4. <strong>Household</strong> Indoor Residual Spraying (IRS) . . . . . . . . . . . . . . . . . . . . . . . . . . . . . . . . . . . . . . . . . . . . .13<br />
Table 5. Breastfeeding and Exclusive Breastfeeding (EBF) . . . . . . . . . . . . . . . . . . . . . . . . . . . . . . . . . . . . . . . .15<br />
Table 6. Oral Rehydration Therapy (ORT) During Diarrhea . . . . . . . . . . . . . . . . . . . . . . . . . . . . . . . . . . . . . . .16<br />
Table 7. DPT3 and Measles Vaccination of Infants . . . . . . . . . . . . . . . . . . . . . . . . . . . . . . . . . . . . . . . . . . . . . .16<br />
Table 8. Changes in Selected Indicators Cetween 2006 and <strong>2010</strong> LQAS <strong>Survey</strong>s . . . . . . . . . . . . . . . . . . . . . . .18<br />
Table 9. Project Outcome Indicators: Baseline, Midline, and End of Project . . . . . . . . . . . . . . . . . . . . . . . . . . .19<br />
Figure 1. Malaria Control Booster Project: Control and Project States . . . . . . . . . . . . . . . . . . . . . . . . . . . . . . . .4<br />
Figure 2. Ownership of Two LLIN per <strong>Household</strong> . . . . . . . . . . . . . . . . . . . . . . . . . . . . . . . . . . . . . . . . . . . . . .12<br />
Figure 3. Percentage of Children Under Five Years Who Slept under an LLIN the Night Preceding<br />
the <strong>Survey</strong> . . . . . . . . . . . . . . . . . . . . . . . . . . . . . . . . . . . . . . . . . . . . . . . . . . . . . . . . . . . . . . . . . . . .12<br />
Figure 4. Use of LLIN During Last Pregnancy and After Child Birth . . . . . . . . . . . . . . . . . . . . . . . . . . . . . . . . .13<br />
Figure 5. Percentage of Women with Children
Acronyms<br />
ACT Artemisinin-Based Combination Therapy<br />
ANC Antenatal Care<br />
ARI Acute Respiratory Infection<br />
BCC Behavior Change and Communication<br />
CA Catchment Area<br />
CHEW Community Health Extension Worker<br />
DPT Diptheria, Pertussis, and Tetanus<br />
EBF Exclusive Breast Feeding<br />
EOP End of Project<br />
FIC Fully Immunized Children<br />
FMOH Federal Ministry of Health<br />
ICC Interclass Correlation<br />
IPT Intermittent Preventive Therapy<br />
IRS Indoor Residual Spraying<br />
ITN Insecticide-Treated Net<br />
IVM Integrated Vector Management<br />
LC-LQAS Large Country Lot Quality Assurance<br />
Sampling<br />
LGA<br />
LQAS<br />
M&E<br />
MPP<br />
NMCP<br />
ORS<br />
ORT<br />
PHSS<br />
PPS<br />
RA<br />
RBM<br />
RHF<br />
SA<br />
SMS<br />
SP<br />
Local Government Area<br />
Lot Quality Assurance Sampling<br />
Monitoring and Evaluation<br />
Malaria Plus Package<br />
National Malaria Control Programme<br />
Oral Rehydration Solution<br />
Oral Rehydration Therapy<br />
Public Health Services and Solutions<br />
Probability Proportion to Size<br />
Reliability Assessment<br />
Roll Back Malaria<br />
Recommended Home Fluid<br />
Supervision Area<br />
Short Message System<br />
Sulfadoxine-Pyrimethamine<br />
<strong>2010</strong> Malaria <strong>Household</strong> <strong>Survey</strong> in Nine States of <strong>Nigeria</strong> xiii
Executive Summary<br />
The National Malaria Control Programme (NMCP)<br />
with support from the <strong>World</strong> <strong>Bank</strong> is implementing<br />
a malaria control and prevention program titled Malaria<br />
Package Plus (MPP) in seven <strong>Nigeria</strong>n states. The<br />
program adopted the Lot Quality Assurance Sampling<br />
(LQAS) methodology to monitor program achievements.<br />
A survey was conducted during April to July<br />
<strong>2010</strong> to document progress made since 2006 by the<br />
program. Two states, one in the north and one in the<br />
south, were included as control states because they<br />
did not participate in the MPP.<br />
The survey was organized and implemented by the<br />
states at the local government area level with support<br />
from the NMCP and <strong>World</strong> <strong>Bank</strong> consultants.<br />
The consulting firm Public Health Services and Solutions<br />
(PHSS) was responsible for training, monitoring<br />
and supervision, data entry, cleaning, and analysis.<br />
The surveyors received training on LQAS principles,<br />
data collection, and hand tabulation of results. They<br />
were supervised by NMCP facilitators, PHSS, and<br />
<strong>World</strong> <strong>Bank</strong> team members. Data quality was ensured<br />
through supervision and spot checks. The data set was<br />
cleaned using the double entry method. Data entry<br />
was done using FoxPro, and analysis was done with<br />
EpiInfo software. All stakeholders were consulted, and<br />
their input was taken into consideration for questionnaire<br />
development, training, data analysis, and report<br />
writing.<br />
The survey findings showed impressive improvement<br />
in ownership of long-lasting insecticide-treated nets<br />
(LLINs), with 81 percent of households having at least<br />
two LLINs in project areas compared to 42 percent in<br />
control states. The comparative figure of ownership<br />
of one LLIN or insecticide-treated net (ITN) in 2006<br />
and 2008 is 2 percent and 88 percent, respectively.<br />
The progress is also observed in utilization of LLINs.<br />
Forty-five percent of children under five years of age<br />
slept under an LLIN in project areas compared to 36<br />
percent in control states. Use of LLINs among pregnant<br />
mothers increased from 8 percent in 2006 to<br />
39 percent in <strong>2010</strong>. However, the coverage of indoor<br />
residual spraying in households remained low, at 5.6<br />
percent. The improvement is also seen in antenatal<br />
care (ANC). The ANC rate of one or more increased<br />
from 62 percent in 2006 to 71.7 percent in <strong>2010</strong>. Of<br />
these, 16.6 percent received two or more doses of<br />
intermittent preventive therapy (IPT) during pregnancy.<br />
In 2006 the IPT coverage was 9 percent. Of<br />
children under five years of age with fever, 5.8 percent<br />
received treatment with artemisinin-based combination<br />
therapy (ACT) in <strong>2010</strong> compared to less than<br />
1 percent in 2006.<br />
Among the indicators of other child survival interventions:<br />
immunization, exclusive breast feeding, and<br />
oral rehydration therapy (ORT) use, only immunization<br />
coverage showed significant improvement since<br />
2006. During this period, diphtheria, tetanus, and<br />
pertussis (DPT3) and measles coverage increased<br />
three times (DPT3 12 vs. 27.8 percent and measles 13<br />
vs. 47.4 percent).<br />
The Malaria <strong>Household</strong> <strong>Survey</strong> <strong>2010</strong> included Knowledge,<br />
Attitude, and Practice (KAP) questions to find<br />
the respondents’ level of KAP on key areas of prevention<br />
and treatment of malaria. About 75 percent of<br />
respondent mothers know when to seek treatment<br />
for malaria and 61.7 percent know at least two symptoms<br />
of malaria. Approximately 47 percent of mothers<br />
know at least two ways to prevent malaria, but<br />
only 32.1 percent know that ITN can prevent malaria.<br />
Twenty-five percent know how to prevent malaria<br />
during pregnancy with IPT.<br />
Although progress has been made since 2006, the<br />
program must intensify its effort in the area of ACT,<br />
IPT, and other child survival interventions (ORT, immunization,<br />
and breast feeding) to reach its target<br />
<strong>2010</strong> Malaria <strong>Household</strong> <strong>Survey</strong> in Nine States of <strong>Nigeria</strong> 1
y the end of the project. The inclusion of behavior<br />
change and communication (BCC) in the project activity<br />
will empower communities, households, and<br />
caregivers to prevent malaria and seek care with appropriate<br />
treatment. The use of LQAS as a tool to<br />
monitor programs at the local government area level<br />
should be continued.<br />
2 Malaria Control Booster Project
Introduction<br />
The National Malaria Control Program (NMCP) of the<br />
Federal Ministry of Health (FMOH) with support from<br />
The <strong>World</strong> <strong>Bank</strong> is implementing a five-year Malaria<br />
Control Booster Project (MCBP) in seven states (Kano,<br />
Jigawa, Bauchi, Gombe, Anambra, Akwa Ibom, and<br />
Rivers) of <strong>Nigeria</strong>. The goal of the project is to provide<br />
key preventive and curative interventions against<br />
malaria and other diseases associated with maternal<br />
and child mortality through the Malaria Plus Package<br />
(MPP). The MPP is in line with the Maternal Newborn<br />
and Child Health Strategy of Federal Ministry<br />
of Health 1 and strategic plan of the NMCP. 2 The project<br />
agreed to monitor output and outcome indicators<br />
using a decentralized population-based approach<br />
and adopted Lot Quality Assurance Sampling (LQAS)<br />
method. A baseline survey was conducted by the<br />
states and local government areas (LGAs) in 2006 as<br />
part of the monitoring plan. 3 In <strong>2010</strong> a follow-up survey<br />
was conducted to document progress made since<br />
2006 using the same LQAS method. To compare the<br />
data from the intervention area, two states, one in the<br />
north (Kaduna) and another in the south (Delta) were<br />
kept as the control states.<br />
The primary objectives of the <strong>2010</strong> Malaria <strong>Household</strong><br />
<strong>Survey</strong> in Nine States of <strong>Nigeria</strong> were to document<br />
progress made since 2006 against the key indicators<br />
of the program, particularly in the area of long-lasting<br />
insecticide-treated nets (LLINs), intermittent preventive<br />
therapy (IPT), indoor residual spraying (IRS), and<br />
artemisinin-based combination therapy (ACT) and<br />
highlight areas of weakness for program managers<br />
and decision makers to mobilize resources and make<br />
adjustment in the project to achieve its goal.<br />
<strong>2010</strong> Malaria <strong>Household</strong> <strong>Survey</strong> in Nine States of <strong>Nigeria</strong> 3
<strong>Survey</strong> Implementation<br />
Geographic Area<br />
The survey was conducted in nine states, five of which<br />
are in the northern region (Kano, Jigawa, Bauchi,<br />
Gombe, and Kaduna) and the remaining four in the<br />
southern region (Anambra, Delta, Akwa Ibom, and<br />
Rivers) of <strong>Nigeria</strong>. In each region, one state acted as<br />
the control (Kaduna in the north, and Delta in the<br />
south). These two control states are not supported<br />
by the <strong>World</strong> <strong>Bank</strong> Malaria Control Booster Project<br />
(MCBP), but are Global Fund–assisted states. The<br />
map in Figure 1 presents the survey states (intervention<br />
and control).<br />
Sample Design<br />
A multistage random sampling methodology was<br />
used to select 19 households in each local government<br />
area (LGA). In the first stage, 84 LGAs were selected,<br />
with simple random sampling from 263 LGAs in the<br />
nine states. The number of LGAs selected per state<br />
was calculated using a combined cluster sampling and<br />
Lot Quality Assurance Sampling (LQAS) methodology<br />
known as Large Country LQAS (LC-LQAS). The number<br />
of LGAs included in the sample was determined<br />
by the LC-LQAS sample size formula. 4 This sample size<br />
n is dependent on six parameters: (1) the number of<br />
samples collected in each supervision area (SA) m; (2)<br />
the total number of SAs in a catchment area (CA) N;<br />
(3) the total population in the CA (usually based on a<br />
national census) N* cen<br />
; (4) the average of the square of<br />
the populations in each SA M — 2<br />
; (5) an estimate of the<br />
intraclass correlation (ICC) rˆ; and (6) the maximum<br />
desired length for the confidence interval l max<br />
, which<br />
in this case is 0.20.<br />
(1 + (m – 1)rˆ<br />
n = N ——————————————–—<br />
l max<br />
N* cen<br />
(m – 1)(1 – rˆ)<br />
———— 2 ——–———— + mrˆ<br />
1.96 NM — 2<br />
4 Malaria Control Booster Project
Table 1 presents by state the number of LGAs selected<br />
and the LQAS sample size of 19 used in each<br />
LGA.<br />
In the second stage, 19 villages were selected randomly<br />
using Probability Proportional to Size Sampling<br />
(PPS) in each LGA. The lists of villages were collected<br />
from the LGAs. Village population sizes were<br />
estimated using the most recent census.<br />
Finally, at the village level, a starting point for the<br />
first respondent was randomly selected from a map<br />
constructed by the data collector using the segmentation<br />
sampling technique. A household was defined<br />
as groups of persons who eat from the same cooking<br />
pot. Once the starting point was selected, the<br />
interviewer administered one of four sets of questionnaires<br />
to an eligible respondent. The interviewer<br />
then went to the next-nearest door and checked at<br />
that household for eligible respondents and administered<br />
the appropriate questionnaire. Only one eligible<br />
respondent was interviewed in every household,<br />
with the exception of mothers with children with diarrhea<br />
or fever. If an eligible respondent was absent<br />
or more than 20 minutes away, the interviewer went<br />
to the next-nearest door and checked at that household<br />
for an eligible respondent. The interviewer continued<br />
this process until he or she found an eligible<br />
respondent for all six questionnaires included in the<br />
set. The inclusion criteria for selection of six respondents<br />
are as follows:<br />
1. Head of household<br />
2. Mother or caregiver of an infant aged 0 to 11<br />
months<br />
3. Mother or caregiver of a child aged 12 to 23<br />
months<br />
4. Mother or caregiver of a child aged 0 to 59<br />
months<br />
5. Mother or caregiver of a child aged 0 to 59<br />
months with diarrhea<br />
6. Mother or caregiver of children aged 0 to 59<br />
months with fever<br />
All 19 sets of questionnaires administered in the villages<br />
selected from each LGA using PPS had their<br />
own randomly selected starting point. A total of<br />
9,576 interviews were conducted in 1,596 settlements<br />
(intervention 1,235; control 361) in 84 LGAs<br />
in nine states.<br />
Table 1. Sampled LGAs By State and Sample Size<br />
State<br />
Total Number<br />
of LGAs<br />
Number of<br />
LGAs Sampled<br />
Sample<br />
Size<br />
Northern Region<br />
Kano 44 10 19 190<br />
Jigawa 27 9 19 171<br />
Bauchi 20 9 19 171<br />
Gombe 11 8 19 152<br />
Kaduna (control) 23 9 19 171<br />
Total 125 45<br />
Southern Region<br />
Rivers 23 10 19 190<br />
Akwa Ibom 31 10 19 190<br />
Anambra <strong>21</strong> 9 19 171<br />
Delta (control) 25 10 19 190<br />
Total 100 39 1596<br />
Sets<br />
of Questionnaires<br />
<strong>2010</strong> Malaria <strong>Household</strong> <strong>Survey</strong> in Nine States of <strong>Nigeria</strong> 5
Questionnaires<br />
Six sets of data collection instruments were used<br />
for the survey. The survey instruments were similar<br />
to those used in the 2006 LQAS survey, except that<br />
the diarrhea and fever modules were separated and<br />
questions related to acute respiratory infections (ARIs)<br />
were excluded.<br />
The questionnaires were divided into different sections<br />
to cover malaria and other child survival interventions.<br />
There are six questionnaires and 29 sections<br />
in one set of questionnaires (Table 2).<br />
Pretest Activities<br />
The questionnaires were reviewed by a technical<br />
group at the National Malaria Control Programme<br />
(NMCP) and were field tested. After the field test,<br />
similar questions that applied to different instruments<br />
were harmonized and uniform code patterns<br />
were used. A behavior change and communication<br />
(BCC) section was added to all questionnaires to assess<br />
knowledge of malaria control and prevention in<br />
the population. Instruments used by the NMCP in a<br />
previous survey on Knowledge, Attitude, and Practice<br />
(KAP) were used to add similar questions for comparison.<br />
Informed consent was added to all questionnaires<br />
and made mandatory for every instrument administered.<br />
Training of Field Staff<br />
Training workshops prepared the participants on<br />
the concepts and techniques of data collection using<br />
the LQAS methodology. Three participants (one<br />
supervisor and two interviewers) were selected from<br />
each LGA. The training was held in five centers:<br />
Kano (Kano and Jigawa), Anambra (Anambra and<br />
Delta), Akwa Ibom (Akwa Ibom and Rivers), Gombe<br />
Table 2. Questionnaire of <strong>2010</strong> Malaria <strong>Household</strong> <strong>Survey</strong><br />
1. <strong>Household</strong> <strong>Survey</strong><br />
4. Mothers of Children 0–59 Months<br />
Section 1: <strong>Household</strong> Assets<br />
Section 2: Respondents Background<br />
Section 3: Indoor Residual Spraying<br />
Section 4: Bed Nets<br />
Section 5: Behavior Change and Communication<br />
2. Mothers of Children 0-11 Months<br />
Section 1: Mother’s Background<br />
Section 2: Infant’s Background<br />
Section 3: Pregnancy and Intermittent Preventive Therapy<br />
Section 4: Bed nets<br />
Section 5: Breastfeeding and Infant/Child Nutrition<br />
Section 6: Diarrhea and Fever Prevalence<br />
Section 7: Behavior Change and Communication<br />
3. Mothers of Children 12–23 Months<br />
Section 1: Mother’s Background<br />
Section 2: Child’s Background<br />
Section 3: Childhood Immunizations<br />
Section 4: Diarrhea and Fever Prevalence<br />
Section 5: Behavior Change and Communication<br />
Section 1: <strong>Household</strong> Assets<br />
Section 2: Mother’s Background<br />
Section 3: Child’s Background<br />
Section 4: Bed Nets<br />
Section 5: Diarrhea and Fever Prevalence<br />
Section 6: Behavior Change and Communication<br />
5. Mothers of Children 0–59 Months with Diarrhea in the Last<br />
Two Weeks<br />
Section 1: Mother’s Background<br />
Section 2: Child’s Background<br />
Section 3: Diarrhea Case Management<br />
6. Mothers of Children 0–59 Months with Fever in the Last Two<br />
Weeks<br />
Section 1: Mother’s Background<br />
Section 2: Child’s Background<br />
Section 3: Malaria Case Management<br />
Section 4: Diarrhea and Fever Prevalence<br />
Section 5: Behavior Change and Communication<br />
6 Malaria Control Booster Project
(Gombe and Kaduna), and Bauchi. The training<br />
workshop lasted for five days in each of the five centers.<br />
Gombe training planned for the Bauchi center<br />
was postponed because of state-level activities and<br />
conducted separately.<br />
Fieldwork<br />
Data Collection Period. The data were collected<br />
during the week immediately after the training workshop<br />
in each LGA between April–July <strong>2010</strong>. For most<br />
LGAs, data collection took over an average of seven<br />
days.<br />
Monitoring and Supervision. Each LGA data collection<br />
team had two local interviewers and a local<br />
LGA supervisor who worked in the LGA health program<br />
to support the team in identifying and randomly<br />
selecting the starting point. A total of 86 LGA<br />
interviewers and 43 LGA supervisors were involved in<br />
data collection in the north, and 76 LGA interviewers<br />
and 38 LGA supervisors were engaged in the south.<br />
The supervisors were responsible for the review of all<br />
completed questionnaires to ensure there were no<br />
inconsistencies or missing data. In the case of missing<br />
data or inconsistencies, the supervisor assisted<br />
the interviewer to obtain the data. NMCP monitoring<br />
and evaluation (M&E) officers, state Roll Back Malaria<br />
(RBM) officers, Public Health Services and Systems<br />
(PHSS) Consultants, and a <strong>World</strong> <strong>Bank</strong> Consultant<br />
provided supervision and monitoring of the training<br />
and data collection.<br />
A supervisory checklist was used by all consultants and<br />
supervisors, and corrections were made on the spot<br />
where necessary. At the end of the day, data collectors<br />
were briefed about mistakes and areas of concern. As<br />
part of the quality assurance efforts, reliability assessment<br />
(RA) was conducted in all of the states. One<br />
household per LGA was selected, and the household<br />
head was reinterviewed, with data checked against<br />
previous interviews conducted by data collectors. The<br />
RA result shows that some of the states had better<br />
agreement than others. Overall, all states passed the<br />
minimum criteria set for RA.<br />
PHSS developed a Web and short message system<br />
(SMS)-based, real-time monitoring system to monitor<br />
large-scale surveys. At the end of the day, supervisors<br />
and monitors sent an SMS message with<br />
key information about the location and interview<br />
status of the questionnaire. Those who had access<br />
to the Internet sent information via a Web-based<br />
application that produced a report showing the<br />
survey status in the various locations and by supervisor.<br />
An interactive map displayed this information<br />
by LGA and state. The real-time monitoring system<br />
made the survey transparent and accountable and<br />
enabled completion on schedule. It also allowed<br />
monitors and supervisors to support the team as<br />
needed.<br />
After data collection, the state teams returned to the<br />
training venue. They were trained by master trainers<br />
to hand tabulate the LGA-level data and use LQAS<br />
decision rules to identify LGAs with indicator values<br />
below the decision rule. Teams were also trained to<br />
aggregate LGA data to calculate point estimates for<br />
the state for key indicators.<br />
Data Processing and Analysis<br />
The data were entered into the FoxPro program. A<br />
double entry method was used to ensure an errorfree<br />
database. Two data sets were compared using<br />
the dual check Epi Info version 3.5.1 Compare<br />
Subroutine and FoxPro Dual Check Command. The<br />
compare subroutine function was applied to key indicators.<br />
The analysis covered six different questionnaires<br />
(household and mothers of children 0 to 11 months,<br />
12 to 23 months, 0 to 59 months, 0 to 59 months<br />
with diarrhea, and 0 to 59 months with fever). The<br />
following core and program indicators were analyzed<br />
and are presented in this report.<br />
<strong>2010</strong> Malaria <strong>Household</strong> <strong>Survey</strong> in Nine States of <strong>Nigeria</strong> 7
Key Indicators<br />
• Percentage of children under five years with fever<br />
treated with an effective antimalarial (ACT) within<br />
24 hours<br />
• Percentage of infants aged 0 to 6 months that<br />
were fed breast milk only in the last 24 hours<br />
• Percentage of children under 5 years who slept<br />
under an insecticide-treated net (ITN) the night<br />
preceding the survey<br />
• Percentage of pregnant women who received two<br />
or more doses of IPT<br />
All Indicators<br />
• Percentage of households with at least two LLINs<br />
• Percentage of children under 5 years who slept<br />
under an LLIN the night preceding the survey<br />
• Percent of children aged 0 to 59 months with<br />
diarrhea in the last two weeks who received oral<br />
rehydration solution (ORS), recommended home<br />
fluids (RHFs), or both<br />
• Percentage of infants aged 12 to 23 months who<br />
were vaccinated with the diphtheria, tetanus,<br />
pertussis (DPT3) and measles vaccines<br />
• Percentage of infants aged 0 to 6 months who<br />
were fed breast milk only in the last 24 hours<br />
• Percentage of women with children under 1 year<br />
who received antenatal care (ANC) care during<br />
last pregnancy<br />
• Percentage of pregnant women who received two<br />
or more doses of intermittent preventive therapy<br />
(IPT)<br />
• Percentage of children under 5 years with fever<br />
treated with an effective antimalarial (ACT) within<br />
24 hours from the onset of symptoms<br />
• Percentage of mothers who recognize signs of<br />
severe illness in children and know when and<br />
where to obtain help.<br />
• Percentage of mothers and caregivers who know<br />
the danger signs for malaria<br />
8 Malaria Control Booster Project
RESULTS AND DISCUSSION<br />
Demographic and<br />
Socioeconomic<br />
Characteristics of the<br />
Respondents<br />
Table 3 shows demographic and socioeconomic characteristics<br />
of the surveyed population by project and<br />
control states. In general, the control area had a better<br />
socioeconomic standard than the project area. Most<br />
of the respondents for the household questionnaire<br />
are male in both control (61.4 percent) and project<br />
(82.3 percent) states. However, the number of female<br />
respondents in the control area was twice that of the<br />
project area (39.6 vs. 17.7 percent). Overall, 78.7 percent<br />
of respondents were male and <strong>21</strong>.3 percent were<br />
female. Ten percent of the respondents were under 30<br />
years, 45 percent were between 30 and 50 years, and<br />
another 45 percent were older than 50 years. The distributions<br />
of age-group between project and control<br />
groups are similar. A total of 93.4 percent of respondents<br />
in project area were married compared to 86.9<br />
percent in control states. There were more singles and<br />
widows in control areas than in project areas (13 vs. 8<br />
percent). In regard to education, 37.1 percent in project<br />
areas had no education compared to 24.7 percent<br />
in control areas. More respondents in control area had<br />
secondary and higher education than in project area<br />
(46.3 vs. 34.8 percent). This is due to the low literacy<br />
rate in northern states compared to that in southern<br />
states. With regard to electricity, 69.2 percent had access<br />
and 50 percent did not. In terms of household<br />
assets, households in control areas possessed more<br />
televisions, cars, and refrigerators than those in project<br />
areas. Well water is the main source of drinking water in<br />
both control and project areas (55.1 vs. 56.5 percent).<br />
However, 30.7 percent of households in control areas<br />
have access to piped water compared to 15.9 percent<br />
of households in project areas. More people bought<br />
water in project areas than in control areas (23.3. 13.1<br />
percent). Seventy-eight percent of households in project<br />
areas had access to agricultural land compared to<br />
57.1 percent in control households. In regard to waste<br />
management, 24.4 percent of households in control<br />
areas had flush toilets and 55.1 percent had pit latrines.<br />
The corresponding figures for project areas were 12.5<br />
percent and 72.4 percent, respectively. The main flooring<br />
material in 77 percent of homes in control areas<br />
was cement compared to 54.5 percent in project areas.<br />
Dirt, sand, and dung floors are three times more common<br />
in project areas than in control areas (39.5 vs. 13.9<br />
percent).<br />
The state-level analyses of demographic and socioeconomic<br />
status are given in Annex 1. In general,<br />
northern states (Kano, Jigawa, Bauhci, Gombe, and<br />
Kaduna) have a poorer socioeconomic status than<br />
the southern states (AkwaIbom, Anambra, Delta,<br />
and Rivers). The number of female respondents in<br />
Kano, Jigawa, and Bauchi was less than five percent.<br />
In northern states, 94 to 99 percent of respondents<br />
are married. The percentage of widows in southern<br />
states varied between 5 and 12 percent. The agegroup<br />
did not show much difference in its distribution.<br />
Jigawa and Gombe had the highest number of<br />
respondents (62 and 63 percent) with no education.<br />
More than 90 percent of respondents in Anambra<br />
and Rivers had primary to higher secondary education.<br />
Of households in Anambra, 88.9 percent had<br />
access to electricity and Jigawa had the lowest number<br />
of households with electricity (23.7 percent). Seventy-five<br />
percent of households in Anambra reported<br />
having a television compared to less than 20 percent<br />
in Bauchi, Gombe, and Jigawa. Fifty-two percent of<br />
households in Anambra had a refrigerator, whereas<br />
less than 10 percent in Bauhci, Jigawa, and Gombe<br />
reported having one. Possession of a bicycle or motorcycle<br />
was more common in northern states than<br />
in southern states. Of households in Anambra, 32.7<br />
<strong>2010</strong> Malaria <strong>Household</strong> <strong>Survey</strong> in Nine States of <strong>Nigeria</strong> 9
Table 3. Demographic and Socioeconomic Characteristics<br />
Percentage distribution of demographic and socioeconomic characteristics (n = 1,596)<br />
Variable Project (n = 1,235) (%) Control (n = 361) (%) All (n = 1,596) (%)<br />
Gender<br />
Male<br />
Female<br />
Marital Status<br />
Single<br />
Married<br />
Widow<br />
Others<br />
Age<br />
15–19<br />
19–24<br />
25–29<br />
30–34<br />
35–39<br />
40–44<br />
45–49<br />
50–54<br />
55+<br />
Education<br />
No education<br />
Primary<br />
Secondary<br />
Higher secondary<br />
83.8<br />
16.2<br />
2.0<br />
93.4<br />
4.4<br />
0.2<br />
0.6<br />
2.9<br />
6.6<br />
10.3<br />
10.1<br />
13.0<br />
10.9<br />
12.2<br />
33.4<br />
37.1<br />
28.2<br />
22.3<br />
12.5<br />
Access to electricity 50.0 69.2 54.3<br />
<strong>Household</strong> Asset<br />
Radio<br />
Television<br />
Refrigerator<br />
Bicycle<br />
Motorcycle<br />
Car<br />
80.8<br />
42.7<br />
<strong>21</strong>.9<br />
47.0<br />
45.8<br />
15.6<br />
Land ownership 78.0 57.1 73.3<br />
Source of Drinking Water<br />
Piped into residence<br />
Piped into yard<br />
Public piped<br />
Well with pump<br />
Well without pump<br />
Cart pusher<br />
Tanker truck<br />
Rain water<br />
Other<br />
Toilet Type<br />
Flush toilet<br />
Pit<br />
Bush<br />
Other<br />
Main Type of Flooring in the<br />
House<br />
Dirt, sand, dung<br />
Wood or plank<br />
Cement<br />
Parquet or polished wood<br />
Tiles<br />
Other<br />
6.2<br />
2.4<br />
7.3<br />
23.7<br />
32.8<br />
1.3<br />
22.0<br />
2.0<br />
2.2<br />
12.5<br />
72.4<br />
10.3<br />
4.7<br />
39.5<br />
0.6<br />
54.5<br />
0.2<br />
2.4<br />
2.8<br />
61.4<br />
38.6<br />
5.0<br />
86.9<br />
7.5<br />
0.6<br />
1.1<br />
5.3<br />
6.0<br />
13.2<br />
9.4<br />
13.5<br />
10.2<br />
7.1<br />
34.2<br />
24.7<br />
29.1<br />
33.0<br />
13.3<br />
77.6<br />
64.5<br />
32.9<br />
38.4<br />
44.8<br />
17.6<br />
10.9<br />
5.0<br />
14.8<br />
8.6<br />
46.5<br />
1.1<br />
12.0<br />
0.6<br />
0.6<br />
24.4<br />
55.1<br />
15.2<br />
5.3<br />
13.9<br />
2.8<br />
77.0<br />
0.0<br />
1.4<br />
5.0<br />
78.7<br />
<strong>21</strong>.3<br />
2.7<br />
91.9<br />
5.1<br />
0.3<br />
0.7<br />
3.4<br />
6.5<br />
10.9<br />
9.9<br />
13.1<br />
10.8<br />
11.2<br />
33.6<br />
34.3<br />
28.4<br />
24.7<br />
12.7<br />
80.1<br />
47.7<br />
24.4<br />
45.0<br />
45.6<br />
16.1<br />
7.2<br />
3.0<br />
9.0<br />
20.3<br />
35.9<br />
1.3<br />
19.8<br />
1.6<br />
1.8<br />
15.2<br />
68.5<br />
11.5<br />
4.8<br />
33.7<br />
1.1<br />
59.6<br />
0.1<br />
2.2<br />
3.3<br />
10 Malaria Control Booster Project
percent had a car; in Gombe, only 6.8 percent reported<br />
having a car. Landownership ranged between<br />
60 and 80 percent in all states except Delta, where<br />
half of the respondents reported having no access to<br />
agricultural land. In all northern states, well water is<br />
the main source of drinking water (67 to 80 percent),<br />
whereas in southern states the majority of households’<br />
drinking water source is piped water or tanker<br />
truck (43 to 70 percent). Most of the latrines in the<br />
northern states and AkwIbom are of the pit type (85<br />
to 95 percent), except in Bauchi, where 24 percent<br />
do not have a toilet. In households in Anambra and<br />
Delta, 42.7 percent and 37.9 percent, respectively, reported<br />
having a flush toilet. Dirt, sand, and dung are<br />
the main type of flooring in northern states (44 to 70<br />
percent) except Kaduna (<strong>21</strong> percent), whereas 68 to<br />
90 percent of households in southern states have a<br />
cement floor.<br />
Long-Lasting Insecticide-<br />
Treated Net (LLIN)<br />
During the last few years, the program made tremendous<br />
effort to improve household ownership and<br />
use of LLIN and distributed millions of LLINs in all<br />
intervention states. A total of 1.8 million LLINs were<br />
distributed in the seven Booster-supported states in<br />
2008, targeting pregnant women and children under<br />
five years through immunization plus days. In 2009,<br />
the country adopted the policy of universal coverage,<br />
with 12.4 million LLINs distributed to the seven states<br />
during the campaign. LLIN distribution included a<br />
state-wide comprehensive logistics plan of transportation,<br />
storage, household registration, training,<br />
advocacy, social mobilization, and communication,<br />
monitoring, and supervision at the LGA, ward, and<br />
distribution points. The effort at the state level was<br />
complemented by the NMCP, development partners,<br />
and civil society organizations.<br />
Ownership of LLIN. Figure 2 presents the percentage<br />
of households with at least two LLINs. Jigawa had<br />
the highest ownership rate (94.7 percent), followed<br />
by Bauchi (90.1 percent). Delta had the lowest number<br />
of households, with two LLNs (3.2 percent). The<br />
lower rate in Delta is due to the campaign being conducted<br />
after the survey. N ownership in the intervention<br />
states is 81.3 percent and in the control states is<br />
42.1 percent. The rate is almost double in the intervention<br />
area compared with the control area. At the<br />
aggregate level, the project has exceeded the target<br />
of 80 percent for this indicator.<br />
Use of LLIN. Figure 3 shows that 42.5 percent of<br />
children under five years slept under an LLIN the<br />
night before the survey. The highest rate was observed<br />
in Gombe (79.6 percent followed by Kaduna<br />
(67.8 percent). In these states, LLIN was distributed<br />
just before the survey. Kaduna is a control state for<br />
MCBP but is a Global Fund–supported state. Delta,<br />
a control state, had the lowest LLIN rate (6.3 percent).<br />
Overall, intervention states have a significantly<br />
higher rate of LLIN use (44.6 percent) than control<br />
states (35.5 percent).<br />
Use of LLIN during Pregnancy and after Childbirth.<br />
In <strong>2010</strong>, LQAS survey mothers with infants (0<br />
to 11 months) were asked if they slept under a bed<br />
net during their last pregnancy. Thirty-two percent<br />
of mothers reported that they slept under an LLIN<br />
during their last pregnancy (Figure 4). They were<br />
then asked if they slept under a bed net last night.<br />
Thirty-nine percent of mothers reported sleeping<br />
under an LLIN last night. However, this number<br />
dropped to 32 percent when verified by hanging<br />
and report of sleeping under the net.<br />
<strong>Household</strong> Indoor Residual<br />
Spraying (IRS)<br />
As part of the integrated vector management (IVM)<br />
for control of mosquitos and breeding places, the<br />
NMCBP introduced IRS initially as a pilot in the seven<br />
states in a few wards in one LGA. Findings from this<br />
<strong>2010</strong> Malaria <strong>Household</strong> <strong>Survey</strong> in Nine States of <strong>Nigeria</strong> 11
Figure 2. Ownership of two LLIN per <strong>Household</strong> (n=1596)<br />
All<br />
Intervention (7 States)<br />
Control (Kaduna and Delta)<br />
Rivers<br />
Kano<br />
Kaduna<br />
Jigawa<br />
Gombe<br />
Delta<br />
Bauchi<br />
Anambra<br />
Akwa Ibom<br />
3.2<br />
42.1<br />
72.4<br />
71.6<br />
70.5<br />
74.3<br />
81.3<br />
85.4<br />
94.7<br />
86.8<br />
90.1<br />
83<br />
0 10 20 30 40 50 60 70 80 90 100<br />
Percent<br />
initial phase will be used to scale up the intervention<br />
in two LGAs in each state.<br />
Table 4 shows that 5.8 percent households were<br />
spayed with IRS in last 12 months. Jigawa and Kaduna<br />
started spraying with IRS in 2009, with 27.5 percent<br />
of households in Jigawa sprayed with IRS, followed by<br />
Kaduna (17.0 percent). All other states had less than 1<br />
percent of households sprayed with IRS.<br />
In control states, 8.3 percent of households are<br />
sprayed with IRS compared to 5.0 percent in interventions<br />
states.<br />
Antenatal Care (ANC) and<br />
Intermittent Preventive<br />
Therapy (IPT)<br />
Antenatal Care (ANC). ANC was analyzed for<br />
mothers who received at least one visit from a doctor,<br />
nurse, midwife, or community health extension worker<br />
(CHEW) during pregnancy and four or more visits from<br />
the same group of providers (Figure 5). The national<br />
guideline and <strong>World</strong> Health Organization (WHO) recommend<br />
at least four visits during pregnancy.<br />
Percent<br />
100<br />
90<br />
80<br />
70<br />
60<br />
50<br />
40<br />
30<br />
20<br />
10<br />
0<br />
49.5<br />
Akwa Ibom<br />
24<br />
Anambra<br />
Figure 3<br />
Percentage of Children Less Than Five Years Who Slept Under<br />
An LLIN The Night Preceding The <strong>Survey</strong> (n=1596)<br />
52.6<br />
Bauchi<br />
6.3<br />
Delta<br />
79.6<br />
Gombe<br />
36.8<br />
Jigawa<br />
67.8<br />
Kaduna<br />
32.1<br />
Kano<br />
42.6<br />
Rivers<br />
35.5<br />
Control (Kaduna and Delta)<br />
Intervention (7 States)<br />
44.6 42.5<br />
All<br />
12 Malaria Control Booster Project
Percent<br />
Figure 4. Use of LLIN During Last Pregnancy and After Child Birth<br />
(Mother With Infants 0-11 months)<br />
100<br />
90<br />
80<br />
70<br />
60<br />
50<br />
40<br />
32<br />
39<br />
32<br />
30<br />
20<br />
10<br />
0<br />
Slept under LLIN during<br />
last pregnancy<br />
Slept under LLIN last<br />
night<br />
LLIN hanging and slept<br />
last night<br />
From the result of the nine states surveyed, at least<br />
71.7 percent mothers with infants aged 0 to 11<br />
months received at least one ANC during pregnancy<br />
from a doctor, nurse, midwife, or CHEW. Anambra<br />
leads, with 83.6 percent, followed by Kaduna (69.6<br />
percent). In Jigawa, Kano, Gombe, and Akwa Ibom<br />
fewer than half of the mothers received ANC during<br />
pregnancy.<br />
Table 4. <strong>Household</strong> Indoor Residual<br />
Spraying (IRS)<br />
Percent of households sprayed with IRS in previous<br />
12 months<br />
State N %<br />
Akwa Ibom 190 1.1<br />
Anambra 171 2.3<br />
Bauchi 171 0.6<br />
Delta 190 0.5<br />
Gombe 152 0.0<br />
Jigawa 171 27.5<br />
Kaduna 171 17.0<br />
Kano 190 3.7<br />
Rivers 190 0.5<br />
Control (Kaduna and Delta) 361 8.3<br />
Intervention (7 states) 1235 5.0<br />
All 1596 5.8<br />
IPT during Pregnancy. Over the last few years,<br />
NMCP promoted IPT during pregnancy and supplied<br />
IPT drugs to the states. The program also trained health<br />
workers on IPT as part of the training on malaria in<br />
pregnancy in all of the states. In addition, various BCC<br />
materials were also produced. Kaduna ranked first with<br />
45.6 percent, followed by Gombe with 34.2 percent<br />
of mothers receiving IPT during her last pregnancy<br />
(Figure 6). Anambra had the lowest IPT coverage (12.3<br />
percent). The control states had a higher IPT rate (28.3<br />
percent) than intervention states (16.6 present). However,<br />
improvement did occur in accessing IPT in <strong>2010</strong><br />
compared to the 2006 survey result.<br />
Fever and Artemisinin-<br />
Based Combination<br />
Therapy (ACT)<br />
Malaria continues to be the leading cause of disease<br />
in children under five years and the major reason<br />
for seeking health care. It is estimated that 30 percent<br />
of childhood deaths are due to malaria. This is<br />
also the major health care expenditure of the family<br />
and reason for absence in the school. Most of the<br />
deaths in children occur within 24 hours. The na-<br />
<strong>2010</strong> Malaria <strong>Household</strong> <strong>Survey</strong> in Nine States of <strong>Nigeria</strong> 13
Figure 5. Percentage of women with children
Percent<br />
100<br />
90<br />
80<br />
70<br />
60<br />
50<br />
40<br />
30<br />
20<br />
10<br />
0<br />
Figure 7. Percentage of Children Less Than Five Years With Fever Treated With ACT Within 24 Hours<br />
Akwa<br />
Ibom<br />
Anambra Bauchi Delta Gombe Jigawa Kaduna Kano Rivers Control<br />
(Kaduna<br />
Project<br />
(7 States)<br />
and<br />
Delta)<br />
All<br />
of children received treatment with ACT within 24<br />
hours. In Kano, 8.9 percent children received treatment<br />
with ACT within 24 hours. The rate is lowest in<br />
Jigawa, at 1.8 percent. The rate in intervention states<br />
is almost double (5.8 percent) that of control states<br />
(3.3 percent). There was improvement in accessing<br />
ACT in <strong>2010</strong> compared to 2006 result.<br />
Breastfeeding<br />
Exclusive breast feeding (EBF) up to five months is<br />
recommended by the national guideline and is a key<br />
determinant of child survival. Of mothers with infants<br />
(0 to 5 months), 85 percent were currently breast<br />
feeding and 25 percent were EBF (Table 5). Of infants<br />
younger than six months, 63 percent were given plain<br />
water while breast feeding. Approximately 11 percent<br />
of infants were given infant formula. Generally, EBF<br />
was better in the northern region compared to the<br />
south, which can be attributed to cultural practices.<br />
Twenty-seven percent of those younger than six months<br />
were bottle fed, 10.4 percent of infants between 6 and<br />
11 months were not given any solid or semisolid food.<br />
Diarrhea and Oral<br />
Rehydration Therapy (ORT)<br />
Approximately 15 to 20 percent of deaths in children<br />
under five years are attributed to diarrheal illness,<br />
which is one of the main causes of morbidity in children,<br />
with consequences of malnutrition and death.<br />
In the survey population among children under five<br />
with diarrhea, 29.5 percent received ORT during diarrhea<br />
(Table 6). The rate of ORT use was highest (60.2<br />
Table 5. Breastfeeding and Exclusive Breastfeeding (EBF)<br />
Infants aged between 0 and 11 and 0 and 5 months; percent distribution by current breast feeding, EBF, and<br />
breast milk plus other liquids<br />
Currently Exclusive<br />
Breast Milk and Other Foods<br />
Age<br />
(months)<br />
Breastfeeding<br />
(%)<br />
Breastfeeding<br />
(%)<br />
Plain<br />
Water<br />
(%)<br />
Infant<br />
Formula<br />
(%)<br />
Other<br />
Milk (%)<br />
Fruit<br />
Juice (%)<br />
Tea/<br />
Coffee<br />
(%)<br />
Other<br />
Liquid<br />
(%)<br />
Traditional<br />
Medicine<br />
(%)<br />
0–5 85.1 24.9 63.1 10.6 8.1 1.5 1.9 7.5 4.6<br />
<strong>2010</strong> Malaria <strong>Household</strong> <strong>Survey</strong> in Nine States of <strong>Nigeria</strong> 15
Table 6. Oral Rehydration Therapy (ORT)<br />
during Diarrhea<br />
Percentage of children aged 0 to 59 months with<br />
diarrhea in the last two weeks who received oral<br />
rehydration solution (ORS), RHF, or both<br />
State N %<br />
Akwa Ibom 190 18.9<br />
Anambra 171 22.2<br />
Bauchi 171 20.5<br />
Delta 190 13.2<br />
Gombe 152 <strong>21</strong>.1<br />
Jigawa 171 25.1<br />
Kaduna 171 60.2<br />
Kano 190 52.1<br />
Rivers 190 31.6<br />
Control (Kaduna and Delta) 361 35.5<br />
Intervention (7 states) 1235 27.8<br />
All 1596 29.5<br />
percent) in Kaduna, followed by Kano (52.1 percent).<br />
ORT coverage in Delta is the lowest, at 13.2 percent.<br />
ORT coverage in intervention states is lower (27.8 percent)<br />
than in control states (35.5 percent).<br />
Vaccination of Infants<br />
Vaccine-preventable diseases account for more than<br />
20 percent of infant deaths in <strong>Nigeria</strong>. The vaccination<br />
coverage figure shown in Table 7 is by card and<br />
history. Anambra ranked first in DPT3 coverage (65.5<br />
percent), and Kaduna ranked first in measles coverage<br />
(71.3 percent). Overall, 30 percent are fully immunized<br />
children (FIC). The FIC rate was almost half<br />
for children at 12 months (16 percent). FIC coverage<br />
is higher (41 percent) in control areas than in intervention<br />
states (26.2 percent). The control states have<br />
better performance for DPT3 and FIC.<br />
Behavior Change and<br />
Communication (BCC)<br />
The NMCBP has as part of its component objectives<br />
the strengthening of the health care system<br />
to improve delivery of the Malaria Plus Package<br />
(MPP) interventions in target states, which included<br />
strengthening community mobilization and communication<br />
for behavior change. During the past<br />
few years, the NMCP developed a BCC strategy for<br />
Table 7. DPT3 and Measles Vaccination of Infants<br />
Percent of infants aged 12 to 23 months who are vaccinated with DPT3 and measles; percent of FIC<br />
State N DPT3 (%) Measles (%) FIC (%)<br />
Akwa Ibom 190 59.5 55.3 36.8<br />
Anambra 171 65.5 66.1 52.0<br />
Bauchi 171 22.2 45.6 14.0<br />
Delta 190 47.9 57.4 38.4<br />
Gombe 152 32.2 42.1 23.0<br />
Jigawa 171 5.8 30.4 1.8<br />
Kaduna 171 54.4 71.3 43.9<br />
Kano 190 <strong>21</strong>.6 40.0 14.7<br />
Rivers 190 55.8 51.1 38.9<br />
Control (Kaduna and Delta) 361 51.0 64.0 41.0<br />
Intervention (7 states) 1235 38.0 47.4 26.2<br />
All 1596 40.9 51.0 29.5<br />
16 Malaria Control Booster Project
100<br />
90<br />
Figure 8. Knowledge of symptoms, prevention and treatment of malaria among<br />
mothers/caretakers with children under five years (n=1596)<br />
80<br />
70<br />
60<br />
50<br />
40<br />
30<br />
20<br />
10<br />
0<br />
At least two symptoms<br />
of malaria<br />
When to seek<br />
treatment for malaria<br />
At least two ways of<br />
preventing malaria<br />
Prevent malaria in<br />
pregnancy with IPT<br />
ITN can prevent<br />
malaria<br />
All 61.7 74.9 46.7 25.1 32.1<br />
Project 62.3 76.2 45.7 24 33<br />
Control 59 3 70 4 50 1 29 1 29 1<br />
effective communication at the provider, household,<br />
and community levels. The BCC approach included<br />
communication through multiple channels. At the<br />
community level, role model caregivers and religious<br />
and traditional leaders were mobilized to convey the<br />
message about malaria. In addition, radio, television,<br />
and print media were also used. Figure 8 shows various<br />
knowledge indicators by control and intervention<br />
area. Approximately 75 percent of respondent<br />
mothers know when to seek treatment for malaria<br />
and 61.7 percent know at least two symptoms of<br />
malaria. About 47 percent of mothers know at least<br />
two ways to prevent malaria, but only 32.1 percent<br />
know that ITN can prevent malaria. Twenty-five percent<br />
know how to prevent malaria during pregnancy<br />
with IPT.<br />
Intensification of BCC efforts is needed, especially in<br />
the area of IPT and ITN and their use.<br />
Table 8 presents changes in selected indicators<br />
from the baseline LQAS survey in 2006. A remarkable<br />
change is observed in LLIN coverage from 2 to<br />
88 percent. The use of ITN also rose from 3 to 44.6<br />
percent. The other indicator showing significant improvement<br />
is IPT in pregnant women (9.0 vs. 16.6<br />
percent). A total of 5.8 percent of children received<br />
ACT for treatment of malaria compared to zero in<br />
2006. Five percent of households were sprayed with<br />
IRS compared to 3 percent in 2006.<br />
In <strong>2010</strong>, 72 percent of mothers received at least one<br />
antenatal visit compared to 62 percent in 2006. No<br />
significant changes were observed in ORT use during<br />
diarrhea and exclusive breast feeding. The coverage<br />
of infant vaccination of DPT3 and measles almost<br />
tripled between 2006 and <strong>2010</strong>.<br />
The behavior change components were not assessed<br />
in the 2006 survey, so a comparison cannot be made<br />
to show progress levels.<br />
Progress by Selected<br />
Indicators<br />
Analysis of Project Outcome<br />
Indicators<br />
Table 9 presents data from the baseline, midline,<br />
and end of project (EOP) targets by project out-<br />
<strong>2010</strong> Malaria <strong>Household</strong> <strong>Survey</strong> in Nine States of <strong>Nigeria</strong> 17
Table 8. Changes in Selected Indicators between 2006 and <strong>2010</strong> LQAS <strong>Survey</strong>s<br />
Indicator 2006 (%) <strong>2010</strong> (%)<br />
IRS<br />
Percent of households sprayed with IRS in previous 12 months 3.0 5.0<br />
LLIN<br />
Percentage of households with at least one ITN or LLIN 2.2 88.0<br />
Percentage of children under 5 years who slept under an LLIN the night before the survey 3.0 44.6<br />
ACT<br />
Percentage of children under 5 years with fever treated with an effective antimalarial within 24 0.0 5.8<br />
hours from the onset of symptom<br />
IPT<br />
Percentage of pregnant women who received two or more doses of IPT 9.0 16.6<br />
ANC<br />
Percentage of women with children under 1 year who received ANC care during last pregnancy 62.0 72.0<br />
(one or more visits)<br />
ORT<br />
Percent of children aged 0–59 months with diarrhea in the last two weeks who received ORS, RHF, 26.0 27.8<br />
or both<br />
Vaccination<br />
Percent of infants aged 12–23 months who were vaccinated with the DPT3 vaccines 12.0 38.0<br />
Percent of infants aged 12–23 months who were vaccinated with the measles vaccines 13.0 47.4<br />
Exclusive Breast Feeding<br />
Percent of infants aged 0–6 months who were fed breast milk only in the last 24 hours 27.0 25.9<br />
come indicators. Except for the indicator related<br />
to LLINs, no other indicators have reached their<br />
targets. The remarkable gain achieved in LLIN<br />
coverage as a result of mass distribution of LLINs<br />
state by state in the shortest possible time and firm<br />
commitment of development partners and federal,<br />
state, and local government and social mobilization<br />
at the community level. However, the greatest challenge<br />
remains the use of LLINs every night throughout<br />
the year. The progress on ACT is the lowest of all<br />
indicators and unlikely to meet its target by the end<br />
of the project unless drastic actions are taken to make<br />
ACT available at the community level. Communitydirected<br />
intervention has the greatest potential to<br />
make this indicator achievable if implemented quickly<br />
and effectively. Similarly, role model mothers can be<br />
useful in prevention of malaria in pregnancy with IPT<br />
intervention; the target of 80 percent for two doses of<br />
IPT during pregnancy can be achieved if IPT is made<br />
available at the primary health care level.<br />
There is a steady increase in ANC from 62 to 72 percent.<br />
With increased awareness and provision of services,<br />
expectations are that the 80 percent target can<br />
be achieved by the EOP. The coverage of DPT3 and<br />
measles vaccination made some improvement compared<br />
to baseline. However, without scale up of interventions<br />
and mobilization of resources, it will be<br />
difficult to achieve the target by the EOP. Similarly,<br />
ORT and EBF require integrated community-level interventions.<br />
It is expected that the integrated maternal,<br />
newborn, and child health strategy and interventions<br />
aimed at the community and primary care levels<br />
will improve coverage in these areas.<br />
18 Malaria Control Booster Project
Table 9. Project Outcome Indicators: Baseline, Midline, and End of Project<br />
Indicator 2006 (%) <strong>2010</strong> (%) EOP (%)<br />
LLIN<br />
Percentage of households with at least one ITN or LLIN 2.2 88.0 80<br />
Percentage of children under 5 years who slept under an LLIN the night before the 3.0 44.6 80<br />
survey<br />
ACT<br />
Percentage of children under 5 years with fever treated with an effective antimalarial 0.0 5.8 80<br />
within 24 hours from the onset of symptom<br />
IPT<br />
Percentage of pregnant women who received two or more doses of IPT 9.0 16.6 60<br />
ANC<br />
Percentage of women with children under 1 year who received ANC care during 62.0 72.0 80<br />
last pregnancy (one or more visits)<br />
ORT<br />
Percent of children aged 0–59 months with diarrhea in the last two weeks who 26.0 27.8 50<br />
received ORS, RHF, or both<br />
Vaccination<br />
Percent of infants aged 12–23 months who are vaccinated with the DPT3 vaccines 12.0 38.0 80<br />
Percent of infants aged 12–23 months who are vaccinated with the measles vaccines 13.0 47.4 80<br />
Exclusive Breast Feeding<br />
Percent of infants aged 0–6 months who were fed breast milk only in the last 24<br />
hours<br />
27.0 25.9 50<br />
REFERENCES<br />
1. Federal Ministry of Health. 2008. Integrated Maternal,<br />
Newborn and Child Health Strategy. Abuja, <strong>Nigeria</strong>: Federal<br />
Ministry of Health.<br />
2. Federal Ministry of Health, National Malaria Control<br />
Programme. 2009. Strategic Plan 2009-2013. A Road Map<br />
for Malaria Control in <strong>Nigeria</strong>. Abuja, <strong>Nigeria</strong>: Federal<br />
Ministry of Health.<br />
3. Federal Ministry of Health (FMOH), <strong>Nigeria</strong>; and Public<br />
Health Services and Solutions (PHSS). 2008. <strong>Nigeria</strong> LQAS<br />
Baseline <strong>Household</strong> <strong>Survey</strong> 2006. Abuja, <strong>Nigeria</strong>: National<br />
Malaria Control Programme.<br />
4. Hedt, Bethany, Caesy Olives, Marcello Pagano, JJ Vladez.<br />
2008. Large Country-Lot Quality Assurance Sampling: A<br />
new Method of Rapid Monitoring and Evaluation of Health,<br />
Nutrition, and Population Programs at Sub-national Levels.<br />
HNP Discussion Paper. May 2008, 60.<br />
Contributors<br />
Festus Okoh, M&E Unit, NMCP<br />
Mizan Siddiqi, Principal Investigator, PHSS<br />
Olayemi Bimbo, M&E Unit, NMCP<br />
F. Adeosun, M&E Unit, NMCP<br />
Aro Modu, M&E Unit, NMCP<br />
Omoeboh Mamadu, M&E Unit, NMCP<br />
Sola Oresanya, M&E Unit, NMCP<br />
Bala Audu, M&E Unit, NMCP<br />
Adamu Garba, Programme Manager, Jigawa State<br />
Abere Abiye, M&E Unit, Rivers State<br />
Wole Odutolu, Health Specialist, <strong>World</strong> <strong>Bank</strong><br />
S. Shridhar, Consultant, <strong>World</strong> <strong>Bank</strong><br />
<strong>2010</strong> Malaria <strong>Household</strong> <strong>Survey</strong> in Nine States of <strong>Nigeria</strong> 19
Annex 1. Demographic and Socioeconomic Characteristics by State<br />
Akw-Ibom Anambra Bauchi Delta Gombe Jigawa Kaduna Kano Rivers<br />
n = 190 n = 171 n = 171 n = 190 n = 152 n = 171 n = 171 n = 190 n = 190<br />
Variable (%) (%) (%) (%) (%) (%) (%) (%) (%)<br />
Gender<br />
Male<br />
Female<br />
66.7<br />
33.3<br />
53.5<br />
46.5<br />
97.1<br />
2.9<br />
42.9<br />
57.1<br />
90.8<br />
9.2<br />
98.8<br />
1.2<br />
81.9<br />
18.1<br />
96.3<br />
3.7<br />
84.7<br />
15.3<br />
Marital Status<br />
Single<br />
Married<br />
Widow<br />
Others<br />
2.1<br />
89.9<br />
7.9<br />
0.0<br />
3.6<br />
81.7<br />
14.8<br />
0.0<br />
1.8<br />
98.2<br />
0.0<br />
0.0<br />
6.9<br />
79.8<br />
12.2<br />
1.1<br />
0.7<br />
94.0<br />
3.3<br />
2.0<br />
2.3<br />
96.5<br />
1.2<br />
0.0<br />
0.5<br />
99.5<br />
0.0<br />
0.0<br />
2.6<br />
93.7<br />
3.7<br />
0.0<br />
2.7<br />
91.9<br />
5.1<br />
0.3<br />
Age<br />
15–19<br />
19–24<br />
25–29<br />
30–34<br />
35–39<br />
40–44<br />
45–49<br />
50–54<br />
55+<br />
2.4<br />
7.2<br />
8.4<br />
11.4<br />
7.8<br />
7.8<br />
10.2<br />
10.2<br />
34.7<br />
0.0<br />
2.1<br />
5.3<br />
12.6<br />
9.5<br />
7.4<br />
9.5<br />
12.6<br />
41.1<br />
0.6<br />
3.6<br />
9.0<br />
9.6<br />
11.4<br />
13.8<br />
9.6<br />
12.6<br />
29.9<br />
2.5<br />
7.6<br />
5.9<br />
12.7<br />
8.5<br />
11.0<br />
9.3<br />
10.2<br />
32.2<br />
0.0<br />
1.4<br />
6.8<br />
12.2<br />
10.8<br />
11.5<br />
10.1<br />
8.8<br />
38.5<br />
0.0<br />
1.2<br />
4.3<br />
7.3<br />
11.0<br />
14.0<br />
11.6<br />
20.7<br />
29.9<br />
0.0<br />
3.4<br />
6.1<br />
13.5<br />
10.1<br />
15.5<br />
10.8<br />
4.7<br />
35.8<br />
0.5<br />
2.1<br />
4.3<br />
8.6<br />
5.9<br />
20.9<br />
15.0<br />
9.1<br />
33.7<br />
0.0<br />
2.2<br />
8.1<br />
12.6<br />
15.6<br />
11.9<br />
8.9<br />
11.9<br />
28.9<br />
Education<br />
No education<br />
Primary<br />
Secondary<br />
Higher secondary<br />
13.7<br />
48.4<br />
31.6<br />
6.3<br />
7.6<br />
43.9<br />
32.2<br />
16.4<br />
56.1<br />
20.5<br />
12.9<br />
10.5<br />
15.3<br />
32.6<br />
42.1<br />
10.0<br />
63.2<br />
19.1<br />
9.9<br />
7.9<br />
62.0<br />
7.1<br />
8.8<br />
10.5<br />
35.1<br />
9.5<br />
9.9<br />
14.4<br />
53.2<br />
<strong>21</strong>.6<br />
14.2<br />
11.1<br />
10.5<br />
23.2<br />
42.6<br />
23.7<br />
Access to electricity 62.4 88.9 38.6 79.4 32.4 23.7 57.9 48.4 51.1<br />
<strong>Household</strong> Asset<br />
Radio<br />
Television<br />
Refrigerator<br />
Bicycle<br />
Motorcycle<br />
Car<br />
83.6<br />
62.4<br />
27.0<br />
60.2<br />
56.1<br />
16.8<br />
87.7<br />
74.9<br />
51.8<br />
17.1<br />
36.8<br />
32.7<br />
77.8<br />
18.3<br />
10.1<br />
50.6<br />
42.0<br />
11.2<br />
Land ownership 82.9 62.7 86.1 49.7 79.9 79.8 65.2 84.4 71.4<br />
64.2<br />
69.5<br />
34.4<br />
29.3<br />
30.5<br />
11.8<br />
69.1<br />
16.7<br />
9.7<br />
46.7<br />
46.0<br />
6.8<br />
75.9<br />
13.8<br />
5.5<br />
40.4<br />
44.7<br />
10.2<br />
92.4<br />
59.1<br />
31.2<br />
48.5<br />
60.6<br />
24.1<br />
91.0<br />
36.2<br />
13.3<br />
74.9<br />
63.9<br />
16.4<br />
77.9<br />
47.7<br />
32.3<br />
36.5<br />
30.1<br />
13.8<br />
20 Malaria Control Booster Project
Annex 1. Demographic and Socioeconomic Characteristics by State (continued)<br />
Variable<br />
Source of drinking<br />
water<br />
Piped into residence<br />
Piped into yard<br />
Public piped<br />
Well with pump<br />
Well without pump<br />
Cart pusher<br />
Tanker truck<br />
Rain water<br />
Other<br />
Toilet Type<br />
Flush toilet<br />
Pit<br />
Bush<br />
Other<br />
Flooring in the<br />
house<br />
Dirt, sand, dung<br />
Wood or plank<br />
Cement<br />
Parquet or polished<br />
wood<br />
Tiles<br />
Other<br />
Akw-Ibom<br />
n = 190<br />
(%)<br />
2.6<br />
1.1<br />
16.4<br />
20.1<br />
5.8<br />
0.5<br />
49.7<br />
0.0<br />
3.7<br />
9.5<br />
79.4<br />
2.1<br />
9.0<br />
24.3<br />
0.0<br />
70.9<br />
0.0<br />
3.7<br />
1.1<br />
Anambra<br />
n = 171<br />
(%)<br />
1.8<br />
2.9<br />
17.5<br />
25.7<br />
1.2<br />
0.0<br />
31.6<br />
8.8<br />
10.5<br />
42.7<br />
49.1<br />
6.4<br />
1.8<br />
3.5<br />
0.6<br />
90.1<br />
0.0<br />
5.8<br />
0.0<br />
Bauchi<br />
n = 171<br />
(%)<br />
4.1<br />
0.6<br />
5.8<br />
16.4<br />
62.6<br />
1.8<br />
8.2<br />
0.6<br />
0.0<br />
2.9<br />
90.1<br />
7.0<br />
0.0<br />
62.6<br />
0.0<br />
6.6<br />
0.6<br />
0.0<br />
9.5<br />
Delta<br />
n = 190<br />
(%)<br />
8.9<br />
7.4<br />
25.3<br />
8.9<br />
31.1<br />
0.5<br />
16.3<br />
0.5<br />
1.1<br />
37.9<br />
28.9<br />
23.7<br />
9.5<br />
7.9<br />
4.7<br />
75.3<br />
0.0<br />
2.6<br />
0.0<br />
Gombe<br />
n = 152<br />
(%)<br />
4.0<br />
1.3<br />
2.0<br />
15.9<br />
51.7<br />
0.7<br />
23.2<br />
1.3<br />
0.0<br />
2.0<br />
84.8<br />
12.6<br />
0.7<br />
63.2<br />
2.6<br />
33.6<br />
0.7<br />
0.0<br />
9.4<br />
Jigawa<br />
n = 171<br />
(%)<br />
11.2<br />
5.3<br />
2.9<br />
36.5<br />
28.2<br />
0.0<br />
15.3<br />
0.6<br />
0.0<br />
2.9<br />
72.9<br />
24.1<br />
0.0<br />
69.4<br />
0.0<br />
<strong>21</strong>.2<br />
0.0<br />
0.0<br />
0.0<br />
Kaduna<br />
n = 171<br />
(%)<br />
13.0<br />
2.4<br />
3.0<br />
8.3<br />
63.9<br />
1.8<br />
7.1<br />
0.6<br />
0.0<br />
9.4<br />
84.2<br />
5.8<br />
0.6<br />
20.5<br />
0.6<br />
78.9<br />
0.0<br />
0.0<br />
1.6<br />
Kano<br />
n = 190<br />
(%)<br />
5.3<br />
2.1<br />
1.1<br />
37.0<br />
43.4<br />
5.8<br />
4.8<br />
0.0<br />
0.5<br />
4.2<br />
95.3<br />
0.0<br />
0.5<br />
43.9<br />
0.0<br />
54.5<br />
0.0<br />
6.8<br />
7.4<br />
Rivers<br />
n = 190<br />
(%)<br />
13.8<br />
3.7<br />
4.8<br />
13.8<br />
40.2<br />
0.0<br />
20.6<br />
2.6<br />
0.5<br />
22.6<br />
36.6<br />
<strong>21</strong>.5<br />
19.4<br />
16.3<br />
1.1<br />
68.4<br />
0.0<br />
2.2<br />
3.3<br />
<strong>2010</strong> Malaria <strong>Household</strong> <strong>Survey</strong> in Nine States of <strong>Nigeria</strong> <strong>21</strong>
Annex 2: Selected Indicators by State<br />
AI<br />
(%)<br />
Anambra<br />
(%)<br />
Bauchi<br />
(%)<br />
Indicator<br />
IRS<br />
Percent of households sprayed with IRS in last 12 months 1.1 2.3 0.6 0.5 0.0 27.5 17.0 3.7 0.5 8.3 5.0 5.8<br />
LLIN<br />
Percentage of households with at least two LLINs 83.0 74.3 90.1 3.2 86.8 94.7 85.4 70.5 71.6 42.1 81.3 72.4<br />
Percentage of children under 5 years who slept under an<br />
24.0<br />
LLIN the night before the survey 49.5<br />
52.6 6.3 79.6 36.8 67.8 32.1 42.6 35.5 44.6 42.5<br />
ACT<br />
Delta<br />
(%)<br />
Gombe<br />
(%)<br />
Jigawa<br />
(%)<br />
Kaduna<br />
(%)<br />
Kano<br />
(%)<br />
Rivers<br />
(%)<br />
Control<br />
(%)<br />
Intervention<br />
(%)<br />
Percentage of children under 5 years with fever treated<br />
with an effective antimalarial within 24 hours from the<br />
onset of symptom 3.7 7.0 4.7 3.7 8.6 1.8 2.9 8.9 6.3 3.3 5.8 5.3<br />
IPT<br />
Percentage of pregnant women who received two or<br />
more doses of IPT 20.5 12.3 31.6 20.0 34.2 22.2 45.6 32.6 14.2 28.3 16.6 25.6<br />
All<br />
(%)<br />
Knowledge<br />
Percentage of mothers who know at least two symptoms<br />
of malaria 53.7 47.4 69.0 46.8 72.4 62.0 73.1 73.7 59.5 59.3 62.3 61.7<br />
Percentage of mothers who know when to seek treatment 68.9 70.8 80.7 57.9 88.8 71.9 76.6 82.1 72.1 70.4 76.2 74.9<br />
Percentage of mothers who know at least two ways of<br />
preventing malaria 45.8 32.2 52.6 36.3 45.4 43.3 65.5 66.3 33.7 50.1 45.7 46.7<br />
Percentage of mothers who know how to prevent malaria<br />
in pregnancy with IPT 29.5 20.5 31.0 17.9 37.5 12.3 41.5 20.0 18.9 29.1 24.0 25.1<br />
Percentage of mothers who know LLIINs can prevent<br />
malaria 33.2 24.6 36.3 3.2 46.1 24.0 57.9 45.8 22.6 29.1 33.0 32.1<br />
ANC<br />
Percentage of women with children younger than 1 year<br />
who received ANC care during last pregnancy 44.7 83.6 53.2 68.9 48.0 42.1 69.6 43.7 50.0 63.6 53.8 55.9<br />
ORT<br />
Percent of children aged 0–59 months with diarrhea in the<br />
last two weeks who received ORS, RHF, or both 18.9 22.2 20.5 13.2 <strong>21</strong>.1 25.1 60.2 52.1 31.6 35.5 27.8 29.5<br />
Vaccination<br />
Percent of infants aged 12–23 months who were vaccinated<br />
with the DPT3 vaccines 59.5 65.5 22.2 47.9 32.2 5.8 54.4 <strong>21</strong>.6 55.8 51.0 38.0 40.9<br />
Percent of infants aged 12–23 months who were vaccinated<br />
with the measles vaccines 55.3 66.1 45.6 57.4 42.1 30.4 71.3 40.0 51.1 64.0 47.4 51.0<br />
EBF<br />
Percent of infants aged 0–6 months who were fed breast<br />
milk only in the last 24 hours 37.3 6.8 33.8 7.9 31.7 25.4 45.1 19.4 34.1 <strong>21</strong>.7 25.9 24.9<br />
22 Malaria Control Booster Project
Annex 3. List of Supervisors, Interviewers, and Monitors<br />
State LGA Name <strong>Survey</strong> Designation<br />
Akwa IBOM Ibeno Iniobong C. Okon Supervisor<br />
Akwa Ibom Ibeno Ekaete N. Umoh Interviewer<br />
Akwa Ibom Ibeno Sunday J. Akpan Interviewer<br />
Akwa Ibom Ikono Godwin Archibong Supervisor<br />
Akwa Ibom Ikono Solomon O. Ette Interviewer<br />
Akwa Ibom Ikono Florence S. Ekanem Interviewer<br />
Akwa Ibom Ini Uduak Umo-Udofia Supervisor<br />
Akwa Ibom Ini Godwin G. Akpaidem Interviewer<br />
Akwa Ibom Ini Udo Okonnah Interviewer<br />
Akwa Ibom Itu Veronica I. Itina Supervisor<br />
Akwa Ibom Itu Alice Okon Esien Interviewer<br />
Akwa Ibom Itu Okon B. Ekanem Interviewer<br />
Akwa Ibom Esit Eket Evelyn J. Eyo Supervisor<br />
Akwa Ibom Esit Eket R. B. Archibong Interviewer<br />
Akwa Ibom Esit Eket Udo W. Enombong Interviewer<br />
Akwa Ibom Nsit Ubium Ezekiel Nkanta Supervisor<br />
Akwa Ibom Nsit Ubium Emmanuel Akpan Interviewer<br />
Akwa Ibom Nsit Ubium Glory E. D. Akpan Interviewer<br />
Akwa Ibom Okobo Essien K. Akpan Supervisor<br />
Akwa Ibom Okobo Emem U. Akpan Interviewer<br />
Akwa Ibom Okobo Eyo A. Okoh Interviewer<br />
Akwa Ibom Onna Joan Ekong Supervisor<br />
Akwa Ibom Onna Enobong Eteh Interviewer<br />
Akwa Ibom Onna U. D. Uko Interviewer<br />
Akwa Ibom Oruk anam Bassey E. Akpan Supervisor<br />
Akwa Ibom Oruk anam Joseph M. Udo Interviewer<br />
Akwa Ibom Oruk anam Rosemary Idiong Interviewer<br />
Akwa Ibom Ukanafun Micheal O. Akpan Supervisor<br />
Akwa Ibom Ukanafun Aniekan F. Umanah Interviewer<br />
Akwa Ibom Ukanafun Inemesit I. Udom Interviewer<br />
Anambra Anaocha Dr. S. A. Nwabueze Supervisor<br />
Anambra Anaocha Ilika Chinazo Interviewer<br />
Anambra Anaocha Udoji Grace Interviewer<br />
Anambra Awka North Virginia N. Onwuvunka Supervisor<br />
Anambra Awka North Bridget Nwanelo Interviewer<br />
(continued)<br />
<strong>2010</strong> Malaria <strong>Household</strong> <strong>Survey</strong> in Nine States of <strong>Nigeria</strong> 23
Annex 3. List of Supervisors, Interviewers, and Monitors (continued)<br />
State LGA Name <strong>Survey</strong> Designation<br />
Anambra Awka North Onuchukwu Lotanna Interviewer<br />
Anambra Awka South Ike Edith Supervisor<br />
Anambra Awka South Nwafor Victoria Interviewer<br />
Anambra Awka South Obieze Uju Interviewer<br />
Anambra Dunukofia B. O. Okonkwo Supervisor<br />
Anambra Dunukofia Anakwenze Chinonye Interviewer<br />
Anambra Dunukofia Obidi S. Mbonu Interviewer<br />
Anambra Idemili North M. E. Chukwujeku Supervisor<br />
Anambra Idemili North Achebe Chizoba Interviewer<br />
Anambra Idemili North Augustina Chukwura Interviewer<br />
Anambra Idemili South Lambert C. Okeke Supervisor<br />
Anambra Idemili South Igbokwe Tobenna Interviewer<br />
Anambra Idemili South J. I. Ukuagba Interviewer<br />
Anambra Njikoka Dr. Njelita Chukwudi Supervisor<br />
Anambra Njikoka C. O. Arachie Interviewer<br />
Anambra Njikoka E. Chiekezie Interviewer<br />
Anambra Nnewi North Adogu Supervisor<br />
Anambra Nnewi North Dr. Frances Ilika Interviewer<br />
Anambra Nnewi North P. Akaegbobi Interviewer<br />
Anambra Onitsha North Julie N. Echendu Supervisor<br />
Anambra Onitsha North L. O. Chukwurah Interviewer<br />
Anambra Onitsha North Ejiofo Chikaodili Interviewer<br />
Bauchi Alkaleri Muhd Lawal Ibrahim Supervisor<br />
Bauchi Alkaleri Hamza Sajeje Interviewer<br />
Bauchi Alkaleri Ibrahim Yolama Interviewer<br />
Bauchi Damban Abubakar Musa Usman Supervisor<br />
Bauchi Damban Abubakar H. Bappah Interviewer<br />
Bauchi Damban Ajiya Daboh Interviewer<br />
Bauchi Darazo Danladi Abdul Mohammed Supervisor<br />
Bauchi Darazo Abdu Mohammed Interviewer<br />
Bauchi Darazo Adamu Dauda Udabo Interviewer<br />
Bauchi Gamawa Aliyu Jibrin Wandas Supervisor<br />
Bauchi Gamawa Bala Zailani Interviewer<br />
Bauchi Gamawa Sani Adamu Interviewer<br />
Bauchi Jama’are Haruna Adamu Tiffi Supervisor<br />
(continued)<br />
24 Malaria Control Booster Project
Annex 3. List of Supervisors, Interviewers, and Monitors (continued)<br />
State LGA Name <strong>Survey</strong> Designation<br />
Bauchi Jama’are Muhktar Moh’d Interviewer<br />
Bauchi Jama’are Saidu Abubakar Interviewer<br />
Bauchi Katagum Aliyu Munkaila Supervisor<br />
Bauchi Katagum Inuwa Garba Shekal Interviewer<br />
Bauchi Katagum Shehu Gana Interviewer<br />
Bauchi Kirfi Dr. Lawan S. Abubakar Supervisor<br />
Bauchi Kirfi Hajara Moses John Interviewer<br />
Bauchi Kirfi Shehu Umar Interviewer<br />
Bauchi Shira Musa A. Muhammad Supervisor<br />
Bauchi Shira Adamu Garba Yusuf Interviewer<br />
Bauchi Shira Mohd Kabir Umar Interviewer<br />
Bauchi Warji Sulaiman Danladi Supervisor<br />
Bauchi Warji Abdu Saleh Garba Interviewer<br />
Bauchi Warji Iliya D. Ishaku Interviewer<br />
Delta Aniocha North Dr. A .N. Okolo Supervisor<br />
Delta Aniocha North Teresa Anikwue Interviewer<br />
Delta Aniocha North Franca Omesiete Interviewer<br />
Delta Burutu Dr. Ogheneruru Layegue Supervisor<br />
Delta Burutu Charles Kokole Interviewer<br />
Delta Burutu Wikimor O. Frederick Interviewer<br />
Delta Ethiope West Moriafe I . Anna Supervisor<br />
Delta Ethiope West Mrs.J Egbejule Interviewer<br />
Delta Ethiope West Mrs. Akpotaire Interviewer<br />
Delta Isoko North Dr J. Uyovwiesevwa Supervisor<br />
Delta Isoko North Mrs Offi Rhoda Interviewer<br />
Delta Isoko North Ove Florence Interviewer<br />
Delta Ndokwa East Mrs. M. E. Oyemike Supervisor<br />
Delta Ndokwa East Gloria Olodu Interviewer<br />
Delta Ndokwa East Mrs. Ejech Christy Interviewer<br />
Delta Ndokwa West Mrs. J. Nwokolo sSupervisor<br />
Delta Ndokwa West Mr. John Chisunum Interviewer<br />
Delta Ndokwa West Mrs. H. Izuegbu Interviewer<br />
Delta Sapele Ikikiru Pius Supervisor<br />
Delta Sapele Owen G. Oghenenyerovwo Interviewer<br />
Delta Sapele Mrs. R. V. Akpokona Interviewer<br />
(continued)<br />
<strong>2010</strong> Malaria <strong>Household</strong> <strong>Survey</strong> in Nine States of <strong>Nigeria</strong> 25
Annex 3. List of Supervisors, Interviewers, and Monitors (continued)<br />
State LGA Name <strong>Survey</strong> Designation<br />
Delta Ughelli North Oyeh Juliet Oke Supervisor<br />
Delta Ughelli North Daniel Atete Interviewer<br />
Delta Ughelli North Helen Erueh Interviewer<br />
Delta Uvwie Dr. H. Ohwojedo Supervisor<br />
Delta Uvwie Mrs. Ogbemudia Interviewer<br />
Delta Uvwie Mrs. M Sakpaide Interviewer<br />
Delta Warri South Dr. Taigbenu Supervisor<br />
Delta Warri South Dorothy N. Ehighelua Interviewer<br />
Delta Warri South Marian Ayemere Interviewer<br />
Gombe Akko Ahmed Audu Supervisor<br />
Gombe Akko David Ayo Interviewer<br />
Gombe Akko Moh’d Saleh Interviewer<br />
Gombe Y/DEBA Moh’d Lawan Supervisor<br />
Gombe Y/DEBA Habu Kachalla Interviewer<br />
Gombe Y/DEBA Margaret Magaji Interviewer<br />
Gombe Balanga Sulaiman Mamman Supervisor<br />
Gombe Balanga Edward Usman Interviewer<br />
Gombe Balanga Andrew Tanko Interviewer<br />
Gombe Billiri Esther Holen Supervisor<br />
Gombe Billiri Yusuf Ankama Interviewer<br />
Gombe Billiri Moh’d Zainab Interviewer<br />
Gombe Funakaye Garba Baba Supervisor<br />
Gombe Funakaye Kwiraga Aliyu Interviewer<br />
Gombe Funakaye Musa Dauda Interviewer<br />
Gombe Kaltungo Ahmed Audu Supervisor<br />
Gombe Kaltungo Ibrahim Idi Interviewer<br />
Gombe Kaltungo Boyi Diba Interviewer<br />
Gombe Kwami Aishatu Haruna Supervisor<br />
Gombe Kwami Salihi Adamu Interviewer<br />
Gombe Kwami Moh’d U. Usman Interviewer<br />
Gombe Nafada Sulaiman I. Nafada Supervisor<br />
Gombe Nafada Moh’d Yaya Interviewer<br />
Gombe Nafada Babayo A. Nafada Interviewer<br />
Jigawa Auyo Mohd Gagarawa Supervisor<br />
Jigawa Auyo Ibrahim Uba Moh’d Interviewer<br />
(continued)<br />
26 Malaria Control Booster Project
Annex 3. List of Supervisors, Interviewers, and Monitors (continued)<br />
State LGA Name <strong>Survey</strong> Designation<br />
Jigawa Auyo Yakubu Hamed Interviewer<br />
Jigawa Birnin Kudu Lawan Abdu supervisor<br />
Jigawa Birnin Kudu Moh’d Yahaya Interviewer<br />
Jigawa Birnin Kudu Musa Idris Interviewer<br />
Jigawa Birniwa Bala Birniwa Supervisor<br />
Jigawa Birniwa Lawan Umar Interviewer<br />
Jigawa Birniwa Moh’d Ali Idris Interviewer<br />
Jigawa Buji Kasim Hassan Supervisor<br />
Jigawa Buji Shehu Suleman Interviewer<br />
Jigawa Buji Shuaibu Shehu Interviewer<br />
Jigawa Dutse Bilya Haruna supervisor<br />
Jigawa Dutse Baffa Abdullahi Interviewer<br />
Jigawa Dutse Sani Yusuf Interviewer<br />
Jigawa Garki Magaji Abdulhamid Supervisor<br />
Jigawa Garki Alkassim Y. Abubakar Interviewer<br />
Jigawa Garki Kabiru Shehu Interviewer<br />
Jigawa Guri Adamu Garba Abubakar Supervisor<br />
Jigawa Guri Muh’d Garba Interviewer<br />
Jigawa Guri Moh’d Mai- Samari Interviewer<br />
Jigawa Malam Madori Danlami Aliyu Supervisor<br />
Jigawa Malam Madori Hamza M. Bello Interviewer<br />
Jigawa Malam Madori Shettima Maigana Interviewer<br />
Jigawa Ringim Surajo Nuhu Supervisor<br />
Jigawa Ringim Musa Abdullahi Interviewer<br />
Jigawa Ringim Saidu Magaji Interviewer<br />
Kaduna Chikun Hajara Usman Ahmed Supervisor<br />
Kaduna Chikun Michael Yafai Interviewer<br />
Kaduna Chikun Ruth Yohana Interviewer<br />
Kaduna Giwa Ibrahim Sani Supervisor<br />
Kaduna Giwa Babangida Saleh Interviewer<br />
Kaduna Giwa Shehu Umar Interviewer<br />
Kaduna Kachia Angela A Sheyin Supervisor<br />
Kaduna Kachia Aliyu D Gimba Interviewer<br />
Kaduna Kachia Hosea Shekarau Interviewer<br />
Kaduna Kaduna South Umar S. Kwasallo Supervisor<br />
Kaduna Kaduna South Ibrahim Yusuf Interviewer<br />
(continued)<br />
<strong>2010</strong> Malaria <strong>Household</strong> <strong>Survey</strong> in Nine States of <strong>Nigeria</strong> 27
Annex 3. List of Supervisors, Interviewers, and Monitors (continued)<br />
State LGA Name <strong>Survey</strong> Designation<br />
Kaduna Kaduna South Salisu Shuaibu Interviewer<br />
Kaduna Kaura Daniel Adamu Supervisor<br />
Kaduna Kaura Ishaku Kanwai Interviewer<br />
Kaduna Kaura Simon Bonat Interviewer<br />
Kaduna Kudan Bello Abdullahi Alhazawa Supervisor<br />
Kaduna Kudan Jibril Dalhatu Interviewer<br />
Kaduna Kudan Saidu M. Dahiru Interviewer<br />
Kaduna Sabon-Gari Habila Barem Supervisor<br />
Kaduna Sabon-Gari Aliyu A. Umar Interviewer<br />
Kaduna Sabon-Gari Sanusi Hamza Interviewer<br />
Kaduna Soba Sulaiman H. Yusuf Supervisor<br />
Kaduna Soba Musa Abubakar Interviewer<br />
Kaduna Soba Shehu Kasim Interviewer<br />
Kaduna Zangon Kataf Tasiu Garba Supervisor<br />
Kaduna Zangon Kataf Bulus Y. Atar Interviewer<br />
Kaduna Zangon Kataf Sarkwai Christopher Interviewer<br />
Kano Bagwai Abdulrahman Yakubu Supervisor<br />
Kano Bagwai Abdullahi Dahiru Interviewer<br />
Kano Bagwai Yahaya Yusuf Interviewer<br />
Kano Gaya Ali Aminu Supervisor<br />
Kano Gaya Ibrahim Abubakar Interviewer<br />
Kano Gaya Ibrahim M Kademi Interviewer<br />
Kano Gwale M. N. Mahmaoud Supervisor<br />
Kano Gwale Abba Usaini Interviewer<br />
Kano Gwale Hadiza Yusuf Interviewer<br />
Kano Kiru Shehu Musa Ishaq Supervisor<br />
Kano Kiru Binta Tanimu Interviewer<br />
Kano Kiru Sulaiman Datti Yako Interviewer<br />
Kano Kura Auwal Bello Supervisor<br />
Kano Kura Harira Ibrahim Interviewer<br />
Kano Kura Jaafar Lawan Interviewer<br />
Kano Madobi Mohd Sani Ibrahim Supervisor<br />
Kano Madobi Haladu Abdu Interviewer<br />
Kano Madobi Zainab Hassan Interviewer<br />
Kano Minjibir Aishatu Yahaya Muhammad Supervisor<br />
Kano Minjibir Magaji Ubale Ado Interviewer<br />
Kano Minjibir Sani Haruna Interviewer<br />
(continued)<br />
28 Malaria Control Booster Project
Annex 3. List of Supervisors, Interviewers, and Monitors (continued)<br />
State LGA Name <strong>Survey</strong> Designation<br />
Kano Rimin-Gado Garba B. Bebeji Supervisor<br />
Kano Rimin-Gado Binta Ismail Interviewer<br />
Kano Rimin-Gado Ibrahim Yusuf Interviewer<br />
Kano Shanono Auwalu Ibrahim Supervisor<br />
Kano Shanono Abdullahi Abubakar Interviewer<br />
Kano Shanono Muhd A Ahmad Interviewer<br />
Kano Tsanyawa Lamido T Sanusi Supervisor<br />
Kano Tsanyawa Nasiru S. Gwarzo Interviewer<br />
Kano Tsanyawa Mrs Magajiya Mohd Interviewer<br />
Rivers Ahoada East Macaulay Precious Supervisor<br />
Rivers Ahoada East Killie Destiny Interviewer<br />
Rivers Ahoada East Okechukwu E. Igbudu Interviewer<br />
Rivers Ahoada West Onita E. Onisoya Supervisor<br />
Rivers Ahoada West Onoleka Luis Interviewer<br />
Rivers Ahoada West Samuel Agamini Interviewer<br />
Rivers Akuku Toru Markba Georgewill Supervisor<br />
Rivers Akuku Toru Limejuice Bobmanuel Interviewer<br />
Rivers Akuku Toru Menia Sokari Interviewer<br />
Rivers Andoni Kingston P. Urum Supervisor<br />
Rivers Andoni Lieze Gibson Interviewer<br />
Rivers Andoni Okuba Ekeneokot Interviewer<br />
Rivers Bonny Sotonye Ate Supervisor<br />
Rivers Bonny Augusta Jumbo Interviewer<br />
Rivers Bonny Ibifuro Benstone Interviewer<br />
Rivers Etche Titus Nweke Supervisor<br />
Rivers Etche Njoku Goodness Interviewer<br />
Rivers Etche K. Amakolonwa Interviewer<br />
Rivers Obio/Akpor Florence N. Woko Supervisor<br />
Rivers Obio/Akpor Dorathy Amadi Interviewer<br />
Rivers Obio/Akpor Okocha Pauline Interviewer<br />
Rivers Omumma Amadi Chikwe Supervisor<br />
Rivers Omumma Otuka John Interviewer<br />
Rivers Omumma Okere A. Uloma Interviewer<br />
Rivers Oyigbo Janet Okere Supervisor<br />
Rivers Oyigbo Victor Enyinnah Interviewer<br />
Rivers Oyigbo Nwogu O. John Interviewer<br />
Rivers Tai Nbulee Asabue Supervisor<br />
(continued)<br />
<strong>2010</strong> Malaria <strong>Household</strong> <strong>Survey</strong> in Nine States of <strong>Nigeria</strong> 29
Annex 3. List of Supervisors, Interviewers, and Monitors (continued)<br />
State LGA Name <strong>Survey</strong> Designation<br />
Rivers Tai Ebenezer N. Interviewer<br />
Rivers Tai Sunday W. Nkoo Interviewer<br />
National NMCP Oyeleke Timothy Oluwa Femi Monitor<br />
National NMCP <strong>Bank</strong>ole Afolabi Owolabi Monitor<br />
National NMCP Samual Olusegun Aragbaiye Monitor<br />
National NMCP Nyeomasila Chizi Kingsley Monitor<br />
National NMCP Adeniyi Julius Funminiyi Monitor<br />
National NMCP Lomowu Kayode Isaac Monitor<br />
National NMCP Ogunniyi Babatunde Folus Monitor<br />
30 Malaria Control Booster Project
ANNEX 4. SAMPLED LOCAL GOVERNMENT AREAS<br />
State LGA State LGA<br />
Akwa Ibom Ibeno Delta Aniocha North<br />
Akwa Ibom Ikono Delta Burutu<br />
Akwa Ibom Ini Delta Ethiope West<br />
Akwa Ibom Itu Delta Isoko North<br />
Akwa Ibom Nsit Eket Delta Ndokwa East<br />
Akwa Ibom Nsit-Ubium Delta Ndokwa West<br />
Akwa Ibom Okobo Delta Sapele<br />
Akwa Ibom Onna Delta Ughelli North<br />
Akwa Ibom Oruk-Anam Delta Uvwie<br />
Akwa Ibom Ukanafun Delta Warri South<br />
Kano Bagwai Rivers Ahoada East<br />
Kano Gaya Rivers Ahoada West<br />
Kano Gwale Rivers Akuku Toru<br />
Kano Kiru Rivers Andoni<br />
Kano Kura Rivers Bonny<br />
Kano Madobi Rivers Etche<br />
Kano Minjibir Rivers Obio/Akpor<br />
Kano Rimin-Gado Rivers Omumma<br />
Kano Shanono Rivers Oyigbo<br />
Kano Tsanyawa Rivers Tai<br />
Bauchi Alkaleri Anambra Anaocha<br />
Bauchi Damban Anambra Awka North<br />
Bauchi Darazo Anambra Awka South<br />
Bauchi Gamawa Anambra Dunukofia<br />
Bauchi Jama’are Anambra Idemili North<br />
Bauchi Katagum Anambra Idemili South<br />
Bauchi Kirfi Anambra Njikoka<br />
Bauchi Shira Anambra Nnewi North<br />
Bauchi Warji Anambra Onitsha North<br />
Jigawa Auyo Kaduna Chikun<br />
Jigawa Birnin Kudu Kaduna Giwa<br />
Jigawa Birniwa Kaduna Kachia<br />
Jigawa Buji Kaduna Kaduna South<br />
Jigawa Dutse Kaduna Kaura<br />
Jigawa Garki Kaduna Kudan<br />
Jigawa Guri Kaduna Sabon-Gari<br />
Jigawa Malam Madori Kaduna Soba<br />
Jigawa Ringim Kaduna Zangon Kataf<br />
Gombe Akko<br />
Gombe Yamaltu-Deba<br />
Gombe Balanga<br />
Gombe Billiri<br />
Gombe Funna-Kaye<br />
Gombe Kaltungo<br />
Gombe Kwami<br />
Gombe Nafada<br />
<strong>2010</strong> Malaria <strong>Household</strong> <strong>Survey</strong> in Nine States of <strong>Nigeria</strong> 31
<strong>2010</strong> Malaria <strong>Household</strong> <strong>Survey</strong> in Nine States of <strong>Nigeria</strong><br />
FMOH<br />
THE WORLD BANK<br />
Public Health Services and Solutions (PHSS)<br />
19 Osun Cresecent, Maitama, Abuja, <strong>Nigeria</strong><br />
Tel. 234-07067275270, 09-8733015<br />
E-mail:contact@thephss.org<br />
www.thephss.org


