Workshop: Biosystematics
Workshop: Biosystematics
Workshop: Biosystematics

Create successful ePaper yourself
Turn your PDF publications into a flip-book with our unique Google optimized e-Paper software.
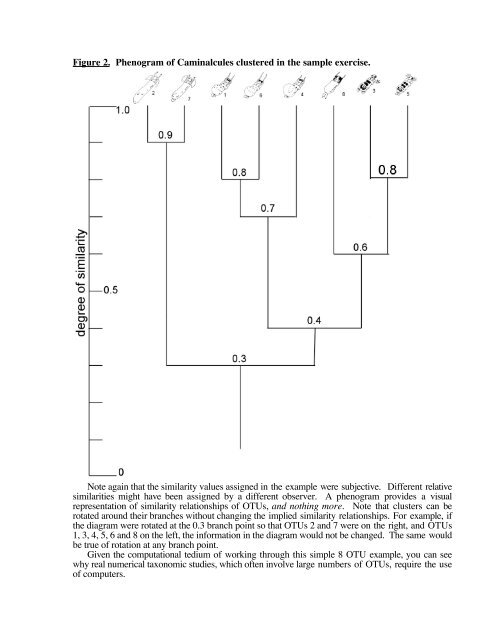
Figure 2. Phenogram of Caminalcules clustered in the sample exercise.<br />
Note again that the similarity values assigned in the example were subjective. Different relative<br />
similarities might have been assigned by a different observer. A phenogram provides a visual<br />
representation of similarity relationships of OTUs, and nothing more. Note that clusters can be<br />
rotated around their branches without changing the implied similarity relationships. For example, if<br />
the diagram were rotated at the 0.3 branch point so that OTUs 2 and 7 were on the right, and OTUs<br />
1, 3, 4, 5, 6 and 8 on the left, the information in the diagram would not be changed. The same would<br />
be true of rotation at any branch point.<br />
Given the computational tedium of working through this simple 8 OTU example, you can see<br />
why real numerical taxonomic studies, which often involve large numbers of OTUs, require the use<br />
of computers.