Investor Presentation - North American Palladium
Investor Presentation - North American Palladium
Investor Presentation - North American Palladium

Create successful ePaper yourself
Turn your PDF publications into a flip-book with our unique Google optimized e-Paper software.
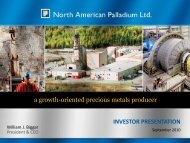
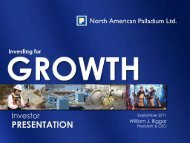
<strong>Investor</strong> <strong>Presentation</strong> June 2013
Forward Looking<br />
STATEMENTS<br />
Certain information included in this presentation constitutes ‘forward-looking statements’ within the meaning of the ‘safe<br />
harbor’ provisions of the United States Private Securities Litigation Reform Act of 1995 and Canadian securities laws. The<br />
words ‘expect’, ‘believe’, ‘will’, ‘intend’, ‘estimate’, ‘forecast’, and similar expressions identify forward-looking statements.<br />
Such statements include, without limitation, any information as to our future exploration, financial or operating<br />
performance, including: the Company's forward looking production guidance, projected capital expenditures, operating<br />
cost estimates, project timelines, mining and milling rates, the methods by which ore will be extracted, projected grades,<br />
mill recoveries, and other statements that express management's expectations or estimates of future performance.<br />
Forward-looking statements are necessarily based upon a number of factors and assumptions that, while considered<br />
reasonable by management, are inherently subject to significant business, economic and competitive uncertainties and<br />
contingencies. The factors and assumptions contained in this press release, which may prove to be incorrect, include, but<br />
are not limited to: metal prices assumptions, Canadian and U.S. dollar exchange rate assumptions, that there will be no<br />
significant disruptions affecting operations, that prices for key mining and construction supplies, including labour and<br />
transportation costs, will remain consistent with the Company's expectations, that the Company's current estimates of<br />
mineral reserves and resources are accurate, and that there are no material delays in the timing of ongoing development<br />
projects. The forward-looking statements are not guarantees of future performance. The Company cautions the reader<br />
that such forward-looking statements involve known and unknown risks that may cause the actual results to be materially<br />
different from those expressed or implied by the forward-looking statements. Such risks include, but are not limited to: the<br />
possibility that metal prices, foreign exchange rates or operating costs may differ from management's expectations,<br />
uncertainty of mineral reserves and resources, inherent risks associated with mining and processing, the risk that the Lac des<br />
Iles mine may not perform as planned and that the Offset Zone and other properties may not be successfully developed,<br />
and uncertainty of the ability of the Company to obtain financing. For more details on the factors, assumptions and risks<br />
see the Company's most recent Form 40-F/Annual Information Form on file with the U.S. Securities and Exchange<br />
Commission and Canadian provincial securities regulatory authorities. The Company disclaims any obligation to update or<br />
revise any forward-looking statements, whether as a result of new information, events or otherwise, except as expressly<br />
required by law. Readers are cautioned not to put undue reliance on these forward-looking statements.<br />
All dollar amounts are in Canadian currency unless otherwise stated, all references to production refer to payable<br />
production, and all reference to tonnes refer to metric tonnes.<br />
U.S. investors are encouraged to refer to the “Cautionary Note to U.S. <strong>Investor</strong>s Concerning Estimates of Measured,<br />
Indicated and Inferred Resources” in the appendix.<br />
1
NAP’s Investment<br />
PROPOSITION<br />
• Clear Growth Strategy to Increase Production & Lower Cash Costs<br />
LDI mine expansion offers production growth with a decreasing cash cost profile and expanding<br />
operating margins<br />
• Leverage to Rising <strong>Palladium</strong> Prices<br />
As one of only two primary palladium producers in the world, LDI is uniquely positioned to benefit<br />
from the positive supply & demand fundamentals (driven by constrained mine supply & rising<br />
global vehicle production)<br />
• Attractive PGM Investment Jurisdiction<br />
Compared to South African peers, NAP operates in a stable political landscape, with low<br />
geopolitical risk and moderate cost inflation<br />
• Significant Development & Exploration Upside<br />
Upside complimented by excess mill capacity, existing infrastructure & permits, which gives NAP<br />
potential to convert exploration success into production and cash flow on an accelerated<br />
timeline<br />
• Operational Expertise Reduces Operating Risk<br />
New senior executive team appointed in Q1, 2013 has a strong track record in mining operations<br />
2
Market Statistics<br />
COMPELLING ENTRY POINT<br />
SECURITY SYMBOLS<br />
MARKET CAPITALIZATION<br />
SHARE PRICE<br />
SHARES OUTSTANDING<br />
52-WEEK HIGH/LOW<br />
3-MONTH AVERAGE<br />
TRADING VOLUME<br />
NYSE MKT: PAL<br />
TSX: PDL<br />
TSX: PDL.DB<br />
US$201 M<br />
US$1.13<br />
178 M<br />
US$2.39/$0.96<br />
NYSE MKT: 2.1 M<br />
TSX: 0.3 M<br />
$2.50<br />
$2.00<br />
$1.50<br />
$1.00<br />
$0.50<br />
$0.00<br />
1. CIBC,<br />
Leon Esterhuizen<br />
6. Mackie Research,<br />
Matt O’Keefe<br />
11. Scotia,<br />
Leily Omoumi<br />
TOP INSTITUTIONAL SHAREHOLDERS<br />
1. Kaiser-Francis Oil (10.8%)<br />
2. Cormark,<br />
Edward Otto<br />
3. Credit Suisse,<br />
Nathan Littlewood<br />
4. Euro Pacific,<br />
Heiko Ihle<br />
7. Macquarie,<br />
Daniel Greenspan<br />
8. Octagon,<br />
Annie Zhang<br />
9. Raymond James,<br />
Alex Terentiew<br />
12. Stifel Nicolaus,<br />
George Topping<br />
2. Weiss Asset Management (9.5%)<br />
3. Franklin Advisers (3.3%)<br />
4. TFS Capital (2.8%)<br />
5. Mackenzie Financial (2.7%)<br />
6. T. Rowe Price Associates (2.5%)<br />
5. GMP,<br />
Andrew Mikitchook<br />
10. RBC,<br />
Sam Crittenden<br />
7. AllianceBernstein (1.5%)<br />
8. Earth Resource Investment (1.4%)<br />
Information as at June 10, 2013, Thomson One.<br />
9. AGF Investments (1.1%)<br />
3
Financial<br />
POSITION<br />
• C$23.5 M in cash as at Mar. 31, 2013<br />
• C$1.2 M in working capital as at Mar. 31, 2013<br />
• C$43 M convertible debentures (6.15% interest, C$2.90<br />
conversion price, mature on Sept. 30, 2017)<br />
• US$60 M operating line (fully utilized at Mar. 31, 2013,<br />
extended until July 4, 2014)<br />
• C$15 M capital leases<br />
• US$130 M senior secured term loan from Brookfield<br />
closed on June 7, 2013 (15% interest, due June 7, 2017)<br />
• C$20 M private placement in flow through shares (fully<br />
subscribed, expected to be completed by June 19 &<br />
July 23, 2013)<br />
4
Investment Case for<br />
PALLADIUM<br />
5
<strong>Palladium</strong> Market<br />
MINE SUPPLY<br />
NORTH<br />
AMERICA<br />
14%<br />
RUSSIA<br />
41%<br />
ONLY 6.5 M oz. ANNUAL PRODUCTION WORLDWIDE<br />
~80% OF GLOBAL MINE SUPPLY COMING FROM HIGH-RISK JURISDICTIONS<br />
SOUTH AFRICA<br />
38%<br />
Notes:<br />
1. Source: Johnson Matthey, May 2013 (estiamtes for 2012 supply)<br />
2. Other producing countries (~7%) include Zimbabwe, Australia, Botswana, China, Serbia and Montenegro.<br />
3. Excludes secondary recycling supply of 2.2 M oz. and ~250,000 oz. From Russian stock sales.<br />
6
<strong>Palladium</strong> Market<br />
MINE SUPPLY<br />
Constrained Mine Supply From Major Producers<br />
(000’s oz)<br />
8,000<br />
7,000<br />
6,000<br />
5,000<br />
4,000<br />
3,000<br />
2,000<br />
Other United States Canada South Africa Russia<br />
8,000<br />
7,000<br />
6,000<br />
5,000<br />
4,000<br />
3,000<br />
2,000<br />
• 2012 global supply was down 11%<br />
YoY - lowest level since 2002<br />
• Moved into a deficit of 1.07 M oz<br />
(11%) in 2012<br />
• South African production particularly<br />
challenged by:<br />
• Deeper mines<br />
• Power/water limitations<br />
• Higher operating costs<br />
• Geopolitical risks<br />
1,000<br />
0<br />
2008 2009 2010 2011 2012e 2013p 2014p 2015p<br />
Source: CPM Group, May 2013<br />
1,000<br />
Notes:<br />
1. Russian supply is entirely from Norilsk Nickel, which produces palladium as a byproduct<br />
from nickel production.<br />
2. South African supply includes the major platinum producers who produce<br />
palladium as a by-product from platinum production.<br />
0<br />
• Shortages of skilled labour<br />
• Strengthening of currencies<br />
• Strikes & other stoppages<br />
• Considering the recent supply<br />
disruption in South Africa & a<br />
contraction of underlying output in<br />
Russia, the future production<br />
forecasts are expected to be<br />
challenged<br />
7
<strong>Palladium</strong> Market<br />
DEMAND<br />
2012 Gross Demand: 9.9 M oz.<br />
Investment<br />
Chemical 4%<br />
5%<br />
Automotive<br />
Dental<br />
Other<br />
5%<br />
1% Jewellery<br />
5%<br />
67% Electronics<br />
12%<br />
• Demand diversified by geography &<br />
end market<br />
• Strongest demand growth in regions<br />
outside of <strong>North</strong> America, Europe<br />
and Japan – BRIC economies<br />
• Demand from automotive industry<br />
reached a new high of 6.62 M oz in<br />
2012, driven by:<br />
• Recovering car output in Japan<br />
after the natural disasters of<br />
2011<br />
• Further growth in China<br />
• Boom in new registrations in<br />
<strong>North</strong> America as consumer<br />
confidence and economic<br />
activity continued to improve<br />
Source: Johnson Matthey, May 2013<br />
8
<strong>Palladium</strong> Market<br />
DEMAND FROM AUTO SECTOR<br />
Global Light Vehicle Production Forecast<br />
(000’s)<br />
110,000<br />
100,000<br />
90,000<br />
80,000<br />
70,000<br />
60,000<br />
50,000<br />
40,000<br />
30,000<br />
20,000<br />
10,000<br />
0<br />
77M<br />
81M<br />
85M<br />
91M<br />
95M<br />
99M<br />
2011 2012 2013 2014 2015 2016 2017 2018<br />
Source: IHS Automotive, February 2012<br />
1. Other includes: Japan, Korea, Middle East and Africa<br />
2. BRIC Economies include: Greater China, South America and South Asia<br />
102M<br />
104M<br />
Other 1<br />
Europe<br />
<strong>North</strong><br />
America<br />
BRIC<br />
Economies 2<br />
• Global vehicle production biggest source of palladium demand<br />
• Light vehicle production is forecasted to increase to over 100 M units by 2017<br />
• Strong growth to +100 M units by 2017 driven by BRIC economies<br />
9
<strong>Palladium</strong> Market<br />
FABRICATION DEMAND<br />
Adoption of Stricter Emission Control Standards<br />
2005 2006 2007 2008 2009 2010 2011 2012 2013 2014 2015 2016<br />
Europe Euro IV Euro V Euro VI<br />
China<br />
India<br />
Beijing Euro III Euro IV Euro V<br />
Nationwide Euro II Euro III Euro IV<br />
Select Cities Euro III Euro IV<br />
Nationwide Euro II Euro III<br />
Russia Euro I Euro II Euro III Euro IV Euro V<br />
USA Tier 2 & LEV II Tier 2 & LEV III<br />
Brazil Prconve 3 Prconve 4 Prconve 5 Prconve 6<br />
Source: CPM Group, May 2013<br />
• Emerging economies have adopted emission control standards that mandate the<br />
use of catalytic converters<br />
• Advancing to a higher level of emission controls results in higher PGM loadings in<br />
the catalytic converter<br />
• Tightening emission control regulations for heavy-duty trucks<br />
10
Use of <strong>Palladium</strong> in<br />
CATALYTIC CONVERTERS<br />
Vast majority of 2020 cars still projected to be gas and diesel<br />
Gasoline Engines<br />
• Use +90% palladium (of total required<br />
PGM content)<br />
Diesel Engines<br />
• Historically used platinum due to<br />
technical requirements<br />
• Currently use 30% palladium, with scope<br />
to increase to 50% due to advent of low<br />
sulphur diesel fuel<br />
Hybrids & Other New Forms<br />
• Neutral impact on PGM use<br />
• Gasoline hybrids tend to use as much<br />
palladium as normal gasoline engines<br />
• Currently account for only 1% of global<br />
cars sales 1<br />
• Forecasted to be 14% of overall market<br />
by 2020 2<br />
Electric<br />
• No requirement for catalytic converters<br />
• Challenged by lack of infrastructure to<br />
recharge, high costs, long charging<br />
periods and short driving range<br />
• Forecasted to account for only 2% of<br />
global car sales by 2020 2<br />
1. CPM Group, June 2010<br />
2. Stefan Bratzel, director of the Centre of Automotive Management in Germany; as reported in Mitsui Global Precious<br />
Metals “Pole Position” Report, June 2010<br />
11
<strong>Palladium</strong> Market<br />
INVESTMENT DEMAND<br />
Exchange Traded Funds' Physical <strong>Palladium</strong> Holdings<br />
M oz. Pd.<br />
2.5<br />
2.0<br />
1.5<br />
1.0<br />
0.5<br />
SPPP-NYSE (Sprott)<br />
Mitsubishi<br />
SPAL-LSE Source<br />
SPDM-LSE iShares<br />
WITE-NYSE ETF Securities<br />
GLTR-NYSE ETF Securities<br />
Julius Baer<br />
PALL - NYSE ETF Securities<br />
MSL (Australia)<br />
<strong>Palladium</strong> ZKB<br />
PHPD LSE<br />
M oz. Pd.<br />
2.5<br />
2.0<br />
1.5<br />
1.0<br />
0.5<br />
0.0<br />
20-Apr-07 20-Mar-08 20-Feb-09 20-Jan-10 20-Dec-10 20-Nov-11 20-Oct-12<br />
0.0<br />
• Large increase in palladium investment demand<br />
• Investment demand driven by supply/demand fundamentals for palladium --<br />
constrained mine supply and growth in global vehicle production<br />
Source: CPM Group, as at May 13, 2013<br />
12
01/04/1993<br />
01/03/1994<br />
01/02/1995<br />
01/01/1996<br />
01/12/1996<br />
01/11/1997<br />
01/10/1998<br />
01/09/1999<br />
01/08/2000<br />
01/07/2001<br />
01/06/2002<br />
01/05/2003<br />
01/04/2004<br />
01/03/2005<br />
01/02/2006<br />
01/01/2007<br />
01/12/2007<br />
01/11/2008<br />
01/10/2009<br />
01/09/2010<br />
01/08/2011<br />
01/07/2012<br />
<strong>Palladium</strong> Market<br />
PRICE PERFORMANCE<br />
20-Year Historic Price Performance (US$/oz)<br />
Average Annual Forecasts (US$/oz)<br />
$1,200<br />
$1,000<br />
$800<br />
$600<br />
$400<br />
$200<br />
$0<br />
Firm As Of 2013 2014 2015<br />
Intesa Sanpaolo SpA 05/06/13 $750 $800 $850<br />
LBBW 05/06/13 $740<br />
Prestige Economics LLC 04/29/13 $749 $850<br />
Barclays PLC 04/26/13 $748 $795 $900<br />
Commerzbank AG 04/24/13 $735 $920<br />
Citigroup Inc 04/23/13 $810 $950 $925<br />
Toronto-Dominion 04/19/13 $788 $905<br />
Cantor Fitzgerald LP 04/18/13 $775 $880 $900<br />
Standard Chartered Bank 04/15/13 $798 $950 $800<br />
China International Capital 04/15/13 $710 $800<br />
Societe Generale SA 04/11/13 $800 $900 $1,000<br />
Credit Suisse Group AG 04/03/13 $770 $880 $950<br />
RBC Capital Markets 03/04/13 $750 $850 $850<br />
CPM Group 01/14/13 $682 $753<br />
Deutsche Bank AG 01/08/13 $713 $800 $900<br />
AVERAGE $755 $860 $897<br />
Historic High: US$1,090 (2001)<br />
2012 Average Price: US$640<br />
Recent Price: US$768 (June 10, 2013)<br />
Sources: Thomson One, Bloomberg and available equity research.<br />
13
Investment Case For<br />
NAP<br />
14
LDI Mine & Mill Complex<br />
A WORLD CLASS ASSET<br />
• Located north of Thunder Bay, Ontario, Canada<br />
• One of only two primary palladium producers in the world<br />
• Deposit is unique in the world: high palladium concentration,<br />
broadly disseminated mineralization vs. narrow vein<br />
• Established palladium producer since 1993<br />
• Currently undergoing an expansion to increase production<br />
and reduce cash costs per ounce<br />
• Goal to increase annual palladium production to +250,000 ounces at significantly reduced<br />
cash costs under US$300 per ounce<br />
• 15,000 tpd mill has excess capacity available for production growth (currently operating at<br />
35% capacity)<br />
• Significant exploration upside identified on the LDI property<br />
• Strong safety record<br />
15 15
Ongoing Review of<br />
OPERATIONS<br />
Short-term focus:<br />
• Strategic mine planning<br />
(evaluating new ore sources)<br />
• Fleet reduction<br />
• Standardizing ground control<br />
support<br />
• Waste haulage reduction with<br />
open stopes<br />
• Reduction of contracting staff<br />
Medium-term focus:<br />
• Phase II plans<br />
• Energy savings<br />
• Tailings footprint reduction<br />
• Material management & inventory<br />
reduction<br />
• Size of drifts<br />
• Development footprint reduction<br />
16 16
LDI Mine Expansion<br />
PLAN FOR GROWTH<br />
• Approx. $328.2 M spent to date on mine expansion<br />
(Q4, 2010 – Q1, 2013)<br />
• Phase I development in 2013 includes:<br />
o Sinking a shaft to the 825-metre level to transition<br />
underground operations from mining via ramp to<br />
mining via shaft<br />
o Setting up underground infrastructure to mine the<br />
Offset Zone using a high volume bulk mining<br />
method (long-hole stoping with primary &<br />
secondary stoping blocks) - this includes<br />
expanding the ramp, building new mine levels,<br />
and setting up mining stopes<br />
• Through the utilization of the shaft & bulk mining<br />
method, operations are expected to benefit from<br />
increased mining rates & decreased operating costs<br />
• Targeting production via shaft by end of Q3, 2013<br />
• Phase II plans & timing under review<br />
The underground design schematic of LDI, showing the<br />
deposit and underground ramp infrastructure, looking east.<br />
Offset Zone remains open to the west, south & at depth.<br />
17
LDI Mine Expansion<br />
RECENT UPDATE<br />
Recent development highlights:<br />
• Shaft sinking progressing on schedule:<br />
• As of June 3, shaft sinking was at an approximate<br />
depth of 755 m below surface (92% completed of the<br />
total 825 m planned for Phase I)<br />
• Production hoist is fully operational & installation of the main<br />
skip dump is in progress<br />
• First Offset Zone stope has been mined out; production<br />
commenced in second stope<br />
• Development of additional mining stopes experienced<br />
delays in Q1, but is in progress<br />
• Ramp extension reached the 825-m level depth & shaft<br />
station has been excavated<br />
• Major shaft construction items outstanding include<br />
completion of the 740 m level and 780 m level loading<br />
pocket and spillage pockets and change-over to<br />
production (rope-up production hoist, align skips and<br />
guides)<br />
• Phase II plans & timing under review; to consider a change<br />
in bulk mining method<br />
18
LDI Property<br />
EXPLORATION UPSIDE<br />
Near-mine land package<br />
62,000-acre regional land package<br />
South Norite Zone<br />
Mineralization Trend<br />
• LDI represents a rare palladium-rich asset with excellent infrastructure<br />
• LDI complex has only been drilled in detail in a 1km x 1km area & remains largely underexplored<br />
• Multiple targets identified for follow up exploration (surface & underground)<br />
• Regional land package covers the most prospective mafic complexes in the area (all PGM properties<br />
are less than 30 km from LDI mill)<br />
19
Plan:<br />
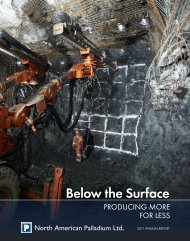
PRODUCE MORE, FOR LESS<br />
Transition to shaft mining<br />
Leverage existing infrastructure<br />
Realize exploration upside<br />
20
Compelling<br />
INVESTMENT OPPORTUNITY<br />
LEVERAGE TO RISING PALLADIUM PRICES<br />
CLEAR STRATEGY TO INCREASE<br />
PRODUCTION & LOWER CASH COSTS<br />
ATTRACTIVE PGM INVESTMENT<br />
JURSIDICTION<br />
UPSIDE IN EXPLORATION & DEVELOPMENT<br />
21
Shareholder<br />
INFORMATION<br />
<strong>North</strong> <strong>American</strong> <strong>Palladium</strong>’s vision is to become a low cost, mid-tier precious metals company operating in<br />
mining friendly jurisdictions. NAP is an established precious metals producer that has been operating its flagship<br />
Lac des Iles mine (LDI) located in Ontario, Canada since 1993. LDI is one of only two primary producers of<br />
palladium in the world, and is currently undergoing a major expansion to increase production and reduce cash<br />
costs per ounce. NAP’s experienced management and technical teams have a significant commitment to<br />
exploration and are dedicated to building shareholder value.<br />
Corporate Office:<br />
Royal Bank Plaza, South Tower<br />
200 Bay St., Suite 2350<br />
Toronto, ON M5J 2J2<br />
Security Symbols:<br />
NYSE MKT– PAL<br />
TSX – PDL, PDL.DB<br />
Website:<br />
www.nap.com<br />
<strong>Investor</strong> Relations:<br />
Camilla Bartosiewicz<br />
Director, <strong>Investor</strong> Relations & Corporate Communications<br />
camilla@nap.com<br />
416-360-7374<br />
22
Appendices &<br />
FURTHER INFORMATION<br />
23
Senior<br />
MANAGEMENT<br />
Phil du Toit – President & CEO<br />
Mr. du Toit is an accomplished mining executive with a proven track record for executing on his management mandates throughout his career.<br />
Mr. du Toit brings significant project management expertise to the CEO role, developed during his 37 years of global experience in the mining<br />
industry which included senior roles for some of the world's leading mining companies, and the successful development of multiple large<br />
capital projects. Recently, Mr. du Toit served as Executive Vice President and Head of Mining Projects and Exploration for ArcelorMittal, the<br />
world's leading integrated steel and mining company, where he was responsible for mining strategy, exploration, project and business<br />
development. His experience also includes serving as interim CEO of Baffinland Iron Mines Corp., as well as having held various senior<br />
management positions for Vale, Diavik Diamond Mines (a subsidiary of Rio Tinto plc), Voest Alpine Inc., and Gencor Ltd. He holds a Bachelor of<br />
Science degree in Civil Engineering from the University of Pretoria in South Africa.<br />
Dave Langille – CFO<br />
Mr. Langille is a seasoned finance executive with over 26 years of international public company experience. He brings a wealth of international<br />
financial expertise to NAP, notably a solid track record of optimizing operations to improve operating margins, along with merger and<br />
acquisition experience, and raising capital through a broad range of capital market products. Most recently, Mr. Langille served as the CFO<br />
and Vice President, Finance of Breakwater Resources Ltd. Prior to this, he served in senior financial positions for various public companies,<br />
including Lindsey Morden Group Inc., Capital Environmental Resource Inc., Cott Corporation, and TVX Gold Inc. Mr. Langille received an<br />
Honours Bachelor of Business Administration from Wilfrid Laurier University in Waterloo, Ontario, Canada in 1985, and has been a member of the<br />
Institute of Chartered Accounts of Ontario and the Society of Management Accountants of Ontario since 1987.<br />
David Peck – Head of Exploration<br />
Dr. Peck is a Professional Geoscientist with nearly 30 years of exploration and research experience specializing in magmatic Ni-Cu-PGE ore<br />
deposits. Dr. Peck holds global recognition as an expert in PGE exploration after serving as a senior technical and strategic consultant to<br />
several public and private companies and having worked on exploration and mining projects in more than a dozen countries. He was directly<br />
involved in several significant magmatic Ni-Cu-PGE discoveries in Canada and overseas. Prior to joining NAP, Dr. Peck served as President and<br />
Senior Technical and Strategic Consultant at Revelation Geoscience Ltd., and prior to this, he served as Global Nickel Commodity Leader at<br />
Anglo <strong>American</strong> plc, a Senior Geologist for Falconbridge Ltd., a Senior Mineral Deposits Geologist with the Manitoba Geological Survey, held<br />
various academic roles in Canadian universities, and was the technical lead on a multi-year mineral potential study funded by the Ontario<br />
Geological Survey. He has authored numerous public presentations and government and academic publications addressing his area of<br />
specialization.<br />
24
Board of<br />
DIRECTORS<br />
Robert J. Quinn – Chairman (Director since 2006)<br />
Mr. Quinn was first appointed to the Board of Directors of the Company in June 2006. A founding partner of the Houston mining<br />
transactional law firm Quinn & Brooks LLP, Mr. Quinn has over 30 years of legal and management experience, including as Vice President<br />
and General Counsel for Battle Mountain Gold Company. He has extensive experience in M&A transactions, corporate governance, public<br />
disclosure, governmental affairs, environmental law and land management. Mr. Quinn has a Bachelor of Science in Business Administration<br />
from the University of Denver, a Juris Doctorate degree from the University of Denver College of Law and has completed two years of<br />
graduate work in mineral economics at the Colorado School of Mines.<br />
Steven R. Berlin – Retired Financial Executive (Director since 2001)<br />
Mr. Berlin was appointed to the Board of Directors of the Company in February 2001, and is also a director of Orchids Paper Products, an<br />
AMEX listed company. At the end of 2005, Mr. Berlin retired from his position as Vice-President of Kaiser Francis Oil Company (KFOC) where<br />
he worked part-time for two years following four years full-time as Vice-President and Chief Financial Officer. Prior to joining KFOC, Mr. Berlin<br />
taught at the University of Tulsa for three years where he also served a year as acting associate Dean of the College of Business and acting<br />
Director of the School of Accounting. Before joining the University of Tulsa, Mr. Berlin spent 25 years with Citgo Petroleum Corporation, where<br />
he retired as Senior VP Finance and Administration and Chief Financial Officer. Mr. Berlin has a bachelor’s degree from Duquesne University,<br />
an MBA from the University of Wisconsin Madison and has completed the Executive Management program at Stanford University.<br />
C. David A. Comba – Retired Mining Executive (Director since 2006)<br />
Mr. Comba was first appointed to the Board of Directors of the Company in March 2006. He has over four decades of experience as an<br />
exploration advocate and senior mining executive. As Chief Exploration Geologist of Falconbridge Limited in Sudbury, Ontario, he led the<br />
team that discovered the high-grade footwall deposit that allowed the Thayer Lindsley mine to go into production. Prior to its takeover by<br />
Kinross Gold Corporation, Mr. Comba was Vice-President, Exploration of Falconbridge Gold Corporation. Following the takeover, he<br />
became President and Chief Executive Officer of Pentland Firth Venture Ltd., a Kinross-controlled junior gold exploration company listed on<br />
the TSX. Pentland’s work added the first couple of million ounce resource to the Hammond Reef property Atikokan, ON. Mr. Comba was<br />
Director of Issues Management with the Prospectors and Developers Association of Canada from 1998 to 2005, during which time he led<br />
the successful lobby effort for the re-introduction of enhanced or “super” flow-through shares. Mr. Comba has Bachelor’s and Master’s<br />
degrees in geology from Queen’s University in Kingston, Ontario.<br />
25
Board of<br />
DIRECTORS (CON’T)<br />
Andre Douchane – President and Chief Executive Officer, Mahdia Gold Corp. (Director since 2003)<br />
Mr. Douchane is a seasoned mining executive with over 40 years of experience in the mining industry with a solid track record of<br />
successfully bringing development projects into production. He was appointed to the Company’s Board of Directors in April 2003, and<br />
served as the President and CEO until January 2006. He has held senior positions with several precious and base metal international mining<br />
companies including CEO of THEMAC Resources, President and CEO of Starfield Resources Inc., President and COO of Chief Consolidated<br />
Mining Co., and Vice President, Operations of Franco and Euro-Nevada (Newmont Mining Corporation). He holds a Bachelor’s degree in<br />
Mining Engineering from the New Mexico Institute of Mining and Technology and is a graduate of the Executive Business Program at the<br />
Kellogg School of Business in Toronto.<br />
Greg J. Van Staveren – Strategic Financial Consultant (Director since 2003)<br />
Mr. Van Staveren was appointed to the Board of Directors of the Company in February 2003. Since September 2001, Mr. Van Staveren has<br />
been the President of Strategic Financial Services, a private company providing business advisory services. During this period he has sat on<br />
the board of a number of publicly traded companies. Mr. Van Staveren is a Chartered Accountant and a Certified Public Accountant<br />
and holds a Bachelor of Math (Honours) degree from the University of Waterloo. From February 1998 until September 2001, Mr. Van<br />
Staveren was the Chief Financial Officer of MartinRea International Inc (MRE-TSX), and prior to that he was a partner in the mining group of<br />
KPMG, which he joined in 1980, and where he provided accounting, and advisory services to his clients.<br />
William J. Weymark – President, Weymark Engineering Ltd. (Director since 2007)<br />
Appointed to the Board of Directors of the Company in January 2007, Mr. Weymark is President of Weymark Engineering Ltd., a Company<br />
providing consulting services to businesses in the private equity, construction and resource sector. He is also a director of the VGH & UBC<br />
Hospital Foundation Board, and several private companies. Mr. Weymark is also a Member of the Industry Advisory Committee for the<br />
Norman B. Keevil Institute of Mining Engineering at the University of British Columbia. Until June 2007, Mr. Weymark was President and CEO of<br />
Vancouver Wharves/BCR Marine, a transportation firm located on the west coast of British Columbia. Prior to joining Vancouver Wharves in<br />
1991, Mr. Weymark spent 14 years in the mining industry throughout western Canada working on the start-up and operation of several<br />
mines. Mr. Weymark is a Professional Engineer and holds a Bachelor of Applied Science in Mining and Mineral Process Engineering from the<br />
University of British Columbia and is a graduate of the Institute of Corporate Directors’, Directors Education Program.<br />
26
Cautionary Note to U.S. <strong>Investor</strong>s Concerning<br />
MINERAL RESERVES AND MINERAL RESOURCE<br />
• Mineral reserves and mineral resources have been calculated in accordance with National Instrument<br />
43-101 as required by Canadian securities regulatory authorities. For United States reporting purposes,<br />
Industry Guide 7, (under the Securities and Exchange Act of 1934), as interpreted by Staff of the Securities<br />
Exchange Commission (SEC), applies different standards in order to classify mineralization as a reserve. In<br />
addition, while the terms “measured”, “indicated” and “inferred” mineral resources are required pursuant<br />
to National Instrument 43-101, the U.S. Securities and Exchange Commission does not recognize such<br />
terms. Canadian standards differ significantly from the requirements of the SEC, and mineral resource<br />
information contained herein is not comparable to similar information regarding mineral reserves<br />
disclosed in accordance with the requirements of the U.S. Securities and Exchange Commission. U.S.<br />
investors should understand that “inferred” mineral resources have a great amount of uncertainty as to<br />
their existence and great uncertainty as to their economic and legal feasibility. In addition, U.S. investors<br />
are cautioned not to assume that any part or all of NAP's mineral resources constitute or will be<br />
converted into reserves. For a more detailed description of the key assumptions, parameters and<br />
methods used in calculating NAP’s mineral reserves and mineral resources, see NAP’s most recent Annual<br />
Information Form/Form 40-F on file with Canadian provincial securities regulatory authorities and the SEC.<br />
• Please refer to <strong>North</strong> <strong>American</strong> <strong>Palladium</strong>’s most current Annual Information Form and applicable<br />
technical reports available on www.sedar.com, www.sec.gov and www.nap.com for further information.<br />
27
LDI <strong>Palladium</strong> Mine<br />
RESERVES & RESOURCES<br />
March 31, 2012<br />
LDI MINERAL RESERVES<br />
Cut-off Tonnes Pd Pt Au Ni Cu Pd<br />
CATEGORY (g/t) (000'S) (g/t) (g/t) (g/t) (%) (%) (000's oz)<br />
PROVEN<br />
Offset Zone 2.5 5,632 4.34 0.30 0.30 0.11 0.08 787<br />
Roby Underground 5.8 420 6.38 0.42 0.34 0.08 0.07 86<br />
Open Pit 1.8 722 1.99 0.21 0.22 0.11 0.10 46<br />
PROBABLE<br />
Offset Zone 2.5 2,109 4.17 0.30 0.29 0.10 0.08 283<br />
TOTAL RESERVE - 8,883 4.21 0.30 0.29 0.11 0.08 1,202<br />
LDI MINERAL RESOURCES<br />
Cut-off Tonnes Pd Pt Au Ni Cu Pd<br />
CATEGORY (g/t) (000'S) (g/t) (g/t) (g/t) (%) (%) (000's oz)<br />
MEASURED<br />
Offset Zone 2.5 4,943 4.56 0.33 0.31 0.12 0.10 724<br />
Open Pit 1.8 1,971 2.00 0.24 0.15 0.05 0.07 127<br />
Stockpile 83 1.63 0.17 0.14 0.08 0.06 4<br />
TOTAL MEASURED - 6,997 3.80 0.31 0.27 0.12 0.10 855<br />
INDICATED<br />
Offset Zone 2.5 9,557 4.11 0.31 0.29 0.11 0.09 1,262<br />
Roby Underground 5.8 1,269 7.16 0.41 0.33 0.08 0.06 292<br />
Open Pit 1.8 2,565 2.20 0.24 0.18 0.07 0.08 181<br />
Low Grade Stockpile 0.5 13,188 0.97 0.12 0.08 0.06 0.03 411<br />
TOTAL INDICATED - 26,579 2.51 0.21 0.18 0.08 0.06 2,147<br />
TOTAL MEASURED & INDICATED - 33,575 2.78 0.23 0.20 0.08 0.05 3,002<br />
INFERRED<br />
Offset Zone 2.5 13,669 3.59 0.30 0.23 0.09 0.08 1,576<br />
TOTAL INFERRED 13,669 3.59 0.30 0.23 0.09 0.08 1,576<br />
See accompanying Notes on the next page.<br />
28
Notes:<br />
LDI Reserves & Resources<br />
NOTES<br />
1. Prepared in accordance with NI 43-101 Standards of Disclosure for Mineral Projects and the CIM classification system.<br />
2. Mineral resources which are not mineral reserves do not have demonstrated economic viability. The estimate of mineral resources may<br />
be materially affected by environmental, permitting, legal, title, taxation, socio-political, marketing, or other relevant issues. Mineral<br />
resources are exclusive of the mineral reserves.<br />
3. The mineral resource for the Offset Zone was estimated as of June 30, 2012 by Todd McCracken, P.Geo, of Tetra Tech, an independent<br />
QP under NI 43-101. The effective date of the resource is March 31, 2012. The mineral resource calculation uses a minimum 2.5 g/t<br />
palladium resource block cut-off. The mineral resource estimate is based on the combination of geological modeling, geostatistics, and<br />
conventional block modelling (5 m by 5 m by 5 m blocks). Assay grade capping was determined not to be necessary. The Offset Zone<br />
resource models used the ordinary kriging (OK) grade interpolation method within a 3Dl block model with mineralized zones defined by<br />
wireframed solids. The quality assurance (QA)/quality control (QC) protocols and corresponding sample preparation and shipment<br />
procedures for the Offset Zone have been reviewed by Tetra Tech. The following metal price assumptions were used: US$675/oz<br />
palladium, US$1,675/oz platinum, US$1,750/oz gold, US$8.00/lb nickel, and US$3.50/lb copper. A US$/CDN$ exchange rate of US$1.00 =<br />
CDN$1.00 was also applied.<br />
4. Mineral reserves for the Offset Zone were estimated by Todd McCracken, P. Geo.; William Richard McBride, P.Eng.; Todd Kanhai, P.Eng.;<br />
and Philip Bridson, P.Eng. of Tetra Tech, independent QPs within the meaning of NI 43-101. The mineral reserves were estimated from<br />
drilling completed to March 31, 2012. Reserves were estimated to the 990 Mine Level (4,490 m elevation), a maximum depth of 1,017.5<br />
m. The following metal price assumptions were used for reserves estimation: US$675/oz palladium, US$1,675/oz platinum, US$1,750/oz<br />
gold, US$8.00/lb nickel, and US$3.50/lb copper. A US$/CDN$ exchange rate of US$1.00 = CDN$1.00 was also applied. An average<br />
production rate of 3,500 t/d was used to determine the reserves. The following recoveries were used in the assumptions to determine the<br />
reserves: 80.45% palladium, 71.30% platinum, 83.97% gold, 43.13% nickel, and 88.55% copper.<br />
5. The mineral resource estimate for the Roby Zone open pit and stockpiles were estimated as of June 30, 2010 by Scott Wilson RPA and<br />
updated by David N. Penna, P.Geo., an employee of Lac des Iles Mining Ltd. (LDIM) and a qualified person (QP) under NI 43-101 to<br />
reflect: (i) additions to mineral reserves in the Roby Zone as a result of a lower cut-off palladium grade; (ii) depletion from production up<br />
to March 31, 2012, and (iii) mineral reserves from the crown pillar (supported by an internal engineering report). The following cut-off<br />
grades were used: (i) 1.8 g/t palladium equivalent (PdEq) for the Roby open pit, within an optimized pit shell run below the current pit<br />
survey; (ii) 1.9 g/t PdEq for the mine stockpiles; and (iii) 5.8 g/t PdEq for the underground Roby Zone. These cut-off grades were<br />
determined under the assumption that production would take place at a rate of 14,000 t/d. Metal price assumptions of US$350/oz<br />
palladium, US$1,400/oz platinum, US$850/oz gold, US$6.50/lb nickel, and US$2.00/lb copper were used in the estimation of cut-off grade.<br />
A US$/CDN$ exchange rate of 1.11 was also applied.<br />
6. Numbers may not add due to rounding.<br />
29
Mining Method Under Review:<br />
SUB-LEVEL BLOCK CAVE<br />
30 30
<strong>Palladium</strong> Market<br />
MARKET DYNAMICS<br />
• The palladium market is expected to remain in a position of undersupply over<br />
the 2012 to 2015 period – will allow prices to remain robust<br />
(In koz, unless otherwise noted)<br />
World <strong>Palladium</strong> Supply and Demand Forecast<br />
2009 2010 2011 2012E 2013E 2014E 2015E<br />
Supply<br />
Mine Production 6,320 6,613 6,966 6,825 6,925 7,125 7,225<br />
Scrap 1,184 1,454 1,620 1,770 1,980 2,130 2,250<br />
Total <strong>Palladium</strong> Supply 7,504 8,067 8,586 8,595 8,905 9,255 9,475<br />
Change (YoY %) (3.2%) 7.5% 6.4% 0.1% 3.6% 3.9% 2.4%<br />
Total <strong>Palladium</strong> Consumption 7,591 8,642 8,740 8,920 9,475 9,790 10,000<br />
Change (YoY %) (9.5%) 13.9% 1.1% 2.1% 6.2% 3.3% 2.1%<br />
Implied Market Balance (87) (575) (154) (325) (570) (535) (525)<br />
Stock Releases 1,100 800 800 150 150 -- --<br />
ETF Investment 507 1,038 (514) -- -- -- --<br />
Implied Residual Balance 507 (813) 1,160 (175) (420) (535) (525)<br />
Source: Thomson Reuters GFMS, LPPM, RBS (Commodity Companion - Truly Precious, May 4th 2012)<br />
31