Annual Report (PDF 2.13 MB) - North American Palladium
Annual Report (PDF 2.13 MB) - North American Palladium
Annual Report (PDF 2.13 MB) - North American Palladium

You also want an ePaper? Increase the reach of your titles
YUMPU automatically turns print PDFs into web optimized ePapers that Google loves.
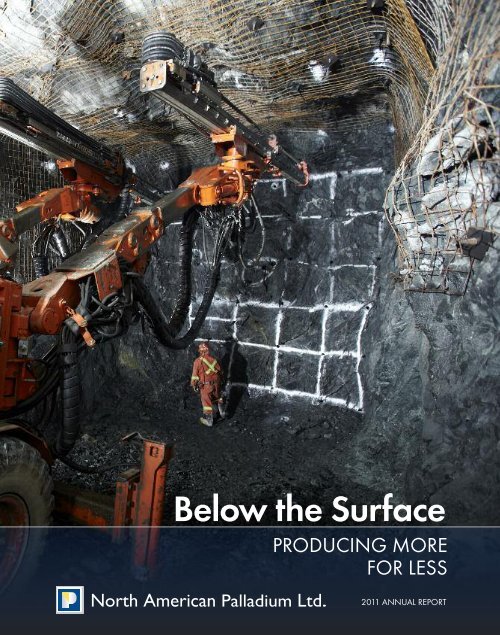
Below the Surface<br />
PRODUCING MORE<br />
FOR LESS<br />
2011 ANNUAL REPORT
Company Profile<br />
NORTH AMERICAN PALLADIUM (NAP) is an established precious<br />
metals producer that has been operating its flagship Lac des Iles<br />
mine (LDI) located in Ontario, Canada since 1993. LDI is one of<br />
only two primary producers of palladium in the world, and is<br />
currently undergoing a major expansion to increase production<br />
and reduce cash costs per ounce. NAP also operates the Vezza<br />
gold mine located in the Abitibi region of Quebec. The Company<br />
operates with the vision of becoming a low cost mid-tier precious<br />
metals producer (+250,000 ounces annual production).<br />
TABLE OF CONTENTS<br />
1 Investment Highlights<br />
2 Letter to Shareholders<br />
4 Lac des Iles <strong>Palladium</strong> Mine<br />
6 <strong>Palladium</strong> Market Overview<br />
7 Vezza Gold Mine<br />
8 Corporate Social Responsibility<br />
9 Management’s Discussion and Analysis<br />
34 Management’s Responsibility for Financial Statements<br />
35 Independent Auditors’ <strong>Report</strong><br />
36 Consolidated Balance Sheets<br />
37 Consolidated Statements of Operations and Comprehensive Loss<br />
38 Consolidated Statements of Cash Flows<br />
39 Consolidated Statements of Shareholders’ Equity<br />
40 Notes to the Consolidated Financial Statements<br />
72 Corporate Information<br />
73 Senior Management and Directors
Investment Highlights<br />
Why Invest<br />
ATTRACTIVE PGM<br />
INVESTMENT JURISDICTION<br />
Compared to our South African<br />
peers who are increasingly faced<br />
with geopolitical and hyperinflationary<br />
cost challenges, we operate in a<br />
mining friendly jurisdiction with<br />
low political risk, stable government<br />
policies, moderate cost inflation and<br />
available skilled labour.<br />
UPSIDE IN EXPLORATION &<br />
DEVELOPMENT<br />
Future growth will come from our<br />
significant exploration upside and<br />
through the continued<br />
development at LDI. With<br />
permits, mine infrastructure and<br />
excess capacity at our mill, we can<br />
convert exploration success into<br />
production and cash flow on an<br />
accelerated timeline.<br />
LEVERAGE TO RISING<br />
PALLADIUM PRICES<br />
As one of only two primary<br />
palladium producers in the world,<br />
our plans to significantly increase<br />
our palladium production while<br />
lowering our cash costs per ounce<br />
are well timed with the rising price<br />
of palladium, which continues to<br />
benefit from solid supply and<br />
demand fundamentals.<br />
CLEAR STRATEGY TO INCREASE<br />
PRODUCTION & LOWER CASH<br />
COSTS PER OUNCE<br />
Through the significant exploration<br />
upside identified, and through the<br />
major expansion of LDI that is<br />
currently in progress, starting in<br />
2013 we plan to significantly<br />
increase our palladium production<br />
while lowering our cash costs<br />
per ounce, transforming LDI into<br />
a long life, low cost producer<br />
of palladium.<br />
FINANCIAL STRENGTH<br />
SUPPORTS GROWTH<br />
INVESTMENTS<br />
Our conservative debt levels and<br />
ability to finance working capital<br />
supports our funding flexibility as<br />
we continue to make significant<br />
investments to position NAP for<br />
future growth.<br />
OPERATIONAL EXPERTISE<br />
REDUCES OPERATING RISK<br />
At the end of the day, it is people<br />
that build businesses. The proven<br />
track record of success of our<br />
senior management and operating<br />
team enhances NAP’s investment<br />
proposition and reduces<br />
operating risk.<br />
1<br />
2011 <strong>Annual</strong> <strong>Report</strong>
Letter to Shareholders<br />
William J. Biggar<br />
PRESIDENT AND CEO<br />
Below the Surface . . .<br />
Producing More for Less<br />
March 2012<br />
FELLOW SHAREHOLDERS<br />
In the past few years we embarked on a number of growth-oriented<br />
initiatives to advance our strategy of increasing production while<br />
lowering our cash costs per ounce. From starting the LDI mine<br />
expansion in 2010, to building the Vezza mine – we began to lay the<br />
groundwork to achieve our vision of becoming a mid-tier precious<br />
metals producer, which is generally viewed as annual production of<br />
250,000 ounces or more. While our growth plans may have changed<br />
somewhat by relying less on the production contribution of our gold<br />
business and prioritizing our world class palladium assets – our<br />
vision has not.<br />
Reflecting on the past year, we had an extremely active and<br />
productive year, characterized by significant investments of $186<br />
million in development, and $17 million in exploration. These<br />
investments have laid the groundwork for increased production<br />
starting in 2013, when we expect to reach mid-tier producer status.<br />
At LDI, which is one of only two primary palladium producers in the<br />
world and a one-of-a-kind PGE deposit, our plan is straightforward<br />
– to produce more for less. We accomplished a significant amount of<br />
development work in 2011 to advance the mine expansion and the<br />
progress is clear to see – on surface with the new headframe<br />
infrastructure, and underground with the development at depth. With<br />
an optimized development plan for our mine expansion, we are<br />
optimistic about our future prospects as the improved plan seeks to<br />
maximize the mine’s long-term production and future operating cash<br />
flow potential.<br />
The most critical aspect of the expansion, and our key priority for<br />
2012, is the successful installation of the shaft, which is on track for<br />
completion at the end of 2012. Through the utilization of the shaft<br />
and a high volume bulk mining method, starting in 2013 LDI will<br />
gradually increase its underground mining rate while benefitting from<br />
reduced operating costs, with a target to produce over 250,000<br />
ounces of palladium at a cash cost of approximately US$200 per<br />
ounce starting in 2015. That is our goal for LDI, and I am highly<br />
confident that we will accomplish it.<br />
And I firmly believe that we have only scratched the surface with our<br />
exploration efforts at LDI. The positive results from our significant<br />
85,000-metre drill campaign conducted in 2011 underpins the<br />
significant exploration potential of our substantial land package, and<br />
supports my belief that mining will continue at LDI for many years to<br />
come. The exploration upside is further complemented by excess<br />
capacity in the 15,000-tonne per day mill, and excess capacity in the<br />
7,000-tonne per day shaft. Hence our new mantra at LDI – let’s fill<br />
the shaft and let’s fill the mill through exploration success.<br />
One of my biggest disappointments this past year has been the lack<br />
of profitability at Sleeping Giant, which resulted in the difficult but<br />
necessary decision to close the mine. Our vision for Sleeping Giant<br />
was initially conceived as a high-grade mine that would expand its<br />
production at depth. The high-grade intercepts from our drill<br />
campaigns reaffirmed our strategy and supported the investment<br />
to expand at depth. But in the end the geology told another story<br />
as we encountered a lack of grade continuity in the narrow vein<br />
structures, such that we were unable to devise an economic<br />
mine plan.<br />
2<br />
2011 <strong>Annual</strong> <strong>Report</strong>
2011<br />
A c c o m p l i s h m e n t s<br />
• Produced 146,624 ounces of palladium for a total operating margin of US$41.8 million<br />
• Modified corporate growth strategy to prioritize NAP’s flagship palladium operations resulting in a<br />
restructuring of the gold division<br />
• Through an investment of $143 million, significantly advanced the LDI mine expansion, achieving a number of<br />
development milestones<br />
• Completed over 85,000 metres of drilling at LDI that yielded excellent results and increased mine life<br />
• Increased the size of LDI’s Offset Zone encountering some of the best grades and widths ever reported<br />
• Increased LDI’s Offset Zone measured and indicated resources by 41% to 2.5 million oz Pd<br />
• Increased Vezza’s measured and indicated resources by 12% to 321,000 oz Au<br />
• Developed Vezza to a production stage<br />
• Completed $22-million flow-through equity financing for exploration expenditures<br />
• Completed $72-million term debt financing amid turbulent market conditions<br />
• Strengthened technical expertise with new hires<br />
• Added to the prestigious S&P/TSX Composite Index<br />
If we take a step back and reflect on why we initially diversified into<br />
gold, it was principally a business decision to mitigate our operating<br />
risk by reducing our reliance on a single mine and metal during a<br />
recessionary market environment that had caused palladium prices to<br />
decline precipitously. Also recall that at that time, LDI had a relatively<br />
short mine life left on paper, because historically there had been<br />
minimal exploration. Now fast forward three years later to today, after<br />
having made significant investments in exploration, we have a<br />
renewed vision of LDI’s future growth prospects, and hence a lesser<br />
need to rely on the contribution of our gold business for growth.<br />
With the closure of Sleeping Giant this year, our plans for the<br />
development of our gold assets have changed, as has our vision for<br />
how we perceive our future in the gold business. In 2012 and for the<br />
foreseeable future, our focus for our gold business will be on steady<br />
cash generation at Vezza. With stable gold production during a<br />
favourable gold price environment, a secured workforce, and good<br />
prospects for reserve growth through exploration, Vezza is well<br />
positioned to be a good contributor of cash flow for many years to<br />
support growth in our palladium operations.<br />
During a year of significant volatility in capital markets, the European<br />
debt crisis that unfolded escalated concerns over a global economic<br />
slowdown, adversely affecting the palladium price, and given our<br />
leverage to the metal, our share price. As fellow shareholders,<br />
management is not pleased with the share price performance last<br />
year, but I believe that through the investments we have made in<br />
the LDI mine expansion, the foundation is now in place to secure<br />
our future growth, and create value for our shareholders. We are very<br />
optimistic about palladium’s future price performance, which<br />
continues to benefit from favourable supply and demand<br />
fundamentals. This outlook fits well as we progress towards realizing<br />
our goal of transitioning LDI into a long life, low cost producer<br />
of palladium.<br />
I have personally been looking forward to 2012 – the final year of<br />
transition before we can start mining from the new shaft in 2013.<br />
Through the significant development milestones achieved in 2011,<br />
and through the mine expansion investments that we plan to make<br />
in 2012, by the end of this year NAP will have established a solid<br />
foundation for steady production growth for many years to come.<br />
We certainly have a lot of work ahead of us, but we also have a<br />
clearly defined strategy and experienced teams in place to<br />
accomplish our objectives. Our progress has been fueled by the<br />
strong leadership of our senior management team and the hard work<br />
of our employees and contractors. I would like to express my<br />
appreciation to our Board of Directors for their ongoing support and<br />
guidance, as well as to the people and communities surrounding our<br />
operations near Thunder Bay and in the Abitibi region, whose<br />
partnerships have been instrumental in our progress. Finally, I remain<br />
deeply grateful to our shareholders for their continued support and<br />
patience as we complete our transition. As fellow shareholders, our<br />
senior management team is committed to increasing value for all of<br />
NAP’s stakeholders and we are looking forward to a productive year.<br />
Sincerely,<br />
William J. Biggar<br />
PRESIDENT AND CEO<br />
3<br />
2011 <strong>Annual</strong> <strong>Report</strong>
Operations<br />
2012 capital budget of<br />
$116 million at LDI:<br />
• Complete surface construction<br />
activities<br />
• Sink the shaft to the<br />
795-metre level by<br />
year end<br />
• Complete development of the<br />
735-metre mine level<br />
• Commence set up of mining<br />
stopes for production in the<br />
Offset Zone<br />
Lac des Iles<br />
<strong>Palladium</strong> Mine<br />
Below the Surface . . .<br />
Increasing production,<br />
lowering cash costs<br />
As an established PGM producer<br />
with excess mill capacity and<br />
permits in place, we are well<br />
positioned to convert exploration<br />
success into production and cash<br />
flow on an accelerated timeline.<br />
The Company’s flagship asset is the world class Lac<br />
des Iles (LDI) palladium mine – one of only two<br />
primary palladium producers in the world. The mine is<br />
located approximately 85 kilometres northwest of the<br />
city of Thunder Bay in Ontario, and consists of an<br />
open pit, an underground mine, and a large 15,000-<br />
tonne per day mill with significant excess capacity<br />
available for future production growth.<br />
LDI commenced production from the open pit in 1993,<br />
expanded underground to mine via ramp access from<br />
the Roby Zone in 2006, and in 2010 commenced a<br />
major expansion to mine via shaft from the Offset<br />
Zone. The most critical aspect of the mine expansion<br />
is the installation of the shaft, which is on track for<br />
completion at the end of 2012. This will allow LDI to<br />
gradually increase its underground mining rate<br />
starting in 2013 while utilizing a high volume bulk<br />
mining method.<br />
$500<br />
$450<br />
$400<br />
$350<br />
$300<br />
$250<br />
$200<br />
$150<br />
$100<br />
LDI’s Growth Profile<br />
$448<br />
$375 – $400<br />
146,000 oz<br />
150,000-<br />
160,000 oz<br />
+250,000 oz<br />
$200<br />
250,000<br />
200,000<br />
150,000<br />
100,000<br />
$50<br />
0<br />
2011<br />
Actual<br />
2012<br />
Guidance<br />
2015<br />
Estimate*<br />
50,000<br />
Our large 15,000-tonne per day<br />
mill has significant excess<br />
capacity, available for<br />
production growth.<br />
Pd.Production<br />
*Preliminary in nature and subject to change.<br />
See Forward-Looking Information.<br />
Cash Cost (US$/oz)<br />
4<br />
2011 <strong>Annual</strong> <strong>Report</strong>
Through the utilization of the shaft and higher mining<br />
rates, LDI is expected to benefit from increased<br />
production at reduced cash costs per ounce,<br />
transforming the mine into a long life, low cost<br />
producer of palladium.<br />
Beyond the mine expansion which is predominately<br />
based on the Offset Zone, there remains significant<br />
exploration upside near the mine, where a number of<br />
recent discoveries (Cowboy, Outlaw and Sheriff zones)<br />
can potentially increase production at LDI. The<br />
positive results from the Company’s significant<br />
85,000-metre drill campaign conducted in 2011<br />
underpins the significant exploration potential of the<br />
+33,000-acre land package, and supports NAP’s belief<br />
that mining will continue at LDI for many years<br />
to come.<br />
The exploration upside is further complimented by<br />
LDI’s existing infrastructure and permits, the<br />
underutilized mill, and the strategic engineering of<br />
the underground development which has potential to<br />
serve the other nearby underground zones with<br />
minimal additional development. As an established<br />
PGM producer with a clearly defined strategy for<br />
growth, NAP is well positioned to convert exploration<br />
success into production and cash flow on an<br />
accelerated timeline.<br />
Our commitment to safety<br />
is ingrained into every work<br />
task, reflecting the value we<br />
place on our employees’ well<br />
being and their contribution<br />
to the Company’s growth.<br />
Schematic of LDI’s Underground Deposit and Proposed Infrastructure<br />
NORTH<br />
OPEN PIT<br />
ROBY<br />
ZONE<br />
SURFACE<br />
SHAFT<br />
With over 18 years of experience<br />
at LDI, and with fully permitted<br />
and underutilized surface<br />
facilities in place, the execution<br />
risk for completing the LDI mine<br />
expansion is considerably<br />
less than a greenfield project.<br />
Our number one priority on<br />
the development side is to<br />
commission the shaft by<br />
the end of 2012 – effectively<br />
completing the conversion<br />
of our infrastructure over<br />
to a shaft-based operation.<br />
795 Metres<br />
OFFSET<br />
ZONE<br />
1,345 Metres<br />
Globally, there are few<br />
available palladium exploration<br />
investment opportunities as<br />
attractive as LDI, with low<br />
overall risk given our existing<br />
infrastructure and permitting,<br />
and with low geopolitical risk.<br />
5<br />
2011 <strong>Annual</strong> <strong>Report</strong>
<strong>Palladium</strong> Market Overview<br />
Uniquely positioned to prosper in a<br />
supply-constrained environment with<br />
exceptional leverage to higher palladium prices<br />
<strong>Palladium</strong> is used in car<br />
exhaust systems to help<br />
reduce harmful gas emissions<br />
released into the environment,<br />
with auto catalytic converts<br />
being the main source of<br />
fabrication demand.<br />
<strong>Palladium</strong> is widely used in<br />
electronics because of its<br />
distinctive ability to conduct<br />
electricity. The most common<br />
use is in semiconductors, which<br />
are used in virtually every<br />
electronic item.<br />
HIGHLY LEVERAGED TO THE RISING PRICE<br />
OF PALLADIUM<br />
As one of only two primary palladium producers in<br />
the world, NAP’s plans to significantly increase<br />
palladium production while lowering cash costs per<br />
ounce are well timed with the rising price of<br />
palladium. In a global environment of constrained<br />
supply and increased investment and fabrication<br />
demand, the future outlook for continuing increases<br />
in the price of palladium remains strong.<br />
CONSTRAINED SUPPLY<br />
Global mine supply of palladium is relatively small at<br />
only 6.8 million ounces per year. As a rare precious<br />
metal, there are very few palladium producing<br />
regions worldwide. Russia (where palladium is<br />
produced as a by-product from nickel mining) and<br />
South Africa (where palladium is produced as a<br />
by-product from platinum mining) account for over<br />
80% of global production.<br />
Strong Fabrication Demand:<br />
7.5 M oz. in 2010<br />
Refining<br />
6%<br />
Dental<br />
10%<br />
Other<br />
3%<br />
Automotive<br />
58%<br />
Jewellery<br />
7%<br />
Electronics<br />
16%<br />
A significant increase in mine supply is unlikely,<br />
largely due to political, infrastructure, and cost<br />
issues in South Africa, declining palladium<br />
production in Russia, and no new mines on the<br />
horizon in the near term. Moreover, it is widely<br />
believed that the Russian government’s palladium<br />
stockpile (which has historically been an overhang<br />
on the market by virtue of its influence on supply)<br />
has decreased considerably, moving the palladium<br />
market into a deficit starting in 2012.<br />
Global Mine Supply: 6.8 M oz. in 2010<br />
<strong>North</strong><br />
America<br />
9%<br />
Russia<br />
40%<br />
<strong>Palladium</strong> use in the jewelry<br />
sector has most extensively<br />
been used to make white<br />
gold, although given its close<br />
resemblance to platinum, its<br />
light weight, and price incentive<br />
compared to other precious<br />
metals, it is growing in<br />
popularity for men’s wedding<br />
bands and other jewelry pieces.<br />
South Africa<br />
42%<br />
Source: CPM Group, June 2011<br />
6<br />
2011 <strong>Annual</strong> <strong>Report</strong>
RISING DEMAND<br />
Although palladium is considered a precious metal, the<br />
most significant applications of palladium are industrial<br />
in nature. The leading source of fabrication demand<br />
comes from the automotive sector, where palladium is<br />
used for the manufacture of catalytic converters to help<br />
reduce toxic emissions into the environment. The<br />
resilient growth in vehicle production, overlaid with<br />
improving emission standards, has resulted in catalytic<br />
110,000<br />
100,000<br />
90,000<br />
80,000<br />
70,000<br />
60,000<br />
50,000<br />
40,000<br />
30,000<br />
20,000<br />
10,000<br />
Global Light Vehicle Production<br />
77M<br />
81M<br />
85M<br />
91M<br />
95M<br />
converters becoming the primary demand driver for<br />
palladium. The demand is further strengthened by the<br />
widespread uses of palladium in electronics, such as<br />
smartphones and televisions, and by other nonindustrial<br />
uses of the metal, such as for jewelry and for<br />
investment through palladium holdings in Exchange<br />
Traded Funds (ETFs).<br />
99M<br />
102M<br />
104M<br />
Other 1<br />
Europe<br />
<strong>North</strong> America<br />
BRIC Economies 2<br />
70,000 metres of drilling<br />
planned in 2012:<br />
• Expand reserves & resources<br />
and identify new targets at LDI<br />
• Continue to define the Offset<br />
Zone (infill drilling & testing<br />
extensions towards surface,<br />
at depth, & south)<br />
• Drill at <strong>North</strong> LDI, <strong>North</strong> VT<br />
Rim & Legris Lake<br />
0<br />
2011 2012 2013 2014 2015 2016 2017 2018<br />
Source: IHS Global Insight Automotive, February 2012<br />
1. Other includes: Japan, Korea, Middle East and Africa<br />
2. BRIC Economies include: Greater China, South America and South Asia<br />
Vezza Gold Mine<br />
Well positioned to be a steady<br />
contributor of cash flow<br />
At the end of the day, it is<br />
people that build businesses.<br />
Our progress has been fueled<br />
by an entrepreneurial business<br />
culture that transcends a team<br />
of over 400 employees spread<br />
across all our operations.<br />
NAP also operates the Vezza gold mine located in the<br />
Abitibi region of Quebec, adding diversification into<br />
gold, and more importantly, a second source of cash<br />
flow to fund the Company’s aggressive growth<br />
initiatives at its flagship palladium operations.<br />
The Vezza property consists of an underground mine<br />
with shaft access (to a current depth of 740 metres<br />
below surface), including substantial underground<br />
and surface infrastructure. The deposit was<br />
historically subject to extensive exploration and<br />
development work, which NAP continued at an<br />
aggressive pace during 2011 to get the mine to be<br />
“production ready” for 2012.<br />
The Company has commenced operations at Vezza<br />
and plans to achieve commercial production at a rate<br />
of 750 tonnes per day in the second quarter of 2012.<br />
Following commencement of commercial production,<br />
NAP expects Vezza will produce approximately 30,000<br />
ounces of gold this year. Through the investments<br />
NAP plans to make in 2012, the Company has<br />
potential to further increase future production<br />
at Vezza.<br />
With stable gold production during a favourable gold<br />
price environment, a secured workforce, and good<br />
prospects for reserve growth through exploration,<br />
Vezza is well positioned to be a steady contributor of<br />
cash flow for many years to support growth in the<br />
palladium operations.<br />
Over the past couple of years<br />
we made a commitment to raise<br />
our profile in the investment<br />
community and have successfully<br />
attracted many new institutional<br />
investors. We now have 11<br />
analysts providing research<br />
coverage on the Company,<br />
and our institutional investor<br />
ownership is around 70%.<br />
7<br />
2011 <strong>Annual</strong> <strong>Report</strong>
Corporate Social Responsibility<br />
We are committed to achieving operational<br />
excellence in all aspects of our business<br />
• We always meet legislated<br />
environmental requirements,<br />
and strive to surpass them<br />
with vigorous testing and a<br />
strict internal environmental<br />
management system.<br />
• We successfully<br />
decreased our Greenhouse<br />
Gas Emissions at LDI, and<br />
achieved excellent results in<br />
our Water Management testing<br />
in 2011.<br />
• We are recycling 100% of the<br />
waste water generated by<br />
LDI’s milling process, reducing<br />
our fresh water intake.<br />
• Air emissions at LDI<br />
are significantly below<br />
regulatory requirements,<br />
typically between 0–30%<br />
of the limit outlined by the<br />
Ministry of Environment.<br />
ENVIRONMENTAL STEWARDSHIP<br />
We recognize that environmental management and<br />
the protection of the environment are among the<br />
highest corporate priorities at all stages of our<br />
operations. Through the vigorous tests that ensure<br />
our environmental compliance, to the formal<br />
environmental management systems in place, we<br />
always strive to minimize our environmental impact.<br />
COMMUNITY<br />
We are responsible to the communities in which we<br />
operate, and are committed to our role as a responsible<br />
corporate citizen. In keeping with this philosophy, <strong>North</strong><br />
<strong>American</strong> <strong>Palladium</strong> always strives to be a good<br />
neighbour and employer, to create economic prosperity<br />
for its stakeholders, and whenever possible, we give<br />
preference to local and regional suppliers when<br />
purchasing goods and services.<br />
In 2011, we updated our Code<br />
of Conduct and implemented a<br />
third-party whistleblower hotline<br />
to maintain our high standards<br />
for best practices, ethics, and<br />
corporate governance.<br />
HEALTH & SAFETY<br />
We are committed to ensuring a safe working<br />
environment for all of our employees. Key features<br />
ensuring safety in our workplace include our<br />
dedicated team of managers and supervisors who<br />
make safety an integral part of each workday, our<br />
Joint Health and Safety Committee which focuses on<br />
identifying safety concerns and making<br />
improvements, crew safety meetings held to address<br />
worker concerns and communicate safe work issues,<br />
procedures that are developed and communicated<br />
for activities that may have related hazards, a<br />
fully-trained Mine Rescue team that is always<br />
available to respond to any emergency situation, use<br />
of the Common Core modular training systems,<br />
and alliances with groups such as FM Global<br />
and the Electrical Safety Authority who inspect<br />
our facilities to provide insight into any<br />
opportunities for improvement.<br />
ETHICAL & RESPONSIBLE<br />
BUSINESS CONDUCT<br />
<strong>North</strong> <strong>American</strong> <strong>Palladium</strong> always strives to maintain<br />
high standards of integrity and accountability in<br />
conducting business. We have adopted a Code of<br />
Conduct that is applicable to all directors, officers,<br />
employees and contractors. As part of our<br />
commitment to ethical and responsible business<br />
conduct, we are also committed to maintaining<br />
accountability for our accounting, internal controls<br />
and auditing processes. It is also our policy to seek<br />
to ensure compliance with all applicable legal and<br />
regulatory requirements relating to our business.<br />
8<br />
2011 <strong>Annual</strong> <strong>Report</strong>
MANAGEMENT’S DISCUSSION AND ANALYSIS<br />
INTRODUCTION<br />
Unless the context suggests otherwise, references to “NAP” or the “Company” or similar terms refer to <strong>North</strong> <strong>American</strong> <strong>Palladium</strong> Ltd. and<br />
its subsidiaries. “LDI” refers to Lac des Iles Mines Ltd., and “Cadiscor” refers to Cadiscor Resources Inc. On March 4, 2011, the name<br />
Cadiscor Resources Inc., was changed to NAP Quebec Mines Ltd.<br />
The following is management’s discussion and analysis (“MD&A”) of the financial condition and results of operations to enable readers of the<br />
Company’s consolidated financial statements and related notes to assess material changes in financial condition and results of operations for<br />
the year ended December 31, 2011, compared to those of the respective periods in the prior year. This MD&A has been prepared as of<br />
February 23, 2012 and is intended to supplement and complement the consolidated financial statements and notes thereto for the year ended<br />
December 31, 2011 (collectively, the “Financial Statements”). Readers are encouraged to review the Financial Statements in conjunction with<br />
their review of this MD&A and the most recent Form 40-F/<strong>Annual</strong> Information Form on file with the U.S. Securities and Exchange Commission<br />
(“SEC”) and Canadian provincial securities regulatory authorities, available at www.sec.gov and www.sedar.com, respectively.<br />
All amounts are in Canadian dollars unless otherwise noted and all references to production ounces refer to payable production.<br />
FORWARD-LOOKING INFORMATION<br />
Certain information contained in this MD&A constitutes ’forward-looking statements’ within the meaning of the ’safe harbor’ provisions of the<br />
United States Private Securities Litigation Reform Act of 1995 and Canadian securities laws. All statements other than statements of historical<br />
fact are forward-looking statements. The words ’expect’, ’believe’, ’anticipate’, ’contemplate’, ’target’, ’plan’, ’may’, ’will’, ’intend’, ’estimate’ and<br />
similar expressions identify forward-looking statements. Forward-looking statements included in this MD&A include, without limitation:<br />
information as to our strategy, plans or future financial or operating performance, such as the Company’s expansion plans, project timelines,<br />
production plans, projected cash flows or expenditures, operating cost estimates, mining or milling methods, projected exploration results and<br />
other statements that express management’s expectations or estimates of future performance. The Company cautions the reader that such<br />
forward-looking statements involve known and unknown risk factors that may cause the actual results to be materially different from those<br />
expressed or implied by the forward-looking statements. Such risk factors include, but are not limited to: the possibility that metal prices and<br />
foreign exchange rates may fluctuate, inherent risks associated with exploration, development, mining and processing including environmental<br />
hazards, uncertainty of mineral reserves and resources, the risk that the Company may not be able to obtain financing, the possibility that the<br />
Lac des Iles mine and Vezza project may not perform as planned, changes in legislation, taxation, regulations or political and economic<br />
developments in Canada and abroad, employee relations, litigation and the risks associated with obtaining necessary licenses and permits. For<br />
more details on these and other risk factors see the Company’s most recent Form 40-F/<strong>Annual</strong> Information Form on file with the U.S. Securities<br />
and Exchange Commission and Canadian provincial securities regulatory authorities. Forward-looking statements are necessarily based upon a<br />
number of factors and assumptions that, while considered reasonable by management, are inherently subject to significant business, economic<br />
and competitive uncertainties and contingencies. The factors and assumptions contained in this MD&A, which may prove to be incorrect,<br />
include, but are not limited to: that metal prices and exchange rates between the Canadian and United States dollar will be consistent with the<br />
Company’s expectations, that there will be no material delays affecting operations or the timing of ongoing development projects, that prices for<br />
key mining and construction supplies, including labour costs, will remain consistent with the Company’s expectations, and that the Company’s<br />
current estimates of mineral reserves and resources are accurate. The forward-looking statements are not guarantees of future performance.<br />
The Company disclaims any obligation to update or revise any forward-looking statements, whether as a result of new information, events or<br />
otherwise, except as expressly required by law. Readers are cautioned not to put undue reliance on these forward-looking statements.<br />
CAUTIONARY NOTE TO U.S. INVESTORS CONCERNING MINERAL RESERVES AND RESOURCES<br />
Mineral reserve and mineral resource information contained herein has been calculated in accordance with National Instrument 43-101 – Standards<br />
of Disclosure for Mineral Projects, as required by Canadian provincial securities regulatory authorities. Canadian standards differ significantly from<br />
the requirements of the SEC, and mineral reserve and mineral resource information contained herein is not comparable to similar information<br />
disclosed in accordance with the requirements of the SEC. While the terms “measured”, “indicated” and “inferred” mineral resources are required<br />
pursuant to National Instrument 43-101, the SEC does not recognize such terms. U.S. investors should understand that “inferred” mineral resources<br />
have a great amount of uncertainty as to their existence and great uncertainty as to their economic and legal feasibility. In addition, U.S. investors<br />
are cautioned not to assume that any part or all of NAP’s mineral resources constitute or will be converted into reserves. For a more detailed<br />
description of the key assumptions, parameters and methods used in calculating NAP’s mineral reserves and mineral resources, see NAP’s most<br />
recent <strong>Annual</strong> Information Form/Form 40-F on file with Canadian provincial securities regulatory authorities and the SEC.<br />
OUR BUSINESS<br />
<strong>North</strong> <strong>American</strong> <strong>Palladium</strong> Ltd. (“NAP”) is an established precious metals producer that has been operating its flagship Lac des Iles (“LDI”)<br />
mine located in Ontario, Canada since 1993. LDI is one of only two primary producers of palladium in the world, and is currently undergoing a<br />
major expansion to increase production and reduce cash cost per ounce1. NAP also operates the Vezza gold mine located in the Abitibi<br />
region of Quebec.<br />
The Company is expanding the LDI mine to transition from mining via ramp access to mining via shaft while utilizing a high volume bulk<br />
mining method. The shaft is targeted to be commissioned at the end of 2012, which will allow LDI to increase its underground mining rate<br />
and palladium production. It is expected that the mine expansion will transform LDI into a long life, low cost producer of palladium. The<br />
Vezza gold mine, which is targeted to commence commercial production in the second quarter of 2012, is expected to provide an additional<br />
source of cash flow to fund growth in the Company’s palladium initiatives.<br />
1 Non-IFRS measure. Please refer to Non-IFRS Measures on pages 31-33.<br />
9<br />
2011 <strong>Annual</strong> <strong>Report</strong>
MANAGEMENT’S DISCUSSION AND ANALYSIS<br />
The Company has significant exploration upside near the LDI mine, where a number of growth targets have been identified, and is engaged<br />
in a substantial exploration program aimed at increasing its palladium reserves and resources. As NAP pursues its organic growth strategy<br />
through the LDI mine expansion, exploration will continue to be a key focus for the Company for many years to come. As an established<br />
palladium-platinum group metal (“PGM”) producer with excess mill capacity on a permitted property, NAP has potential to convert<br />
exploration success into production and cash flow on an accelerated timeline.<br />
With an experienced senior management team, a strong balance sheet of over $108 million in working capital (including $51 million in cash)<br />
as at December 31, 2011, NAP is well positioned to pursue its growth strategy. NAP trades on the TSX under the symbol PDL and on the<br />
NYSE Amex under the symbol PAL. The Company’s common shares are included in the S&P/TSX Composite Index.<br />
KEY HIGHLIGHTS<br />
(expressed in thousands of dollars except cash cost and per share amounts) 2011 2010 2009*<br />
FINANCIAL HIGHLIGHTS<br />
Revenue $ 170,472 $ 107,098 $ 4,019<br />
Unit sales<br />
<strong>Palladium</strong> (oz) 146,457 95,057 –<br />
Gold (oz) 24,275 21,573 –<br />
Platinum (oz) 9,133 4,894 –<br />
Nickel (lb) 814,551 395,622 –<br />
Copper (lb) 1,593,479 658,013 –<br />
Earnings<br />
Net loss $ (65,154) $ (29,409) $ (30,014)<br />
Net loss per share $ (0.40) $ (0.21) $ (0.29)<br />
Adjusted net income (loss)1 $ 723 $ 6,720 $ (16,816)<br />
EBITDA1 $ (44,786) $ (17,073) $ (28,465)<br />
Adjusted EBITDA1 $ 21,091 $ 19,056 $ (15,267)<br />
Cash flow provided by (used in) operations<br />
Cash flow provided by (used in) operations before changes in<br />
non-cash working capital1 $ 6,122 $ (12,029) $ (27,656)<br />
Cash flow provided by (used in) operations before changes in<br />
non-cash working capital per share1 $ 0.04 $ (0.08) $ (0.27)<br />
Capital spending $ 185,633 $ 49,364 $ 12,205<br />
OPERATING HIGHLIGHTS<br />
Production<br />
<strong>Palladium</strong> (oz) 146,624 95,057 –<br />
Gold (oz) 21,890 21,718 –<br />
Platinum (oz) 9,143 4,894 –<br />
Nickel (lb) 816,037 395,622 –<br />
Copper (lb) 1,596,185 658,013 –<br />
Realized metal prices<br />
<strong>Palladium</strong> $ 733 $ 665 –<br />
Gold $ 1,534 $ 1,208 –<br />
Cash cost per ounce1<br />
<strong>Palladium</strong> (US$) $ 448 $ 283<br />
Gold (US$) $ 1,819 $ 1,549<br />
* 2009 amounts have been prepared under Canadian GAAP and therefore may not be comparable to the 2011 and 2010 information.<br />
1 Non-IFRS measure. Please refer to Non-IFRS Measures on pages 31-33.<br />
10<br />
2011 <strong>Annual</strong> <strong>Report</strong>
MANAGEMENT’S DISCUSSION AND ANALYSIS<br />
FINANCIAL CONDITION<br />
As at December 31 As at December 31 As at December 31<br />
(expressed in thousands of dollars) 2011 2010 2009*<br />
Net working capital $ 108,432 $ 169,559 $ 114,507<br />
Cash balance $ 50,935 $ 75,159 $ 98,255<br />
Shareholders’ equity $ 268,996 $ 290,450 $ 192,261<br />
EXECUTIVE SUMMARY<br />
Financial Highlights<br />
Revenue for the year ended December 31, 2011 was $170.5 million compared to $107.1 million in the prior year. Net loss for the year,<br />
including a non-cash gold asset impairment charge of $49.2 million, was $65.2 million or $0.40 per share and EBITDA1 was a negative<br />
$44.8 million. In 2010, the net loss was $29.4 million or $0.21 per share and EBITDA1 was a negative $17.1 million. For 2011, adjusted net<br />
income1 was $0.7 million and adjusted EBITDA1 was $21.1 million, compared to adjusted net income1 of $6.7 million and adjusted EBITDA1<br />
of $19.1 million in the prior year. The Company generated cash from operating activities of $6.1 million, before changes in non-cash<br />
working capital1.<br />
Strong Balance Sheet<br />
As at December 31, 2011, the Company had approximately $108.4 million in working capital, including $50.9 million cash on hand. Subsequent<br />
to year end, the Company completed a $15.0 million capital lease facility to fund equipment for the LDI mine expansion, of which $11.1 million<br />
has been utilized.<br />
Investment in Growth<br />
For the year ended December 31, 2011, the Company invested $16.7 million in exploration activities ($10.0 million at its palladium operations<br />
and $6.7 million at its gold operations) and $185.6 million in development expenditures ($148.3 million at its palladium operations, of which<br />
$142.1 million was invested in the LDI mine expansion, and $37.3 million at its gold operations).<br />
LDI Mine <strong>Palladium</strong> Production<br />
The LDI mine produced 146,624 ounces of payable palladium for the year ended December 31, 2011. During the year, 1,830,234 tonnes of ore<br />
were mined with 1,689,781 tonnes of ore processed by the LDI mill. The mill processed an average of 10,675 tonnes per operating day at an<br />
average palladium head grade of 3.70 grams per tonne, with a palladium recovery of 78.3%. For 2011, LDI’s cash cost per ounce1 (net of<br />
by-product credits) was US$448.<br />
Production at the LDI mine in 2011 included the blending of higher grade underground ore (988,502 tonnes with an average palladium grade<br />
of 5.7 grams per tonne) with lower grade surface ore (841,732 tonnes with an average palladium grade of 1.8 grams per tonne).<br />
LDI Mine Expansion Update<br />
The Company is currently expanding the LDI mine to transition from mining via ramp access to mining via shaft while utilizing a high volume<br />
bulk mining method. The objective of the mine expansion is to increase future production and lower cash cost per ounce1. During 2011, the<br />
Company made significant progress in advancing the critical aspects of the mine expansion which remains on schedule to commission the<br />
shaft at the end of 2012.<br />
The shaft, with a name plate capacity of approximately 7,000 tonnes per day, will allow LDI to increase its underground mining rate to 3,500<br />
tonnes per day at the beginning of 2013 and then gradually increase the rate during 2013 and 2014 to 5,500 tonnes per day starting in 2015, at<br />
which point the Company is targeting production to exceed 250,000 ounces at a cash cost1 of approximately US$200 per ounce (based on<br />
current by-product metal prices).<br />
2011 mine expansion development highlights include:<br />
• Constructing the head frame, hoist room, and electrical substation;<br />
• Completing the shaft raise bore pilot hole and primary ventilation raise bore;<br />
• Commencing the sub-collar work;<br />
• Completing the pilot hole for the backfill aggregate raise to the surface;<br />
• Advancing the ramp to a depth of 795 metres from surface; and<br />
• Developing the 735-metre mine level in preparation for production.<br />
In the year ended December 31, 2011, $143.1 million was invested in the mine expansion, including finance leases of $2.6 million and<br />
excluding capitalized interest of $1.6 million. In 2012, capital expenditures for the mine expansion are budgeted at $116.0 million.<br />
Development work in 2012 will be focused on completing the surface construction activities, advancing underground development, and<br />
completing the shaft sinking to the 795-metre level by year end.<br />
* 2009 amounts have been prepared under Canadian GAAP and therefore may not be comparable to the 2011 and 2010 information.<br />
1 Non-IFRS measure. Please refer to Non-IFRS Measures on pages 31-33.<br />
11<br />
2011 <strong>Annual</strong> <strong>Report</strong>
MANAGEMENT’S DISCUSSION AND ANALYSIS<br />
Vezza Gold Mine Production and Development Update<br />
During 2011, the Company made good progress in the development work at its Vezza gold mine and at the end of the year commenced<br />
processing Vezza’s bulk sample at the nearby Sleeping Giant mill. Accordingly, the Company expects commercial production to commence<br />
at a mining rate of 750 tonnes per day in the second quarter of 2012. The Company forecasts Vezza will produce approximately 30,000<br />
ounces of gold at a cash cost of approximately US$1,150 per ounce for the remainder of 2012.<br />
Production will come from a blend of long hole and alimak mining methods. The Company has entered into a contract with Promec Mining<br />
Inc., a Val d’Or mining contractor, to provide the mining workforce at Vezza. The total workforce is expected to be in the range of 150 people.<br />
Vezza’s ore will be trucked to the Sleeping Giant mill (approximately 85 kilometres away), which is expected to process an average head<br />
grade of 5.2 grams per tonne, with a gold recovery of 88%.<br />
In 2011, the Company invested $28.2 million to advance Vezza to production, and plans to invest an additional $17.0 million in 2012 to<br />
continue underground development of the mine and to increase production in 2013. The capital expenditures in 2012 consist of development<br />
work associated with the underground infrastructure (such as drifts and ore passes), drilling costs, as well as a new camp for the<br />
workforce, a backfill cement plant, rock conveyor and pump, and other required equipment.<br />
Sleeping Giant Mine Closure<br />
The Company announced on January 17, 2012 that it is discontinuing production at the Sleeping Giant mine due to its insufficient operating margin.<br />
After reviewing various mining scenarios, the Company concluded that mining would likely continue at high costs given the lack of grade<br />
continuity, with insufficient operating margin to justify continuing operations. The Company therefore ceased mining operations at Sleeping<br />
Giant and has restructured the gold division, resulting in a non-cash impairment charge on its gold assets of $49.2 million.<br />
The Sleeping Giant mill will continue to process ore from the Vezza mine. The mill has a capacity of 900 tonnes per day which will be<br />
sufficient to process Vezza’s ore.<br />
In 2011, the Sleeping Giant mine produced 14,623 ounces of gold. During the year, 73,701 tonnes of ore were hoisted from Sleeping Giant,<br />
with 74,154 tonnes processed by the mill at an average head grade of 6.36 grams per tonne, with a gold recovery of 96.4%. For the year<br />
ended December 31, 2011, Sleeping Giant’s cash cost per ounce1 was US$1,819.<br />
Exploration<br />
In 2011, 261 holes totalling 84,686 metres were drilled on the LDI property. Underground drilling accounted for 41,343 metres (205 holes), of<br />
which approximately 13,290 metres (66 holes) were to support mine operations. Drilling from surface accounted for the remaining 43,343<br />
metres (56 holes). The objective of NAP’s 2011 exploration program was to expand the Offset Zone, improve knowledge of the Offset Zone<br />
mineralization through infill drilling, and to identify potential surface targets.<br />
Following the exploration success achieved in the past few years, the Company will continue to invest in exploration to expand the reserves and<br />
resources at LDI and to identify new targets. The Company’s 2012 exploration expenditures are expected to be approximately $16 million, comprised<br />
of approximately 70,000 metres of drilling, of which 64,000 metres will be at LDI, and 6,000 metres at the Company’s other nearby properties.<br />
Approximately $10 million of the $16 million in 2012 expenditures (55,000 of the 64,000 metres to be drilled at LDI) will be in connection with the mine<br />
expansion and is included in the $116 million capital expenditure budget for the mine expansion, leaving a balance of $6 million that will be expensed.<br />
The main focus of the 2012 exploration program will be underground exploration at LDI targeting the Offset Zone, to conduct infill drilling as<br />
well as to test extensions of the Offset Zone mineralization towards surface, at depth, and to the south. In addition, drilling on surface will be<br />
conducted at <strong>North</strong> LDI, the <strong>North</strong> VT-Rim and Legris Lake.<br />
In 2011, 376 holes totalling 79,434 metres were drilled in the gold division, which included approximately 36,746 metres of drilling at Sleeping<br />
Giant, and 79,434 metres of surface and development drilling at Vezza. In 2012, the Company intends to do minimal exploration activities on<br />
its non-producing gold properties.<br />
Outlook<br />
The supply and demand fundamentals of palladium remain strong, and most forecasters continue to have an optimistic outlook. A supporting<br />
factor behind the positive outlook for the metal’s future performance is the resilient industrial demand, increasing investment demand and<br />
constrained global supply.<br />
In 2012, the Company plans to focus on the following milestones:<br />
• Commissioning of the LDI mine shaft (target end of Q4, 2012);<br />
• Completing the reserve and resource update for LDI (Q2, 2012);<br />
• Achieving commercial production at the Vezza mine (Q2, 2012);<br />
• Completing the reserve and resource update for Vezza (Q2, 2012); and<br />
• Expanding reserves and resources at LDI through continuing exploration.<br />
1 Non-IFRS measure. Please refer to Non-IFRS Measures on pages 31-33.<br />
12<br />
2011 <strong>Annual</strong> <strong>Report</strong>
MANAGEMENT’S DISCUSSION AND ANALYSIS<br />
Selected <strong>Annual</strong> Information<br />
(expressed in thousands of dollars, except per share amounts) 2011 2010 2009<br />
Revenue $ 170,472 $ 107,098 $ 4,019<br />
Gold assets impairment charge 49,210 – –<br />
Income (loss) from mining operations (33,081) 8,088 (6,232)<br />
Net loss (65,154) (29,409) (30,014)<br />
Net loss per share – Basic and diluted (0.40) (0.21) (0.29)<br />
Cash flow provided by (used in) operations prior to<br />
changes in non-cash working capital1 6,122 (12,029) (27,656)<br />
Total assets 416,045 348,437 221,777<br />
Obligations under finance leases 4,532 2,391 1,134<br />
For the year ended December 31, 2010, revenue was $107.1 million compared to $4.0 million in the prior year. Income from mining operations<br />
for the year ended December 31, 2010 was $8.1 million compared to a loss in the prior year of $6.2 million. Production from LDI was<br />
successfully restarted in April 2010 after being temporarily placed on care and maintenance in October 2008 due to low metal prices.<br />
Metal Prices<br />
<strong>Palladium</strong> Price (US$/ Troy oz)<br />
1,000<br />
800<br />
600<br />
400<br />
200<br />
0<br />
2007 2008 2009 2010 2011 2012<br />
During 2011, the palladium price averaged US$733 per ounce, ranging from a low of US$565 to a high of US$859 per ounce. The global<br />
economic uncertainty surrounding the Eurozone Sovereign debt issues resulted in volatility for all commodities, but particularly affected the<br />
more industrial of the precious metals such as palladium with concerns of a potential global economic slowdown. These concerns were<br />
reflected in the liquidation of almost 700,000 ounces of palladium in ETF holdings, which was a primary factor in the declining price of<br />
palladium towards the end of 2011. Amid global economic uncertainty in Europe and the U.S., the price of palladium continued to show<br />
strong support above US$550 per ounce level at the end of 2011. With confidence in European financial markets expected to improve,<br />
coupled with the continuing strength in global vehicle production, this supports future increases in the price of palladium from its current<br />
level of around US$724 per ounce (as of February 22, 2012).<br />
1.4<br />
1.3<br />
1.2<br />
1.1<br />
1<br />
0.9<br />
0.8<br />
Average exchange rate (CDN$1 = US$)<br />
0.7<br />
2007 2008 2009 2010 2011 2012<br />
13<br />
2011 <strong>Annual</strong> <strong>Report</strong>
MANAGEMENT’S DISCUSSION AND ANALYSIS<br />
During 2011, the average Canadian dollar exchange rate was $1.01, ranging from a low of $0.95 to a high of $1.06 to the U.S. dollar. At the end<br />
of 2011, the U.S. dollar rallied as investors sought out safe-haven assets like U.S. treasury bills. The Canadian dollar closed at $0.98 cents to<br />
the U.S. dollar, compared to $1.00 at the end of the 2010. As of February 22, 2012, the Canadian dollar exchange rate was $1.00.<br />
2,000<br />
Gold Price (US$/ Troy oz)<br />
1,500<br />
1,000<br />
500<br />
0<br />
2007 2008 2009 2010 2011 2012<br />
During 2011, the average price of gold was US$1,706 per ounce, ranging from a low of US$1,488 to a high of US$1,900 per ounce. The price of<br />
gold was US$1,776 as of February 22, 2012.<br />
NAP Realized Metal Prices and Exchange Rates<br />
2011 2010<br />
<strong>Palladium</strong> – US$/oz $ 733 $ 665<br />
Platinum – US$/oz $ 1,725 $ 1,690<br />
Gold – US$/oz $ 1,534 $ 1,208<br />
Nickel – US$/lb $ 10.52 $ 10.11<br />
Copper – US$/lb $ 4.06 $ 3.58<br />
Average exchange rate – CDN$1 = US$ $ 1.01 $ 0.97<br />
Realized metal prices represent the weighted average metal prices received based on cash settlement of amounts owing from smelters for<br />
final outturn of metals during the year.<br />
Spot Metal Prices* and Exchange Rates<br />
For comparison purposes, the following table details recorded spot metal prices and exchange rates.<br />
Dec. 31 Sep. 30 Jun. 30 Mar. 31 Dec. 31 Sep. 30 Jun. 30 Mar. 31<br />
2011 2011 2011 2011 2010 2010 2010 2010<br />
<strong>Palladium</strong> – US$/oz $ 636 $ 614 $ 761 $ 766 $ 791 $ 573 $ 446 $ 479<br />
Gold – US$/oz $ 1,575 $ 1,620 $ 1,506 $ 1,439 $ 1,410 $ 1,307 $ 1,244 $ 1,116<br />
Platinum – US$/oz $ 1,381 $ 1,511 $ 1,722 $ 1,773 $ 1,731 $ 1,662 $ 1,532 $ 1,649<br />
Nickel – US$/lb $ 8.28 $ 8.30 $ 10.48 $ 11.83 $ 11.32 $ 10.57 $ 8.78 $ 11.33<br />
Copper – US$/lb $ 3.43 $ 3.24 $ 4.22 $ 4.26 $ 4.38 $ 3.65 $ 2.95 $ 3.56<br />
Exchange rate<br />
(Bank of Canada) –<br />
CDN$1 = US$ US$ 0.98 US$ 0.96 US$1.04 US$1.03 US$1.01 US$0.97 US$0.94 US$0.98<br />
* Based on the London Metal Exchange<br />
14<br />
2011 <strong>Annual</strong> <strong>Report</strong>
MANAGEMENT’S DISCUSSION AND ANALYSIS<br />
PALLADIUM OPERATIONS – FINANCIAL, OPERATING & DEVELOPMENT RESULTS<br />
The LDI mine consists of an open pit, an underground mine, and a mill with a design capacity of approximately 15,000 tonnes per day. The<br />
primary deposits on the property are the Roby Zone and the Offset Zone, both disseminated magmatic palladium-platinum group metal deposits.<br />
Underground ore production from the LDI mine is operating at approximately 2,700 tonnes per day, seven days a week, on two 12-hour shifts<br />
per day. The Company has a workforce of approximately 270 people at LDI and its collective agreement with the United Steelworkers is<br />
effective until May 31, 2012.<br />
Financial Results<br />
Income from mining operations for the <strong>Palladium</strong> operations is summarized in the following table.<br />
2011 2010<br />
Revenue $ 143,659 $ 84,813<br />
Mining operating expenses<br />
Production costs $ 89,657 $ 46,269<br />
Smelting, refining and freight costs 9,206 4,721<br />
Royalty expense 5,819 4,202<br />
Inventory impairment charge 1,352 –<br />
Depreciation and amortization 9,961 5,396<br />
Gain on disposal of equipment (923) (268)<br />
Total mining operating expenses $ 115,072 $ 60,320<br />
Income from mining operations $ 28,587 $ 24,493<br />
The Company has included income from mining operations as an additional IFRS measure as the Company believes it provides the user with<br />
information on the actual results of operations for each reporting segment.<br />
Revenue<br />
Revenue is affected by sales volumes, commodity prices and currency exchange rates. Metal sales for LDI are recognized in revenue at<br />
provisional prices when delivered to a smelter for treatment or designated shipping point. Final pricing is not determined until the refined<br />
metal is sold by the smelter, which in the case of LDI base metals is three months and precious metals is six months after delivery to the<br />
smelter. These final pricing adjustments can result in additional revenues in a rising commodity price environment and reductions to<br />
revenue in a declining commodity price environment. Similarly, a weakening in the Canadian dollar relative to the U.S. dollar will result in<br />
additional revenues and a strengthening in the Canadian dollar will result in reduced revenues. For past production delivered to the smelter,<br />
the Company enters into financial contracts to mitigate the smelter agreements’ provisional pricing exposure to rising or declining palladium<br />
prices and an appreciating Canadian dollar. These financial contracts represent 69,500 ounces of palladium as at December 31, 2011 and<br />
mature from January 2012 through June 2012 at an average price of $697 per ounce of palladium. For substantially all of the palladium<br />
delivered to the customer under the smelter agreement, the quantities and timing of settlement specified in the financial contracts match<br />
final pricing settlement periods. The palladium financial contracts are being recognized on a mark-to-market basis as an adjustment to<br />
revenue. The fair value of these contracts at December 31, 2011 was $2.0 million, included in accounts receivable (December 31, 2010 –<br />
negative $11.1 million).<br />
Sales volumes of LDI’s major commodities are set out in the table below.<br />
2011 2010<br />
Sales volumes<br />
<strong>Palladium</strong> (oz) 146,457 95,057<br />
Gold (oz) 7,256 4,023<br />
Platinum (oz) 9,133 4,894<br />
Nickel (lbs) 814,551 395,622<br />
Copper (lbs) 1,593,479 658,013<br />
Cobalt (lbs) 20,839 9,801<br />
Silver (oz) 3,752 1,619<br />
15<br />
2011 <strong>Annual</strong> <strong>Report</strong>
MANAGEMENT’S DISCUSSION AND ANALYSIS<br />
Revenue from metal sales from the <strong>Palladium</strong> operations is set out below.<br />
2011 2010<br />
Revenue before pricing adjustments $ 148,480 $ 77,429<br />
Pricing adjustments (4,821) 7,384<br />
Revenue after pricing adjustments $ 143,659 $ 84,813<br />
Revenue by metal<br />
<strong>Palladium</strong> $ 104,004 $ 63,351<br />
Gold 11,971 5,640<br />
Platinum 13,867 8,659<br />
Nickel 7,585 4,283<br />
Copper 5,804 2,659<br />
Cobalt 304 171<br />
Silver 124 50<br />
$ 143,659 $ 84,813<br />
For the year ended December 31, 2011, revenue before pricing adjustments was $148.5 million, compared to $77.4 million in 2010, when we<br />
operated for nine months. 2011 reflected higher realized palladium prices and an increase in the quantity of palladium ounces sold.<br />
Operating Expenses<br />
For the year ended December 31, 2011, operating expenses were $115.1 million compared to $60.3 million in the prior year period, when we<br />
operated for nine months. The increase in operating expenses in 2011 result from processing lower grade stockpiles blended with the higher<br />
grade underground ore as well as higher contractor costs to process surface stockpiles, partially offset by electricity rebates.<br />
Cash cost per ounce1 of palladium sold, was US$448 for the year ended December 31, 2011 (2010 – US$283).<br />
During the second quarter of 2011, the Company was advised of its inclusion in the Ontario government’s <strong>North</strong>ern Industrial Electricity Rate<br />
(“NIER”) program to receive electricity price rebates of two cents per kilowatt hour. The NIER program is a three-year initiative designed to<br />
help large industries in <strong>North</strong>ern Ontario improve energy efficiency and sustainability. It is available to industrial facilities that consume<br />
greater than 50,000 megawatt hours of electricity per year. The Company’s commitment to the preparation and implementation of<br />
comprehensive energy management plans qualified the Company to participate. For the year ended December 31, 2011, a rebate of<br />
$4.2 million was received (including a retroactive rebate of $1.9 million for LDI’s electricity costs for the period of April 1, 2010 through<br />
March 31, 2011). The rebate was treated as a reduction of operating expenses. LDI will be entitled to receive additional quarterly rebates<br />
until March 2013 if it continues to meet eligibility criteria, which the Company anticipates will be the case.<br />
Smelting, refining and freight costs for the year ended December 31, 2011 were $9.2 million compared to $4.7 million in 2010. The increase<br />
over the prior year is primarily due to increased production volume in 2011 and increased freight and smelter costs on a unit basis.<br />
For the year ended December 31, 2011, royalty expense was $5.8 million compared to $4.2 million in the prior year. Royalty expense was<br />
higher in the current year due to higher production volume and increased revenue.<br />
Depreciation and amortization at the LDI mine for the year ended December 31, 2011 was $10.0 million, compared to $5.4 million for the year<br />
ended December 31, 2010. The increase over the prior year is due to higher production volume and an increase in depreciable assets in 2011.<br />
For the year ended December 31, 2011, an impairment charge of $1.4 million was recorded on the write down of obsolete supplies inventory<br />
(2010 – nil).<br />
1 Non-IFRS measure. Please refer to Non-IFRS Measures on pages 31-33.<br />
16<br />
2011 <strong>Annual</strong> <strong>Report</strong>
MANAGEMENT’S DISCUSSION AND ANALYSIS<br />
Operating Results<br />
The key operating results for the <strong>Palladium</strong> operations are set out in the following table.<br />
2011 2010<br />
Tonnes of ore milled 1,689,781 649,649<br />
Production<br />
<strong>Palladium</strong> (oz) 146,624 95,057<br />
Gold (oz) 7,267 4,023<br />
Platinum (oz) 9,143 4,894<br />
Nickel (lbs) 816,037 395,622<br />
Copper (lbs) 1,596,185 658,013<br />
<strong>Palladium</strong> head grade (g/t) 3.70 6.06<br />
<strong>Palladium</strong> recoveries (%) 78.34 80.80<br />
Tonnes of ore mined 1,830,234 615,926<br />
Total cost per tonne milled $ 54 $ 62<br />
Cash cost ($USD) 1 $ 448 $ 283<br />
LDI Mine<br />
2011 production at the LDI mine included the blending of higher grade underground ore with lower-grade surface sources. During the year<br />
ended December 31, 2011, 1,830,234 tonnes of ore was extracted, of which 988,502 tonnes came from underground sources with an average<br />
palladium grade of 5.7 grams per tonne (2010 – 615,926 tonnes with an average palladium grade of 6.2 grams per tonne), and 841,732 tonnes<br />
from surface sources with an average palladium grade of 1.8 grams per tonne (2010 – nil).<br />
LDI Mill<br />
For the year ended December 31, 2011, the LDI mill processed 1,689,781 tonnes of ore at an average of 10,675 tonnes per operating day,<br />
producing 146,624 ounces of payable palladium at an average palladium head grade of 3.7 grams per tonne, with a palladium recovery of<br />
78.3%, and mill availability of 97.7% (2010 – 649,649 tonnes processed, producing 95,057 ounces at an average grade of 6.1 grams per tonne<br />
with a palladium recovery of 80.8%). Production costs, per tonne of ore milled, were $54 for the year ended December 31, 2011 (2010 – $62<br />
per tonne of ore milled). To improve efficiencies and minimize processing costs, the mill is operating on a batch basis, with a two-week<br />
operating and a two-week non-operating schedule.<br />
LDI’s cash cost per ounce1 was US$448 per ounce (2010 – US$283 per ounce, when production consisted of only higher-grade<br />
underground ore).<br />
LDI Mine Expansion<br />
The Company is currently expanding the LDI mine to transition from mining via ramp access to mining via shaft while utilizing a high volume<br />
bulk mining method. The objective of the mine expansion is to increase future production at a lower cash cost per ounce1. During the year,<br />
the Company made significant progress in advancing the critical aspects of the mine expansion and remains on schedule to commission the<br />
shaft at the end of 2012.<br />
The shaft, which will have a name plate capacity of approximately 7,000 tonnes per day, will allow LDI to increase its underground mining<br />
rate to 3,500 tonnes per day at the beginning of 2013, then gradually increase the rate during 2013 and 2014 to 5,500 tonnes per day starting<br />
in 2015, at which point the Company is targeting production to exceed 250,000 ounces at a cash cost of approximately US$200 per ounce<br />
(based on current by-product metal prices).<br />
1 Non-IFRS measure. Please refer to Non-IFRS Measures on pages 31-33.<br />
17<br />
2011 <strong>Annual</strong> <strong>Report</strong>
MANAGEMENT’S DISCUSSION AND ANALYSIS<br />
The 2011 mine expansion development highlights include:<br />
• Constructing the head frame, hoist room, and electrical substation;<br />
• Completing the shaft raise bore pilot hole and primary ventilation raise bore;<br />
• Commencing the sub-collar work;<br />
• Completing the pilot hole for the backfill aggregate raise to the surface;<br />
• Advancing the ramp to a depth of 795 metres from surface; and<br />
• Developing the 735-metre mine level in preparation for production.<br />
In the year ended December 31, 2011, $143.1 million was invested in the mine expansion, including finance leases of $2.6 million and<br />
excluding capitalized interest of $1.6 million. In 2012, capital expenditures for the mine expansion are budgeted at $116.0 million.<br />
Development work in 2012 will be focused on the following:<br />
• Completing the surface construction activities;<br />
• Completing the shaft sinking to the 795-metre level by year end;<br />
• Completing development of the 735-metre mine level; and<br />
• Commencing set up of mining stopes for production in the Offset Zone.<br />
GOLD OPERATIONS – FINANCIAL, OPERATING & DEVELOPMENT RESULTS<br />
The Company also owns the Vezza gold mine located 233 kilometres north of Val d’Or, Quebec. The Vezza mine, which is targeted to<br />
commence commercial production in the second quarter of 2012, is expected to provide an additional source of cash flow to fund growth in<br />
the Company’s palladium initiatives.<br />
The Sleeping Giant gold mine consists of a narrow vein underground mine and a mill with a capacity of 900 tonnes per operating day.<br />
Subsequent to December 31, 2011, the Company announced the closure of the Sleeping Giant mine due to its insufficient operating margin<br />
(see Sleeping Giant mine below).<br />
Financial Results<br />
Income from mining operations for the Gold operations is summarized in the following table.<br />
2011 2010<br />
Revenue $ 26,813 $ 22,285<br />
Mining operating expenses<br />
Production costs $ 31,601 $ 28,440<br />
Smelting, refining and freight costs 54 58<br />
Depreciation and amortization 7,460 10,066<br />
Gold assets impairment charge 49,210 –<br />
Loss (gain) on disposal of equipment (27) (2)<br />
Total mining operating expenses $ 88,298 $ 38,562<br />
Loss from mining operations $ (61,485) $ (16,277)<br />
The Company has included income from mining operations as an additional IFRS measure as the Company believes it provides the user with<br />
information of the actual results of operations for each reporting segment.<br />
Revenue<br />
Metal sales for the Sleeping Giant gold mine are recognized at the time the title is transferred to a third party. Sales volumes are set out in<br />
the table below.<br />
2011 2010<br />
Sales volumes<br />
Gold (oz) 17,019 17,550<br />
Silver (oz) 31,150 24,000<br />
18<br />
2011 <strong>Annual</strong> <strong>Report</strong>
MANAGEMENT’S DISCUSSION AND ANALYSIS<br />
For the year ended December 31, 2011, revenue was $26.8 million, reflecting gold sales of 17,019 ounces with a realized price of US$1,531<br />
per ounce, compared to $22.3 million in the prior year with gold sales of 17,550 ounces with a realized price of US$1,204 per ounce.<br />
Operating Expenses<br />
For the year ended December 31, 2011, total production costs at the Sleeping Giant gold mine were $31.6 million as compared to $28.4 million<br />
in 2010 due to higher inventory adjustments in the current year. Cash cost per ounce1 was US$1,819 for the year ended December 31, 2011,<br />
compared to US$1,549 per ounce in 2010 due to higher labour costs.<br />
Depreciation and amortization at the Sleeping Giant gold mine was $7.5 million for the year ended December 31, 2011, compared to<br />
$10.1 million in the prior year due to fewer ounces produced in the current year period.<br />
As a result of the Company’s decision to cease mining operations at Sleeping Giant and restructure the gold division, a gold asset<br />
impairment charge of $49.2 million was recorded at December 31, 2011.<br />
Operating Results<br />
The key operating results for the Gold operations are set out in the following table.<br />
2011 2010<br />
Tonnes of ore milled 74,154 93,296<br />
Production<br />
Gold (oz) 14,623 17,695<br />
Gold head grade (g/t) 6.36 5.90<br />
Gold recoveries (%) 96.38 95.50<br />
Tonnes of ore hoisted 73,701 95,261<br />
Total cost per tonne milled $ 426 $ 305<br />
Cash cost ($USD) 1 $ 1,819 $ 1,549<br />
Sleeping Giant Mine<br />
For the year ended December 31, 2011, 73,701 tonnes of ore were hoisted from the underground mine with an average gold grade of<br />
6.36 grams per tonne (2010 – 95,261 tonnes hoisted with average grade of 5.90 grams per tonne).<br />
During 2011, mining was focused above the 975-metre elevation (mining the lower grade remnant reserves left behind by the previous<br />
operator) and strived to reduce operating costs to achieve break-even cash flow while the Company continued its development at depth.<br />
After reviewing various mining scenarios, the Company concluded that mining would likely continue at high costs given the lack of grade<br />
continuity, with insufficient operating margin to justify continuing operations. The Company has therefore ceased mining operations at<br />
Sleeping Giant on January 17, 2012 and has restructured the gold division, resulting in a non-cash impairment charge on its gold assets of<br />
$49.2 million.<br />
Sleeping Giant Mill<br />
For the year ended December 31, 2011, the mill processed 74,154 tonnes of ore, producing 14,623 ounces of gold at an average gold head<br />
grade of 6.36 grams per tonne, with a gold recovery of 96.4% and mill availability of 98.9% (2010 – 93,296 tonnes processed, producing<br />
17,695 ounces at an average grade of 5.90 grams per tonne).<br />
Sleeping Giant’s cash cost per ounce1 was US$1,819 for the year ended December 31, 2011, compared to US$1,549 per ounce for the year<br />
ended December 31, 2010. Production costs per tonne of ore milled were $426 for the year ended December 31, 2011 (2010 – $305 per tonne).<br />
At December 31, 2011, the mill contained approximately 2,742 ounces of gold that was included in inventory and valued at net realizable<br />
value, as it had not been sold by the end of the period, including 1,224 ounces of gold processed from Vezza.<br />
The Sleeping Giant mill has a rated capacity of 900 tonnes per day and was operating at approximately 838 tonnes per operating day, for the<br />
year ended December 31, 2011. Despite the closure of the Sleeping Giant mine, the mill will continue to operate to process ore from the<br />
nearby Vezza mine that is expected to reach commercial production in the second quarter of 2012.<br />
In 2011, the Company invested $1.8 million to establish a platform for potential future expansion of the mill, which includes the detailed<br />
engineering work, the geotechnical tests, building and foundation designs, receiving the required construction permits, materials<br />
procurement, and refurbishing the rod mill and jaw crusher.<br />
1 Non-IFRS measure. Please refer to Non-IFRS Measures on pages 31-33.<br />
19<br />
2011 <strong>Annual</strong> <strong>Report</strong>
MANAGEMENT’S DISCUSSION AND ANALYSIS<br />
Vezza Gold Project<br />
In 2011, the Company made good progress in the development work at Vezza to establish the mine for production in 2012. During the fourth<br />
quarter, the Company commenced processing Vezza’s bulk sample at the Sleeping Giant mill, returning results that were within<br />
management’s expectations. For the year ended December 31, 2011, 8,832 tonnes of mineralization were hoisted from the underground mine<br />
for the bulk sample, producing 1,141 ounces of gold at an average gold grade of 4.46 grams per tonne. The Company expects commercial<br />
production to commence at Vezza with a mining rate of 750 tonnes per day at the beginning of the second quarter of 2012. Until the mine<br />
reaches commercial production, all costs associated with achievement of commercial production, net of preproduction revenue from gold<br />
sales, are capitalized. For the remainder of 2012, the Company forecasts Vezza will produce approximately 30,000 ounces of gold at a cash<br />
cost per ounce1 of approximately US$1,150.<br />
Production at Vezza will come from a blend of long hole and alimak mining methods. The Company has entered into a contract with Promec<br />
Mining Inc., a Val d’Or mining contractor, to provide the mining workforce at Vezza. The total workforce is expected to be in the range of<br />
150 people. Vezza’s ore will be trucked to the Sleeping Giant mill (approximately 85 kilometres away by paved road), which is expected to<br />
process an average head grade of 5.2 grams per tonne, with a gold recovery of 88%.<br />
In 2011, the Company invested $28.2 million to advance Vezza to production, and plans to invest an additional $17.0 million in 2012 to<br />
continue underground development of the mine and to increase production in 2013. The capital expenditures in 2012 consist of development<br />
work associated with the underground infrastructure (such as drifts and ore passes), drilling costs, as well as a new camp for the<br />
workforce, a backfill cement plant, rock conveyor and pump, and other required equipment.<br />
CONSOLIDATED FINANCIAL RESULTS<br />
General and administration<br />
The Company’s general and administration expenses for the year ended December 31, 2011 were $12.3 million, compared to $10.6 million, an<br />
increase of $1.7 million. The increase is due to additional administration costs from increased activities and staff at the Corporate head office.<br />
Exploration<br />
Exploration expenditures for the year ended December 31, 2011 were $16.7 million compared to $30.1 million in the prior year. The decrease<br />
reflects $9.2 million of exploration costs capitalized to the mine expansion for the year ended December 31, 2011, compared to $2.3 million in<br />
the prior year. Exploration expenditures are comprised as follows:<br />
<strong>Palladium</strong> operations<br />
2011 2010<br />
Ontario exploration projects* 9,833 13,998<br />
Gold operations<br />
Sleeping Giant mine property 3,638 3,437<br />
Other Quebec exploration projects** 5,441 11,768<br />
Exploration tax credits (2,350) (201)<br />
6,729 15,004<br />
Corporate and other 105 1,124<br />
Total exploration expenditures $ 16,667 $ 30,126<br />
* Ontario exploration projects are comprised of LDI exploration projects, including the Cowboy, Outlaw and Sheriff zones, West LDI, <strong>North</strong> VT Rim, and the Legris Lake<br />
option and Shebandowan.<br />
** Other Quebec exploration projects are comprised of the Vezza, Flordin, Discovery, Dormex, Montbray, Harricana, Cameron Shear, Laflamme, and Florence properties.<br />
On February 18, 2011, the Company completed a flow-through share offering of 2,667,000 flow-through common shares and is required to<br />
spend gross proceeds of $22.0 million on Canadian exploration expenses prior to December 31, 2012. For the year ended December 31, 2011,<br />
$22.0 million was spent, fulfilling the spending requirement.<br />
Interest and other costs (income)<br />
Interest and other income for the year ended December 31, 2011 was $0.2 million compared to $2.1 million in the prior year. 2011 includes a<br />
gain on renouncement of flow-through expenditures of $1.8 million and $1.0 million of interest income, partially offset by financing costs of<br />
$0.7 million, accretion expense of $0.8 million and other items of $1.0 million. The prior year balance includes interest income of $2.9 million,<br />
partially offset by accretion expense of $0.2 million and interest expense of $0.4 million.<br />
1 Non-IFRS measure. Please refer to Non-IFRS Measures on pages 31-33.<br />
20<br />
2011 <strong>Annual</strong> <strong>Report</strong>
MANAGEMENT’S DISCUSSION AND ANALYSIS<br />
Income and Mining Tax Expense (Recovery)<br />
The income and mining tax expense (recovery) for the years ended December 31 are provided in the table below.<br />
2011 2010<br />
LDI palladium mine<br />
Ontario transitional tax (debit) credit $ 2,387 $ (280)<br />
Corporate minimum tax credit – (75)<br />
Ontario resource allowance recovery – (315)<br />
$ 2,387 $ (670)<br />
Sleeping Giant gold mine and Vezza Gold Project<br />
Quebec mining duties (expense) recovery $ (1,775) $ (246)<br />
Quebec income tax recovery (107) (26)<br />
Mining interests temporary difference expense 3,057 372<br />
$ 1,175 $ 100<br />
Corporate and other<br />
Expiration of warrants $ (555) $ (542)<br />
$ (555) $ (542)<br />
$ 3,007 $ (1,112)<br />
For the year ended December 31, 2011, income and mining tax expense was $3.0 million compared to a $1.1 million recovery in the same<br />
period in 2010. In the current year, income and mining tax expense includes Ontario transitional tax debits ($2.4 million) and mining interest<br />
temporary differences ($3.1 million), partially offset by Quebec mining duties recovery ($1.8 million) and the tax recovery on the expiration of<br />
Series B warrants ($0.6 million). The prior year recovery includes the expiration of warrants ($0.5 million), Ontario resource allowance<br />
recovery ($0.3 million) and Ontario transitional tax credit ($0.3 million), partially offset by mining interest temporary differences ($0.4 million).<br />
Net Income (Loss)<br />
For the year ended December 31, 2011, the Company reported a net loss of $65.2 million or $0.40 per share compared to net income of<br />
$29.4 million or $0.21 per share in the prior year.<br />
Summary of Quarterly Results<br />
(expressed in thousands of Canadian dollars<br />
except per share amounts) 2011 2010<br />
Q4 Q3 Q2 Q1 Q4 Q3 Q2 Q1<br />
Revenue $ 44,050 $ 38,310 $ 51,398 $ 36,714 $ 39,502 $ 38,451 $ 21,215 $ 7,930<br />
Production costs 33,120 28,928 28,783 30,427 21,556 20,452 16,650 16,051<br />
Gold assets<br />
impairment charge 49,210 – – – – – – –<br />
Exploration expense 4,738 1,956 6,134 3,839 12,532 7,008 6,421 4,165<br />
Capital expenditures 52,565 50,561 41,363 41,144 20,142 14,589 10,146 4,487<br />
Net income (loss) (57,397) (2,816) 5,380 (10,321) (2,013) 2,804 (11,849) (18,351)<br />
Cash provided by<br />
(used in) operations (25,557) 15,883 4,121 24,647 (25,196) (20,007) (18,389) (10,158)<br />
Net income (loss) per<br />
share – basic<br />
and diluted $ (0.35) $ (0.02) $ 0.03 $ (0.06) $ (0.01) $ 0.02 $ (0.08) $ (0.14)<br />
Cash provided by<br />
(used in) operations<br />
prior to changes in<br />
non-cash working<br />
capital per share 1 (0.01) 0.02 0.07 (0.04) 0.02 0.04 (0.04) (0.10)<br />
1 Non-IFRS measure. Please refer to Non-IFRS Measures on pages 31-33.<br />
21<br />
2011 <strong>Annual</strong> <strong>Report</strong>
MANAGEMENT’S DISCUSSION AND ANALYSIS<br />
Revenue for the three months ended December 31, 2011 was $44.1 million compared to $39.5 million for the three months ended December 31,<br />
2010. Net loss for the quarter, including a non-cash asset impairment charge of $49.2 million was $57.4 million or $0.35 per share compared<br />
to a net loss of $2.0 million or $0.01 per share in the comparative period in 2010.<br />
For the three months ended December 31, 2011, the Company expensed $4.7 million in exploration activities compared to $12.5 million in 2010<br />
and $52.6 million in development expenditures ($44.4 million at its palladium operations and $8.2 million at its gold operations). For the three<br />
months ended December 31, 2011, the Company used cash in operations, before changes in non-cash working capital of $1.6 million<br />
compared to cash used in operations, before changes in non-cash working capital of $0.2 million for the same period in 2010. For the three<br />
months ended December 31, 2011, financing activities provided cash of $71.0 million, primarily consisting of $69.7 million related to the<br />
issuance of senior secured notes, compared to cash provided by financing activities in 2010 of $6.5 million. Investing activities required cash<br />
of $51.9 million for the three months ended December 31, 2011 compared to $19.8 million required for investing activities in the comparative<br />
period in 2010.<br />
The LDI mine produced 34,121 ounces of payable palladium for the three months ended December 31, 2011 compared to 32,798 ounces of<br />
payable palladium for the comparative period in 2010. During the quarter, 591,096 tonnes of ore were mined with 531,825 tonnes of ore<br />
processed by the LDI mill (2010 – 210,732 tonnes mined, 247,739 tonnes processed by the mill). For the three months ended December 31,<br />
2011, LDI’s cash cost per ounce1 was US$489 (2010 – US$347).<br />
The Sleeping Giant mine produced 3,127 ounces of gold for the three months ended December 31, 2011 compared to 4,716 ounces of gold for<br />
the comparative period in 2010. During the quarter, 16,493 tonnes of ore were hoisted from Sleeping Giant, with 16,493 tonnes processed by<br />
the mill. For the comparative period in 2010, 22,185 tonnes were hoisted, with 21,750 tonnes processed by the mill. For the three months<br />
ended December 31, 2011, Sleeping Giant’s cash cost per ounce1 was US$1,769 (2010 – US$1,690).<br />
FINANCIAL CONDITION, CASH FLOWS, LIQUIDITY AND CAPITAL RESOURCES<br />
Sources and Uses of Cash<br />
2011 2010<br />
Cash provided by (used in) operations prior to changes in non-cash working capital $ 6,122 $ (12,029)<br />
Changes in non-cash working capital 12,972 (61,721)<br />
Cash provided by (used in) operations 19,094 (73,750)<br />
Cash provided by (used in) financing 140,382 99,211<br />
Cash provided by (used in) investing (183,700) (48,557)<br />
Increase (decrease) in cash and cash equivalents $ (24,224) $ (23,096)<br />
Operating Activities<br />
For the year ended December 31, 2011, cash provided by operations prior to changes in non-cash working capital was $6.1 million,<br />
compared to cash used in operations of $12.0 million in the prior year, an increase of $18.1 million. This increase is primarily due to higher<br />
revenue ($63.4 million), partially offset by higher production costs ($46.5 million).<br />
For the year ended December 31, 2011, changes in non-cash working capital resulted in a source of cash of $13.0 million compared to a use<br />
of cash of $61.7 million in the prior year. The 2011 balance of $13.0 million is primarily due to a decrease in accounts receivable ($7.6 million),<br />
a decrease in inventories ($7.4 million) and an increase in other assets ($3.5 million).<br />
Financing Activities<br />
For the year ended December 31, 2011, financing activities provided cash of $140.4 million consisting of $61.9 million related to the exercise<br />
of warrants and issuance of flow-through common shares, $69.7 million related to the issuance of senior secured notes and $10.5 million of<br />
letters of credit in replacement of mine closure deposits, partially offset by net scheduled repayments and additions of $1.6 million of<br />
finance leases. This compared to cash provided by financing activities of $99.2 million in the prior year primarily related to net proceeds of<br />
$94.2 million received from the April 2010 equity offering discussed below.<br />
1 Non-IFRS measure. Please refer to Non-IFRS Measures on pages 31-33.<br />
22<br />
2011 <strong>Annual</strong> <strong>Report</strong>
MANAGEMENT’S DISCUSSION AND ANALYSIS<br />
In October 2009, as part of an equity offering, the Company issued warrants (Series A warrants) to purchase an additional common share at<br />
a price of $4.25 per share, at any time prior to September 30, 2011. Since the 20-day volume weighted average price of the common shares<br />
on the TSX was equal to or greater than C$5.75 per share (as per the acceleration event in the warrant indenture), on December 8, 2010<br />
the Company announced the acceleration of the expiry of the Series A warrants to January 14, 2011. During the first quarter of 2011,<br />
$21.3 million of proceeds were received from the exercise of 5,009,986 Series A warrants. Total proceeds of $38.8 million were received<br />
from the exercise of Series A warrants.<br />
On April 28, 2010, the Company completed an equity offering of 20 million units at a price of $5.00 per unit for total net proceeds of<br />
$94.2 million (issue costs $5.8 million). Each unit consisted of one common share and one-half of one common share purchase warrant<br />
of the Company. Each whole warrant (Series B warrants) entitled the holder to purchase an additional common share at a price of $6.50,<br />
subject to adjustment, at any time prior to October 28, 2011. In 2010, 1,240,000 Series B warrants were exercised for total proceeds of<br />
$8.1 million. On October 28, 2011, the remaining Series B warrants expired.<br />
Investing Activities<br />
For the year ended December 31, 2011, investing activities required cash of $183.7 million, relating to additions to mining interests of<br />
$185.6 million and the Company received proceeds on disposal of equipment of $1.9 million. For the year ended December 31, 2010, investing<br />
activities required cash of $49.4 million, relating to additions to mining interests and the Company received proceeds on disposal of<br />
equipment of $0.8 million. The majority of the additions to mining interests were attributable to LDI’s mine expansion project, the Vezza gold<br />
project and the Sleeping Giant gold mine.<br />
Additions to mining interests<br />
2011 2010<br />
<strong>Palladium</strong> operations<br />
Offset Zone development $ 131,322 $ 23,689<br />
Roby Zone development 316 2,573<br />
Offset Zone exploration costs 9,216 2,334<br />
Roby Zone exploration costs 45 828<br />
Offset Zone capitalized interest 1,573 –<br />
Jaw crusher – 1,124<br />
Mill flotation redesign – 798<br />
Tailings management facility 821 642<br />
Other equipment and betterments 5,016 3,744<br />
$ 148,309 $ 35,732<br />
Gold operations<br />
Vezza project $ 28,230 $ 3,633<br />
Sleeping Giant Shaft deepening 4,829 5,999<br />
Sleeping Giant Mill expansion 1,831 –<br />
Sleeping Giant Underground and deferred development 2,058 3,006<br />
Other equipment and betterments 376 994<br />
$ 37,324 $ 13,632<br />
$ 185,633 $ 49,364<br />
In addition to the mining interests acquired by cash reflected in the above table, the Company also acquired by means of finance leases,<br />
equipment in the amount of $3.7 million for the year ended December 31, 2011 (2010 – $3.0 million).<br />
23<br />
2011 <strong>Annual</strong> <strong>Report</strong>
MANAGEMENT’S DISCUSSION AND ANALYSIS<br />
Capital Resources<br />
As at December 31, 2011, the Company had cash and cash equivalents of $50.9 million compared to $75.2 million as at December 31, 2010.<br />
The funds are invested in short term interest bearing deposits at a major Canadian chartered bank.<br />
In July 2011, the Company increased its operating line of credit with a Canadian chartered bank from US$30.0 million to US$60.0 million. The<br />
credit facility is secured by the Company’s accounts receivables and inventory and may be used for working capital liquidity and general<br />
corporate purposes. At December 31, 2011, the Company had US$48.0 million available to be drawn from the credit facility and US$12.0<br />
million was utilized for letters of credit primarily for reclamation deposits.<br />
During the fourth quarter of 2011, the Company sold $72.0 million of senior secured notes by way of a private placement for net proceeds of<br />
$69.6 million. The notes which mature on October 4, 2014, were issued in $1,000 denominations and bear interest at a rate of 9.25% per year,<br />
payable semi-annually. The Company also issued a palladium warrant with each $1,000 note. Each warrant held by the note holder entitles<br />
the holder to purchase 0.35 ounces of palladium at a purchase price of US$620 per ounce, anytime up to October 4, 2014. If the palladium<br />
warrants are exercised, the Company has the option to pay the amount owing to the warrant holder in either cash or common shares priced<br />
at a 7% discount. At the Company’s option, for a 2% fee, the maturity of the notes may be extended for one additional year to October 4, 2015.<br />
Subsequent to year end, the Company established a $15.0 million capital lease facility to fund equipment for the LDI mine expansion, of<br />
which $11.1 million has been utilized.<br />
Contractual Obligations<br />
As at December 31, 2011<br />
(expressed in thousands of Canadian dollars)<br />
Payments Due by Period<br />
Less than<br />
Total 1 year 2–5 Years > 5 years<br />
Finance lease obligations $ 4,905 $ 2,677 $ 2,228 –<br />
Operating leases 6,894 3,783 2,918 193<br />
Purchase obligations 110,612 110,612 – –<br />
$ 122,411 $ 117,072 $ 5,146 $ 193<br />
In addition to the above, the Company also has asset retirement obligations at December 31, 2011 in the amount of $20.9 million that<br />
would become payable at the time of the closures of the LDI mine, Sleeping Giant mill and Vezza gold project. The Company obtained a<br />
letter of credit of $10.6 million to offset these future outlays. As a result, $10.3 million of funding is required prior to or upon closure of<br />
these properties.<br />
Related Party Transactions<br />
There were no related party transactions for the year ended December 31, 2011.<br />
OUTSTANDING SHARE DATA<br />
As of February 22, 2012, there were 162,960,939 common shares of the Company outstanding. In addition, there were options outstanding<br />
pursuant to the Amended and Restated 2010 Corporate Stock Option Plan entitling holders thereof to acquire 5,331,583 common shares of<br />
the Company at a weighted average exercise price of $3.91 per share.<br />
OVERVIEW OF NAP’S EXPLORATION PROPERTIES<br />
NAP expected its future growth will come from its significant exploration upside and through the continued exploration and development of<br />
the Company’s projects. With permits, mine infrastructure and available capacity at LDI, NAP can move from exploration success to<br />
production on an accelerated timeline. Excluding the significant exploration program at LDI, the Company’s 2012 exploration budget includes<br />
approximately 6,000 metres of drilling at NAP’s other Ontario properties near LDI.<br />
With respect to the Company’s pipeline of non-producing gold properties, there will be minimal expenditures in 2012 and the Company will<br />
seek to realize value through either sale or joint venture opportunities.<br />
24<br />
2011 <strong>Annual</strong> <strong>Report</strong>
MANAGEMENT’S DISCUSSION AND ANALYSIS<br />
LDI Mine & Property<br />
Exploration is central to LDI’s future and will represent an important part of future growth for the mine and for the Company. Situated in<br />
unique geology, LDI’s substantial +33,000-acre land package offers exploration upside that is further complimented by the underutilized,<br />
15,000-tonne per day mill. Beyond the immediate mine site, most of the land has had minimal historic exploration. The exploration success<br />
achieved during the past few years gives management great encouragement that there is strong potential to continue to grow the<br />
Company’s palladium reserve and resource base through exploration.<br />
The LDI mine consists of the following underground mineralized zones:<br />
• Roby Zone: underground production from Roby commenced in 2006.<br />
• Offset Zone: discovered in 2001, located below and approximately 250 metres southwest of the Roby Zone. The Offset Zone remains open<br />
in all directions and continues to expand through exploration. LDI mine expansion is currently underway to access Offset Zone ore.<br />
• Cowboy Zone*: discovered in 2009 during infill drilling of the Offset Zone, located 30 to 60 metres to the west of the Offset Zone. This<br />
new discovery has the potential to extend LDI’s mine life and could potentially positively impact the economics of the mine.<br />
• Outlaw Zone*: discovered in 2009, located to the west of the Offset Zone and the Cowboy Zone. Further drilling is required to explore<br />
the vertical and lateral limit of this mineralization.<br />
• Sheriff Zone*: discovered in 2010, located approximately 100 metres southeast of the Offset Zone.<br />
* The disclosure regarding these mineralized areas is conceptual in nature and there has been insufficient exploration to define a mineral resource in any of these areas.<br />
The current LDI mine plan does not include the three nearby underground mineralized zones due to insufficient drilling: Cowboy, Outlaw<br />
and Sheriff.<br />
In 2011, 261 holes totalling 84,686 metres were drilled on the LDI property. Underground drilling accounted for 41,343 metres (205 holes), of<br />
which approximately 13,290 metres (66 holes) were to support mine operations. Drilling from surface accounted for the remaining 43,343<br />
metres (56 holes). The objective of NAP’s 2011 exploration program was to expand the Offset Zone, improve knowledge of the Offset Zone<br />
mineralization through infill drilling, and to identify potential surface targets.<br />
On January 30, 2012 the Company provided an update on the remaining drill results from its 2011 exploration program at LDI. Previous<br />
exploration updates on the 2011 program were issued by news release on June 28, 2011 and September 14, 2011.<br />
The highlights from the recent update included:<br />
• Infill drill results in the Offset Zone returned excellent grades, with good width and continuity, including 78 metres at 7.39 grams per<br />
tonne <strong>Palladium</strong> (“g/t Pd”) and 33 metres at 8.71 g/t Pd;<br />
• Good indication of a southern extension to the Offset Zone in an area previously reported as the Southern Norite Zone, including<br />
39 metres at 4.02 g/t Pd and 15 metres at 5.13 g/t Pd;<br />
• Mineralization discovered 300 metres to the west of the Offset, Cowboy and Outlaw zones, including 10 metres of 3.05 g/t Pd, giving<br />
support to the interpretation that some mineralized zones manifest as a series of parallel stacked lenses;<br />
• Confirmed north and south lateral extensions of upper Roby Zone, including 18 metres at 12.82 g/t Pd; and<br />
• Bonanza grade surface mineralization encountered from trenches along the <strong>North</strong> VT Rim 500 metres northeast of the LDI open pit,<br />
including approximately 1 metre samples at 64.4 g/t Pd and 45.8 g/t Pd.<br />
The Company intends to issue its updated mineral reserves and resource estimates for LDI (as at December 31, 2011) in the second quarter<br />
of 2012.<br />
Following the exploration success achieved in the past few years, NAP will continue to invest in exploration to expand the reserves and<br />
resources at LDI and to identify new targets. 2012 exploration expenditures are expected to be approximately $16 million, comprised of<br />
70,000 metres of drilling, of which 64,000 metres will be at LDI, and 6,000 metres at NAP’s other nearby properties. Approximately $10 million<br />
of the $16 million in expenditures (55,000 of the 64,000 metres to be drilled at LDI) is in connection with the mine expansion and is included in<br />
the $116 million capital expenditure budget for the mine expansion, leaving a balance of $6 million that will be expensed.<br />
25<br />
2011 <strong>Annual</strong> <strong>Report</strong>
MANAGEMENT’S DISCUSSION AND ANALYSIS<br />
Quebec Properties<br />
Sleeping Giant Gold Mine & Property<br />
In 2011, 116 drill holes were completed at Sleeping Giant, totalling 36,746 metres. The primary objective of the 2011 exploration program at<br />
Sleeping Giant was to define and extend zones within the current mine on the proposed three new mining levels at depth to allow future<br />
mine development planning. Drill results from the 2011 program indicated that Sleeping Giant’s gold zones continue to extend at depth<br />
however as more infill drilling was conducted the Company encountered a lack of continuity in the narrow vein structures and was unable<br />
to confirm those grades over sufficient strike length, thereby significantly reducing the tonnage that could be mined profitably.<br />
Vezza Gold Mine<br />
In 2011, 29 surface holes were completed at Vezza (totalling 6,258 metres) and 161 holes from underground (totalling 17,933 metres) for a<br />
combined total of 79,434 metres in 376 holes.<br />
Exploration drilling conducted in 2011 confirmed grades, continuity and widths of Vezza’s known gold zone, which are similar or better than<br />
the last resource estimate (dated December 31, 2010). The widths and near vertical nature of the gold zone also confirmed that either alimak<br />
or long hole mining methods could be used at the Vezza mine.<br />
Flordin Property<br />
The Flordin project is located approximately 30 kilometres north of the town of Lebel-sur-Quévillon, and approximately 70 kilometres away<br />
from the Sleeping Giant mill. The Company conducted a significant drilling program in 2010, consisting of 212 holes totalling 25,720 metres,<br />
which revealed the presence of several parallel gold veins near surface. The Company believes that the Flordin gold project may have the<br />
potential to provide additional feed for the Sleeping Giant mill.<br />
In 2011, the Company hired an independent consulting firm to conduct ore sorting tests on Flordin’s mineralized zones and waste rocks to<br />
evaluate potential pre-concentration of ore before trucking it to the Sleeping Giant mill. Preliminary results indicate that pre-concentration<br />
can reject in the order of 50% low-grade rock in run-of-mine material, reducing transport costs and increasing head grade. This technology<br />
could increase the mill feed head grade and offer significant cost savings with important implications for overall gold production costs in an<br />
eventual mining operation. A second phase of ore sorting test work involved two different sorting techniques to evaluate efficiency: optical<br />
and x-ray. The x-ray technique, which proved to offer more advantages, is currently being considered by NAP.<br />
In 2011, the Company conducted a drill program consisting of 36 holes totalling 4,857 metres at Flordin.<br />
Discovery Property<br />
Discovery is an advanced-stage gold exploration project located approximately 35 kilometres northwest of the town of Lebel-sur-Quévillon,<br />
and approximately 70 kilometres from the Sleeping Giant mill. The Discovery project is contiguous to the Flordin project. A 2008 scoping<br />
study confirmed the project to be economically feasible and generate positive cash flow under certain assumptions, with potential to<br />
produce 44,000 ounces of gold per year for four years.<br />
In 2011, the Company conducted a drill program consisting of 18 holes totalling 7,438 metres on the project, targeting the extension of the<br />
1200E Zone. The 1200E zone was not considered in the 2008 Scoping Study, which considered the west gold zones only. Drilling the eastern<br />
extension of the 1200E zone revealed new gold zones at depth and followed known zones deeper, eastward and westward. In 2011 the<br />
Company received the Certificate of Authorization from Quebec’s Ministry of Sustainable Development, Environment and Parks to conduct<br />
underground exploration as planned in the 2008 Scoping Study.<br />
Dormex Property<br />
Dormex is an early-stage gold exploration project located adjacent to the Sleeping Giant mill and is believed to have potential gold targets<br />
similar to the original mineralization mined at the Sleeping Giant mine. Exploration conducted in 2010 identified a series of promising targets<br />
and confirmed the presence of gold in the tills.<br />
In 2011, the Company conducted follow up on gold anomalies discovered in the 2010 reverse circulation program and tested new<br />
geophysical targets. The drill program consisted of 10 holes totalling 4,060 metres of drilling.<br />
Cameron Shear and Florence Properties<br />
Cameron Shear and Florence are early-stage gold exploration projects adjacent to the east of the Discovery gold deposit, and near the<br />
Flordin deposit. Drilling on a number of geophysical targets has improved the Company’s understanding of the geology of these early-stage<br />
properties, although economic intersections have not yet been encountered at this juncture.<br />
Laflamme Gold Property<br />
Laflamme is an early-stage gold exploration project in the Abitibi region of Quebec, a joint venture with Midland Exploration Inc. (“Midland”).<br />
The property is situated on favourable geology, following the trend from the Company’s Discovery project to the Sleeping Giant mine.<br />
In 2011, the Company conducted a drill program consisting of 6 holes totalling 2,142 metres of drilling and ground geophysics at Laflamme.<br />
On June 15, 2011, Midland announced the discovery of an unanticipated new mineralized zone with nickel, copper and platinum group<br />
elements. On July 31, 2011, the Company fulfilled the requirements to exercise the option to acquire a 50% interest in the project and has<br />
exercised this option. The Company is the Operator of the joint venture and may acquire an additional 15% interest by completing a<br />
feasibility study.<br />
26<br />
2011 <strong>Annual</strong> <strong>Report</strong>
MANAGEMENT’S DISCUSSION AND ANALYSIS<br />
Ontario Properties<br />
Shebandowan Property<br />
The Company holds a 50% interest in the former producing Shebandowan mine and the surrounding Haines and Conacher properties<br />
pursuant to an Option and Joint Venture Agreement with Vale Inco Limited (“Vale”). The properties, known as the Shebandowan property,<br />
contain a series of nickel copper-PGM mineralized bodies. The land package, which totals approximately 7,842 hectares, is located 90<br />
kilometres west of Thunder Bay, Ontario, and approximately 100 kilometres southwest from the Company’s LDI mine. Vale retains an option<br />
to increase its interest from 50% to 60%, exercisable in the event that a feasibility study on the property results in a mineral reserve and<br />
mineral resource estimate of the equivalent of 200 million pounds of nickel and other metals.<br />
In 2010, the Company and Vale conducted a large ground geophysical survey on the property. Preliminary results support further exploration<br />
work on the property, but subsequent drilling on a portion of the property proved disappointing. No work was undertaken in 2011, and<br />
nothing is planned for 2012.<br />
Legris Lake Property<br />
The Legris Lake property is adjacent to the south east portion of the Company’s LDI property and is comprised of 15 claims and covering an<br />
area of approximately 4,297 hectares. The property is underlain by mafic and ultramafic rocks and was optioned for its historic anomalous<br />
PGE values. The property is at a preliminary exploration stage, however its PGM potential and close proximity to the LDI mill presents an<br />
encouraging exploration target.<br />
Moose Calf and Kukkee Properties<br />
In 2010, the Company entered into option agreements for the Moose Calf and Kukkee gold properties located west of Thunder Bay near<br />
McGraw Falls. The combined properties are now referred to as the Shabaqua Gold Project.<br />
Salmi Property<br />
On August 1, 2011, LDI entered into an option and purchase agreement whereby LDI obtained the exclusive right to conduct exploration and<br />
development activities as well as an exclusive right and option to purchase a 100% undivided interest in all or part of the property known as<br />
the Salmi property, comprised of eleven mineral claims located near the LDI mine and one additional adjacent mineral claim. The option and<br />
purchase agreement is subject to a 2% net smelter return royalty on future production from the property with LDI having the right to buy<br />
back one half of the net smelter return royalty for $0.5 million.<br />
Tib Lake Property<br />
On December 21, 2011, LDI entered into a letter of intent with Houston Lake Mining Inc. regarding the intention of the parties to enter into an<br />
option and purchase agreement where LDI would have an option to purchase a 100% unencumbered interest in 20 claims located northwest<br />
of the Lac des Iles mine, known as the Tib Lake property, subject to a 2.5% net smelter royalty in favour of a third party on a portion of the<br />
optional ground.<br />
CRITICAL ACCOUNTING POLICIES AND ESTIMATES<br />
Critical accounting policies generally include estimates that are highly uncertain and for which changes in those estimates could materially<br />
impact the Company’s financial statements. The following accounting policies are considered critical:<br />
a. Use of estimates<br />
The preparation of the consolidated financial statements in conformity with IFRS requires management to make judgments, estimates,<br />
and assumptions that affect the application of accounting policies and the reported amount of assets and liabilities, the disclosure of<br />
contingent assets and liabilities at the date of the financial statements and the reported amounts of revenue and expenses during the<br />
year. Significant estimates and assumptions relate to recoverability of mining operations and mineral exploration properties. While<br />
management believes that these estimates and assumptions are reasonable, actual results could vary significantly.<br />
Certain assumptions are dependent upon reserves, which represent the estimated amount of ore that can be economically and legally<br />
extracted from the Company’s properties. In order to estimate reserves, assumptions are required about a range of geological, technical<br />
and economic factors, including quantities, grades, production techniques, recovery rates, production costs, transportation costs,<br />
commodity demand, commodity prices and exchange rates. Estimating the quantity and/or grade of reserves requires the size, shape<br />
and depth of ore bodies to be determined by analyzing geological data such as drilling samples. This process may require complex and<br />
difficult geological judgments to interpret the data. Estimates and underlying assumptions are reviewed on an ongoing basis. Revisions<br />
to accounting estimates are recognized in the period in which the estimates are revised and in any future periods affected.<br />
Because the economic assumptions used to estimate reserves change from period to period, and because additional geological data<br />
is generated during the course of operations, estimates of reserves may change from period to period. Changes in reported reserves<br />
may affect the Company’s financial results and financial position in a number of ways, including the following:<br />
• Asset carrying values may be affected due to changes in estimated future cash flows;<br />
• Depreciation and amortization expensed in the income statement may change where such expenses are determined by the units<br />
of production basis, or where the useful economic lives of assets change;<br />
• Overburden removal costs recorded on the balance sheet or charged to the statements of operations and comprehensive income<br />
may change due to changes in the units of production basis of depreciation and amortization;<br />
• Decommissioning, site restoration and environmental provisions may change where changes in estimated reserves affect<br />
expectations about the timing or cost of these activities; and<br />
• The carrying value of deferred tax assets may change due to changes in estimates of the likely recovery of the tax benefits.<br />
27<br />
2011 <strong>Annual</strong> <strong>Report</strong>
MANAGEMENT’S DISCUSSION AND ANALYSIS<br />
b. Impairment assessments of long-lived assets<br />
The carrying amounts of the Company’s non-financial assets, other than investment property, inventories and deferred tax assets, are<br />
reviewed at each reporting date to determine whether there is any indication of impairment. Impairment is assessed at the level of<br />
cash-generating units (“CGUs”). An impairment loss is recognized in the Consolidated Statements of Operations and Comprehensive<br />
Income (Loss) for any excess of carrying amount over the recoverable amount.<br />
Impairment is determined for an individual asset unless the asset does not generate cash inflows that are independent of those<br />
generated from other assets or groups of assets, in which case, the individual assets are grouped together into CGUs for impairment<br />
purposes.<br />
The recoverable amount of an asset or cash-generating unit is the greater of its “value in use” and its “fair value less costs to sell”. In<br />
assessing value in use, the estimated future cash flows are discounted to their present value using a pre-tax discount rate that reflects<br />
current market assessments of the time value of money and the risks specific to the asset.<br />
An impairment loss is recognized in the Consolidated Statements of Operations and Comprehensive Income (Loss) if the carrying<br />
amount of an asset or its CGU exceeds its estimated recoverable amount.<br />
Impairment losses recognized in prior periods are assessed at each reporting date for any indications that the loss has decreased or<br />
no longer exists. An impairment loss on non-financial assets other than goodwill is reversed if there has been a change in the<br />
estimates used to determine the recoverable amount, only to the extent that the asset’s carrying amount does not exceed the carrying<br />
amount that would have been determined, net of amortization, if no impairment loss had been recognized.<br />
c. Depreciation and amortization of mining interests<br />
Mining interests relating to plant and equipment, mining leases and claims, royalty interests, and other development costs are<br />
recorded at cost with depreciation and amortization provided on the unit-of-production method over the estimated remaining ounces<br />
of palladium (LDI) and gold (NAP Quebec) to be produced based on the proven and probable reserves.<br />
Mining interests relating to small vehicles and certain machinery with a determinable expected life are recorded at cost with<br />
depreciation provided on a straight-line basis over their estimated useful lives, ranging from three to seven years, which most closely<br />
reflects the expected pattern of consumption of the future economic benefits embodied in the asset. Straight-line depreciation is<br />
calculated over the depreciable amount, which is the cost of an asset, less its residual value.<br />
Significant components of individual assets are assessed and if a component has a useful life that is different from the remainder of<br />
that asset, that component is depreciated separately using the unit-of-production or straight-line method as appropriate. Costs relating<br />
to value beyond proven and probable reserves (“VBPP”) and land are not amortized.<br />
Leased assets are depreciated over the shorter of the lease term and their useful lives unless it is reasonably certain that the Company<br />
will obtain ownership by the end of the lease term.<br />
Depreciation methods, useful lives and residual values are reviewed at each financial year-end and adjusted if appropriate.<br />
d. Revenue recognition<br />
Revenue from the sale of metals in the course of ordinary activities is measured at the fair value of the consideration received or<br />
receivable, net of volume adjustments. Revenue is recognized when persuasive evidence exists, usually in the form of an executed<br />
sales agreement, that the significant risks and rewards of ownership have been transferred to the buyer, recovery of the consideration<br />
is probable, the associated costs and possible return of goods can be estimated reliably, there is no continuing management<br />
involvement with the goods, and the amount of revenue can be measured reliably. The timing of the transfers of risks and rewards<br />
varies depending on the individual terms of the contract of sale.<br />
Revenue from the sale of palladium and by-product metals from the LDI mine is provisionally recognized net of royalties based on<br />
quoted market prices upon the delivery of concentrate to the smelter or designated shipping point, which is when title transfers and<br />
significant rights and obligations of ownership pass. The Company’s smelter contract provides for final prices to be determined by<br />
quoted market prices in a period subsequent to the date of concentrate delivery. Variations from the provisionally priced sales are<br />
recognized as revenue adjustments until final pricing is determined. Accounts receivable are recorded net of estimated treatment and<br />
refining costs, which are subject to final assay adjustments. Subsequent adjustments to provisional pricing amounts due to changes in<br />
metal prices and foreign exchange, are reflected separately from initial revenues on the consolidated statements of operations and<br />
comprehensive loss.<br />
Revenue from the sale of gold-silver doré bars from Sleeping Giant is recognized when the significant risks and rewards of ownership<br />
have transferred to the buyer and selling prices are known or can be reasonably estimated.<br />
28<br />
2011 <strong>Annual</strong> <strong>Report</strong>
MANAGEMENT’S DISCUSSION AND ANALYSIS<br />
e. Asset retirement obligations<br />
In accordance with Company policies, asset retirement obligations relating to legal and constructive obligations for future site<br />
reclamation and closure of the Company’s mine sites are recognized when incurred and a liability and corresponding asset are<br />
recorded at fair value. Estimated closure and restoration costs are provided for in the accounting period when the obligation arising<br />
from the related disturbance occurs or provided for in the period the obligation is determined.<br />
The amount of any liability recognized is estimated based on the risk-adjusted costs required to settle present obligations, discounted<br />
using a pre-tax risk-free discount rate consistent with the time period of expected cash flows. When the liability is initially recorded, a<br />
corresponding asset retirement cost is recognized as an addition to mining interests and amortized using the unit of production method.<br />
The liability for each mine site is accreted over time to reflect the unwinding of the discount. The accretion charges are recognized as<br />
a finance cost in the Consolidated Statements of Operations and Comprehensive Income (Loss). The liability is subject to remeasurement<br />
at each reporting date based on changes in discount rates and timing or amounts of the costs to be incurred. Changes in<br />
the liability, other than accretion charges, relating to mine rehabilitation and restoration obligations are added to or deducted from the<br />
carrying value of the related asset retirement cost in the reporting period recognized. If the change results in a reduction of the<br />
obligation in excess of the carrying value of the related asset retirement cost, the excess balance is recognized as a recovery through<br />
profit or loss in the period.<br />
New Standards and Interpretations Not Yet Adopted<br />
The following new standards, amendments to standards and interpretations are not yet effective for the year ended December 31, 2011 or<br />
have otherwise not yet been adopted by the Company.<br />
IFRS 7 Financial Instruments: Disclosures<br />
The amendments to IFRS 7 require disclosure of information that enables users of financial statements to understand the relationship<br />
between transferred financial assets that are not derecognized in their entirety and the associated liabilities; and to evaluate the<br />
nature of, and risks associated with, the entity’s continuing involvement in derecognized financial assets. This update is effective for<br />
years beginning on or after January 1, 2012. Management is evaluating the impact, if any, the adoption of this amendment to IFRS 7 will<br />
have on the disclosures in its consolidated financial statements.<br />
IFRS 9 Financial Instruments: Classification and Measurement<br />
This is the first part of a new standard on classification and measurement of financial assets that will replace IAS 39, Financial<br />
Instruments: Recognition and Measurement. IFRS 9 has two measurement categories: amortized cost and fair value. All equity<br />
instruments are measured at fair value. A debt instrument is at amortized cost only if the entity is holding it to collect contractual cash<br />
flows and the cash flows represent principal and interest. Otherwise, it is at fair value through profit or loss. An update to IFRS 9<br />
includes guidance on financial liabilities and derecognition of financial instruments. This standard and the related update are effective<br />
for years beginning on or after January 1, 2015.<br />
The Company will evaluate the impact of the change to its consolidated financial statements based on the characteristics of its<br />
financial instruments at the time of adoption.<br />
IAS 1 Presentation of Financial Statements<br />
This standard is amended to change the disclosure of items presented in other comprehensive income (“OCI”), including a<br />
requirement to separate items presented in OCI into two groups based on whether or not they may be recycled to profit or loss in the<br />
future. The amendment is effective for reporting years beginning on or after July 1, 2012. This amendment is presently not expected to<br />
impact the consolidated financial statements of the Company.<br />
IAS 19 Employee Benefits<br />
The standard is amended to reflect significant changes to recognition and measurement of defined benefit pension expense and<br />
termination benefits, and provides expanded disclosure requirements. The amendment is effective for annual periods beginning on or<br />
after January 1, 2013. This amendment is presently not expected to impact the consolidated financial statements of the Company.<br />
IAS 32 Financial Instruments: Presentation<br />
This standard is amended to clarify requirements for offsetting of financial assets and financial liabilities. The amendment is effective<br />
for annual periods beginning on or after January 1, 2014. Management is evaluating the impact, if any, the adoption of this amendment<br />
to IFRS 7 will have on the disclosures in its consolidated financial statements.<br />
29<br />
2011 <strong>Annual</strong> <strong>Report</strong>
MANAGEMENT’S DISCUSSION AND ANALYSIS<br />
New Standards Addressing the Scope of a <strong>Report</strong>ing Entity<br />
The following IFRS standards are introduced and IAS standards amended accordingly:<br />
IFRS 10 Consolidated Financial Statements<br />
This standard replaces the guidance on control and consolidation in IAS 27, Consolidated and Separate Financial Statements, and<br />
SIC-12, Consolidation – Special Purpose Entities. IFRS 10 changes the definition of control under IFRS so that the same criteria are<br />
applied to all entities to determine control.<br />
IFRS 11 Joint Arrangements<br />
This standard replaces IAS 31, Interests in Joint Ventures. IFRS 11 reduces the types of joint arrangements to two: joint ventures<br />
and joint operations. IFRS 11 requires the use of equity accounting for interests in joint ventures, eliminating the existing policy<br />
choice of proportionate consolidation for jointly controlled entities under IAS 31. Entities that participate in joint operations will<br />
follow accounting much like that for jointly controlled assets and jointly controlled operations under IAS 31.<br />
IFRS 12 Disclosures of Interests in Other Entities<br />
This standard sets out the disclosure requirements for entities reporting under IFRS 10 and IFRS 11, and replaces the disclosure<br />
requirements currently found in IAS 28, Investments in Associates.<br />
IAS 27 Consolidated and Separate Financial Statements<br />
This standard is renamed “Separate Financial Statements” and deals solely with separate financial statements, the guidance for<br />
which remains unchanged.<br />
All above standards and amendments are effective for reporting years beginning on or after January 1, 2013.<br />
IFRS 13 Fair Value Measurement<br />
The new standard provides a single source of guidance on how to measure fair value where its use is already required or permitted by<br />
other IFRS and enhances disclosure requirements for information about fair value measurements. The standard is effective for<br />
reporting years beginning on or after January 1, 2013.<br />
IFRIC 20 – Stripping Costs in the Production Phase of a Surface Mine<br />
On October 20, 2011, the IASB issued a new interpretation, IFRIC 20, to address accounting issues regarding waste removal costs<br />
incurred in surface mining activities during the production phase of a mine, referred to as production stripping costs. The new<br />
interpretation addresses the classification and measurement of production stripping costs as either inventory or as a tangible or<br />
intangible non-current ’stripping activity asset’. The standard also provides guidance for the depreciation or amortization and<br />
impairment of such assets.<br />
IFRIC 20 is effective for reporting years beginning on or after January 1, 2013, although earlier application is permitted. The Company is<br />
assessing the impact, if any, the adoption of this standard may have on the consolidated financial statements of the Company.<br />
RISKS AND UNCERTAINTIES<br />
The risks and uncertainties are discussed within the Company’s most recent Form 40-F/<strong>Annual</strong> Information Form on file with the SEC and<br />
Canadian provincial securities regulatory authorities.<br />
INTERNAL CONTROLS<br />
Disclosure Controls and Procedures<br />
Management is responsible for the information disclosed in this management’s discussion and analysis and has in place the appropriate<br />
information systems, procedures and controls to ensure that information used internally by management and disclosed externally is, in all<br />
material respects, complete and reliable.<br />
For the year ended December 31, 2011, the President and Chief Executive Officer and Vice President, Finance and Chief Financial Officer<br />
certify that they have designed, or caused to be designed under their supervision, disclosure controls and procedures to provide reasonable<br />
assurance that material information relating to the Company and its consolidated subsidiaries would be made known to them by others<br />
within those entities.<br />
The disclosure controls and procedures are evaluated annually through regular internal reviews which are carried out under the<br />
supervision of, and with the participation of, the Company’s management, including the President and Chief Executive Officer and Vice<br />
President, Finance and Chief Financial Officer. Based on that evaluation, the Chief Executive Officer and Chief Financial Officer concluded<br />
that the design and operation of these disclosure controls were effective as of December 31, 2011.<br />
30<br />
2011 <strong>Annual</strong> <strong>Report</strong>
MANAGEMENT’S DISCUSSION AND ANALYSIS<br />
Internal Control Over Financial <strong>Report</strong>ing<br />
For the year ended December 31, 2011, the President and Chief Executive Officer, and the Vice President, Finance and Chief Financial Officer<br />
certify that they have designed, or caused to be designed under their supervision, internal controls over financial reporting to provide<br />
reasonable assurance regarding the reliability of financial reporting and the preparation of the financial statements for external purposes in<br />
accordance with IFRS.<br />
There have been no changes in the Company’s internal controls over the financial reporting that occurred during the most recent period<br />
ended December 31, 2011 that have materially affected or are reasonably likely to materially affect, the Company’s internal control over<br />
financial reporting.<br />
Management is responsible for establishing and maintaining adequate internal controls over financial reporting. Internal control over<br />
financial reporting, no matter how well designed, has inherent limitations and can only provide reasonable assurance, not absolute<br />
assurance, with respect to the preparation and fair presentation of published financial statements and management does not expect such<br />
controls will prevent or detect all misstatements due to error or fraud. The Company is continually evolving and enhancing its systems of<br />
controls and procedures.<br />
Under the supervision and with the participation of the President and Chief Executive Officer, and the Vice President, Finance and Chief<br />
Financial Officer, management performs regular internal reviews and conducts an annual evaluation of the effectiveness of its internal<br />
control over financial reporting based on the framework in Internal Control – Integrated Framework issued by the Committee of Sponsoring<br />
Organizations of the Treadway Commission. Based on that evaluation, the Chief Executive Officer and Chief Financial Officer concluded that<br />
the design and operation of these internal controls over financial reporting were effective as of December 31, 2011.<br />
OTHER INFORMATION<br />
Additional information regarding the Company is included in the Company’s <strong>Annual</strong> Information Form and <strong>Annual</strong> <strong>Report</strong> on Form 40-F, which<br />
are filed with the SEC and the provincial securities regulatory authorities, respectively. A copy of the Company’s <strong>Annual</strong> Information Form is<br />
posted on the SEDAR website at www.sedar.com. A copy of the <strong>Annual</strong> <strong>Report</strong> or Form 40-F can be obtained from the SEC’s website at<br />
www.sec.gov.<br />
NON-IFRS MEASURES<br />
This MD&A refers to cash used in operating activities per share and cash cost per ounce1 which are not recognized measures under IFRS.<br />
Such non-IFRS financial measures do not have any standardized meaning prescribed by IFRS and are therefore unlikely to be comparable to<br />
similar measures presented by other issuers. Management uses these measures internally. The use of these measures enables<br />
management to better assess performance trends. Management understands that a number of investors, and others who follow the<br />
Company’s performance, assess performance in this way. Management believes that these measures better reflect the Company’s<br />
performance and are better indications of its expected performance in future periods. This data is intended to provide additional information<br />
and should not be considered in isolation or as a substitute for measures of performance prepared in accordance with IFRS. The following<br />
tables reconcile these non-IFRS measures to the most directly comparable IFRS measures:<br />
Cash Provided by (Used in) Operations<br />
(a) Cash Provided by (Used in) Operations before changes in non-cash working capital<br />
The Company uses this measure as a valuable indicator of the Company’s ability to generate liquidity by producing operating cash flow to<br />
fund working capital needs, service debt obligations, and fund capital expenditures.<br />
(expressed in thousands of dollars except per ounce amounts) 2011 2010<br />
Net income (loss) and comprehensive income (loss) for the year $ (65,154) $ (29,409)<br />
Operating items not involving cash<br />
Depreciation and amortization 17,604 15,590<br />
Gold assets impairment charge 49,210 –<br />
Accretion expense 794 209<br />
Deferred income and mining tax expense (recovery) 1,214 (169)<br />
Share-based compensation and employee benefits 3,404 1,911<br />
Other (950) (161)<br />
Cash provided by (used in) operations before changes in non-cash working capital $ 6,122 $ (12,029)<br />
1 Non-IFRS measure. Please refer to Non-IFRS Measures on pages 31-33.<br />
31<br />
2011 <strong>Annual</strong> <strong>Report</strong>
MANAGEMENT’S DISCUSSION AND ANALYSIS<br />
(b) Cash Provided by (Used in) Operations before changes in non-cash working capital per share<br />
(expressed in thousands of dollars except per share amounts) 2011 2010<br />
Cash provided by (used in) operations prior to changes in non-cash working capital $ 6,122 $ (12,029)<br />
Weighted average number of shares outstanding – basic 162,011,253 141,537,377<br />
Cash provided by (used in) operations prior to changes in non-cash working capital per share $ 0.04 $ (0.08)<br />
Cash Cost Per Ounce<br />
Cash cost per ounce include mine site operating costs such as mining, processing, administration, and royalties, but are exclusive of<br />
depreciation, amortization, reclamation, capital, and exploration costs. Cash cost per ounce calculation is reduced by any by-product<br />
revenue and is then divided by ounces sold to arrive at the by-product cash cost per ounce of sales. This measure, along with revenues,<br />
is considered to be a key indicator of a company’s ability to generate operating earnings and cash flow from its mining operations.<br />
The Company uses this measure internally to evaluate the underlying operating performance of the Company for the reporting periods<br />
presented. The Company believes that providing cash cost per ounce allows the ability to better evaluate the results of the underlying<br />
business of the Company.<br />
(a) Reconciliation of <strong>Palladium</strong> Cash Cost per Ounce<br />
(expressed in thousands of dollars except per ounce amounts) 2011 2010<br />
Production costs including overhead $ 89,657 $ 40,266<br />
Smelting, refining and freight costs 9,206 4,721<br />
Royalty expense 5,819 4,202<br />
Total operating expenses 104,682 49,189<br />
Less by-product metal revenue 39,655 21,462<br />
$ 65,027 $ 27,727<br />
Divided by ounces of palladium sold 146,457 95,057<br />
Cash cost per ounce (CDN$) $ 444 $ 292<br />
Exchange rate (CDN$1 – US$) 1.01 0.97<br />
Cash cost per ounce (US$), net of by-product credits $ 448 $ 283<br />
(b) Reconciliation of Gold Cash Cost per Ounce<br />
(expressed in thousands of dollars except per ounce amounts) 2011 2010<br />
Production costs including overhead $ 31,601 $ 28,440<br />
Refining and freight costs 54 58<br />
Total operating expenses 31,655 28,498<br />
Less by-product metal revenue 1,010 473<br />
$ 30,645 $ 28,025<br />
Divided by ounces of gold sold 17,019 17,550<br />
Cash cost per ounce (CDN$) $ 1,801 $ 1,597<br />
Exchange rate (CDN$1 – US$) 1.01 0.97<br />
Cash cost per ounce (US$) $ 1,819 $ 1,549<br />
32<br />
2011 <strong>Annual</strong> <strong>Report</strong>
MANAGEMENT’S DISCUSSION AND ANALYSIS<br />
Adjusted Net Income (Loss)<br />
Adjusted net income (loss) is a non-IFRS financial measure, which excludes the following from net income (loss):<br />
• Exploration;<br />
• Mine startup costs;<br />
• Mine shutdown costs;<br />
• Asset impairment charges; and<br />
• Insurance recoveries.<br />
The Company uses this measure internally to evaluate the underlying operating performance of the Company for the reporting periods<br />
presented. The Company believes that providing adjusted net income (loss) allows the reader the ability to better evaluate the results of the<br />
underlying business of the Company.<br />
(expressed in thousands of dollars except per ounce amounts) 2011 2010<br />
Net income (loss) and comprehensive income (loss) for the year $ (65,154) $ (29,409)<br />
Exploration 16,667 30,126<br />
Gold assets impairment charge 49,210 –<br />
Mine startup costs – 6,003<br />
Adjusted net income $ 723 $ 6,720<br />
Adjusted EBITDA<br />
Adjusted EBITDA is a non-IFRS financial measure, which excludes the following from net income (loss):<br />
• Income and mining tax expense (recovery);<br />
• Interest and other financing costs (income);<br />
• Depreciation and amortization;<br />
• Exploration;<br />
• Mine startup costs;<br />
• Mine shutdown costs;<br />
• Asset impairment charges; and<br />
• Insurance recoveries.<br />
The Company believes that EBITDA is a valuable indicator of the Company’s ability to generate liquidity by producing operating cash flow to<br />
fund working capital needs, service debt obligations, and fund capital expenditures.<br />
EBITDA excludes the impact of the cost of financing activities and taxes, and the effects of changes in operating working capital balances,<br />
and therefore is not necessarily indicative of operating profit or cash flow from operations as determined under IFRS. Other companies may<br />
calculate EBITDA differently.<br />
(expressed in thousands of dollars except per ounce amounts) 2011 2010<br />
Net income (loss) and comprehensive income (loss) for the year $ (65,154) $ (29,409)<br />
Income and mining tax expense (recovery) 3,007 (1,112)<br />
Interest and other financing income (243) (2,142)<br />
Depreciation and amortization 17,604 15,590<br />
EBITDA (44,786) (17,073)<br />
Exploration 16,667 30,126<br />
Gold assets impairment charge 49,210 –<br />
Mine startup costs – 6,003<br />
Adjusted EBITDA $ 21,091 $ 19,056<br />
33<br />
2011 <strong>Annual</strong> <strong>Report</strong>
MANAGEMENT’S RESPONSIBILITY FOR FINANCIAL STATEMENTS<br />
The accompanying consolidated financial statements have been prepared by management in accordance with International Financial<br />
<strong>Report</strong>ing Standards (IFRS). Financial statements include certain amounts based on estimates and judgments. When an alternative method<br />
exists under IFRS, management has chosen that which it deems most appropriate in the circumstances in order to ensure that the<br />
consolidated financial statements are presented fairly, in all material respects, in accordance with IFRS. The financial information<br />
presented elsewhere in the annual report is consistent with that in the consolidated financial statements.<br />
The Company maintains adequate systems of internal accounting and administrative controls. Such systems are designed to provide<br />
reasonable assurance that transactions are properly authorized and recorded, the Company’s assets are appropriately accounted for and<br />
adequately safeguarded and that the financial information is relevant and reliable.<br />
The Board of Directors of the Company is responsible for ensuring that management fulfills its responsibilities for financial reporting, and is<br />
ultimately responsible for reviewing and approving the consolidated financial statements and the accompanying management’s discussion<br />
and analysis. The Board of Directors carries out this responsibility principally through its Audit Committee.<br />
The Audit Committee is appointed by the Board of Directors and all of its members are non-management directors. The Audit Committee<br />
meets periodically with management and the external auditors to discuss internal controls, auditing matters and financial reporting issues,<br />
and to satisfy itself that each party is properly discharging its responsibilities. The Audit Committee also reviews the consolidated financial<br />
statements, management’s discussion and analysis, the external auditors’ report, examines the fees and expenses for audit services, and<br />
considers the engagement or reappointment of the external auditors. The Audit Committee reports its findings to the Board of Directors for<br />
its consideration when approving the consolidated financial statements for issuance to the shareholders. KPMG LLP, the external auditors,<br />
have full and free access to the Audit Committee.<br />
Toronto, Canada<br />
February 23, 2012<br />
William J. Biggar<br />
President and CEO<br />
Jeff Swinoga<br />
Vice President, Finance and CFO<br />
34<br />
2011 <strong>Annual</strong> <strong>Report</strong>
INDEPENDENT AUDITORS’ REPORT OF REGISTERED PUBLIC ACCOUNTING FIRM<br />
To the Shareholders of <strong>North</strong> <strong>American</strong> <strong>Palladium</strong> Ltd.<br />
We have audited the accompanying consolidated financial statements of <strong>North</strong> <strong>American</strong> <strong>Palladium</strong> Ltd., which comprise the consolidated<br />
balance sheets as at December 31, 2011, December 31, 2010 and January 1, 2010, the consolidated statements of operations and<br />
comprehensive loss, shareholders’ equity and cash flows for the years ended December 31, 2011 and December 31, 2010, and notes,<br />
comprising a summary of significant accounting policies and other explanatory information.<br />
Management’s Responsibility for the Consolidated Financial Statements<br />
Management is responsible for the preparation and fair presentation of these consolidated financial statements in accordance with<br />
International Financial <strong>Report</strong>ing Standards as issued by the International Accounting Standards Board, and for such internal control<br />
as management determines is necessary to enable the preparation of consolidated financial statements that are free from material<br />
misstatement, whether due to fraud or error.<br />
Auditors’ Responsibility<br />
Our responsibility is to express an opinion on these consolidated financial statements based on our audits. We conducted our audits in<br />
accordance with Canadian generally accepted auditing standards and the standards of the Public Company Accounting Oversight Board<br />
(United States). Those standards require that we comply with ethical requirements and plan and perform the audit to obtain reasonable<br />
assurance about whether the consolidated financial statements are free from material misstatement.<br />
An audit involves performing procedures to obtain audit evidence about the amounts and disclosures in the consolidated financial<br />
statements. The procedures selected depend on our judgment, including the assessment of the risks of material misstatement of<br />
the consolidated financial statements, whether due to fraud or error. In making those risk assessments, we consider internal control<br />
relevant to the entity’s preparation and fair presentation of the consolidated financial statements in order to design audit procedures<br />
that are appropriate in the circumstances. An audit also includes evaluating the appropriateness of accounting policies used and the<br />
reasonableness of accounting estimates made by management, as well as evaluating the overall presentation of the consolidated<br />
financial statements.<br />
We believe that the audit evidence we have obtained in our audits is sufficient and appropriate to provide a basis for our audit opinion.<br />
Opinion<br />
In our opinion, the consolidated financial statements present fairly, in all material respects, the consolidated financial position of <strong>North</strong><br />
<strong>American</strong> <strong>Palladium</strong> Ltd. as at December 31, 2011, December 31, 2010 and January 1, 2010, and its consolidated financial performance<br />
and its consolidated cash flows for the years ended December 31, 2011 and December 31, 2010 in accordance with International Financial<br />
<strong>Report</strong>ing Standards as issued by the International Accounting Standards Board.<br />
Chartered Accountants, Licensed Public Accountants<br />
Toronto, Canada<br />
February 23, 2012<br />
35<br />
2011 <strong>Annual</strong> <strong>Report</strong>
CONSOLIDATED BALANCE SHEETS<br />
(expressed in thousands of Canadian dollars)<br />
December 31 December 31 January 1<br />
Notes 2011 2010 2010<br />
ASSETS<br />
Current Assets<br />
Cash $ 50,935 $ 75,159 $ 98,255<br />
Accounts receivable 4 73,048 80,683 –<br />
Taxes receivable 4,602 734 204<br />
Inventories 5 20,046 27,487 25,306<br />
Other assets 6 11,255 27,551 2,495<br />
Total Current Assets 159,886 211,614 126,260<br />
Non-current Assets<br />
Mining interests 7 256,159 126,286 85,014<br />
Reclamation deposit 8 – 10,537 10,503<br />
Total Non-current Assets 256,159 136,823 95,517<br />
Total Assets $ 416,045 $ 348,437 $ 221,777<br />
LIABILITIES AND SHAREHOLDERS’ EQUITY<br />
Current Liabilities<br />
Accounts payable and accrued liabilities 9 $ 42,436 $ 39,859 $ 12,498<br />
Current portion of obligations under finance leases 10 2,428 1,196 558<br />
Provisions 11 1,000 1,000 1,000<br />
Taxes payable 715 – –<br />
Current derivative liability 12 $ 4,875 – –<br />
Total Current Liabilities 51,454 42,055 14,056<br />
Non-current Liabilities<br />
Income taxes payable 2,648 936 1,573<br />
Asset retirement obligations 8 20,881 12,594 13,602<br />
Obligations under finance leases 10 2,104 1,195 576<br />
Long-term debt 12 65,698 – –<br />
Deferred mining tax liability 20 4,264 1,207 832<br />
Total Non-current Liabilities 95,595 15,932 16,583<br />
Shareholders’ Equity<br />
Common share capital and purchase warrants 14 740,888 702,787 574,878<br />
Stock options and related surplus 7,859 5,596 4,242<br />
Contributed surplus 8,873 5,537 6,079<br />
Deficit (488,624) (423,470) (394,061)<br />
Total Shareholders’ Equity 268,996 290,450 191,138<br />
Total Liabilities and Shareholders’ Equity $ 416,045 $ 348,437 $ 221,777<br />
Contingencies and commitments – Notes 16 and 19<br />
Subsequent events – Note 24<br />
See accompanying notes to the consolidated financial statements<br />
On Behalf of the Board of Directors<br />
Andre J. Douchane, Director<br />
Steven R. Berlin, Director<br />
36<br />
2011 <strong>Annual</strong> <strong>Report</strong>
CONSOLIDATED STATEMENTS OF OPERATIONS AND COMPREHENSIVE LOSS<br />
(expressed in thousands of Canadian dollars, except share and per share amounts)<br />
Notes 2011 2010<br />
Revenue 17 $ 170,472 $ 107,098<br />
Mining operating expenses<br />
Production costs 121,258 74,709<br />
Smelting, refining and freight costs 9,260 4,779<br />
Royalty expense 5,819 4,202<br />
Depreciation and amortization 7 17,604 15,590<br />
Gold assets impairment charge 7 49,210 –<br />
Loss (gain) on disposal of equipment (950) (270)<br />
Other 5 1,352 –<br />
Total mining operating expenses 203,553 99,010<br />
Income (loss) from mining operations (33,081) 8,088<br />
Other expenses<br />
Exploration 16,667 30,126<br />
General and administration 12,283 10,648<br />
Interest income 18 (2,817) (2,917)<br />
Interest expense and other costs 18 2,574 775<br />
Foreign exchange loss (gain) 359 (23)<br />
Total other expenses 29,066 38,609<br />
Loss before taxes (62,147) (30,521)<br />
Income and mining tax recovery (expense) 20 (3,007) 1,112<br />
Loss and comprehensive loss for the period $ (65,154) $ (29,409)<br />
Loss per share<br />
Basic and diluted $ (0.40) $ (0.21)<br />
Weighted average number of shares outstanding<br />
Basic 14(f) 162,011,253 141,537,377<br />
Diluted 14(f) 162,011,253 141,537,377<br />
See accompanying notes to the consolidated financial statements<br />
37<br />
2011 <strong>Annual</strong> <strong>Report</strong>
CONSOLIDATED STATEMENTS OF CASH FLOWS<br />
(expressed in thousands of Canadian dollars)<br />
Notes 2011 2010<br />
Cash provided by (used in)<br />
Operations<br />
Net loss for the period $ (65,154) $ (29,409)<br />
Operating items not involving cash<br />
Depreciation and amortization 7 17,604 15,590<br />
Gold assets impairment charge 7 49,210 –<br />
Accretion expense 18 794 209<br />
Deferred income and mining tax expense (recovery) 20 1,214 (169)<br />
Share-based compensation and employee benefits 3,404 1,911<br />
Other (950) (161)<br />
6,122 (12,029)<br />
Changes in non-cash working capital 21 12,972 (61,721)<br />
19,094 (73,750)<br />
Financing Activities<br />
Issuance of common shares and warrants, net of issue costs 14 61,916 101,074<br />
Issuance of long-term debt, net of issue costs 12 69,656 –<br />
Repayment of obligations under finance leases 10 (1,570) (1,721)<br />
Interest paid 10 (157) (142)<br />
Mine reclamation deposit 8 10,537 –<br />
140,382 99,211<br />
Investing Activities<br />
Additions to mining interests 7 (185,633) (49,364)<br />
Proceeds on disposal of mining interests 1,933 807<br />
(183,700) (48,557)<br />
Decrease in cash (24,224) (23,096)<br />
Cash, beginning of period 75,159 98,255<br />
Cash, end of period $ 50,935 $ 75,159<br />
Cash and cash equivalents consisting of:<br />
Cash $ 50,603 $ 75,159<br />
Short-term investments 332 –<br />
$ 50,935 $ 75,159<br />
Foreign exchange included in cash balance $ 66 $ (9)<br />
See accompanying notes to the consolidated financial statements<br />
38<br />
2011 <strong>Annual</strong> <strong>Report</strong>
CONSOLIDATED STATEMENTS OF SHAREHOLDERS’ EQUITY<br />
(expressed in thousands of Canadian dollars, except share amounts)<br />
Total<br />
Number of Capital Stock Contributed shareholders’<br />
Notes shares stock options Warrants surplus Deficit equity<br />
Balance, January 1, 2010 14 127,383,051 $ 572,332 $ 4,242 $ 2,546 $ 6,079 $ (394,061) $ 191,138<br />
Common shares issued:<br />
Related to 2010 unit offering,<br />
net of issue costs 20,000,000 89,804 – 4,423 – – 94,227<br />
Related to purchase of<br />
Vezza property 1,368,421 6,500 6,500<br />
Warrants:<br />
Tax allocation on<br />
expiration of warrants – – – – (542) – (542)<br />
Warrants exercised 5,692,076 28,134 (1,856) 26,278<br />
Stock-based compensation:<br />
Stock options exercised 14(e) 124,634 565 (218) – – – 347<br />
Stock-based<br />
compensation expense 85,093 339 1,572 – – – 1,911<br />
Net loss and comprehensive<br />
loss for the year ended<br />
December 31, 2010 – – – – – (29,409) (29,409)<br />
Balance, December 31, 2010 154,653,275 $ 697,674 $ 5,596 $ 5,113 $ 5,537 $ (423,470) $ 290,450<br />
Common shares issued:<br />
Private placement of flowthrough<br />
shares,<br />
net of issue costs 14(d) 2,667,000 20,594 – – – – 20,594<br />
Premium on issuance of<br />
flow-through shares – (1,840) – – – – (1,840)<br />
Warrants:<br />
Warrants exercised 14(b) 5,009,986 22,514 – (1,239) 14 – 21,289<br />
Expiration of warrants,<br />
net of tax 14(b) – – (3,874) 3,322 – (552)<br />
Stock-based compensation:<br />
Stock options exercised 14(e) 317,919 1,105 (300) – – – 805<br />
Stock-based<br />
compensation expense 14(c) 203,252 841 2,563 – – – 3,404<br />
Net loss and comprehensive<br />
loss for the year ended<br />
December 31, 2011 – – – – – (65,154) (65,154)<br />
Balance, December 31, 2011 162,851,432 $ 740,888 $ 7,859 – $ 8,873 $ (488,624) $ 268,996<br />
See accompanying notes to the consolidated financial statements<br />
39<br />
2011 <strong>Annual</strong> <strong>Report</strong>
NOTES TO THE CONSOLIDATED FINANCIAL STATEMENTS<br />
(expressed in thousands of Canadian dollars, except per share amounts and metal prices)<br />
1. NATURE OF OPERATIONS<br />
<strong>North</strong> <strong>American</strong> <strong>Palladium</strong> Ltd. (“NAP” or “the Company”) is domiciled in Canada and was incorporated on September 12, 1991 under the<br />
Canadian Business Corporations Act. The Company’s 100%-owned subsidiaries are Lac des Iles Mines Ltd. (“LDI”) and NAP Quebec Mines<br />
Ltd. (“NAP Quebec”).<br />
NAP’s flagship operation is the LDI palladium mine, located northwest of Thunder Bay, Ontario, which started producing palladium in 1993.<br />
The Company is currently expanding the LDI mine to transition from mining via ramp access to mining via shaft while utilizing a high volume<br />
bulk mining method.<br />
The Company is incurring additional exploration expenditures on other palladium opportunities at LDI, including the Cowboy, Outlaw and<br />
Sheriff zones that are adjacent to the underground operations.<br />
The Company also owns the Vezza gold mine located north of Val d’Or, Quebec. The Company’s other Quebec-based properties consist of<br />
Discovery, Flordin, Cameron Shear, Florence, Laflamme, Dormex and Harricana.<br />
The consolidated financial statements for the Company as at December 31, 2011 and for the year ended December 31, 2011, include the<br />
Company and its subsidiaries (collectively referred to as “the Company”).<br />
2. BASIS OF PRESENTATION AND SUMMARY OF SIGNIFICANT ACCOUNTING POLICIES<br />
Statement of Compliance<br />
These consolidated financial statements represent the first annual financial statements of the Company and its subsidiaries prepared in<br />
accordance with International Financial <strong>Report</strong>ing Standards (“IFRS”), as issued by the International Accounting Standards Board (“IASB”).<br />
The Company adopted IFRS in accordance with IFRS 1, First-time Adoption of International Financial <strong>Report</strong>ing Standards.<br />
As these financial statements are the Company’s first annual financial statements prepared using IFRS, these financial statements should be<br />
read in conjunction with the IFRS transition disclosures included in Note 23 to these financial statements which contains reconciliations<br />
and descriptions of the effect of the transition from Canadian Generally Accepted Accounting Principles (“Canadian GAAP”) to IFRS on<br />
reported financial position, financial performance and cash flows, including the nature and effect of significant changes in accounting<br />
policies from those used in the Company’s consolidated financial statements for the year ended December 31, 2010.<br />
These financial statements were authorized for issuance by the Board of Directors of the Company on February 23, 2012.<br />
Basis of Measurement<br />
The consolidated financial statements have been prepared on the historical cost basis, except for the following items in the consolidated<br />
balance sheet:<br />
(i)<br />
(ii)<br />
Accounts receivable and related derivative instruments are measured at fair value.<br />
Financial instruments at fair value through profit or loss are measured at fair value.<br />
(iii) Liabilities for cash-settled share-based payment arrangements are measured at fair value.<br />
Functional and Presentation Currency<br />
These consolidated financial statements are presented in Canadian dollars, which is the Company’s and each of its subsidiaries’ functional<br />
currency. All financial information is expressed in thousands of Canadian dollars, except share and per share amounts.<br />
Use of Estimates and Judgments<br />
The preparation of the consolidated financial statements in conformity with IFRSs requires management to make judgments, estimates, and<br />
assumptions that affect the application of accounting policies and the reported amount of assets and liabilities, the disclosure of contingent<br />
assets and liabilities at the date of the financial statements and the reported amounts of revenue and expenses during the year. Significant<br />
estimates and assumptions relate to recoverability of mining operations and mineral exploration properties. While management believes<br />
that these estimates and assumptions are reasonable, actual results could vary significantly.<br />
Information about critical judgments in applying accounting policies that have the most significant effect on the amounts recognized in the<br />
consolidated financial statements is included in the following notes:<br />
Note 8 – Asset retirement obligations<br />
Note 14 – Shareholders’ equity<br />
Note 17 – Revenue from metal sales<br />
40<br />
2011 <strong>Annual</strong> <strong>Report</strong>
NOTES TO THE CONSOLIDATED FINANCIAL STATEMENTS<br />
Certain assumptions are dependent upon reserves, which represent the estimated amount of ore that can be economically and legally<br />
extracted from the Company’s properties. In order to estimate reserves, assumptions are required about a range of geological, technical<br />
and economic factors, including quantities, grades, production techniques, recovery rates, production costs, transportation costs,<br />
commodity prices and exchange rates. Estimating the quantity and/or grade of reserves requires the size, shape and depth of ore bodies to<br />
be determined by analyzing geological data such as drilling samples. This process may require complex and difficult geological judgments<br />
to interpret the data. Estimates and underlying assumptions are reviewed on an ongoing basis. Revisions to accounting estimates are<br />
recognized in the period in which the estimates are revised and in any future periods affected.<br />
Because the economic assumptions used to estimate reserves change from period to period and additional geological data is generated<br />
during the course of operations, estimates of reserves may change from period to period. Changes in reported reserves may affect the<br />
Company’s financial results and financial position in a number of ways, including the following:<br />
(i)<br />
(ii)<br />
Asset carrying values may be affected due to changes in estimated future cash flows;<br />
Depreciation and amortization charged in the statement of operations may change or be impacted where such charges are<br />
determined by the units of production basis, or where the useful economic lives of assets change;<br />
(iii) Decommissioning, site restoration and environmental provisions may change where changes in estimated reserves affect<br />
expectations about the timing or cost of these activities; and<br />
(iv) The carrying value of deferred tax assets may change due to changes in estimates of the likely recovery of the tax benefits.<br />
Information about assumptions and estimation uncertainties that have a significant risk of resulting in a material adjustment within the<br />
next financial year are included in the following notes:<br />
Note 7 – Mining interests<br />
Note 11 – Provisions<br />
Note 19 – Contingencies<br />
Note 20 – Income taxes<br />
3. SUMMARY OF SIGNIFICANT ACCOUNTING POLICIES<br />
The accounting policies set out below have been applied consistently by all Company’s entities for all periods presented in these<br />
consolidated financial statements and in preparing the opening IFRS balance sheet at January 1, 2010 for the purposes of the transition to<br />
IFRSs, unless otherwise indicated.<br />
Basis of Consolidation<br />
These consolidated financial statements include the accounts of the Company and its wholly-owned subsidiaries.<br />
(a)<br />
Business combinations<br />
The Company measures goodwill as the fair value of the consideration transferred including the recognized amount of any noncontrolling<br />
interest in the acquiree, less the fair value of the identifiable assets acquired and liabilities assumed, all measured as of the<br />
acquisition date. When the excess is negative, a bargain purchase gain is recognized immediately in profit or loss.<br />
The Company elects on a transaction-by-transaction basis whether to measure non-controlling interest at its fair value, or at its<br />
proportionate share of the recognized amount of the identifiable net assets, at the acquisition date.<br />
Transaction costs, other than those directly associated with the issue of debt or equity securities, that the Company incurs in<br />
connection with a business combination are expensed as incurred.<br />
(b)<br />
(c)<br />
Subsidiaries<br />
Subsidiaries are entities controlled by the Company. The financial statements of subsidiaries are included in the consolidated financial<br />
statements from the date that control commences until the date that control ceases.<br />
Transactions eliminated on consolidation<br />
Inter-company balances and transactions and any unrealized income and expenses arising from inter-company transactions are<br />
eliminated in preparing the consolidated financial statements.<br />
41<br />
2011 <strong>Annual</strong> <strong>Report</strong>
NOTES TO THE CONSOLIDATED FINANCIAL STATEMENTS<br />
Foreign Currency Translations<br />
The reporting and functional currency of the Company and its subsidiaries is the Canadian dollar. Accordingly, the Company translates<br />
monetary assets and liabilities denominated in foreign currency at the rate of exchange prevailing at the consolidated balance sheet dates,<br />
non-monetary assets and liabilities denominated in foreign currency at the rate in effect at the date the transaction occurred and revenues<br />
and expenses denominated in foreign currency at the exchange rate in effect during the applicable accounting period. All resulting foreign<br />
exchange gains and losses are recorded in the Consolidated Statements of Operations and Comprehensive Loss.<br />
Financial Instruments<br />
(a) Non-derivative financial assets<br />
The Company initially recognizes loans and receivables and deposits on the date they originated. All other financial assets (including<br />
assets designated at fair value through profit or loss) are recognized initially on the trade date at which the Company becomes a party<br />
to the contractual provisions of the instrument.<br />
Financial instruments are measured on initial recognition at fair value plus, in the case of instruments other than those classified as<br />
“fair value through profit and loss”, directly attributable transaction costs.<br />
The Company has the following non-derivative financial assets: financial assets at fair value through profit or loss and loans<br />
and receivables.<br />
A financial asset is classified at fair value through profit or loss if it is classified as held for trading or is designated as such upon initial<br />
recognition. These financial instruments are measured at fair value, and changes therein are recognized in the Statement of Operations<br />
and Comprehensive Loss. The Company’s accounts receivable from the sale of palladium and by-product metals from the LDI mine<br />
primarily represent the material financial instruments which have been recorded at fair value through profit or loss (see Note 4).<br />
Financial assets classified as loans and receivables are measured subsequent to initial recognition at amortized cost using the<br />
effective interest method, less any impairment losses. The Company’s loan and receivables are included in other assets (refer to<br />
Note 6). Cash and cash equivalents are stated at amortized cost and include cash on account less outstanding cheques, demand<br />
deposits and short-term guaranteed investments with original maturities of three months or less.<br />
(b)<br />
Non-derivative financial liabilities<br />
The Company initially recognizes debt securities issued and subordinated liabilities on the date they originated. All other financial<br />
liabilities (including liabilities designated at fair value through profit or loss) are recognized initially on the trade date at which the<br />
Company becomes a party to the contractual provisions of the instrument.<br />
The Company derecognizes a financial liability when its contractual obligations are discharged, cancelled or expired. Financial assets<br />
and liabilities are offset and the net amount presented in the consolidated balance sheet when, and only when, the Company has a<br />
legal right to offset the amounts and intends either to settle on a net basis or to realize the asset and settle the liability simultaneously.<br />
The Company has the following non-derivative financial liabilities: long-term debt, finance leases, loans and borrowings, bank<br />
overdrafts, credit facilities, and trade and other payables.<br />
Such financial liabilities are recognized initially at fair value plus any directly attributable transaction costs. Subsequent to initial<br />
recognition these financial liabilities are measured at amortized cost using the effective interest method.<br />
(c)<br />
Derivative financial instruments<br />
The Company holds derivative financial instruments to minimize its foreign currency and market price exposures. Embedded<br />
derivatives are separated from the host contract and accounted for separately if the economic characteristics and risks of the host<br />
contract and the embedded derivative are not closely related, a separate instrument with the same terms as the embedded derivative<br />
would meet the definition of a derivative, and the combined instrument is not measured at fair value through profit or loss.<br />
Derivatives are recognized initially at fair value and any associated transaction costs are recognized in profit or loss as incurred.<br />
Subsequent to initial recognition, derivatives are measured at fair value, and changes therein are accounted for as described below.<br />
Separable embedded derivatives<br />
Changes in the fair value of separable embedded derivatives are recognized immediately in profit or loss.<br />
Other non-trading derivatives<br />
When a derivative financial instrument is not held for trading and is not designated in a qualifying hedge relationship, all changes in its<br />
fair value are recognized immediately in profit or loss.<br />
42<br />
2011 <strong>Annual</strong> <strong>Report</strong>
NOTES TO THE CONSOLIDATED FINANCIAL STATEMENTS<br />
Inventories<br />
Concentrate, crushed and broken ore stockpiles, and gold inventory are valued at the lower of average production cost (including an<br />
allocation of the depreciation of production related assets) and net realizable value. Crushed and broken ore stockpiles represent coarse<br />
ore that has been extracted from the mine and is available for further processing. The amount of stockpiled ore that is not expected to be<br />
processed within one year, if any, is shown as a long-term asset. Gold inventory is comprised of unprocessed ore either in stockpiles or<br />
bins, unrecovered gold in either carbon or solution within the milling circuit, and gold-silver doré bars produced but not sold as at the<br />
reporting date. Supplies inventory is valued at the lower of average cost and net realizable value.<br />
Mining Interests<br />
(a) Recognition and measurement<br />
Property, plant and equipment are measured at cost less accumulated depreciation and accumulated impairment losses.<br />
Cost includes expenditures that are directly attributable to the acquisition of the asset. The cost of self-constructed assets includes<br />
the cost of materials and direct labour, any other costs directly attributable to bringing the assets to a working condition for their<br />
intended use, the costs of dismantling and removing the items and restoring the site on which they are located, and borrowing costs<br />
on qualifying assets for which the commencement date for capitalization is on or after January 1, 2010. The Company capitalizes<br />
interest on major projects where direct indebtedness has occurred.<br />
When parts of an item of property, plant and equipment have different useful lives, they are accounted for as separate items or major<br />
components of property, plant and equipment.<br />
Spare parts and servicing equipment are usually carried as inventory and recognized in profit or loss as consumed. However, major<br />
spare parts and stand-by equipment qualify as property, plant and equipment when the Company expects to use them during more than<br />
one period. Similarly, if the spare parts and servicing equipment can be used only in connection with an item of property, plant and<br />
equipment, they are accounted for as property, plant and equipment.<br />
Exploration costs relating to properties are charged to earnings in the year in which they are incurred. When it is determined that a<br />
mining property can be economically developed as a result of reserve potential, subsequent exploration expenditures are capitalized.<br />
Determination as to reserve potential is based on the results of studies, which indicate whether production from a property is<br />
economically feasible. Upon commencement of commercial production of a development project these costs are amortized using the<br />
unit-of-production method over the proven and probable reserves. Capitalized exploration costs, net of salvage values, relating to a<br />
property that is later abandoned or considered uneconomic for the foreseeable future, are written off in the period the decision is<br />
made. No amortization is provided in respect of mine development expenditures until commencement of commercial production. Any<br />
production revenue earned prior to commercial production, net of related costs, is offset against the development costs.<br />
Gains and losses on disposal of an item of property, plant and equipment are determined by comparing the proceeds from disposal<br />
with the carrying amount of property, plant and equipment, and are recognized net within other income in profit or loss.<br />
(b)<br />
Value Beyond Proven and Probable Reserves (“VBPP”)<br />
On acquisition of a mineral property, the Company prepares an estimate of the fair value of the resources and exploration potential of<br />
that property and records this amount as an asset (“VBPP”) as at the date of acquisition. The acquisition costs classified as VBPP are<br />
not amortized.<br />
On an annual basis, estimates of proven and probable mineral reserves for each mineral property acquired are prepared. The change<br />
in reserves, net of production costs is, among other things, used to determine the amount to be converted from VBPP to proven and<br />
probable reserves subject to amortization.<br />
(c)<br />
(d)<br />
Subsequent costs<br />
The cost of replacing a part of an item of property, plant and equipment is recognized at the carrying amount of the item if it is probable<br />
that the future economic benefits embodied within the item will flow to the Company and its cost can be measured reliably. The<br />
carrying amount of the replaced part is derecognized. The costs of the day-to-day servicing of property, plant and equipment are<br />
recognized in profit or loss as incurred.<br />
Depreciation and amortization<br />
Mining interests relating to plant and equipment, mining leases and claims, royalty interests, and other development costs are<br />
recorded at cost with depreciation and amortization provided on the unit-of-production method over the estimated remaining ounces<br />
of palladium (LDI) and gold (NAP Quebec) to be produced based on the proven and probable reserves.<br />
43<br />
2011 <strong>Annual</strong> <strong>Report</strong>
NOTES TO THE CONSOLIDATED FINANCIAL STATEMENTS<br />
Mining interests relating to small vehicles and certain machinery with a determinable expected life are recorded at cost with<br />
depreciation provided on a straight-line basis over their estimated useful lives, ranging from three to seven years, which most closely<br />
reflects the expected pattern of consumption of the future economic benefits embodied in the asset. Straight-line depreciation is<br />
calculated over the depreciable amount, which is the cost of an asset, less its residual value.<br />
Significant components of individual assets are assessed and if a component has a useful life that is different from the remainder of<br />
that asset, that component is depreciated separately using the unit-of-production or straight-line method as appropriate. Costs relating<br />
to VBPP and land are not amortized.<br />
Leased assets are depreciated over the shorter of the lease term and their useful lives unless it is reasonably certain that the Company<br />
will obtain ownership by the end of the lease term.<br />
Depreciation methods, useful lives and residual values are reviewed at each financial year-end and adjusted if appropriate.<br />
Impairment<br />
The carrying amounts of the Company’s non-financial assets, excluding inventories and deferred tax assets, are reviewed at each reporting<br />
date to determine whether there is any indication of impairment. Impairment is assessed at the level of cash-generating units (“CGUs”). An<br />
impairment loss is recognized in the Consolidated Statements of Operations and Comprehensive Loss for any excess of carrying amount<br />
over the recoverable amount.<br />
Impairment is determined for an individual asset unless the asset does not generate cash inflows that are independent of those generated<br />
from other assets or groups of assets, in which case, the individual assets are grouped together into CGUs for impairment purposes.<br />
The recoverable amount of an asset or CGU is the greater of its “value in use” and its “fair value less costs to sell”. In assessing value in<br />
use, the estimated future cash flows are discounted to their present value using a pre-tax discount rate that reflects current market<br />
assessments of the time value of money and the risks specific to the asset.<br />
An impairment loss is recognized in the Consolidated Statements of Operations and Comprehensive Loss if the carrying amount of an asset<br />
or its CGU exceeds its estimated recoverable amount. The recoverable amount of an asset is the higher of its fair value less costs to sell and<br />
its value in use.<br />
Impairment losses recognized in prior periods are assessed at each reporting date for any indications that the loss has decreased or no<br />
longer exists. An impairment loss on non-financial assets other than goodwill is reversed if there has been a change in the estimates used<br />
to determine the recoverable amount, only to the extent that the asset’s carrying amount does not exceed the carrying amount that would<br />
have been determined, net of amortization, if no impairment loss had been recognized.<br />
Employee Benefits<br />
(a) Defined contribution plans<br />
A defined contribution plan is a post-employment benefit plan under which an entity pays fixed contributions into a separate entity and<br />
will have no legal or constructive obligation to pay further amounts. Obligations for contributions to defined contribution pension plans<br />
are recognized as an employee benefit expense in profit or loss in the periods during which services are rendered by employees.<br />
Prepaid contributions are recognized as an asset to the extent that a cash refund or a reduction in future payments is available.<br />
Contributions to a defined contribution plan that are due more than 12 months after the end of the period in which the employees<br />
render the service are discounted to their present value.<br />
Compensation Agreements<br />
(a) Share-based payment transactions<br />
The grant date fair value of equity-classified share-based payment awards granted to employees is recognized as an employee<br />
expense, with a corresponding increase in equity, over the period that the employees unconditionally become entitled to the awards.<br />
The amount recognized as an expense is adjusted to reflect the number of awards for which the related service are expected to be<br />
met, such that the amount ultimately recognized as an expense is based on the number of awards that do meet the related service and<br />
non-market performance conditions at the vesting date.<br />
The Company has a Restricted Share Unit (“RSU”) Plan under which eligible directors, officers and key employees of the Company are<br />
entitled to receive awards of restricted share units. Each restricted share unit is equivalent in value to the fair market value of a<br />
common share of the Company on the date of the award and a corresponding liability is established on the balance sheet. The value of<br />
each award is charged to compensation expense over the period of vesting. At each reporting date, the compensation expense and<br />
liability are adjusted to reflect the changes in market value of the liability based on the fair values of RSUs for each vesting period<br />
determined using the Black-Scholes model.<br />
44<br />
2011 <strong>Annual</strong> <strong>Report</strong>
NOTES TO THE CONSOLIDATED FINANCIAL STATEMENTS<br />
Share-based payment arrangements in which the Company receives goods or services as consideration for its own equity<br />
instruments are accounted for as equity-settled share-based payment transactions, regardless of how the equity instruments are<br />
obtained by the Company.<br />
Provisions<br />
A provision is recognized if, as a result of a past event, the Company has a present legal or constructive obligation that can be estimated<br />
reliably, and it is probable that an outflow of economic benefits will be required to settle the obligation. Provisions are determined by<br />
discounting the expected future cash flows at a pre-tax rate that reflects current market assessments of the time value of money and the<br />
risks specific to the liability.<br />
(a)<br />
(b)<br />
Production obligations<br />
A provision for an obligation based on achieving specific production targets is recognized when the Company, based on estimates of<br />
recoverable minerals and planned production in the current mine plan for each property, determines the production target expected to<br />
be achieved.<br />
Asset retirement obligations<br />
In accordance with Company policies, asset retirement obligations relating to legal and constructive obligations for future site<br />
reclamation and closure of the Company’s mine sites are recognized when incurred and a liability and corresponding asset are<br />
recorded at fair value. Estimated closure and restoration costs are provided for in the accounting period when the obligation arising<br />
from the related disturbance occurs.<br />
The amount of any liability recognized is estimated based on the risk-adjusted costs required to settle present obligations, discounted<br />
using a pre-tax risk-free discount rate consistent with the time period of expected cash flows. When the liability is initially recorded, a<br />
corresponding asset retirement cost is recognized as an addition to mining interests and amortized using the unit of production method.<br />
The liability for each mine site is accreted over time and the accretion charges are recognized as a finance cost in the Consolidated<br />
Statements of Operations and Comprehensive Loss. The liability is subject to re-measurement at each reporting date based on<br />
changes in discount rates and timing or amounts of the costs to be incurred. Changes in the liability, other than accretion charges,<br />
relating to mine rehabilitation and restoration obligations, which are not the result of current production of inventory, are added to or<br />
deducted from the carrying value of the related asset retirement cost in the reporting period recognized. If the change results in a<br />
reduction of the obligation in excess of the carrying value of the related asset retirement cost, the excess balance is recognized as a<br />
recovery through profit or loss in the period.<br />
Revenue and Accounts Receivable<br />
Revenue from the sale of metals in the course of ordinary activities is measured at the fair value of the consideration received or receivable,<br />
net of volume adjustments. Revenue is recognized when persuasive evidence exists, usually in the form of an executed sales agreement,<br />
that the significant risks and rewards of ownership have been transferred to the buyer, recovery of the consideration is probable, the<br />
associated costs and possible return of goods can be estimated reliably, there is no continuing management involvement with the goods,<br />
and the amount of revenue can be measured reliably. The timing of the transfers of risks and rewards varies depending on the individual<br />
terms of the contract of sale.<br />
Revenue from the sale of palladium and by-product metals from the LDI mine is provisionally recognized based on quoted market prices<br />
upon the delivery of concentrate to the smelter or designated shipping point, which is when title transfers and significant rights and<br />
obligations of ownership pass. The Company’s smelter contract provides for final prices to be determined by quoted market prices in a<br />
period subsequent to the date of concentrate delivery. Variations from the provisionally priced sales are recognized as revenue adjustments<br />
until final pricing is determined. Accounts receivable is recorded net of estimated treatment and refining costs which are subject to final<br />
assay adjustments. Subsequent adjustments to provisional pricing amounts due to changes in metal prices and foreign exchange are<br />
reflected separately from initial revenues on the consolidated statements of operations and comprehensive loss.<br />
Revenue from the sale of gold-silver doré bars from Sleeping Giant is recognized when the significant risks and rewards of ownership have<br />
transferred to the buyer and selling prices are known or can be reasonably estimated.<br />
45<br />
2011 <strong>Annual</strong> <strong>Report</strong>
NOTES TO THE CONSOLIDATED FINANCIAL STATEMENTS<br />
Interest and other costs<br />
Interest income is comprised of interest income on funds invested (including available-for-sale financial assets), gains on the disposal of<br />
available-for-sale financial assets, gains on the renouncement of flow-through expenditures, changes in the fair value of financial assets at<br />
fair value through profit or loss, and gains on hedging instruments that are recognized in profit or loss. Interest income is recognized as it<br />
accrues in profit or loss, using the effective interest method.<br />
Other costs are comprised of interest expense on borrowings, accretion expense, unwinding of the discount on provisions, changes in the<br />
fair value of financial assets at fair value through profit or loss, impairment losses recognized on financial assets, losses on hedging<br />
instruments that are recognized in profit or loss, and changes in the fair value of the palladium warrants. Borrowing costs that are not<br />
directly attributable to the acquisition, construction or production of a qualifying asset are recognized in profit or loss using the effective<br />
interest method.<br />
Foreign currency gains and losses are reported on a net basis.<br />
Income and mining taxes<br />
Income tax expense is comprised of current and deferred tax. Current tax and deferred tax are recognized in profit or loss except to the<br />
extent that it relates to a business combination, or items recognized directly in equity or in other comprehensive income.<br />
Current tax is the expected tax payable or receivable on the taxable income or loss for the year, using tax rates enacted or substantively<br />
enacted at the reporting date, and any adjustment to tax payable in respect of previous years.<br />
Deferred tax is recognized in respect of temporary differences between the carrying amounts of assets and liabilities for financial reporting<br />
purposes and the amounts used for taxation purposes. Deferred tax is not recognized for the following temporary differences:<br />
(i)<br />
(ii)<br />
the initial recognition of assets or liabilities in a transaction that is not a business combination and that affects neither accounting<br />
nor taxable profit or loss;<br />
temporary differences relating to investments in subsidiaries and jointly controlled entities to the extent that it is probable that they<br />
will not reverse in the foreseeable future; and<br />
(iii) temporary differences arising on the initial recognition of goodwill.<br />
Deferred tax is measured at the tax rates that are expected to be applied to temporary differences when they reverse, based on the laws<br />
that have been enacted or substantively enacted by the reporting date.<br />
Deferred tax assets and liabilities are offset if there is a legally enforceable right to offset current tax liabilities and assets, and they relate<br />
to income or mining taxes levied by the same tax authority on the same taxable entity, or on different tax entities, but they intend to settle<br />
current tax liabilities and assets on a net basis or their tax assets and liabilities will be realized simultaneously.<br />
A deferred tax asset is recognized for unused tax losses, tax credits and deductible temporary differences, to the extent that it is probable<br />
that future taxable profits will be available against which they can be utilized. Deferred tax assets are reviewed at each reporting date and<br />
are reduced to the extent that it is no longer probable that the related tax benefit will be realized.<br />
Basic and Diluted Loss Per Share<br />
Basic earnings (loss) per common share (“EPS”) is computed by dividing the income (loss) for the period by the weighted average number<br />
of common shares outstanding during the reporting period. Diluted EPS is computed using the treasury stock method whereby the weighted<br />
average number of shares outstanding is increased to include additional common shares from the assumed exercise of stock options and<br />
common share purchase warrants, if dilutive. The number of additional common shares is calculated by assuming that outstanding equity<br />
instruments were exercised and that proceeds from such exercises were used to acquire shares of common stock at the average market<br />
price during the reporting period. These common equivalent shares are not included in the calculation of the weighted average number of<br />
shares outstanding for diluted loss per common share when the effect would be anti-dilutive.<br />
Flow-Through Shares<br />
The Company finances a portion of its exploration activities through the issuance of flow-through shares. On the date of issuance of the<br />
flow-through shares, the premium relating to the proceeds received in excess of the closing market price of the Company’s common shares<br />
is allocated to liabilities.<br />
46<br />
2011 <strong>Annual</strong> <strong>Report</strong>
NOTES TO THE CONSOLIDATED FINANCIAL STATEMENTS<br />
Under the terms of the flow-through common share issues, the tax attributes of the related expenditures are renounced to investors and<br />
deferred income tax expense and deferred tax liabilities are increased by the estimated income tax benefits renounced by the Company to<br />
the investors. The premium liability is reduced pro-rata based on the actual amount of flow-through eligible expenditures incurred during<br />
the reporting period. The reduction to the premium is recognized through profit or loss as other income.<br />
Segment <strong>Report</strong>ing<br />
An operating segment is a component of the Company that engages in business activities from which it may earn revenues and incur<br />
expenses, including revenues and expenses that relate to transactions with any of the Company’s other components. All operating<br />
segments’ operating results are reviewed regularly by the Company’s executive team to make decisions about resources to be allocated to<br />
the segment and assess its performance, and for which discrete financial information is available.<br />
Segment results that are reported to the executive team include items directly attributable to a segment as well as those that can be<br />
allocated on a reasonable basis. Unallocated items comprise mainly corporate assets (primarily the Company’s headquarters), head office<br />
expenses, and deferred tax assets and liabilities.<br />
Segment capital expenditures are the total costs incurred during the period to acquire property, plant and equipment, and goodwill.<br />
New Standards and Interpretations Not Yet Adopted<br />
The following new standards, amendments to standards and interpretations are not yet effective for the year ended December 31, 2011 or<br />
have otherwise not yet been adopted by the Company.<br />
IFRS 7 Financial Instruments: Disclosures<br />
The amendments to IFRS 7 require disclosure of information that enables users of financial statements to understand the relationship<br />
between transferred financial assets that are not derecognized in their entirety and the associated liabilities; and to evaluate the<br />
nature of, and risks associated with, the entity’s continuing involvement in derecognized financial assets. This update is effective for<br />
years beginning on or after January 1, 2012. Management is evaluating the impact, if any, the adoption of this amendment to IFRS 7 will<br />
have on the disclosures in its consolidated financial statements.<br />
IFRS 9 Financial Instruments: Classification and Measurement<br />
This is the first part of a new standard on classification and measurement of financial assets that will replace IAS 39, Financial<br />
Instruments: Recognition and Measurement. IFRS 9 has two measurement categories: amortized cost and fair value. All equity<br />
instruments are measured at fair value. A debt instrument is at amortized cost only if the entity is holding it to collect contractual cash<br />
flows and the cash flows represent principal and interest. Otherwise, it is at fair value through profit or loss. An update to IFRS 9<br />
includes guidance on financial liabilities and derecognition of financial instruments. This standard and the related update are effective<br />
for years beginning on or after January 1, 2015.<br />
The Company will evaluate the impact of the change to its consolidated financial statements based on the characteristics of its<br />
financial instruments at the time of adoption.<br />
IAS 1 Presentation of Financial Statements<br />
This standard is amended to change the disclosure of items presented in other comprehensive income (“OCI”), including a<br />
requirement to separate items presented in OCI into two groups based on whether or not they may be recycled to profit or loss in the<br />
future. The amendment is effective for reporting years beginning on or after July 1, 2012. This amendment is presently not expected to<br />
impact the consolidated financial statements of the Company.<br />
IAS 19 Employee Benefits<br />
The standard is amended to reflect significant changes to recognition and measurement of defined benefit pension expense and<br />
termination benefits, and provides expanded disclosure requirements. The amendment is effective for annual periods beginning on or<br />
after January 1, 2013. This amendment is presently not expected to impact the consolidated financial statements of the Company.<br />
47<br />
2011 <strong>Annual</strong> <strong>Report</strong>
NOTES TO THE CONSOLIDATED FINANCIAL STATEMENTS<br />
New Standards Addressing the Scope of a <strong>Report</strong>ing Entity<br />
The following IFRS standards are introduced and IAS standards amended accordingly:<br />
IFRS 10 Consolidated Financial Statements<br />
This standard replaces the guidance on control and consolidation in IAS 27, Consolidated and Separate Financial Statements, and<br />
SIC-12, Consolidation – Special Purpose Entities. IFRS 10 changes the definition of control under IFRS so that the same criteria are<br />
applied to all entities to determine control.<br />
IFRS 11 Joint Arrangements<br />
This standard replaces IAS 31, Interests in Joint Ventures. IFRS 11 reduces the types of joint arrangements to two: joint ventures<br />
and joint operations. IFRS 11 requires the use of equity accounting for interests in joint ventures, eliminating the existing policy<br />
choice of proportionate consolidation for jointly controlled entities under IAS 31. Entities that participate in joint operations will<br />
follow accounting much like that for jointly controlled assets and jointly controlled operations under IAS 31.<br />
IFRS 12 Disclosures of Interests in Other Entities<br />
This standard sets out the disclosure requirements for entities reporting under IFRS 10 and IFRS 11, and replaces the disclosure<br />
requirements currently found in IAS 28, Investments in Associates.<br />
IAS 27 Consolidated and Separate Financial Statements<br />
This standard is renamed “Separate Financial Statements” and deals solely with separate financial statements, the guidance for<br />
which remains unchanged.<br />
All above standards and amendments are effective for reporting years beginning on or after January 1, 2013.<br />
IFRS 13 Fair Value Measurement<br />
The new standard provides a single source of guidance on how to measure fair value where its use is already required or permitted by<br />
other IFRS and enhances disclosure requirements for information about fair value measurements. The standard is effective for<br />
reporting years beginning on or after January 1, 2013.<br />
IFRIC 20 – Stripping Costs in the Production Phase of a Surface Mine<br />
On October 20, 2011, the IASB issued a new interpretation, IFRIC 20, to address accounting issues regarding waste removal costs<br />
incurred in surface mining activities during the production phase of a mine, referred to as production stripping costs. The new<br />
interpretation addresses the classification and measurement of production stripping costs as either inventory or as a tangible or<br />
intangible non-current ’stripping activity asset’. The standard also provides guidance for the depreciation or amortization and<br />
impairment of such assets.<br />
IFRIC 20 is effective for reporting years beginning on or after January 1, 2013, although earlier application is permitted. The Company is<br />
assessing the impact, if any, the adoption of this standard may have on the consolidated financial statements of the Company.<br />
4. ACCOUNTS RECEIVABLE<br />
Accounts receivable consist of the following:<br />
At December 31 At December 31 At January 1<br />
2011 2010 2010<br />
Accounts receivable $ 71,097 $ 80,683 $ –<br />
Unrealized gain on financial contracts 1 1,951 – –<br />
Accounts receivable $ 73,048 $ 80,683 $ –<br />
1 As at December 31, 2011, a total of 69,500 ounces of past palladium production delivered and sold to the smelter, was priced using forward prices for the month of final<br />
settlement at an average price of $697 per ounce (December 31, 2010 – 68,950 ounces at an average price of $640 per ounce). Refer to Notes 9 and 15.<br />
Accounts receivable represents the value of all platinum group metals (“PGMs”), gold and certain base metals contained in LDI’s<br />
concentrate shipped for smelting and refining, valued using the December 31, 2011 forward metal prices for the month of final settlement,<br />
and for which significant risks and rewards have transferred to third parties.<br />
48<br />
2011 <strong>Annual</strong> <strong>Report</strong>
NOTES TO THE CONSOLIDATED FINANCIAL STATEMENTS<br />
All of the accounts receivable are due from two customers at December 31, 2011. A reserve for doubtful accounts has not been established,<br />
as in the opinion of management, the amount due will be fully collected. The Company is not economically dependent on its customers, refer<br />
to Note 17.<br />
Accounts receivable has been pledged as security against a one-year US$60.0 million operating line of credit with a Canadian chartered<br />
bank, which is to be used for working capital liquidity and general corporate purposes. The Company had $48.0 million available to be drawn<br />
from the credit facility and $12.0 million was utilized for letters of credit primarily for reclamation deposits, refer to Note 16c.<br />
5. INVENTORIES<br />
Inventories consist of the following:<br />
At December 31 At December 31 At January 1<br />
2011 2010 2010<br />
Supplies $ 11,209 $ 12,580 $ 12,555<br />
Gold inventory 1 6,209 5,928 4,890<br />
Crushed and broken ore stockpiles 2 2,628 8,979 7,861<br />
Total $ 20,046 $ 27,487 $ 25,306<br />
1 Gold inventory is comprised of unprocessed ore either in stockpiles or bins, unrecovered gold in either carbon or solution within the milling circuit, and gold-silver doré<br />
bars produced but not sold as at the reporting date.<br />
2 Crushed and broken ore stockpiles represent coarse ore that has been extracted from the mine and is available for further processing. The amount of ore stockpiles that<br />
is not expected to be processed within one year, if any, is shown as a long-term asset.<br />
All inventory amounts are carried at cost for the periods presented with the exception of gold inventories which are written down to net<br />
realizable value.<br />
Supplies inventory of $24,111 (2010 – $17,650) were recognized as an expense during the year ended December 31, 2011.<br />
The Company recognized a write-down of obsolete supplies inventory of $1,352 for the year ended December 31, 2011 (2010 – $nil).<br />
6. OTHER ASSETS<br />
Other assets consist of the following:<br />
At December 31 At December 31 At January 1<br />
2011 2010 2010<br />
Prepaids $ 695 $ 2,555 $ 1,165<br />
Sales taxes receivable 8,501 5,120 1,275<br />
Warrant proceeds receivable 1 – 19,777 –<br />
Ministry of Natural Resources 2 1,769 – –<br />
Other 290 99 55<br />
$ 11,255 $ 27,551 $ 2,495<br />
1 In 2011, $21.3 million of proceeds were received from the exercise of 5,009,986 Series A warrants. Refer to Note 14b for further details.<br />
2 In 2011, the Company issued a letter of credit related to the Sleeping Giant mine closure plan. The Ministry of Natural Resources acknowledged receipt of the letter of<br />
credit in 2011 and the cash proceeds were received in 2012.<br />
49<br />
2011 <strong>Annual</strong> <strong>Report</strong>
NOTES TO THE CONSOLIDATED FINANCIAL STATEMENTS<br />
7. MINING INTERESTS<br />
Mining interests are comprised of the following:<br />
Mining<br />
leases and<br />
Underground Equipment claims, royalty<br />
Plant and mine under interest, and Exploration<br />
equipment development finance lease development properties Total<br />
Cost or deemed cost<br />
Balance at January 1, 2010 $ 29,730 $ 35,751 $ 2,495 $ 5,516 $ 16,767 $ 90,259<br />
Additions of physical assets 10,870 37,535 2,456 3,163 5,106 59,130<br />
Revaluation of ARO assets (1,319) – – – – (1,319)<br />
Disposals (812) (72) – – – (884)<br />
Balance at December 31, 2010 $ 38,469 $ 73,214 $ 4,951 $ 8,679 $ 21,873 $ 147,186<br />
Balance at January 1, 2011 $ 38,469 $ 73,214 $ 4,951 $ 8,679 $ 21,873 $ 147,186<br />
Additions of physical assets 8,297 142,339 3,943 5,429 28,507 188,515<br />
Revaluation of ARO assets 5,738 – – – – 5,738<br />
Capitalization of borrowing costs – 1,574 – – – 1,574<br />
Reclassification of costs for finance<br />
leases maturing in the year – 1,510 (1,510) – – –<br />
Disposals (1,441) (150) – – – (1,591)<br />
Balance at December 31, 2011 $ 51,063 $ 218,487 $ 7,384 $ 14,108 $ 50,380 $ 341,422<br />
Depreciation and impairment losses<br />
Balance at January 1, 2010 $ 4,633 $ 34 $ 25 $ 553 $ – $ 5,245<br />
Depreciation for the year 4,575 9,922 437 876 – 15,810<br />
Disposals (136) (19) – – – (155)<br />
Balance at December 31, 2010 $ 9,072 $ 9,937 $ 462 $ 1,429 $ – $ 20,900<br />
Balance at January 1, 2011 $ 9,072 $ 9,937 $ 462 $ 1,429 $ – $ 20,900<br />
Depreciation for the period 4,582 11,229 786 1,001 – 17,598<br />
Impairment loss (reversal) 1,674 33,568 – 480 11,673 47,395<br />
Disposals (480) (150) – – – (630)<br />
Balance at December 31, 2011 $ 14,848 $ 54,584 $ 1,248 $ 2,910 $ 11,673 $ 85,263<br />
Carrying amounts<br />
As at January 1, 2010 $ 25,097 $ 35,717 $ 2,470 $ 4,963 $ 16,767 $ 85,014<br />
As at December 31, 2010 $ 29,397 $ 63,277 $ 4,489 $ 7,250 $ 21,873 $ 126,286<br />
As at December 31, 2011 $ 36,215 $ 163,903 $ 6,136 $ 11,198 $ 38,707 $ 256,159<br />
Gold Assets Impairment Charge<br />
The Company announced on January 17, 2012 that it is discontinuing production at the Sleeping Giant mine.<br />
After reviewing various mining scenarios, the Company concluded that mining would likely continue at high costs given the lack of grade<br />
continuity, with insufficient operating margin to justify continuing operations. The Company has therefore ceased mining operations at<br />
Sleeping Giant and has restructured the gold division, resulting in a non-cash impairment charge on its gold assets of $49,210 for the year<br />
ended December 31, 2011.<br />
The Sleeping Giant mill will continue to operate to process ore from the Vezza mine. The mill has a capacity of 900 tonnes per day which will<br />
be sufficient to process Vezza’s ore.<br />
50<br />
2011 <strong>Annual</strong> <strong>Report</strong>
NOTES TO THE CONSOLIDATED FINANCIAL STATEMENTS<br />
Asset Restrictions and Contractual Commitments<br />
The Company’s assets are subject to certain restrictions on title, property, plant and equipment pledged as security for credit facility<br />
arrangements and Senior secured lenders (Note 12).<br />
Contractual obligations related to equipment under finance leases are summarized in Note 10 and under the discussion of liquidity risk in<br />
Note 15.<br />
Fair Value Determination<br />
The following outlines the Company’s methodology in assessing impairments and determining recoverable amounts, as necessary in<br />
accordance with the Company’s impairment accounting policy.<br />
Existing mining interests<br />
The Company reviews mining plans for the remaining life of each property to determine the fair value of its existing mining properties,<br />
related assets, and cash-generating units. Future cash flows are estimated based on quantities of recoverable minerals, expected<br />
palladium, gold, and other commodity prices and expected foreign exchange rates (considering current, historical and expected future<br />
prices and foreign exchange rates and related factors), production levels and cash cost of production and capital and reclamation<br />
expenditures, all based on detailed life-of-mine plans and projections. The term “recoverable minerals” refers to the estimate of<br />
recoverable production from measured, indicated and inferred mineral resources that are considered economically mineable and are<br />
based on management’s confidence in converting such resources to proven and probable reserves. The estimated future cash flows<br />
are discounted to their present value using a pre-tax discount rate that reflects current market assessments of the time value of money<br />
and the risks specific to the asset.<br />
Significant changes in mine plans can occur as a result of mining experience, new discoveries, changes in mining methods and rates,<br />
process changes, investments in new equipment and technology and other factors. The Company reviews its accounting estimates<br />
and adjusts these estimates based on recoverable minerals determined by the Company in the current mine plan. Assumptions<br />
underlying future cash flow estimates are subject to risk and uncertainty. Any differences between significant assumptions and market<br />
conditions such as metal prices, exchange rates, recoverable metal, and/or the Company’s operating performance could have a<br />
material effect on the Company’s ability to recover the carrying amounts of its long-lived assets resulting in possible additional<br />
impairment charges.<br />
Mining interests acquired through a business combination<br />
The fair value of mining interests recognized as a result of a business combination is based on market values. The market value of<br />
property is the estimated amount for which a property could be exchanged on the date of valuation between a willing buyer and a<br />
willing seller in an arm’s length transaction after proper marketing wherein the parties had each acted knowledgeably and willingly.<br />
The fair value of plant, equipment, fixtures and fittings is based on the market approach and cost approaches using quoted market<br />
prices for similar items when available and replacement cost when appropriate.<br />
8. ASSET RETIREMENT OBLIGATIONS AND RECLAMATION DEPOSITS<br />
Expected timing of estimated cash flows required to settle obligations are as follows: LDI mine (2020), Sleeping Giant mill (2021), Sleeping<br />
Giant mine (2012) and Vezza Gold Project (2021). The obligation at December 31, 2011 is expected to be paid at the end of the life of each<br />
mine. The key assumptions applied for determination of the ARO obligation are as follows as at:<br />
At December 31 At December 31 At January 1<br />
2011 2010 2010<br />
Inflation 2.00 1.97 1.99<br />
Market risk 5.00 5.00 5.00<br />
Discount rate 1.84 2.62 1.50<br />
The asset retirement obligation may change materially based on future changes in operations, costs of reclamation and closure activities,<br />
and regulatory requirements. For the year ended December 31, 2010, the timing of LDI’s mining property closure plan was extended to<br />
include the Offset Zone project, which resulted in a reduction of $1.3 million in 2010 to the cost of the related restoration asset. During 2011,<br />
the mine closure obligations for the LDI mine, Sleeping Giant mine and Vezza Gold Project were revised to reflect the Company’s most<br />
current closure cost estimates, expected mine lives and market rate assumptions. The current mine closure obligations include: LDI mine<br />
($13,905), Sleeping Giant mill ($4,426), Sleeping Giant mine ($2,116) and Vezza Gold Project ($434).<br />
51<br />
2011 <strong>Annual</strong> <strong>Report</strong>
NOTES TO THE CONSOLIDATED FINANCIAL STATEMENTS<br />
The Company, in conjunction with the Ontario Ministry of <strong>North</strong>ern Development and Mines (the “Ministry”) and the Ministère des<br />
Resources naturelles et de la Faune du Québec (the “Ministère”), has established trust funds (the “Funds”) pursuant to the Company’s mine<br />
closure plan for eventual clean-up and restoration of the LDI mine site, Vezza Gold Project and the Sleeping Giant mill.<br />
The LDI mine closure plan requires a total amount of $12,997 to be accumulated in the Fund over the term of LDI’s operations. At December<br />
31, 2011, the Company had a letter of credit outstanding for $8,466 (December 31, 2010 – $8,438 was on deposit with the Ministry including<br />
accrued interest of $908).<br />
The Sleeping Giant gold mine and mill closure plan requires a total amount of $1,920 to be accumulated in the Fund. At December 31, 2011,<br />
the Company had a letter of credit outstanding for $1,769, the funds of which were received subsequent to year end (December 31, 2010 –<br />
$1,769 was on deposit with the Ministère).<br />
The Company also has a letter of credit outstanding for $317 relating to the Shebandowan West Project.<br />
The funds on deposit bear interest at current short-term deposit rates and will be returned to the Company once the mine closure<br />
is completed.<br />
At December 31, 2011, the asset retirement and the related mine restoration deposit are as follows as at:<br />
At December 31 At December 31<br />
2011 2010<br />
Asset retirement obligation, beginning of period $ 12,594 $ 13,602<br />
Change in discount rate and estimated closure costs 7,950 (1,217)<br />
Accretion expense (Note 18) 337 209<br />
Asset retirement obligation, end of period $ 20,881 $ 12,594<br />
Reclamation deposits – 10,537<br />
Obligation in excess of deposit $ 20,881 $ 2,057<br />
At the respective reporting dates, the undiscounted asset retirement obligations are as follows as at:<br />
At December 31 At December 31 At January 1<br />
2011 2010 2010<br />
Asset retirement obligation, undiscounted $ 23,653 $ 16,121 $ 14,022<br />
9. ACCOUNTS PAYABLE AND ACCRUED LIABILITIES<br />
Accounts payable and accrued liabilities are comprised of:<br />
At December 31 At December 31 At January 1<br />
2011 2010 2010<br />
Accounts payable and accrued liabilities $ 42,436 $ 28,761 $ 12,498<br />
Unrealized loss on financial contracts 1 – 11,098 –<br />
Accounts payable and accrued liabilities $ 42,436 $ 39,859 $ 12,498<br />
1 As at December 31, 2011, a total of 69,500 ounces of past palladium production that had been delivered and sold to the smelter, was priced using forward prices for the<br />
month of final settlement at an average price of $697 per ounce (December 31, 2010 – 68,950 ounces at an average price of $640 per ounce). Refer to Notes 4 and 15.<br />
52<br />
2011 <strong>Annual</strong> <strong>Report</strong>
NOTES TO THE CONSOLIDATED FINANCIAL STATEMENTS<br />
10. LEASES<br />
At the respective reporting dates, the Company was party to the following leasing arrangements:<br />
FINANCE LEASES (OBLIGATIONS UNDER FINANCE LEASES)<br />
The Company leases production equipment under a number of finance lease agreements. Some leases provide the Company with the option<br />
to purchase the equipment at a beneficial price. The leased equipment secures lease obligations. The net carrying amount of leased plant<br />
and equipment at each reporting date is summarized in Note 7 under the category of equipment under finance leases.<br />
The following is a schedule of future minimum lease payments under finance leases together with the present value of the net minimum<br />
lease payments at each reporting date:<br />
December 31, 2011 December 31, 2010 January 1, 2010<br />
Present Present Present<br />
Future Value of Future Value of Future Value of<br />
minimum minimum minimum minimum minimum minimum<br />
lease lease lease lease lease lease<br />
payments Interest payments payments Interest payments payments Interest payments<br />
Less than one year $ 2,677 $ 249 $ 2,428 $ 1,307 $ 111 $ 1,196 $ 605 $ 47 $ 558<br />
Between one and five years 2,228 124 2,104 1,253 58 1,195 619 43 576<br />
More than five years – – – – – – – – –<br />
$ 4,905 $ 373 $ 4,532 $ 2,560 $ 169 $ 2,391 $ 1,224 $ 90 $ 1,134<br />
Less current portion 2,428 1,196 558<br />
$ 2,104 $ 1,195 $ 576<br />
OPERATING LEASES<br />
The Company, from time to time, enters into leasing arrangements for production and other equipment under a number of operating leases.<br />
These leases are generally short-term in nature and subject to cancellation clauses. The Company periodically reviews the nature of these<br />
leases to identify if there have been any significant changes to the terms and use of the items under operating lease which would require<br />
reclassification as a finance lease. Such changes are considered to indicate a renewal of the lease terms and the reclassification is applied<br />
prospectively from the date the revised lease terms become effective.<br />
The following schedule provides the future minimum lease payments under non-cancellable operating leases outstanding at each of the<br />
reporting dates:<br />
At December 31 At December 31 At January 1<br />
2011 2010 2010<br />
Less than one year $ 3,783 $ 2,057 $ 659<br />
Between one and five years 2,918 1,611 602<br />
More than five years 193 447 95<br />
$ 6,894 $ 4,115 $ 1,356<br />
The total minimum lease payments recognized in expense during each of the stated year end periods are as follows:<br />
At December 31 At December 31<br />
2011 2010<br />
Minimum lease payments expensed $ 3,631 $ 1,725<br />
53<br />
2011 <strong>Annual</strong> <strong>Report</strong>
NOTES TO THE CONSOLIDATED FINANCIAL STATEMENTS<br />
11. PROVISIONS<br />
In conjunction with the acquisition of Cadiscor Resources Inc. in 2009, the Company assumed an obligation in the amount of $1,000, payable<br />
in cash or by the issuance of common shares of the Company, upon achieving a specified production target of 300,000 milled tonnes of ore<br />
at its Sleeping Giant mill. Based on stated production targets, the Company expects to achieve the production target within the next twelve<br />
months, therefore, the provision is reflected in current liabilities. There have been no changes to this provision in any of the reporting<br />
periods reflected in these consolidated statements.<br />
12. LONG-TERM DEBT<br />
During the fourth quarter of 2011, the Company issued $72.0 million of senior secured notes by way of a private placement for net proceeds<br />
of $69.6 million. The notes which mature on October 4, 2014, with a one-year extension at the option of the Company, were issued in $1,000<br />
denominations and bear interest at a rate of 9.25% per year, payable semi-annually.<br />
The Company also issued one warrant with each $1,000 note. Each warrant entitles the holder to purchase 0.35 ounces of palladium at a<br />
purchase price of US$620 (the “Strike Price”) per ounce, anytime up to October 4, 2014. If the warrants are exercised, settlement will occur<br />
in cash with the Company paying each warrant held by the note holder the difference between the average of the U.S. dollar palladium<br />
afternoon fixing price per ounce on the London Platinum and <strong>Palladium</strong> Market for the ten trading days prior to the exercise date less the<br />
Strike Price, multiplied by 0.35. Alternatively, the Company has the option to settle the amount owing to the warrant holder at a 7% discount<br />
to the 5-day weighted average market price of the common shares of the Company at the date of exercise. At December 31, 2011, the value<br />
of the warrants was $4,968, including a loss recognized in the Company’s consolidated statement of loss and comprehensive loss of $462.<br />
The debt agreement included the debt financing and embedded derivatives relating to the warrants, warrants settlement, and extension<br />
options relating to the notes which are available to the Company and the lender. Where applicable, the embedded derivatives which were<br />
not closely related to the debt financing’s were segregated and grouped for valuation and reporting purposes. The embedded derivatives<br />
relating to the debt financing are recorded at fair value through profit or loss at each reporting date.<br />
On the October 4, 2011 issue date and at December 31, 2011, the warrants and related options were valued using a binomial model which<br />
included the following key assumptions:<br />
December 31 October 4<br />
2011 2011<br />
Market price of palladium $ 636 $ 588<br />
Strike price $ 620 $ 620<br />
Volatility 43% 44%<br />
Risk free rate 0.98% 1.02%<br />
Expected life (in years) 2.76 3.00<br />
The debt financing was initially valued on October 4, 2011 at the net value of the proceeds from the debt issue after deducting the derivative<br />
valuations. Transaction costs were allocated to the debt financing on a pro-rata basis of assigned fair value at October 4, 2011. The net<br />
value of the debt is amortized using the effective interest rate method over the remaining term of the debt with interest and accretion<br />
charges being recognized through profit and loss in the period incurred. Interest charges have been capitalized as borrowing costs and<br />
included in mining interests (Note 7). An effective interest rate of 13% has been applied.<br />
13. RELATED PARTY TRANSACTIONS<br />
At the respective reporting dates, the Company’s subsidiaries are as follows:<br />
Ownership interest<br />
Country of At December 31 At December 31 At January 1<br />
incorporation 2011 2010 2010<br />
Lac des Iles Mines Ltd. (“LDI”) Canada 100% 100% 100%<br />
NAP Quebec Mines Ltd. (“NAP Quebec”)<br />
(formerly Cadiscor Resources Inc.(“CRI”)) Canada 100% 100% 100%<br />
54<br />
2011 <strong>Annual</strong> <strong>Report</strong>
NOTES TO THE CONSOLIDATED FINANCIAL STATEMENTS<br />
Transactions with Key Management Personnel<br />
Key management personnel compensation<br />
The Company provides non-cash benefits to directors and executive officers, and contributes to a defined contribution plan on their behalf<br />
in addition to regular salaried amounts. In accordance with the terms of the Corporate Stock Option plan, directors and executive officers<br />
are entitled to receive stock-based compensation on an annual basis through participation in the Company’s group registered retirement<br />
savings plan and through incentives issued under the Company’s corporate stock option and restricted share unit plans. Refer to Note 14.<br />
Summary of key management personnel compensation<br />
December 31 December 31<br />
2011 2010<br />
Short-term employee benefits $ 2,709 $ 2,723<br />
Post employment benefits 72 25<br />
Share-based payments 2,339 2,821<br />
$ 5,120 $ 5,569<br />
14. SHAREHOLDERS’ EQUITY<br />
(a)<br />
(b)<br />
Authorized and Issued Capital Stock<br />
The authorized capital stock of the Company consists of an unlimited number of common shares.<br />
Common share purchase warrants<br />
The changes in issued common share purchase warrants for the period end are summarized below:<br />
As at December 31 2011 As at December 31 2010<br />
Warrants Amount Warrants Amount<br />
Balance beginning of period 13,837,924 $ 5,113 9,530,000 $ 2,546<br />
Issued pursuant to unit offerings, net of issue costs – – 10,000,000 4,423<br />
Warrants exercised (5,009,986) (1,239) (5,692,076) (1,856)<br />
Warrants expired (8,827,938) (3,874) – –<br />
Balance, end of period – $ – 13,837,924 $ 5,113<br />
In September 2009, the Company completed an equity offering for total net proceeds of $46,455. In October 2009, the Company issued<br />
additional units for total net proceeds of $7,121. Each whole warrant (Series A warrants) entitled the holder to purchase an additional<br />
common share at a price of $4.25, subject to adjustment, at any time on or prior to September 30, 2011. Since the 20-day volume<br />
weighted average price of the common shares on the TSX was equal to or greater than $5.75 per share (as per the acceleration event<br />
in the warrant indenture), on December 8, 2010 the Company announced the acceleration of the expiry of the Series A warrants to<br />
January 14, 2011. During the first quarter of 2011, $21.3 million of proceeds were received from the exercise of 5,009,986 Series A<br />
warrants. Total proceeds of $38.8 million were received from the exercise of Series A warrants and 67,938 Series A warrants were not<br />
exercised prior to expiry.<br />
On April 28, 2010, the Company completed an equity offering of 20,000,000 units at a price of $5.00 per unit for total net proceeds of<br />
$94,227 (issue costs $5,773). Each unit consists of one common share and one-half of one common share purchase warrant of the<br />
Company. Each whole warrant (Series B warrants) entitles the holder to purchase an additional common share at a price of $6.50,<br />
subject to adjustment, at any time prior to October 28, 2011. As at December 31, 2010, 1,240,000 Series B warrants were exercised for<br />
total proceeds of $8.1 million. On October 28, 2011, the remaining Series B warrants expired.<br />
55<br />
2011 <strong>Annual</strong> <strong>Report</strong>
NOTES TO THE CONSOLIDATED FINANCIAL STATEMENTS<br />
(c)<br />
(d)<br />
(e)<br />
Group Registered Retirement Savings Plan<br />
The Company has a group registered retirement savings plan, in which eligible employees can participate at their option. The Company<br />
is required to make contributions on a quarterly basis equivalent to 3% of eligible employees’ base compensation and up to an<br />
additional 2% matching, per employee per annum, made either in cash or treasury shares of the Company. The maximum number of<br />
common shares available for grant shall not exceed 10% of the issued and outstanding common shares of the Company, including the<br />
issuance under the Corporate Stock Option Plan and other securities-based compensation plans. If the matching contribution is made<br />
in treasury shares, the price per share issued is the 5-day volume weighted average trading price of the common shares on the<br />
Toronto Stock Exchange (“TSX”) preceding the end of the quarter. During the year ended December 31, 2011, the Company contributed<br />
203,252 shares with a fair value of $841 (2010 – 85,093 shares with a fair value of $339).<br />
Flow-through Share Offering<br />
On February 18, 2011, the Company completed a flow-through share offering of 2,667,000 flow-through common shares. The Company is<br />
required to spend gross proceeds of $22,000 on Canadian exploration expenses prior to December 31, 2012, which was fulfilled by<br />
December 31, 2011.<br />
Corporate Stock Option Plan<br />
The Company has a Corporate Stock Option Plan (the “Plan”), under which eligible directors, officers, employees and consultants of the<br />
Company may receive options to acquire common shares. The Plan is administered by the Board of Directors, which will determine after<br />
considering recommendations made by the Compensation Committee, the number of options to be issued, the exercise price (which is<br />
the 5-day volume weighted average trading price of the common shares on the TSX on the trading day prior to the grant date), expiration<br />
dates of each option, the extent to which each option is exercisable (provided that the term of an option shall not exceed 10 years from<br />
the date of grant), as well as establishing the time period should the optionee cease to be an “Eligible Person” as set forth in the<br />
conditions of the Plan. One third of options granted vest on each of the first three anniversary dates of the date of grant.<br />
The maximum number of common shares available for grant shall not exceed 10% of the issued and outstanding common shares of the<br />
Company, including the issuance under the Group Retirement Savings Plan and other securities-based compensation plans. As at<br />
December 31, 2011, 5,853,717 options (December 31, 2010 – 5,968,386 options, January 1, 2010 – 1,511,190 options) were available to be<br />
granted under the Plan.<br />
The following summary sets out the activity in outstanding common share purchase options:<br />
As at December 31 2011 As at December 31 2010<br />
Weighted<br />
Weighted<br />
Average<br />
Average<br />
Options Exercise Price Options Exercise Price<br />
Outstanding, beginning of period 3,847,833 $ 4.22 3,057,800 $ 3.50<br />
Granted 273,000 $ 5.45 1,105,000 $ 6.14<br />
Exercised (317,919) $ <strong>2.13</strong> (124,634) $ 2.78<br />
Cancelled (158,331) $ 5.73 (190,333) $ 4.80<br />
Forfeited – – – –<br />
Outstanding, end of period 3,644,583 $ 4.43 3,847,833 $ 4.22<br />
Options exercisable at end of period 2,439,925 $ 4.06 1,742,833 $ 3.64<br />
For the year ended December 31, 2011, the weighted average share price on the dates common share purchase options were<br />
exercised was $3.57 (2010 – $6.00).<br />
The following table summarizes information about the Company’s stock options outstanding at December 31, 2011:<br />
Average Options Options<br />
remaining Outstanding Exercisable<br />
contractual life at at<br />
Exercise price range (years) December 31, 2011 December 31, 2011<br />
$ 1.85–3.00 4.83 974,750 908,084<br />
$ 3.00–3.50 4.38 1,181,666 830,005<br />
$ 3.50–6.50 4.91 1,181,667 518,336<br />
$ 6.50–12.00 2.52 306,500 183,500<br />
4.51 3,644,583 2,439,925<br />
56<br />
2011 <strong>Annual</strong> <strong>Report</strong>
NOTES TO THE CONSOLIDATED FINANCIAL STATEMENTS<br />
The fair value of options granted during 2011 and 2010 has been estimated at the date of grant using the Black-Scholes option pricing<br />
model with the following weighted average assumptions:<br />
December 31 December 31<br />
2011 2010<br />
Awards granted 273,000 1,105,000<br />
Weighted average fair value of awards $ 2.91 $ 3.21<br />
Pre-vest forfeiture rate 14% 13%<br />
Grant price $ 5.45 $ 6.14<br />
Market price $ 5.53 $ 6.05<br />
Volatility 65% 66%<br />
Risk-free rate 2.04% 2.31%<br />
Dividend yield 0% 0%<br />
Expected life (in years) 4.3 4.5<br />
Pre-vest forfeiture rate<br />
The historical forfeiture rate is estimated at each reporting date based on previous data regarding pre-vest cancellations of options<br />
due to employee departures or terminations.<br />
Volatility<br />
Volatility is the projected magnitude of change in price of the common shares of the Company on an annual basis based on historical<br />
prices of the common shares, excluding time periods with unusual business and market conditions that result in extreme volatility that<br />
is not indicative of the future.<br />
(f)<br />
(g)<br />
Reconciliation of the diluted number of shares outstanding:<br />
For the years ended December 31, 2011 and December 31, 2010, the effect of stock options and warrants has not been included in the<br />
determination of diluted loss per share because to do so would be anti-dilutive.<br />
Other Stock-Based Compensation – Restricted Share Unit Plan<br />
The Company has a Restricted Share Unit (“RSU”) Plan under which eligible directors, officers and key employees of the Company are<br />
entitled to receive awards of restricted share units. Each restricted share unit is equivalent in value to the fair market value of a<br />
common share of the Company on the date of the award and a corresponding liability is established on the balance sheet. The RSU<br />
Plan is administered by the Board of Directors, which will determine after considering recommendations made by the Compensation<br />
Committee, the number and timing of restricted share units to be awarded and their vesting periods, not to exceed three years. The<br />
value of each award is charged to compensation expense over the period of vesting. At each reporting date, the compensation<br />
expense and liability are adjusted to reflect the changes in market value of the liability based on the fair values of RSUs for each<br />
vesting period determined using the Black-Scholes model.<br />
As at December 31, 2011, 129,418 (December 31, 2010 – 90,599; January 1, 2010 – 256,882) restricted share units had been granted and<br />
were outstanding at an aggregate value of $237 (December 31, 2010 – $312; January 1, 2010– $987).<br />
(h)<br />
(i)<br />
Shareholder Rights Plan<br />
On May 11, 2011, the Company’s shareholders approved the adoption of a shareholder rights plan. The primary objectives of the<br />
shareholder rights plan are to ensure shareholders are given fair treatment in the event of any takeover bid for the Company’s common<br />
shares and provide Shareholders adequate time to properly evaluate an offer. The Shareholder Rights Plan provides for the issuance<br />
of one right for each outstanding common share of the Company on the occurrence of certain events.<br />
Summary of Share-based Compensation and Employee Benefits<br />
The following table details the components of share-based compensation expense for the year ended December 31:<br />
At December 31 At December 31<br />
2011 2010<br />
Registered retirement savings plan $ 841 $ 339<br />
Common share purchase options 2,563 1,572<br />
Restricted share units 135 245<br />
$ 3,539 $ 2,156<br />
57<br />
2011 <strong>Annual</strong> <strong>Report</strong>
NOTES TO THE CONSOLIDATED FINANCIAL STATEMENTS<br />
15. FINANCIAL INSTRUMENTS<br />
The Company has exposure to the following risks from its use of financial instruments: credit risk, market risk, currency risk, interest rate<br />
risk, commodity price risk and liquidity risk.<br />
Credit Risk<br />
Credit risk is the risk of financial loss to the Company if a customer or counterparty to a financial instrument fails to meet its contractual<br />
obligations. The Company’s exposure arises principally from its short term interest bearing deposits and accounts receivable. Historically,<br />
the Company has not experienced any losses related to individual customers. The Company invests its cash and cash equivalents primarily<br />
with a major Canadian bank.<br />
The carrying amount of financial assets represents the maximum credit exposure. The maximum exposure to credit risk at the reporting<br />
date was:<br />
At December 31 At December 31 At January 1<br />
2011 2010 2010<br />
Cash and cash equivalents $ 50,935 $ 75,159 $ 98,255<br />
Accounts receivable 73,048 80,683 –<br />
Other assets 10,560 24,996 1,330<br />
$ 134,543 $ 180,838 $ 99,585<br />
Market Risk<br />
Market risk is the risk that the fair value or future cash flows of a financial instrument will fluctuate because of changes in market prices.<br />
Market risk is comprised of currency, interest rate, and commodity price risks. In addition, the Company is exposed to market risk relating to<br />
fluctuations in the share price of the Company’s common shares as a result of the RSU plan, which is mark-to-market at each period end.<br />
(a)<br />
Currency Risk<br />
Currency risk is the risk that the fair value or future cash flows of a financial instrument will fluctuate because of changes in foreign<br />
exchange rates. Currency risk is related to the portion of the Company’s business transactions denominated in currencies other than<br />
Canadian dollars. The Company is exposed to fluctuations in exchange rates due to certain of its foreign based suppliers and revenues<br />
being in foreign currencies. The Company’s primary exposure is based upon the movements of the U.S. dollar against the Canadian<br />
dollar. The Company’s foreign exchange risk management includes, from time to time, the use of foreign currency forward contracts to<br />
fix exchange rates on certain foreign currency exposures. The Company had not entered into any foreign exchange contracts on<br />
future production in 2011 or 2010.<br />
For the Company’s foreign exchange transactions, fluctuations in the respective exchange rates relative to the Canadian dollar will<br />
create volatility in the Company’s cash flows and the reported amounts for revenue, production, and exploration costs on a year-toyear<br />
basis. Additional earnings volatility arises from the translation of monetary assets and liabilities denominated in currencies other<br />
than Canadian dollars at the rates of exchange at each balance sheet date, the impact of which is reported as a separate component<br />
of revenue or foreign exchange gain or loss in the consolidated statements of operations and comprehensive loss.<br />
The Company is exposed to the following currency risk on cash, purchases and borrowings at December 31, 2011.<br />
Cash $ 3,898<br />
Accounts payable and accrued liabilities (370)<br />
US$<br />
$ 3,529<br />
A 1% strengthening or weakening of the Canadian dollar against the U.S. dollar, assuming that all other variables remained the same,<br />
would have resulted in an approximate $35 decrease or increase, respectively, in the Company’s statement of loss and comprehensive<br />
loss for the year ended December 31, 2011.<br />
The Company’s revenue is affected by currency exchange rates, such that a weakening in the Canadian dollar relative to the U.S.<br />
dollar will result in additional revenues and a strengthening in the Canadian dollar will result in reduced revenues.<br />
(b)<br />
Interest Rate Risk<br />
Interest rate risk is the risk that the fair value or future cash flows of a financial instrument will fluctuate because of changes in market<br />
interest rates. The Company does not enter into derivative financial instruments for speculative purposes. The Company does not hold<br />
any specific hedging instruments, nor does it hold any short term investments that would be significantly impacted from fluctuations in<br />
interest rates. Any interest rate fluctuations realized are expected to be offset by favourable changes in the interest on debt instruments.<br />
Management does not believe that the net impact of interest rate fluctuations on the current level of borrowings and short term<br />
investments will be significant and, therefore, has not provided a sensitivity analysis of this impact on net earnings.<br />
58<br />
2011 <strong>Annual</strong> <strong>Report</strong>
NOTES TO THE CONSOLIDATED FINANCIAL STATEMENTS<br />
(c)<br />
Commodity Price Risk<br />
Commodity price risk is the risk that the fair value or future cash flows of a financial instrument will fluctuate because of changes in<br />
commodity prices. The Company is particularly exposed to fluctuations in commodity prices from its sale of metals. From time to time<br />
the Company may enter into forward commodity sales contracts to hedge the effect on revenues of changes in the price of metals it<br />
produces. Gains and losses on derivative financial instruments used to mitigate metal price risk are recognized in revenue from metal<br />
sales over the term of the hedging contract.<br />
The Company enters into financial contracts to mitigate the smelter agreements’ provisional pricing exposure to rising or declining<br />
palladium prices and an appreciating Canadian dollar for past production already sold. The total of these financial contracts represent<br />
69,500 ounces as at December 31, 2011. These contracts mature from January 2012 through June 2012 at an average forward price of<br />
$697 per ounce (or $US699 per ounce). For substantially all of the palladium delivered to the customer under the smelter agreement,<br />
the quantities and timing of settlement specified in the financial contracts matches final pricing settlement periods. The palladium<br />
financial contracts are being recognized on a mark-to-market basis as an adjustment to revenue. The fair value of these contracts at<br />
December 31, 2011 was an asset of $1,951 included in accounts receivable (December 31, 2010 – $11,098 liability included in accounts<br />
payable and accrued liabilities).<br />
The Company issued $72.0 million of senior secured notes by way of a private placement for net proceeds of $69.6 million. The<br />
Company also issued one warrant with each $1,000 note. Each warrant entitles the holder to purchase 0.35 ounces of palladium at a<br />
purchase price of US$620 (the “Strike Price”) per ounce, anytime up to October 4, 2014. If the warrants are exercised, settlement will<br />
occur in cash with the Company paying each warrant held by the note holder the difference between the average of the U.S. dollar<br />
palladium afternoon fixing price per ounce on the London Platinum and <strong>Palladium</strong> Market for the ten trading days prior to the exercise<br />
date less the Strike Price, multiplied by 0.35. Alternatively, the Company has the option to settle the amount owing to the warrant<br />
holder at a 7% discount to 5-day weighted average market price of the common shares of the Company at the date of exercise. At<br />
December 31, 2011, the value of the warrants was $4,968, including a loss recognized in the Company’s consolidated statement of loss<br />
and comprehensive loss of $462.<br />
Liquidity Risk<br />
Liquidity risk is the risk that the Company will not be able to meet its financial obligations as they fall due. The Company’s approach to<br />
managing liquidity risk is to monitor the timing of sales and receivables, to ensure sufficient cash flows are generated from operations<br />
to meet the current debt requirements. Where insufficient liquidity may exist, the Company may pursue various debt and equity<br />
instruments for short or long term financing of its operations.<br />
The table below analyzes the Company’s financial liabilities which will be settled into relevant maturity groupings based on the<br />
remaining balances at December 31, 2011 to the contractual maturity date.<br />
In less than Between 1 year More than<br />
Total 1 year and 5 Years 5 years<br />
Accounts payable and accrued liabilities $ 42,436 $ 42,436 $ – $ –<br />
Obligations under finance leases 4,532 2,428 2,104 –<br />
Provisions 1,000 1,000 – –<br />
Current derivative liability 4,875 – 4,875 –<br />
Long-term debt 65,698 – 65,698 –<br />
The Company also has asset retirement obligations in the amount of $20,881 that would become payable at the time of the closures of<br />
its LDI mine, Sleeping Giant mill, Sleeping Giant mine and Vezza Gold Project. The Company issued letters of credit of $10,552. As a<br />
result, $10,329 of funding is required prior to or upon closure of these properties. Refer to Note 8 for additional disclosure regarding<br />
these amounts. The majority of the asset retirement costs are expected to be incurred within one year of mine closure and an<br />
application must be made to receive funds on deposit.<br />
Management monitors consolidated cash flow, in detail, on a daily basis, monthly through month-end reporting, quarterly through<br />
forecasting and yearly through the budget process. Based on the financial liabilities due and noted above, the Company expects to<br />
have sufficient operating cash flow exceeding the amounts due.<br />
Fair Values<br />
The Company’s financial assets and liabilities consist of cash and cash equivalents, accounts receivable, other assets, reclamation<br />
deposits, accounts payable and accrued liabilities, current derivative liabilities, obligations under finance leases, provisions and longterm<br />
debt.<br />
Cash and cash equivalents are stated at fair value. The carrying value of other assets, and trade accounts payable and accrued<br />
liabilities approximate their fair values due to the immediate or short-term maturity of these financial instruments.<br />
The fair value of the obligations under finance leases approximate their carrying value due to the interest rate implicit in the leases<br />
approximating interest rates available at this time for similar lease terms. The fair value of RSUs are determined as described in Note 14.<br />
59<br />
2011 <strong>Annual</strong> <strong>Report</strong>
NOTES TO THE CONSOLIDATED FINANCIAL STATEMENTS<br />
Derivatives<br />
The fair value of forward exchange contracts is based on their listed market price, if available. If a listed market price is not available,<br />
then fair value is estimated by discounting the difference between the contractual forward price and the current forward price for the<br />
residual maturity of the contract using a risk-free interest rate.<br />
Fair values reflect the credit risk of the instrument and include adjustments to take into account the credit risk of the Company entity<br />
and counterparty when appropriate.<br />
The Company enters into financial contracts to mitigate the smelter agreements’ provisional pricing exposure to rising or declining<br />
palladium prices and an appreciating Canadian dollar for past production already sold. For substantially all of the palladium delivered to the<br />
customer under the smelter agreement, the quantities and timing of settlement specified in the financial contracts matches final pricing<br />
settlement periods. The palladium financial contracts are being recognized on a mark-to-market basis as an adjustment to revenue.<br />
Non-derivative Financial Liabilities<br />
Fair value, which is determined for disclosure purposes, is calculated based on the present value of future principal and interest cash<br />
flows, discounted at the market rate of interest at the reporting date. For finance leases the market rate of interest is determined by<br />
reference to similar lease agreements.<br />
Fair Value Hierarchy<br />
The table below details the assets and liabilities measured at fair value at December 31, 2011:<br />
Quoted Prices<br />
Significant<br />
in Active Other Significant<br />
Markets for Observable Unobservable<br />
Identical Assets Inputs Inputs Aggregate<br />
(Level 1) (Level 2) (Level 3) Fair Value<br />
Financial assets<br />
Cash and cash equivalents $ 50,935 $ – $ – $ 50,935<br />
Accounts receivable (Note 4) – 71,097 – 71,097<br />
Fair value of financial contracts* (Note 4) – 1,951 – 1,951<br />
Financial liabilities<br />
RSU liabilities* – (237) – (237)<br />
Fair value of current derivative liability (Note 12) – (4,875) – (4,875)<br />
Net carrying value $ 50,935 $ 67,936 $ – $ 118,871<br />
* As detailed in Note 4, the asset relating to the mark to market on financial contracts is included in the carrying value of accounts receivable and accrued liabilities<br />
on the balance sheet. RSU liabilities are measured at fair value based on the Black-Scholes valuation model at each reporting date and are included in the balance<br />
of accounts payable and accrued liabilities.<br />
16. COMMITMENTS<br />
(a) Sheridan Platinum Group of Companies (“SPG”) Commitment<br />
The Company is required to pay a 5% net smelter royalty to SPG from mining operations at the Lac des Iles mine. This obligation is recorded<br />
as royalty expense.<br />
(b) Operating Leases and Other Purchase Obligations<br />
As at December 31, 2011, the Company had outstanding operating lease commitments and other purchase obligations of $6,894 and $110,612,<br />
respectively (December 31, 2010 – $4,115 and $37,189, respectively) all of which had maturities of less than five years, with the exception of<br />
$193 of operating leases with a maturity greater than five years (December 31, 2010 – $447).<br />
(c) Letters of Credit<br />
As at December 31, 2011, the Company had outstanding letters of credit of $12.0 million, consisting of letters of credit for mine closure<br />
deposits of $8,466, $1,769 and $317 relating to the LDI, SG and Shebandowan properties, respectively. There are also letters of credit of<br />
$1,498 required as part of a regulatory requirement by a third party supplier for purchases made by the LDI mine.<br />
60<br />
2011 <strong>Annual</strong> <strong>Report</strong>
NOTES TO THE CONSOLIDATED FINANCIAL STATEMENTS<br />
17. REVENUE FROM METAL SALES<br />
Other<br />
Total <strong>Palladium</strong> Platinum Gold Nickel Copper Metals<br />
2011<br />
Year ended December 31<br />
Revenue – before<br />
pricing adjustments $ 175,293 $ 107,035 $ 15,369 $ 37,384 $ 7,914 $ 6,133 $ 1,458<br />
Pricing adjustments:<br />
Commodities (5,407) (3,229) (1,691) 223 (361) (326) (23)<br />
Foreign exchange 586 198 189 167 32 (3) 3<br />
Revenue – after pricing adjustments $ 170,472 $ 104,004 $ 13,867 $ 37,774 $ 7,585 $ 5,804 $ 1,438<br />
2010<br />
Year ended December 31<br />
Revenue – before<br />
pricing adjustments $ 99,714 $ 56,887 $ 8,280 $ 27,196 $ 4,198 $ 2,443 $ 710<br />
Pricing adjustments:<br />
Commodities 8,941 7,417 649 428 183 275 (11)<br />
Foreign exchange (1,557) (953) (270) (172) (98) (59) (5)<br />
Revenue – after pricing adjustments $ 107,098 $ 63,351 $ 8,659 $ 27,452 $ 4,283 $ 2,659 $ 694<br />
During 2011, the Company delivered all of its concentrate to two customers under the terms of the respective agreements. In 2010, the<br />
Company delivered all of its concentrate to one customer under the terms of the agreement.<br />
Although the Company sells its refined metals to a limited number of customers, it is not economically dependent upon any one customer as<br />
there are other markets throughout the world for the Company’s metals.<br />
18. INTEREST AND OTHER COSTS (INCOME)<br />
2011 2010<br />
Finance expense<br />
Interest on finance leases $ 157 $ 142<br />
Financing costs 767 –<br />
Asset retirement obligation accretion 337 209<br />
Accretion expense on long-term debt 457 –<br />
Interest expense 396 424<br />
Unrealized loss on palladium warrants 460 –<br />
2,574 775<br />
Finance and other income<br />
Gain on renouncement of flow-through expenditures (1,840) –<br />
Interest income (977) (2,861)<br />
Gain on investments – (56)<br />
(2,817) (2,917)<br />
$ (243) $ (2,142)<br />
19. CONTINGENCIES<br />
From time to time, the Company is involved in litigation, investigations, or proceedings related to claims arising out of its operations in the<br />
ordinary course of business. In 2011, the Company was made aware of a Statement of Claim that had been filed against the Company and<br />
two of its officers regarding a potential class action lawsuit. The Company has retained legal counsel and intends to vigorously defend the<br />
potential claim. The Company does not believe the Statement of Claim has any merit and has accordingly not recorded any associated<br />
provisions within its consolidated financial statements at December 31, 2011.<br />
61<br />
2011 <strong>Annual</strong> <strong>Report</strong>
NOTES TO THE CONSOLIDATED FINANCIAL STATEMENTS<br />
20. INCOME TAXES<br />
Rate Reconciliation<br />
The provision for income and mining taxes differs from the amount that would have resulted by applying the combined Canadian Federal and<br />
Ontario statutory income tax rates of approximately 28% (2010 – 31%):<br />
December 31 December 31<br />
2011 2010<br />
Income tax expense/(recovery) using statutory income tax rates $ (17,556) $ (9,462)<br />
Increase (decrease) resulting from:<br />
Resource allowance deemed income – (315)<br />
Non-taxable portion of capital losses (gains) – 296<br />
Losses not tax benefited 17,484 8,617<br />
Non-deductible expenses 730 443<br />
Ontario Harmonization Transitional tax, in respect of the prior period 2,387 (280)<br />
Other (107) (100)<br />
Recognition of previously unrecognized tax benefits related to expiration of warrants1 (555) (542)<br />
Interest expense deductible for tax purposes (444) –<br />
Difference in statutory tax rates (214) 104<br />
Quebec mining duties 1,282 127<br />
Income and mining tax expense (recovery) $ 3,007 $ (1,112)<br />
1 Tax recovery on the expiration of share purchase warrants, whereas the deferred tax liability was charged to Contributed Surplus.<br />
2 The statutory tax rate decreased from 2010 to 2011 due to a reduction in Canadian Federal and Ontario rates over the period.<br />
Components of Income tax expense<br />
The details of the Company’s income and mining tax expense (recovery) are as follows:<br />
December 31 December 31<br />
2011 2010<br />
Current income tax expense (recovery):<br />
Income taxes<br />
Adjustments for prior period1 $ 2,280 $ (697)<br />
Mining taxes<br />
Current period (1,936) (137)<br />
Adjustments for prior period2 161 (109)<br />
$ 505 $ (943)<br />
Deferred income tax expense (recovery):<br />
Income taxes (555) (542)<br />
Mining taxes 3,057 373<br />
$ 2,502 $ (169)<br />
Total $ 3,007 $ (1,112)<br />
1 Impact of a proposed CRA reassessment received in 2011 related to the Company’s Ontario harmonization tax liability.<br />
2 Impact of tax legislation substantively enacted in 2011 that affects the tax obligations of prior years.<br />
Deferred tax liabilities<br />
The following table summarizes the components of deferred income and mining tax:<br />
December 31 December 31 January 1<br />
2011 2010 2010<br />
Deferred mining tax liabilities<br />
Gold Mining interests $ (4,264) $ (1,207) $ (832)<br />
Deferred tax liabilities, net $ (4,264) $ (1,207) $ (832)<br />
62<br />
2011 <strong>Annual</strong> <strong>Report</strong>
NOTES TO THE CONSOLIDATED FINANCIAL STATEMENTS<br />
Unrecognized Deferred Tax Assets<br />
Deferred income and mining tax assets have not been recognized in respect of the following items:<br />
December 31 December 31<br />
2011 2010<br />
Loss carryforwards $ 89,862 $ 67,313<br />
Deductible temporary differences, income taxes $ 33,599 $ 28,062<br />
Deductible temporary differences, mining taxes $ 9,183 $ 6,640<br />
The tax losses not recognized expire as per the amount and years noted below. The deductible temporary differences do not expire under<br />
current tax legislation. Deferred tax assets have not been recognized in respect of these items because it is not probable that future taxable<br />
profit will be available against which the Company can utilize the benefits therefrom.<br />
Income Tax Attributes (not recognized)<br />
As at December 31, 2011, the Company had the following approximate income tax attributes to carry forward:<br />
Amount<br />
Expiry Date<br />
Non-capital losses $ 352,193 2015–2031<br />
Capital losses $ 7,243 Indefinite<br />
Undepreciated capital cost allowance $ 172,018 Indefinite<br />
Tax basis of mineral interests $ 176,649 Indefinite<br />
21. OTHER DISCLOSURES<br />
Statement of Cash Flows<br />
The net changes in non-cash working capital balances related to operations are as follows:<br />
2011 2010<br />
Cash provided by (used in):<br />
Accounts receivable $ 7,635 $ (80,683)<br />
Inventories and stockpiles 7,436 (1,953)<br />
Other assets (3,481) (5,279)<br />
Accounts payable and accrued liabilities 2,823 27,417<br />
Other financial liabilities – (56)<br />
Taxes payable (recoverable) (1,441) (1,167)<br />
$ 12,972 $ (61,721)<br />
Salaries and Benefits<br />
For the year ended December 31, 2011, total salaries and benefits for the Company was $44,272, compared to $33,884 for the year ended<br />
December 31, 2010.<br />
22. SEGMENT INFORMATON<br />
The Company is Canadian based and is in the business of exploring and mining palladium, platinum, gold and certain base metals. Its<br />
operations are organized into three reportable segments: palladium operations include the LDI palladium mine and mill; gold operations<br />
include the Sleeping Giant gold mine and mill; and corporate and other. The palladium and gold operations include activities related to<br />
exploration, evaluation and development, mining, and milling. The corporate and other segment includes general corporate expenses and<br />
other projects not allocated to the other segments. The Company’s revenue by significant product type is disclosed in Note 17. The<br />
Company’s segments are summarized in the following table.<br />
63<br />
2011 <strong>Annual</strong> <strong>Report</strong>
NOTES TO THE CONSOLIDATED FINANCIAL STATEMENTS<br />
As at and during the periods ended December 31, 2011, December 31, 2010 and January 1, 2010, segmented information is presented<br />
as follows:<br />
At December 31, 2011 At December 31, 2010 At January 1, 2010<br />
<strong>Palladium</strong> Gold Corporate <strong>Palladium</strong> Gold Corporate <strong>Palladium</strong> Gold Corporate<br />
operations operations and other Total operations operations and other Total operations operations and other Total<br />
Cash and cash<br />
equivalents $ 1,456 $ 71 $ 49,408 $ 50,935 $ 3,232 $ (2,013) $ 73,940 $ 75,159 $ 689 $ 576 $ 96,990 $ 98,255<br />
Accounts<br />
receivable 73,048 – – 73,048 80,683 – – 80,683 – – – –<br />
Inventories 12,342 7,704 – 20,046 19,673 7,814 – 27,487 19,649 5,657 – 25,306<br />
Other current<br />
assets 5,558 9,033 1,266 15,857 4,308 3,048 20,929 28,285 708 1,510 481 2,699<br />
Mining interests 211,505 44,433 221 256,159 64,465 61,376 445 126,286 33,516 51,165 333 85,014<br />
Other noncurrent<br />
assets – – – – 8,438 1,769 330 10,537 8,406 1,769 328 10,503<br />
Total assets $ 303,909 $ 61,241 $ 50,895 $ 416,045 $ 180,799 $ 71,994 $ 95,644 $ 348,437 $ 62,968 $ 60,677 $ 98,132 $ 221,777<br />
Accounts payable<br />
and accrued<br />
liabilities $ 27,564 $ 12,184 $ 3,403 $ 43,151 $ 27,463 $ 9,363 $ 3,033 $ 39,859 $ 3,339 $ 4,160 $ 4,943 $ 12,442<br />
Obligations under<br />
finance leases 4,314 218 – 4,532 2,326 65 – 2,391 1,104 30 – 1,134<br />
Provisions – 1,000 – 1,000 – 1,000 – 1,000 – 1,000 – 1,000<br />
Asset retirement<br />
obligations 13,905 6,976 – 20,881 7,897 4,697 – 12,594 9,077 4,525 – 13,602<br />
Other liabilities 2,647 4,264 4,876 11,787 935 1,207 1 2,143 1,571 832 58 2,461<br />
Long-term debt – – 65,698 65,698 – – – – – – – –<br />
Total liabilities $ 48,430 $ 24,642 $ 73,977 $ 147,049 $ 38,621 $ 16,332 $ 3,034 $ 57,987 $ 15,091 $ 10,547 $ 5,001 $ 30,639<br />
Year ended December 31, 2011 Year ended December 31, 2010<br />
<strong>Palladium</strong> Gold Corporate <strong>Palladium</strong> Gold Corporate<br />
operations operations and other Total operations operations and other Total<br />
Revenue – after pricing adjustments $ 143,659 $ 26,813 $ – $ 170,472 $ 84,813 $ 22,285 $ – $ 107,098<br />
Depreciation and amortization 9,961 7,460 183 17,604 5,396 10,066 128 15,590<br />
Gold assets impairment charge – 49,210 – 49,210 – – – –<br />
Operating expenses 105,111 31,628 – 136,739 54,924 28,496 – 83,420<br />
Income (loss) from mining operations 28,587 (61,485) (183) (33,081) 24,493 (16,277) (128) 8,088<br />
Other expenses<br />
General and administration 429 82 11,772 12,283 206 181 10,261 10,648<br />
Exploration 9,834 6,728 105 16,667 13,998 15,004 1,124 30,126<br />
Other 289 77 (250) 116 201 760 (3,126) (2,165)<br />
Income (loss) before taxes 18,035 (68,372) (11,810) (62,147) 10,088 (32,222) (8,387) (30,521)<br />
Income and mining tax (expense) recovery (2,388) (1,174) 555 (3,007) 671 (101) 542 1,112<br />
Net income (loss) and comprehensive income (loss) for the period $ 15,647 $ (69,546) $ (11,255) $ (65,154) $ 10,759 $ (32,323) $ (7,845) $ (29,409)<br />
Year ended December 31, 2011 Year ended December 31, 2010<br />
<strong>Palladium</strong> Gold Corporate <strong>Palladium</strong> Gold Corporate<br />
operations operations and other Total operations operations and other Total<br />
Additions to mining interests $ 148,309 $ 37,324 $ – $ 185,633 $ 35,732 $ 13,632 $ – $ 49,364<br />
For additional discussion relating to reliance on customers, refer to accounts receivable in Note 4 and revenue from metal sales in Note 17.<br />
23. FIRST TIME ADOPTION OF IFRS<br />
For all periods up to and including the year ended December 31, 2010, the Company prepared its consolidated financial statements in<br />
accordance with Canadian generally accepted accounting principles (“Canadian GAAP”). For all periods from January 1, 2011 onwards, the<br />
Company has prepared its consolidated financial statements in accordance with International Financial <strong>Report</strong>ing Standards (“IFRS”).<br />
64<br />
2011 <strong>Annual</strong> <strong>Report</strong>
NOTES TO THE CONSOLIDATED FINANCIAL STATEMENTS<br />
Transition to IFRS<br />
To transition to IFRS, the Company must apply “IFRS 1 – First Time Adoption of IFRS” that sets out the rules for first time adoption. In general,<br />
IFRS 1 requires an entity to comply with each IFRS effective at the reporting date for the entity’s first IFRS financial statements. This requires<br />
that an entity apply IFRS to its opening IFRS balance sheet as at the beginning of the earliest comparative period presented in the entity’s<br />
first IFRS financial statements, being January 1, 2010.<br />
The accompanying reconciliations reflect the impact of the applicable IFRS 1 elections the Company has applied in its transition to IFRS. The adjusted<br />
consolidated balance sheets also reflect the impact of accounting policy differences arising from the transition from Canadian GAAP to IFRS.<br />
The Company has prepared consolidated financial statements which comply with IFRS applicable for periods beginning on or after January 1,<br />
2011 and the significant accounting policies meeting those requirements are described in Note 3 of these consolidated financial statements.<br />
Exemptions applied under IFRS 1<br />
In preparing the consolidated financial statements in accordance with IFRS 1, the Company has applied certain of the optional exemptions<br />
and all mandatory exceptions from full retrospective application of IFRS.<br />
Optional Exemptions From Full Retrospective Application<br />
In the first year of adoption, IFRS 1 allows optional exemptions from the general requirements to apply certain IFRS standards in effect<br />
when the Company prepares its annual financial statements. The following summarizes the optional exemptions under IFRS 1 and<br />
related elections available to the Company.<br />
Business combinations exemption<br />
The Company has elected to apply the business combinations exemption. As a result, the Company has not restated business<br />
combinations or otherwise applied IFRS 3 Business Combinations to any acquisitions of subsidiaries or of interests in associates and<br />
joint ventures that occurred before the Company’s January 1, 2010 transition date.<br />
Share-based payment transaction exemption<br />
The Company has elected to apply the share-based payment exemption. As a result, IFRS 2 Share-based Payment has not been applied<br />
to any equity instruments that were granted on or before November 7, 2002, nor has it been applied to equity instruments granted after<br />
November 7, 2002 that vested before the date of transition of January 1, 2010. For cash-settled share-based payment arrangements,<br />
the Company has not applied IFRS 2 to liabilities that were settled before January 1, 2010.<br />
Fair value as deemed cost exemption<br />
The Company has elected to utilize the fair value as deemed cost exemption for the valuation of certain assets located at its LDI and<br />
Sleeping Giant mines. By making this election, the Company is permitted to measure certain items of property, plant and equipment at fair<br />
values determined on or before January 1, 2010, with appropriate retrospective adjustments applied under IFRS during the period reflected<br />
in the opening IFRS balance sheet at January 1, 2010. Other mining interests have been recorded under IFRS using historical costs.<br />
Compound financial instruments exemption<br />
Under this exemption, a first-time adopter need not separate the liability and equity components under the IAS 32 requirements if the<br />
liability component is no longer outstanding on January 1, 2010 transition date. Since various compound financial instruments in the<br />
form of convertible notes, debentures, and unit offerings with foreign-denominated warrants have been used by the Company in recent<br />
years, the Company has elected to apply this exemption relating to compound instruments.<br />
Designation of previously recognized financial instruments exemption<br />
This exemption permits an election to initially recognize certain financial instruments as available-for-sale or designate certain<br />
instruments as being at fair value through profit or loss at the date of transition. Neither the Company nor its subsidiaries possessed<br />
financial assets or liabilities at January 1, 2010 which would benefit from the application of this exemption. Therefore, the Company<br />
has elected not to apply this exemption to its IFRS consolidated financial statements.<br />
Fair value measurement of financial assets or liabilities at initial recognition<br />
This exemption restricts the fair value approach under IAS 39, requiring consistent application of the methodology to be applied<br />
prospectively from October 25, 2002 or January 1, 2004. As a result of other IFRS 1 exemptions and standards applied, the Company and<br />
its subsidiaries’ financial assets and liabilities reflected in the January 1, 2010 IFRS consolidated opening balance sheet relate to the<br />
period after the specified dates for prospective application and would therefore not benefit from the application of this election. As a<br />
result, the Company has elected not to apply this exemption to its IFRS consolidated financial statements.<br />
Decommissioning liabilities included in the cost of property, plant and equipment exemption<br />
The Company recognizes an asset retirement obligation (“ARO”) in respect of environmental liabilities relating to contamination caused to<br />
land, decommissioning of existing production facilities and reclamation of mining properties. The election in IFRS 1, provides an exemption<br />
from the full retrospective application of IFRIC 1 – Changes in existing decommissioning, restoration and similar liabilities and permits the<br />
determination of a revised ARO provision and related adjustment to the net ARO asset value at the transition date of January 1, 2010.<br />
The Company has elected to apply the exemption from full retrospective application of decommissioning provisions as allowed under IFRS 1.<br />
As a result the Company has re-measured its ARO provisions as at January 1, 2010 under IAS 37 Provisions, Contingent Liabilities and<br />
Contingent Assets, estimated the amount to be included in the cost of the related asset by discounting the liability to the date at which the<br />
liability first arose using best estimates of the historical risk adjusted discount rates, and recalculated the accumulated amortization under<br />
IFRS up to the transition date.<br />
65<br />
2011 <strong>Annual</strong> <strong>Report</strong>
NOTES TO THE CONSOLIDATED FINANCIAL STATEMENTS<br />
Borrowing costs exemption<br />
All material borrowings have been repaid in full prior to the January 1, 2010 transition date. Therefore, this election has not been<br />
applied within the consolidated financial statements of the Company as at the January 1, 2010 transition date and subsequent periods.<br />
Reconciliations between IFRS and Canadian GAAP<br />
The following reconciliations summarize the effect of the transition to IFRS on the Company’s previously reported balances.<br />
Reconciliation of Consolidated Balance Sheets<br />
December 31, 2010 January 1, 2010<br />
Effect of<br />
Effect of<br />
transition<br />
transition<br />
Notes GAAP to IFRS IFRS GAAP to IFRS IFRS<br />
ASSETS<br />
Current Assets<br />
Cash and cash equivalents $ 75,159 $ – $ 75,159 $ 98,255 $ – $ 98,255<br />
Accounts receivable 80,683 – 80,683 – – –<br />
Taxes receivable 734 – 734 204 – 204<br />
Inventories 27,487 – 27,487 25,306 – 25,306<br />
Other assets 27,551 – 27,551 2,495 – 2,495<br />
211,614 – 211,614 126,260 – 126,260<br />
Non-current Assets<br />
Mining interests (a) 126,196 90 126,286 82,448 2,566 85,014<br />
Reclamation deposits 10,537 – 10,537 10,503 – 10,503<br />
Total assets $ 348,347 $ 90 $ 348,437 $ 219,211 $ 2,566 $ 221,777<br />
LIABILITIES AND SHAREHOLDERS’ EQUITY<br />
Current Liabilities<br />
Accounts payable and accrued liabilities (b) $ 40,799 $ (940) $ 39,859 $ 11,195 $ 1,247 $ 12,442<br />
Current portion of obligations under<br />
capital leases 1,196 – 1,196 558 – 558<br />
Provisions (c) – 1,000 1,000 – 1,000 1,000<br />
Other financial liabilities (d) – – – – 56 56<br />
41,995 60 42,055 11,753 2,303 14,056<br />
Non-current Liabilities<br />
Taxes payable 936 – 936 1,573 – 1,573<br />
Asset retirement obligations (e) 11,637 957 12,594 12,921 681 13,602<br />
Obligations under capital leases 1,195 – 1,195 576 – 576<br />
Deferred mining tax liability (f) 1,207 – 1,207 127 705 832<br />
$ 56,970 $ 1,017 $ 57,987 $ 26,950 $ 3,689 $ 30,639<br />
Shareholders’ Equity<br />
Common share capital<br />
and purchase warrants (g) 697,846 4,941 702,787 583,089 (8,211) 574,878<br />
Stock options and related surplus (h) 5,069 527 5,596 3,896 346 4,242<br />
Contributed surplus (i) 24,861 (19,324) 5,537 18,416 (12,337) 6,079<br />
Deficit (j) (436,399) 12,929 (423,470) (413,140) 19,079 (394,061)<br />
Total shareholders’ equity 291,377 (927) 290,450 192,261 (1,123) 191,138<br />
Total shareholders’ equity and liabilities $ 348,347 $ 90 $ 348,437 $ 219,211 $ 2,566 $ 221,777<br />
66<br />
2011 <strong>Annual</strong> <strong>Report</strong>
NOTES TO THE CONSOLIDATED FINANCIAL STATEMENTS<br />
Reconciliation of Consolidated Statements of Operations, Comprehensive Loss<br />
Year ended December 31, 2010<br />
Effect of<br />
Notes GAAP transition to IFRS IFRS<br />
Revenue – before pricing adjustments $ 99,714 – $ 99,714<br />
Pricing adjustments:<br />
Commodities 8,941 – 8,941<br />
Foreign exchange (1,557) – (1,557)<br />
Revenue – after pricing adjustments $ 107,098 $ – $ 107,098<br />
Operating expenses<br />
Production costs 74,709 – 74,709<br />
Royalty expense 4,202 – 4,202<br />
Smelting, refining and freight costs 4,779 – 4,779<br />
Inventory pricing adjustments – – –<br />
Depreciation and amortization (a), (e) 13,175 2,415 15,590<br />
Loss on disposal of equipment (270) – (270)<br />
Total operating expenses 96,595 2,415 99,010<br />
Income (loss) from mining operations 10,503 (2,415) 8,088<br />
Other expenses<br />
General and administration (b), (g), (h) 10,676 (28) 10,648<br />
Exploration 30,126 – 30,126<br />
Interest and other income (d),(e), (g) 282 (2,424) (2,142)<br />
Foreign exchange loss (gain) (23) – (23)<br />
Total other expenses 41,061 (2,452) 38,609<br />
Income (loss) before taxes (30,558) 37 (30,521)<br />
Income and mining tax recovery (expense) (g), (i) 7,299 (6,187) 1,112<br />
Net loss and comprehensive loss for the year (23,259) (6,150) (29,409)<br />
Net income (loss) per share<br />
Basic and diluted $ (0.16) $ (0.05) $ (0.21)<br />
Weighted average number of shares outstanding<br />
Basic 141,537,377 – 141,537,377<br />
Diluted 141,537,377 – 141,537,377<br />
67<br />
2011 <strong>Annual</strong> <strong>Report</strong>
NOTES TO THE CONSOLIDATED FINANCIAL STATEMENTS<br />
Reconciliation of Consolidated Statements of Cash Flows<br />
Year ended December 31, 2010<br />
Effect of<br />
Notes GAAP transition to IFRS IFRS<br />
Cash provided by (used in)<br />
Operations<br />
Net income (loss) for the period $ (23,259) $ (6,150) $ (29,409)<br />
Operating items not involving cash<br />
Depreciation and amortization (a), (e) 13,175 2,415 15,590<br />
Deferred income and mining tax expense (recovery) (g), (i) (6,356) 6,187 (169)<br />
Stock based compensation and employee benefits (h) 1,752 159 1,911<br />
Loss on disposal of equipment (270) – (270)<br />
Other (e) 686 (368) 318<br />
(14,272) 2,243 (12,029)<br />
Changes in non-cash working capital (59,478) (2,243) (61,721)<br />
(73,750) – (73,750)<br />
Financing Activities<br />
Issuance of common shares and warrants, net of issue costs 101,074 – 101,074<br />
Repayment of obligations under capital leases (1,721) – (1,721)<br />
Interest paid on capital leases (142) (142)<br />
99,211 – 99,211<br />
Investing Activities<br />
Additions to mining interests (49,364) – (49,364)<br />
Proceeds on disposal of mining interests 807 – 807<br />
(48,557) – (48,557)<br />
Increase (decrease) in cash and cash equivalents (23,096) – (23,096)<br />
Cash and cash equivalents, beginning of period 98,255 – 98,255<br />
Cash and cash equivalents, end of period $ 75,159 $ – $ 75,159<br />
Cash and cash equivalents consisting of:<br />
Cash 75,159 – 75,159<br />
Short-term investments – – –<br />
Total assets $ 75,159 $ – $ 75,159<br />
Reconciliation of Consolidated Statements of Shareholders’ Equity<br />
Total<br />
Number of Capital Shares Stock Contributed shareholders’<br />
shares stock issuable options Warrants surplus Deficit equity<br />
Balance,<br />
December 31, 2009<br />
as reported under<br />
Canadian GAAP 127,383,051 $ 572,505 $ – $ 2,704 $ 10,584 $ 19,608 $ (413,140) $ 192,261<br />
Reallocation of<br />
equity not related<br />
to IFRS transition – – – 1,192 – (1,192) – –<br />
Net impact of IFRS<br />
transition adjustments – (173) – 346 (8,038) (12,337) 19,079 (1,123)<br />
Balance, January 1,<br />
2010 as reported<br />
under IFRS 127,383,051 $ 572,332 $ – $ 4,242 $ 2,546 $ 6,079 $ (394,061) $ 191,138<br />
68<br />
2011 <strong>Annual</strong> <strong>Report</strong>
NOTES TO THE CONSOLIDATED FINANCIAL STATEMENTS<br />
Total<br />
Number of Capital Shares Stock Contributed shareholders’<br />
shares stock issuable options Warrants surplus Deficit equity<br />
Balance,<br />
December 31, 2010<br />
as reported under<br />
Canadian GAAP 154,653,275 $ 692,733 $ – $ 3,661 $ 5,113 $ 26,269 $ (436,399) $ 291,377<br />
Reallocation of<br />
equity not related<br />
to IFRS transition – – – 1,408 – (1,408) – –<br />
Net impact of IFRS<br />
transition adjustments – 4,941 – 527 – (19,324) 12,929 (927)<br />
Balance, December 31,<br />
2010 as reported<br />
under IFRS 154,653,275 $ 697,674 $ – $ 5,596 $ 5,113 $ 5,537 $ (423,470) $ 290,450<br />
Explanation of the effect of the transition to IFRS<br />
The following explains the material adjustments to the balance sheet and income statement.<br />
(a) Mining interests December 31 January 1<br />
2010 2010<br />
(i) Adjustment to asset retirement costs and related accumulated amortization $ 553 $ 1,861<br />
(ii) Net adjustment to carrying value of assets due to deemed cost election under IFRS 1 – 705<br />
(iii) Adjustments to depreciation and amortization of mining interests subsequent<br />
to the January 1, 2010 transition date due to revised carrying values under IFRS (463) –<br />
Total adjustment at transition to IFRS $ 90 $ 2,566<br />
(i)<br />
Under IFRS 1 exemptions, the Company elected to determine the fair value of the ARO as at January 1, 2010 and discount that fair<br />
value to determine the related asset and accumulated amortization. As a result, a recovery of accumulated amortization charges<br />
was realized under IFRS and has been reflected in the opening mining interest balances.<br />
(ii)<br />
The Company has elected under IFRS 1 to apply the deemed cost exemption in respect of the LDI and Sleeping Giant mining<br />
interests. The valuation of the LDI property was deemed to be the fair value as determined at December 31, 2008. For Sleeping<br />
Giant mine, the final fair values relating to the May 26, 2009 acquisition date were elected as the deemed cost. The change in<br />
accumulated depreciation and amortization as at January 1, 2010 as a result of the deemed cost elections has been included to<br />
reflect the net change in carrying values.<br />
Information on impairment provisions<br />
The recoverable amount of a cash generating unit (“CGU”) is determined based on the greater of the CGU’s fair value less cost to sell<br />
and value-in-use calculations. These calculations use cash flow projections based on financial budgets and extended operational<br />
plans approved by management.<br />
The Company performed an analysis of impairment of all CGUs as at January 1, 2010 and at each subsequent reporting date. As a result of<br />
those analyses, it was concluded that the deemed costs assigned to CGUs were not impaired at the date of transition to IFRS or in each of the<br />
subsequent reporting periods in 2010 and no modifications were required to be made to the useful lives and residual values of mining interests.<br />
(b)<br />
Accounts payable and accrued liabilities<br />
December 31 January 1<br />
2010 2010<br />
(i) Reclassification of premiums related to flow-through shares $ – $ 2,000<br />
(ii) Reclassification of provisions included in accrued payables (1,000) (1,000)<br />
(iii) Adjustments to accounting for restricted share units 60 247<br />
Total adjustment at transition to IFRS $ (940) $ 1,247<br />
(i)<br />
(ii)<br />
In accordance with IFRS interpretations, the premium of proceeds received on flow-through shares in excess of the market value<br />
of the shares on the date of issue represents the value of the liability relating to the transfer of income tax credits foregone and<br />
owing to investors upon renunciation. These liabilities have been reclassified from equity to liabilities and will be reversed and<br />
recognized at the time that expenditures occur.<br />
Under Canadian GAAP, certain contractual provisions were included as accrued payables. Under IFRS, these provisions have<br />
been reclassified as provisions.<br />
69<br />
2011 <strong>Annual</strong> <strong>Report</strong>
NOTES TO THE CONSOLIDATED FINANCIAL STATEMENTS<br />
(iii) Under Canadian GAAP, the liability relating to restricted share units (“RSUs”) which have vested and are outstanding is determined<br />
based on the spot price for the Company’s common shares at the end of the reporting period. Under IFRS 2, the valuation at the end of<br />
the reporting period is based on fair value using valuation models which include consideration of the volatility of the underlying<br />
common share pricing. The Company determined the fair value under IFRS based on the use of the Black-Scholes model.<br />
(c)<br />
Provisions<br />
December 31 January 1<br />
2010 2010<br />
(i) Reclassification of provisions included in accrued payables $ 1,000 $ 1,000<br />
Total adjustment at transition to IFRS $ 1,000 $ 1,000<br />
(i)<br />
(d)<br />
Under Canadian GAAP, certain contractual provisions were included as accrued payables. Under IFRS, these provisions have<br />
been reclassified as current provisions.<br />
Other financial liabilities<br />
December 31 January 1<br />
2010 2010<br />
(i) Reclassification of foreign-denominated warrants under IAS 32 $ – $ 56<br />
Total adjustment at transition to IFRS $ – $ 56<br />
(i)<br />
(e)<br />
Under IAS 32, warrants and similar call options, denominated in a foreign currency, which have not been issued on a pro-rata<br />
basis to all holders of the same class of shares are classified as liabilities. The warrants relating to the convertible debentures<br />
issued in 2006 were denominated in U.S. dollars and were therefore reclassified accordingly on the balance sheet at January 1,<br />
2010. The two tranches of foreign-denominated warrants expired on March 29, 2010 and June 23, 2010, respectively.<br />
Asset retirement obligations<br />
December 31 January 1<br />
2010 2010<br />
(i) Adjustments to the valuation of asset retirement obligations $ 1,325 $ 681<br />
(ii) Differences realized due to accretion of adjusted obligation balances under IFRS (368) –<br />
Total adjustment at transition to IFRS $ 957 $ 681<br />
(i)<br />
(ii)<br />
(f)<br />
Under IFRS 1 exemptions, the Company elected to determine the fair value of the ARO as at January 1, 2010. As a result of<br />
differences between the methodology, rates, and assumptions required to be used under IFRS versus Canadian GAAP, a<br />
transitional variance has been recognized at January 1, 2010.<br />
Under IFRS, accretion charges are reflected as financing costs. Therefore, these changes have been reclassified to interest and<br />
other costs (income) on the consolidated statements of operations and comprehensive loss.<br />
Deferred mining tax liability<br />
(i)<br />
December 31 January 1<br />
2010 2010<br />
Net adjustment to deferred mining tax liability due to deemed cost election<br />
under IFRS 1 $ – $ 705<br />
Total adjustment at transition to IFRS $ – $ 705<br />
(i)<br />
(g)<br />
The Company has elected under IFRS 1 to apply the deemed cost exemption in respect of the LDI and Sleeping Giant mining interests.<br />
The valuation of the LDI property was deemed to be the fair value as determined at December 31, 2008. For Sleeping Giant mine, the final<br />
fair values relating to the May 26, 2009 acquisition date were elected as the deemed cost. The change in deferred mining tax liability as<br />
at January 1, 2010 is a result of temporary differences realized as a result of the recognition of the change in accounting carrying values.<br />
Common share capital and purchase warrants<br />
December 31 January 1<br />
2010 2010<br />
(i) Reclassification of foreign-denominated warrants under IAS 32 $ – $ (8,038)<br />
(ii) Reclassification of premiums related to flow-through shares (2,000) (2,000)<br />
(iii) Adjustment to expense deferred income tax provision on flow-through<br />
share renunciations prior to the January 1, 2010 IFRS transition date 1,827 1,827<br />
(iv) Future income tax on flow-through renunciations in 2010 5,136 –<br />
(v) Difference between IFRS 2 and Canadian GAAP relating to valuation<br />
of vested options exercised (22) –<br />
Total adjustment at transition to IFRS $ 4,941 $ (8,211)<br />
70<br />
2011 <strong>Annual</strong> <strong>Report</strong>
NOTES TO THE CONSOLIDATED FINANCIAL STATEMENTS<br />
(i)<br />
Under IAS 32, warrants denominated in a foreign currency which have not been issued on a pro-rata basis to all holders of the<br />
same class of shares are classified as liabilities. The warrants relating to the convertible debentures issued in 2006 were<br />
denominated in U.S. dollars and were therefore reclassified accordingly on the balance sheet at January 1, 2010.<br />
(ii) In accordance with IFRS interpretations, the premium received on flow-through shares represents the value of the liability relating<br />
to the transfer of income tax credits foregone and owing to investors upon renunciation. These liabilities have been reclassified<br />
from equity to liabilities and will be reversed at the time that renunciation of costs occurs.<br />
(iii) Under IFRS, the issuance of flow-through shares results in an increase in liabilities and a decrease in equity. The liability related<br />
to the sale of tax benefits is charged through profit or loss in the period the expenditures are made.<br />
(iv) During the first quarter of 2010, the Company fully renounced expenditures relating to its 2009 flow-through share issuance. Under<br />
Canadian GAAP, the estimated deferred income tax impact was charged to common stock. Under IFRS, the related balance was<br />
reallocated to deferred income tax expense and recognized through profit or loss in the period.<br />
(h)<br />
Stock options<br />
December 31 January 1<br />
2010 2010<br />
(i) Adjustment to compensation expense due to adoption of IFRS 2 $ 527 $ 346<br />
Total adjustment at transition to IFRS $ 527 $ 346<br />
(i)<br />
(i)<br />
Under IFRS 2, compensation expense is realized using the graduated method over all respective vesting periods with the inclusion<br />
of a provision for forfeiture based on historical non-vesting rates. Under Canadian GAAP, compensation expense is recognized on<br />
a straight-line basis over each vesting period.<br />
Contributed surplus<br />
December 31 January 1<br />
2010 2010<br />
(i) Reclassification of foreign-denominated conversion option under IAS 32 $ (12,337) $ (12,337)<br />
(ii) Eliminate expiry of convertible notes warrants (8,038) –<br />
(iii) Eliminate deferred income tax provision relating to warrant expirations 1,051 –<br />
Total adjustment at transition to IFRS $ (19,324) $ (12,337)<br />
(i)<br />
(ii)<br />
Under IAS 32, warrants and similar call options, denominated in a foreign currency, which have not been issued on a pro-rata basis to<br />
all holders of the same class of shares are classified as liabilities. The conversion option relating to the Convertible Debentures issued<br />
in 2006 were denominated in U.S. dollars and were therefore reclassified accordingly on the balance sheet at January 1, 2010.<br />
Under Canadian GAAP, the warrants relating to the 2006 convertible note issuance were classified as equity for reporting purposes. At<br />
expiry, the equity balance was reclassified to contributed surplus. Under IFRS, the foreign-denominated warrants are classified as<br />
liabilities and revalued at their fair value at each reporting date with the change in value recognized through profit or loss in the period. As<br />
a result, the transition to IFRS required the Company to reverse the transactions under Canadian GAAP relating to the expired warrants.<br />
(iii) In conjunction with item (ii) above, under IFRS, the Company also recorded transactions relating to income tax provisions relating<br />
to the expired warrants.<br />
(j) Deficit<br />
All above adjustments were recorded against the opening deficit. The total net impact on the reported deficit at each of the<br />
reporting dates reflected as follows:<br />
December 31 January 1<br />
2010 2010<br />
(i) Net impact of all IFRS transitional adjustments $ 12,929 $ 19,079<br />
Total adjustment at transition to IFRS $ 12,929 $ 19,079<br />
24. SUBSEQUENT EVENTS<br />
Capital Lease Facility<br />
Subsequent to year end, the Company established a $15.0 million capital lease facility to fund equipment for the LDI mine expansion, of<br />
which $11.1 million has been utilized.<br />
Closure of Sleeping Giant Mine<br />
The Company announced on January 17, 2012 that it is discontinuing production at the Sleeping Giant mine due to its insufficient operating<br />
margin. The Company has therefore ceased mining operations at Sleeping Giant and has restructured the gold division, resulting in a noncash<br />
impairment charge on its gold assets of $49.2 million.<br />
71<br />
2011 <strong>Annual</strong> <strong>Report</strong>
CORPORATE INFORMATION<br />
DIRECTORS<br />
André J. Douchane, B.Sc.<br />
Chairman of the Board<br />
Toronto, Ontario<br />
William J. Biggar, B.Comm., M.B.A., C.A.<br />
Toronto, Ontario<br />
C. David A. Comba, B.Sc., M.Sc.<br />
Burlington, Ontario<br />
Robert J. Quinn, B.S.B.A., L.L.B.<br />
Houston, Texas<br />
Steven R. Berlin, M.B.A., C.P.A.<br />
Tulsa, Oklahoma<br />
Gregory J. Van Staveren, C.P.A., C.A.<br />
Toronto, Ontario<br />
William J. Weymark, B.A.Sc., P.Eng.<br />
West Vancouver, British Columbia<br />
SENIOR MANAGEMENT<br />
William J. Biggar, B.Comm., M.B.A., C.A.<br />
President and Chief Executive Officer<br />
Greg Struble, Mining Engineer<br />
Vice President and Chief Operating Officer<br />
Jeffrey A. Swinoga, M.B.A., C.A.<br />
Vice President, Finance and Chief Financial Officer<br />
Trent C.A. Mell, B.C.L., LL.B., LL.M.<br />
Vice President, Corporate Development,<br />
General Counsel and Corporate Secretary<br />
David C. Peck, Ph.D., P.Geo.<br />
Head of Exploration<br />
INVESTOR RELATIONS<br />
Camilla Bartosiewicz<br />
Director, Investor Relations<br />
and Corporate Communications<br />
Phone: 416-360-7374<br />
Email: camilla@nap.com<br />
Website: www.nap.com<br />
HEAD OFFICE<br />
Royal Bank Plaza, South Tower<br />
200 Bay Street, Suite 2350<br />
Toronto, Ontario, M5J 2J2<br />
Tel: (416) 360-7590<br />
Fax: (416) 360-7709<br />
Email: info@nap.com<br />
www.nap.com<br />
SHARES AND WARRANTS LISTED<br />
Toronto Stock Exchange<br />
Symbol: PDL<br />
NYSE Amex<br />
Symbol: PAL<br />
TRANSFER AGENT AND REGISTRAR<br />
Computershare Investor Services Inc.<br />
100 University Avenue, 9th Floor<br />
<strong>North</strong> Tower<br />
Toronto, Ontario<br />
M5J 2Y1 Canada<br />
<strong>North</strong> America<br />
Toll-Free: 1-800-564-6253<br />
Email: service@computershare.com<br />
Website: www.computershare.com<br />
AUDITORS<br />
KPMG LLP<br />
333 Bay Street, Suite 4600<br />
Toronto, Ontario<br />
M5H 2S5 Canada<br />
Phone: 416-777-8500<br />
Website: www.kpmg.ca<br />
ANNUAL MEETING<br />
NAP’s <strong>Annual</strong> Meeting of Shareholders<br />
will be held on May 11, 2012 at 11:00 a.m.<br />
(ET) at the TSX Broadcast Centre Gallery,<br />
The Exchange Tower, 130 King Street West,<br />
Toronto, Ontario, Canada.<br />
72<br />
2011 <strong>Annual</strong> <strong>Report</strong>
Senior Management<br />
William J. Biggar<br />
Trent Mell<br />
Greg Struble<br />
David Peck<br />
Jeff Swinoga<br />
Directors<br />
3<br />
5<br />
2<br />
4<br />
1<br />
6<br />
7<br />
1_André J. Douchane<br />
2_William J. Biggar<br />
3_C. David A. Comba<br />
4_Robert J. Quinn<br />
5_Steven R. Berlin<br />
6_Greg J. Van Staveren<br />
7_William J. Weymark<br />
73<br />
2011 <strong>Annual</strong> <strong>Report</strong>
Head Office<br />
Royal Bank Plaza, South Tower<br />
200 Bay Street, Suite 2350<br />
Toronto, Ontario, M5J 2J2<br />
Tel: (416) 360-7590<br />
Fax: (416) 360-7709<br />
Email: info@nap.com<br />
www.nap.com