Study of Population Density on a Suburban Lawn - Explore Biology
Study of Population Density on a Suburban Lawn - Explore Biology
Study of Population Density on a Suburban Lawn - Explore Biology

Create successful ePaper yourself
Turn your PDF publications into a flip-book with our unique Google optimized e-Paper software.
Name _____________________________<br />
Regents <strong>Biology</strong><br />
Period _________<br />
Date ______________________<br />
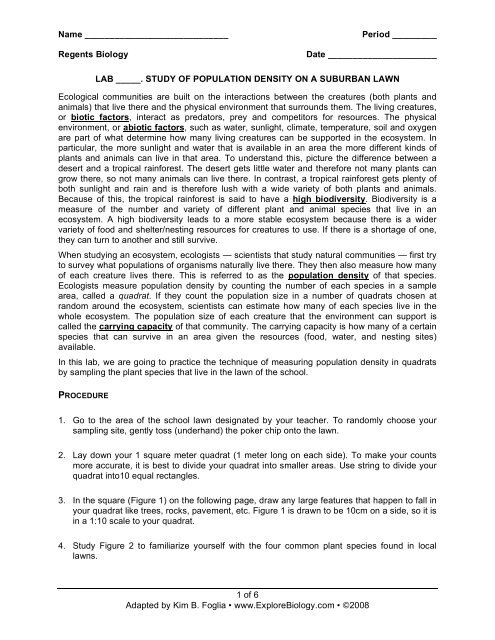
LAB _____. STUDY OF POPULATION DENSITY ON A SUBURBAN LAWN<br />
Ecological communities are built <strong>on</strong> the interacti<strong>on</strong>s between the creatures (both plants and<br />
animals) that live there and the physical envir<strong>on</strong>ment that surrounds them. The living creatures,<br />
or biotic factors, interact as predators, prey and competitors for resources. The physical<br />
envir<strong>on</strong>ment, or abiotic factors, such as water, sunlight, climate, temperature, soil and oxygen<br />
are part <str<strong>on</strong>g>of</str<strong>on</strong>g> what determine how many living creatures can be supported in the ecosystem. In<br />
particular, the more sunlight and water that is available in an area the more different kinds <str<strong>on</strong>g>of</str<strong>on</strong>g><br />
plants and animals can live in that area. To understand this, picture the difference between a<br />
desert and a tropical rainforest. The desert gets little water and therefore not many plants can<br />
grow there, so not many animals can live there. In c<strong>on</strong>trast, a tropical rainforest gets plenty <str<strong>on</strong>g>of</str<strong>on</strong>g><br />
both sunlight and rain and is therefore lush with a wide variety <str<strong>on</strong>g>of</str<strong>on</strong>g> both plants and animals.<br />
Because <str<strong>on</strong>g>of</str<strong>on</strong>g> this, the tropical rainforest is said to have a high biodiversity. Biodiversity is a<br />
measure <str<strong>on</strong>g>of</str<strong>on</strong>g> the number and variety <str<strong>on</strong>g>of</str<strong>on</strong>g> different plant and animal species that live in an<br />
ecosystem. A high biodiversity leads to a more stable ecosystem because there is a wider<br />
variety <str<strong>on</strong>g>of</str<strong>on</strong>g> food and shelter/nesting resources for creatures to use. If there is a shortage <str<strong>on</strong>g>of</str<strong>on</strong>g> <strong>on</strong>e,<br />
they can turn to another and still survive.<br />
When studying an ecosystem, ecologists — scientists that study natural communities — first try<br />
to survey what populati<strong>on</strong>s <str<strong>on</strong>g>of</str<strong>on</strong>g> organisms naturally live there. They then also measure how many<br />
<str<strong>on</strong>g>of</str<strong>on</strong>g> each creature lives there. This is referred to as the populati<strong>on</strong> density <str<strong>on</strong>g>of</str<strong>on</strong>g> that species.<br />
Ecologists measure populati<strong>on</strong> density by counting the number <str<strong>on</strong>g>of</str<strong>on</strong>g> each species in a sample<br />
area, called a quadrat. If they count the populati<strong>on</strong> size in a number <str<strong>on</strong>g>of</str<strong>on</strong>g> quadrats chosen at<br />
random around the ecosystem, scientists can estimate how many <str<strong>on</strong>g>of</str<strong>on</strong>g> each species live in the<br />
whole ecosystem. The populati<strong>on</strong> size <str<strong>on</strong>g>of</str<strong>on</strong>g> each creature that the envir<strong>on</strong>ment can support is<br />
called the carrying capacity <str<strong>on</strong>g>of</str<strong>on</strong>g> that community. The carrying capacity is how many <str<strong>on</strong>g>of</str<strong>on</strong>g> a certain<br />
species that can survive in an area given the resources (food, water, and nesting sites)<br />
available.<br />
In this lab, we are going to practice the technique <str<strong>on</strong>g>of</str<strong>on</strong>g> measuring populati<strong>on</strong> density in quadrats<br />
by sampling the plant species that live in the lawn <str<strong>on</strong>g>of</str<strong>on</strong>g> the school.<br />
PROCEDURE<br />
1. Go to the area <str<strong>on</strong>g>of</str<strong>on</strong>g> the school lawn designated by your teacher. To randomly choose your<br />
sampling site, gently toss (underhand) the poker chip <strong>on</strong>to the lawn.<br />
2. Lay down your 1 square meter quadrat (1 meter l<strong>on</strong>g <strong>on</strong> each side). To make your counts<br />
more accurate, it is best to divide your quadrat into smaller areas. Use string to divide your<br />
quadrat into10 equal rectangles.<br />
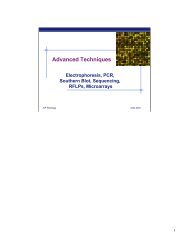
3. In the square (Figure 1) <strong>on</strong> the following page, draw any large features that happen to fall in<br />
your quadrat like trees, rocks, pavement, etc. Figure 1 is drawn to be 10cm <strong>on</strong> a side, so it is<br />
in a 1:10 scale to your quadrat.<br />
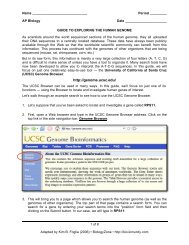
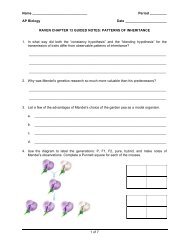
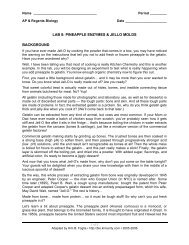
4. <str<strong>on</strong>g>Study</str<strong>on</strong>g> Figure 2 to familiarize yourself with the four comm<strong>on</strong> plant species found in local<br />
lawns.<br />
1 <str<strong>on</strong>g>of</str<strong>on</strong>g> 6<br />
Adapted by Kim B. Foglia • www.<strong>Explore</strong><strong>Biology</strong>.com • ©2008
Name _____________________________<br />
Regents <strong>Biology</strong><br />
5. Count the number <str<strong>on</strong>g>of</str<strong>on</strong>g> each plant species in each rectangle <str<strong>on</strong>g>of</str<strong>on</strong>g> your quadrat and record the<br />
populati<strong>on</strong> size in Table 1 <strong>on</strong> the following page. You can first use “tic” marks in the table<br />
and then write in a number as a final count for each rectangle when you are d<strong>on</strong>e.<br />
6. Using the symbols shown al<strong>on</strong>gside the plant diagrams (Figure 2), also plot the approximate<br />
locati<strong>on</strong> <str<strong>on</strong>g>of</str<strong>on</strong>g> the plants <strong>on</strong> your quadrat drawing below (Figure 1).<br />
7. Total the number <str<strong>on</strong>g>of</str<strong>on</strong>g> each plant species in Table 1. These totals will be shared with the class,<br />
<strong>on</strong>ce we return to the classroom.<br />
8. Copy the class data in Table 2. Total each column to get the class totals for the lawn. Now<br />
we want to calculate the average populati<strong>on</strong> density for the lawn. This will be expressed in<br />
plants/meter 2 .<br />
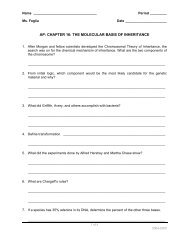
Figure 1. YOUR QUADRAT<br />
<str<strong>on</strong>g>Populati<strong>on</strong></str<strong>on</strong>g> density <str<strong>on</strong>g>of</str<strong>on</strong>g> four weed species in a suburban lawn.<br />
string<br />
2 <str<strong>on</strong>g>of</str<strong>on</strong>g> 6<br />
Adapted by Kim B. Foglia • www.<strong>Explore</strong><strong>Biology</strong>.com • ©2008
Name _____________________________<br />
Regents <strong>Biology</strong><br />
Figure 2. Comm<strong>on</strong> New York State <strong>Lawn</strong> Weed Species<br />
Dandeli<strong>on</strong><br />
White Clover<br />
Buckhorn Plantain<br />
Broadleaf Plantain<br />
3 <str<strong>on</strong>g>of</str<strong>on</strong>g> 6<br />
Adapted by Kim B. Foglia • www.<strong>Explore</strong><strong>Biology</strong>.com • ©2008
Name _____________________________<br />
Regents <strong>Biology</strong><br />
Table 1. GROUP Data — Number <str<strong>on</strong>g>of</str<strong>on</strong>g> Plants in a 1 meter Quadrat<br />
Quadrat<br />
Secti<strong>on</strong><br />
1<br />
Dandeli<strong>on</strong><br />
White Clover<br />
Buckhorn<br />
Plantain<br />
Broadleaf<br />
Plantain<br />
2<br />
3<br />
4<br />
5<br />
6<br />
7<br />
8<br />
9<br />
10<br />
Total<br />
Table 2. CLASS Data — <str<strong>on</strong>g>Populati<strong>on</strong></str<strong>on</strong>g> Densities <str<strong>on</strong>g>of</str<strong>on</strong>g> Plants in a Community<br />
Class<br />
Group<br />
1<br />
Dandeli<strong>on</strong><br />
(total)<br />
White Clover<br />
(total)<br />
Buckhorn<br />
Plantain<br />
(total)<br />
Broadleaf<br />
Plantain<br />
(total)<br />
2<br />
3<br />
4<br />
5<br />
6<br />
7<br />
8<br />
9<br />
10<br />
Total<br />
<str<strong>on</strong>g>Populati<strong>on</strong></str<strong>on</strong>g><br />
<str<strong>on</strong>g>Density</str<strong>on</strong>g><br />
/m 2 /m 2 /m 2 /m 2<br />
4 <str<strong>on</strong>g>of</str<strong>on</strong>g> 6<br />
Adapted by Kim B. Foglia • www.<strong>Explore</strong><strong>Biology</strong>.com • ©2008
Name _____________________________<br />
Regents <strong>Biology</strong><br />
SUMMARY QUESTIONS<br />
1. To show that you understand the c<strong>on</strong>cept, list 4 examples <str<strong>on</strong>g>of</str<strong>on</strong>g> biotic factors in the local<br />
ecological community.<br />
____________________________________<br />
____________________________________<br />
____________________________________<br />
____________________________________<br />
2. To show that you understand the c<strong>on</strong>cept, list 4 examples <str<strong>on</strong>g>of</str<strong>on</strong>g> abiotic factors in the local<br />
ecological community.<br />
____________________________________<br />
____________________________________<br />
____________________________________<br />
____________________________________<br />
3. Explain the term biodiversity.<br />
___________________________________________________________________________<br />
___________________________________________________________________________<br />
4. Which plant species had the highest populati<strong>on</strong> density _____________________________<br />
5. Which plant species had the lowest populati<strong>on</strong> density______________________________<br />
6. What envir<strong>on</strong>mental factors might affect the populati<strong>on</strong> densities <str<strong>on</strong>g>of</str<strong>on</strong>g> these plants Explain.<br />
___________________________________________________________________________<br />
___________________________________________________________________________<br />
___________________________________________________________________________<br />
7. When these lawns were originally planted, <strong>on</strong>ly grass seed was sprinkled <strong>on</strong> the lawn. Then<br />
where did the other plants come from<br />
___________________________________________________________________________<br />
___________________________________________________________________________<br />
___________________________________________________________________________<br />
5 <str<strong>on</strong>g>of</str<strong>on</strong>g> 6<br />
Adapted by Kim B. Foglia • www.<strong>Explore</strong><strong>Biology</strong>.com • ©2008
Name _____________________________<br />
Regents <strong>Biology</strong><br />
8. If you look under the older trees around the lawn, you will notice a lot less grass growing<br />
there, even leaving bare spots. Offer an ecological reas<strong>on</strong> for why this is the case.<br />
___________________________________________________________________________<br />
___________________________________________________________________________<br />
___________________________________________________________________________<br />
9. Would you c<strong>on</strong>sider a suburban lawn to be a high or low biodiversity community Explain.<br />
___________________________________________________________________________<br />
___________________________________________________________________________<br />
___________________________________________________________________________<br />
10. What do you think would happen to the lawn if no <strong>on</strong>e mowed it anymore and it was left<br />
al<strong>on</strong>e for the next 30 years. Explain.<br />
___________________________________________________________________________<br />
___________________________________________________________________________<br />
___________________________________________________________________________<br />
11. What is meant by carrying capacity<br />
___________________________________________________________________________<br />
___________________________________________________________________________<br />
___________________________________________________________________________<br />
12. Why is the class average a better measure <str<strong>on</strong>g>of</str<strong>on</strong>g> the populati<strong>on</strong> density for the lawn than using<br />
the counts from an individual group’s quadrat<br />
___________________________________________________________________________<br />
___________________________________________________________________________<br />
___________________________________________________________________________<br />
6 <str<strong>on</strong>g>of</str<strong>on</strong>g> 6<br />
Adapted by Kim B. Foglia • www.<strong>Explore</strong><strong>Biology</strong>.com • ©2008