Power Point - Hypothesis Construction
Power Point - Hypothesis Construction
Power Point - Hypothesis Construction
Create successful ePaper yourself
Turn your PDF publications into a flip-book with our unique Google optimized e-Paper software.
<strong>Hypothesis</strong> <strong>Construction</strong><br />
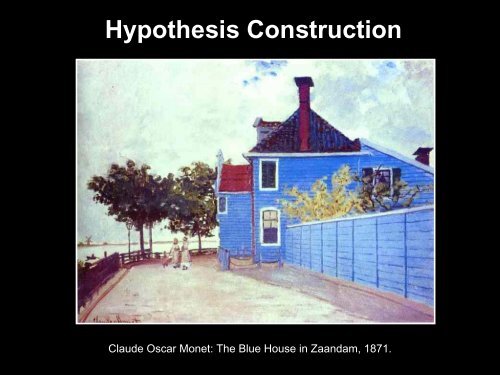
Claude Oscar Monet: The Blue House in Zaandam, 1871.
Propositions and Hypotheses<br />
1. Definitions<br />
• Theoretical Proposition: An empirically<br />
falsifiable, abstract statement about reality.<br />
• “The greater the self actualization the<br />
greater the life satisfaction.”<br />
• <strong>Hypothesis</strong>: A falsifiable, specific statement<br />
about reality that follows from a theoretical<br />
proposition.<br />
• “The greater the self-esteem, the greater the<br />
marital satisfaction.”
Hypotheses<br />
1. Statement About Reality<br />
• Typically, an hypothesis is a stated relationship<br />
between just two variables.<br />
• One can test just two variables at a time.<br />
• An exception to this rule is an hypothesis of<br />
the form, “The theory fits the data.” This<br />
form is common to advanced data analysis<br />
such as multiple regression or structural<br />
equation modeling.
Hypotheses<br />
1. Statement About Reality (Continued)<br />
• Researchers often state “short-cut” hypotheses<br />
that include more than two variables to imply a<br />
set of separate hypotheses.
Hypotheses<br />
2. Falsifiable<br />
• In principle, hypotheses can be falsified.<br />
• In reality, just as one can never prove an<br />
hypothesis, one can never disprove it either.<br />
• Thus, hypothesis testing always includes a<br />
margin of error. In sociology, this margin of<br />
error typically equals 5%.
Hypotheses<br />
3. Causality<br />
• Hypotheses need not state causality.<br />
• Some hypotheses merely state concurrence<br />
• For example, this hypothesis, “Self-esteem<br />
and locus-of-control are correlated,” means<br />
that the two variables are found in common<br />
(i.e., people with high self-esteem will also<br />
have high locus-of-control), but self-esteem<br />
does not cause locus-of-control.<br />
• When hypotheses state causality, direction and<br />
valence (+ or -) of causality must be specified.
The Research and Null Hypotheses<br />
1. Research (H a )<br />
• The research, or “alternative,” hypothesis is the<br />
statement about reality to be assessed through<br />
analysis of quantitative or qualitative data.<br />
• This is the “claim” made by the theory.<br />
2. Null (H 0 )<br />
• The null hypothesis is the one tested.<br />
• The null is tested in recognition that no claim<br />
about reality can be tested directly.<br />
• One can only falsify the null to lend support<br />
to the research hypothesis.
Formatting Hypotheses<br />
1. Suggestions and Terminology<br />
• Suggestions are offered for formatting<br />
hypotheses. Other ways work just as well;<br />
these are easy to follow.<br />
• “x” refers to the independent variable.<br />
• “y” refers to the dependent variable.<br />
• Hypotheses can be constrained within a range<br />
of data by the use of a modifier.<br />
• Among protestants, the greater the selfesteem<br />
the greater the marital satisfaction.<br />
• In this example, “protestants” is a constant.
Formatting Hypotheses<br />
2. Quantitative and Qualitative Data<br />
• The suggestions offered here generally imply<br />
the use of quantitative data, either collected as<br />
such or derived from qualitative data.<br />
• Certainly, hypotheses can be tested using<br />
qualitative data.<br />
• For example, a researcher might claim, after<br />
conducting many in-depth interviews with<br />
married persons, “I conclude that the greater<br />
the self-esteem the greater the marital<br />
satisfaction,” wherein both variables were<br />
measured as qualitative impressions.
Formatting Hypotheses<br />
3. Both X and Y are Continuous Level Data.<br />
• “The greater the x, the greater the y.”<br />
• “The greater the x, the less the y.”<br />
• “Among z, the less the x, the greater the y.”<br />
• The continuous level of measurement for both<br />
variables is implied by the terms “greater” and<br />
“less.”<br />
• Null: There is no relationship between x and y.<br />
• Test statistic: T-ratio.
Formatting Hypotheses<br />
4. One Categorical and One Continuous Variable.<br />
• “Category x1 will have a higher/lower score on<br />
y than category x2.”<br />
• “Males will score higher on self-esteem than<br />
will females.”<br />
• Null: There is no relationship between x and y.<br />
• Test statistic: T-test for difference in means.
Formatting Hypotheses<br />
5. Both X and Y are Categorical-Level Data.<br />
• “Category x1 will be more likely to have<br />
characteristic y1 than will category x2.”<br />
• “Males are more likely to be satisfied in<br />
marriage than are females.”<br />
• Y has two categories: satisfied and not<br />
satisfied.<br />
• Null: There is no relationship between x and y.<br />
• Test statistic: Chi-square goodness-of-fit.
Formatting Hypotheses<br />
6. <strong>Hypothesis</strong> Stating a Non-Causal Relationship.<br />
• “There is an empirical relationship between x<br />
and y.”<br />
• This wording applies to all levels of<br />
measurement.<br />
• Null: There is no relationship between x and y.<br />
• Test statistics: Significance tests associated with<br />
the level of measurement.
Type-I and Type-II Errors<br />
1. Type-I Error (alpha)<br />
• A Type-I error is the probability of rejecting the<br />
null hypothesis when it is true.<br />
• It is the probability of concluding that there is a<br />
relationship between x and y when there is not<br />
a relationship.<br />
• It represents the probability of “false<br />
knowledge.”<br />
• Typically, alpha is set very low to avoid the<br />
probability of assuming causality when there is<br />
none.
Type-I and Type-II Errors<br />
2. Type-II Error (beta; 1-alpha)<br />
• A Type-II error is the probability of not rejecting<br />
the null hypothesis when it should be rejected.<br />
• It is the probability of concluding that there is a<br />
not relationship between x and y when there is<br />
a relationship.<br />
• It represents the probability of “not realizing<br />
there is causality.”<br />
• Typically, scientists are much less concerned<br />
about making a Type-II error than they are<br />
about making a Type-I error.
Statistical and Substantive Significance<br />
1. Statistical Significance<br />
• Statistical significance is determined by<br />
whether an estimate is sufficiently different<br />
from zero, given its standard error and a<br />
specified level of Type-I error (alpha).<br />
• It means, “Empirically, for a certain level of<br />
alpha, we can trust that this difference from<br />
zero did not occur by chance.”
Statistical and Substantive Significance<br />
1. Substantive Significance<br />
• With many observations, even very small<br />
differences from zero will be determined to be<br />
statistically significant because the larger the<br />
sample size, the smaller the standard error and<br />
the larger the t-ratio.<br />
• The key question to ask when working with<br />
many observations, therefore, is, “Is this<br />
statistically significant difference from zero<br />
actually a theoretically important difference<br />
from zero”


