AnnuAl report 2010 - ZSSK Cargo
AnnuAl report 2010 - ZSSK Cargo
AnnuAl report 2010 - ZSSK Cargo

You also want an ePaper? Increase the reach of your titles
YUMPU automatically turns print PDFs into web optimized ePapers that Google loves.
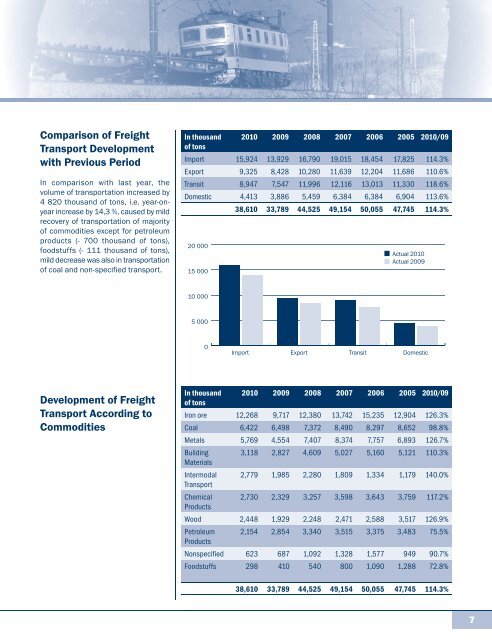
Comparison of Freight<br />
Transport Development<br />
with Previous Period<br />
In comparison with last year, the<br />
volume of transportation increased by<br />
4 820 thousand of tons, i.e. year-onyear<br />
increase by 14,3 %, caused by mild<br />
recovery of transportation of majority<br />
of commodities except for petroleum<br />
products (- 700 thousand of tons),<br />
foodstuffs (- 111 thousand of tons),<br />
mild decrease was also in transportation<br />
of coal and non-specified transport.<br />
In thousand <strong>2010</strong> 2009 2008 2007 2006 2005 <strong>2010</strong>/09<br />
of tons<br />
Import 15,924 13,929 16,790 19,015 18,454 17,825 114.3%<br />
Export 9,325 8,428 10,280 11,639 12,204 11,686 110.6%<br />
Transit 8,947 7,547 11,996 12,116 13,013 11,330 118.6%<br />
Domestic 4,413 3,886 5,459 6,384 6,384 6,904 113.6%<br />
38,610 33,789 44,525 49,154 50,055 47,745 114.3%<br />
20 000<br />
15 000<br />
Actual <strong>2010</strong><br />
Actual 2009<br />
10 000<br />
5 000<br />
0<br />
Import Export Transit Domestic<br />
Development of Freight<br />
Transport According to<br />
Commodities<br />
In thousand <strong>2010</strong> 2009 2008 2007 2006 2005 <strong>2010</strong>/09<br />
of tons<br />
Iron ore 12,268 9,717 12,380 13,742 15,235 12,904 126.3%<br />
Coal 6,422 6,498 7,372 8,490 8,297 8,652 98.8%<br />
Metals 5,769 4,554 7,407 8,374 7,757 6,893 126.7%<br />
Building<br />
3,118 2,827 4,609 5,027 5,160 5,121 110.3%<br />
Materials<br />
Intermodal 2,779 1,985 2,280 1,809 1,334 1,179 140.0%<br />
Transport<br />
Chemical 2,730 2,329 3,257 3,598 3,643 3,759 117.2%<br />
Products<br />
Wood 2,448 1,929 2,248 2,471 2,588 3,517 126.9%<br />
Petroleum 2,154 2,854 3,340 3,515 3,375 3,483 75.5%<br />
Products<br />
Nonspecified 623 687 1,092 1,328 1,577 949 90.7%<br />
Foodstuffs 298 410 540 800 1,090 1,288 72.8%<br />
38,610 33,789 44,525 49,154 50,055 47,745 114.3%<br />
7