Puget Sound: Washington State's Best Investment - Earth Economics
Puget Sound: Washington State's Best Investment - Earth Economics
Puget Sound: Washington State's Best Investment - Earth Economics
Create successful ePaper yourself
Turn your PDF publications into a flip-book with our unique Google optimized e-Paper software.
<strong>Puget</strong> <strong>Sound</strong>:<br />
<strong>Washington</strong> State’s <strong>Best</strong> <strong>Investment</strong>
January 2012<br />
PUGET SOUND: WASHINGTON STATE’S BEST INVESTMENT<br />
Authors:<br />
Jennifer Harrison-Cox, David Batker, Zachary Christin, Jeremy Rapp<br />
Acknowledgments:<br />
Project team members included Jennifer Harrison-Cox, David Batker, Zachary Christin, Jeremy Rapp, Rowan<br />
Schmidt, Jonathan Kochmer and Noelani Kirshner. Editing support was provided by Jeff Mitchell and Leah<br />
Mitchell. Meghan Arntson and Maya Kocian provided layout support. Special thanks to Alana Knaster for<br />
reviewing this report.<br />
The project team would like to recognize and thank the funders of <strong>Earth</strong> <strong>Economics</strong>’ 21 st Century <strong>Washington</strong><br />
Initiative: The Bullitt Foundation, The Gordon and Betty Moore Foundation, The Harder Foundation and The<br />
Kongsgaard-Goldman Foundation. Without their leadership and 21 st Century vision, the projects and tools<br />
described in this document would not have been possible.<br />
The authors are responsible for the content of this report.<br />
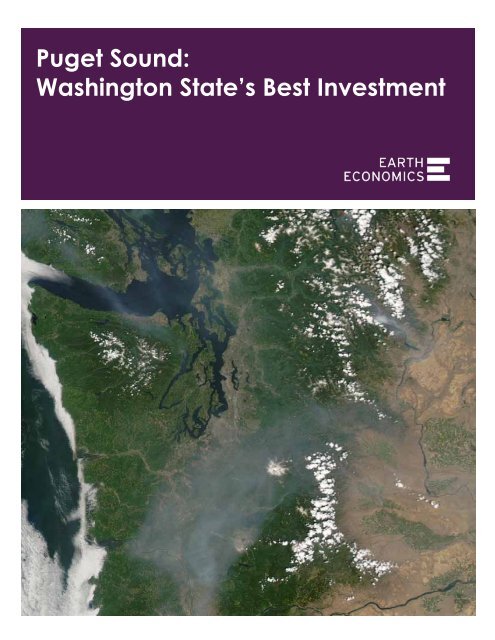
Cover photo from NASA Images<br />
PUGET SOUND: WASHINGTON STATE’S BEST INVESTMENT<br />
3
in•vest•ment in’ves(t)m nt<br />
Noun:<br />
1. The action or process of investing money for profit or material result.<br />
2. A thing that is worth buying because it may be profitable or useful in the future.<br />
3. An act of devoting time, effort, or energy to a particular undertaking with the<br />
expectation of a worthwhile result.<br />
e<br />
A 21 st Century <strong>Washington</strong> State approach to<br />
economic development recognizes that longterm<br />
job creation and environmental restoration<br />
and investment must go hand-in-hand. When<br />
management of flood protection, fish and wildlife<br />
habitat, wastewater, drinking water, and other<br />
important natural and human functions are treated<br />
as whole systems at the scale of their physical<br />
boundaries, we gain dramatic improvements in<br />
economic efficiency. Healthy ecosystems provide<br />
raw materials and core infrastructure functions that<br />
simultaneously provide profound and direct positive<br />
benefits to <strong>Washington</strong>’s economy.<br />
This paper explores how investing in <strong>Puget</strong> <strong>Sound</strong><br />
recovery saves tax dollars and creates jobs for<br />
<strong>Washington</strong> State. By looking at Chesapeake Bay<br />
recovery efforts, we can apply valuable and proven<br />
approaches. We explore how to leverage natural<br />
capital for greater economic prosperity for all<br />
<strong>Washington</strong> State residents and provide specific<br />
examples that leaders can implement immediately.<br />
4
Natural Capital<br />
A systems approach recognizes that our natural<br />
environment provides economically valuable goods<br />
and services that individuals, firms, and governments<br />
need, including oxygen, potable water, food, flood and<br />
storm protection, a stable climate, perpetuation of<br />
biodiversity, recreation, and more. These are what we<br />
refer to as ecosystem goods and services or benefits<br />
we receive from natural systems. Natural capital is<br />
our stock of minerals, energy, plants, animals, and<br />
ecosystems that yields a flow of ecosystem goods<br />
and services. Natural capital is an efficient producer<br />
of many goods and services, and it is largely selfmaintaining<br />
and in some cases even appreciates over<br />
time, while built capital depreciates and eventually<br />
falls apart. For example, a forest provides water<br />
flow regulation, flood protection, aesthetic and<br />
recreational values, slope stability, biodiversity,<br />
drinking water filtration, and other services with little<br />
or no maintenance costs.<br />
Natural capital assets such as forests, wetlands and<br />
marine waters, and the benefits they provide, such<br />
as water, flood protection, food and recreation, are<br />
far more stable in value than many other economic<br />
assets, such as stocks or real estate. Natural capital<br />
provides for long-term, high-wage jobs that cannot<br />
be off-shored. The economic value of natural<br />
capital assets brings in hard revenue from outside<br />
<strong>Washington</strong> State, which supports economic<br />
development and a high quality of life.<br />
PUGET SOUND: WASHINGTON STATE’S BEST INVESTMENT<br />
5
<strong>Investment</strong> Opportunity<br />
Our <strong>Puget</strong> <strong>Sound</strong> economy is built upon the land and<br />
waters of the <strong>Puget</strong> <strong>Sound</strong> Basin, where 1.6 million<br />
people, 70% of <strong>Washington</strong> State’s population, work,<br />
live, and play. 1<br />
Nearly 71% of all jobs and 77% of total<br />
income in <strong>Washington</strong> State are found<br />
in the <strong>Puget</strong> <strong>Sound</strong> Basin. 2<br />
Fourteen out of twenty-three identified ecosystem<br />
goods and services provided by nature within the<br />
Basin provide benefits worth over $10 billion in<br />
value every year. If the basin were treated as an<br />
economic asset that provides this annual flow of<br />
goods and services, the asset value of the <strong>Puget</strong><br />
<strong>Sound</strong> Basin would be between $300 billion and $2.6<br />
trillion. 3 Even at the low end of this estimate, the<br />
value of natural systems in the <strong>Puget</strong> <strong>Sound</strong> Basin is<br />
enormous. Yet this wealth is being lost. 3<br />
The key to securing ecological sustainability,<br />
employment, and economic prosperity is investment.<br />
Today’s investment in <strong>Puget</strong> <strong>Sound</strong> determines the<br />
physical nature of <strong>Washington</strong> State’s economy<br />
tomorrow. As built capital has become more common<br />
and natural capital more scarce, natural capital has<br />
increased in relative value. Thus the returns from<br />
investing in natural capital have also risen. Investing<br />
in the health of <strong>Puget</strong> <strong>Sound</strong> has a higher rate of<br />
return on investment (ROI) and more certain return<br />
than most built capital investments.<br />
As the ecological health of the <strong>Puget</strong><br />
<strong>Sound</strong> Basin improves or deteriorates,<br />
benefits provided by natural systems<br />
for free and potentially in perpetuity<br />
will rise or fall to the benefit or<br />
detriment of <strong>Washington</strong> State’s<br />
economy.<br />
Lessons from Chesapeake<br />
Much like <strong>Puget</strong> <strong>Sound</strong>, Chesapeake Bay is a regional<br />
economic and ecological backbone. The Bay is home<br />
to residents, recreation, commercial and military<br />
ports, and historically important (though declining)<br />
commercial fisheries. 4 Chesapeake Bay is also the<br />
largest estuary in the contiguous United States,<br />
providing a wealth of ecosystem services. 5<br />
Forty Years of Recovery Efforts<br />
The states of Virginia, Maryland, and Pennsylvania,<br />
and the District of Columbia, have promoted<br />
Chesapeake recovery for the past forty years.<br />
In the mid 1970s, studies showed pollution was<br />
increasing due to growing agricultural application<br />
of fertilizers and chemicals, population density,<br />
and sewage treatment plant discharge. 6 In 1976,<br />
the Environmental Protection Agency (EPA) began<br />
examining nutrient over-enrichment, influx of toxic<br />
substances, and the decline in submerged vegetation.<br />
The Chesapeake Bay Agreement of 1983 aligned the<br />
recovery efforts of the three surrounding states, the<br />
federal government, and the District of Columbia. 7<br />
This agreement helped set the goals for recovery<br />
at the actual systems scale of the problem across<br />
jurisdictional boundaries and enabled coordinated<br />
action to solve common problems. One finds many<br />
parallels to the challenges now faced by the multijurisdictional<br />
context of <strong>Puget</strong> <strong>Sound</strong>.<br />
The Chesapeake 2000 Plan was showcased as a<br />
model of ecosystem-based management, but so far<br />
the results of the plan’s implementation have been<br />
mixed; moderate advances have been achieved in<br />
some areas, while declines have continued in others.<br />
Points of failure in the Chesapeake 2000 Plan can be<br />
attributed in part to misalignment of state agency<br />
goals and measurements. 8<br />
6
The <strong>Puget</strong> <strong>Sound</strong> Action Agenda provides clear<br />
interagency goals, priorities, and reporting and<br />
correctly identifies solutions at the scale of the<br />
problem, however, there are still many lessons we can<br />
learn from the Chesapeake Bay example. Chesapeake<br />
takeaways for <strong>Puget</strong> <strong>Sound</strong> efforts include:<br />
1. Restoration and Economic Development Go Handin-Hand.<br />
Because healthy natural systems are<br />
essential to economic development, restoration<br />
should not be viewed merely as an amenity.<br />
2. Dependable Funding Mechanisms are Needed.<br />
Understanding the economic benefits that can<br />
be realized from restoration, mapping and<br />
quantification of real financial damages from<br />
degradation, and clearly identifying beneficiaries<br />
helps establish development of fair, rational,<br />
dependable, and sufficient funding mechanisms<br />
to pay for restoration. Without including the<br />
enormous value that <strong>Puget</strong> <strong>Sound</strong> ecosystems<br />
provide, restoration work will continue to be<br />
underfunded. 9<br />
3. Goals and Measurements Must Be Aligned Across<br />
Agencies and Jurisdictions. Chesapeake Bay is 195<br />
miles long, a 64,000 square mile watershed that<br />
spans six states and is home to 16 million people. 5<br />
Because the health of the Bay is affected by actions<br />
of the individual and corporate residents of six<br />
states, effective coordination of their activities is<br />
paramount. This cannot be accomplished without<br />
an institution at the actual scale of the basin.<br />
Developing common goals, and determining a<br />
strategy to meet them, ensures that improvements<br />
in one area will not be offset by declines in another,<br />
and helps avoid overlapping efforts. Coordination<br />
of multiple stakeholders provides greater benefits<br />
in a far more cost-effective way toward achieving<br />
desired results. In <strong>Washington</strong> State, the <strong>Puget</strong><br />
<strong>Sound</strong> Action Agenda addresses this need.<br />
PUGET SOUND: WASHINGTON STATE’S BEST INVESTMENT<br />
4. The Public Must Feel Ownership and<br />
Responsibility. Communication, proper framing,<br />
and public engagement are critical to realizing<br />
shared goals. Relating the scope and articulating<br />
benefits of the effort to the public helps secure<br />
the political, behavioral, economic, and cultural<br />
changes needed. Showing the relationship between<br />
the costs and total potential benefits of restoration<br />
work builds public ownership, the required sense of<br />
public ownership and responsibility. 10 This includes<br />
demonstrating ecosystem service values, and the<br />
jobs they create, while also showing the public’s<br />
role in restoration, such as reducing fertilizer<br />
application on lawns and in agriculture.<br />
Because protection and conservation can be<br />
implemented by the public, the Chesapeake<br />
2000 plan emphasizes individual and community<br />
stewardship of the Bay. 11 These include efforts to<br />
introduce every student in the watershed to the<br />
bay through direct interaction, a “government by<br />
example” commitment which includes pledges related<br />
to land-use and vehicle emissions reductions, and a<br />
citizen monitoring program which trains volunteers<br />
to perform water quality tests. 11 All of these efforts<br />
elevate public awareness and shared commitment.<br />
Recovery Cost Comparison<br />
The current cost of recovery of the Chesapeake<br />
Bay is estimated at $18.7 billion. 9; 12 One Maryland<br />
county estimates their costs through 2025 to be $800<br />
million, and like others, is searching for ways to fund<br />
this effort. 13 In comparison, <strong>Puget</strong> <strong>Sound</strong> recovery is<br />
estimated to be approximately $9 billion 14 , with much<br />
of funding coming from <strong>Washington</strong> State, the federal<br />
government, and the 12 counties and 115 cities in the<br />
<strong>Puget</strong> <strong>Sound</strong> region.<br />
The degradation functions of natural and built capital<br />
are different. The cost of restoring damaged or<br />
replacing lost ecosystems is high; habitat collapse has<br />
a non-linear and exponential cost when compared to<br />
lost functions of built infrastructure. Without positive<br />
restoration, there will be further deterioration, which<br />
will likely cause recovery costs to rise significantly.<br />
7
An economy is the physical product<br />
of previous decades of investment.<br />
Advancing WA State’s Economy<br />
Economic advancement is driven by investment.<br />
An economy is the product of previous decades<br />
of investment. When committing resources to<br />
the building of our future economy, we must act<br />
with wisdom and responsibility to build solid<br />
infrastructure. From high-quality education for our<br />
children to transportation, emphasis is placed on<br />
developing social, natural, and built infrastructure<br />
that is equitable and provides the best return on<br />
investment. Billions of dollars in economic activity<br />
are created from the <strong>Puget</strong> <strong>Sound</strong> region; sustaining<br />
this asset in perpetuity contributes significantly to the<br />
economy in <strong>Washington</strong> State.<br />
As we work towards developing a greener economy,<br />
we look at the retention or restoration of natural<br />
systems as a key component of investment. Green<br />
infrastructure can dually be “natural capital” like<br />
forests, wetlands, and <strong>Puget</strong> <strong>Sound</strong>, and green<br />
“built capital” such as green buildings, renewable<br />
energy or paper mills with low ecological footprints.<br />
Green infrastructure is likely best accomplished<br />
as a combination of natural and built capital. For<br />
example, flood protection is most effective when it<br />
utilizes a natural system, such as a wider floodway,<br />
in conjunction with built systems, such as properly<br />
located buildings and the judicious use of levees and<br />
dams.<br />
8<br />
Wise economic decisions and infrastructure choices<br />
require good information. Improved economic analysis<br />
tools are now available to make the large-scale shift<br />
to sustainable green infrastructure a reality. Good<br />
investment provides greater returns to projects that<br />
internalize environmental and social costs.<br />
Good investment provides greater<br />
returns to projects that internalize<br />
environmental and social costs.<br />
Hundreds of billions of dollars will be spent on private<br />
and public investment in the <strong>Puget</strong> <strong>Sound</strong> Basin in the<br />
next 20 years. 3 Like the investments of past decades,<br />
this investment will determine the physical nature of<br />
the <strong>Washington</strong> State economy. It will also determine<br />
how the economy will impact the lands that house<br />
the cities, manufacturing facilities, people, wetlands,<br />
prairies, forests, rivers, and mountains of the <strong>Puget</strong><br />
<strong>Sound</strong> Basin. Every dollar invested or spent will<br />
contribute to ecological damage or benefit.<br />
It is increasingly clear that the major negative impacts<br />
to <strong>Puget</strong> <strong>Sound</strong> are the result of environmental<br />
degradation from expanding built infrastructure. Storm<br />
water, sewer effluent, non-point pollution and land<br />
use changes are all driven by infrastructure investment<br />
decisions that do not fully consider the externalities<br />
of environmental costs. They demonstrate that our<br />
investments in infrastructure can hurt us as well as
help us. The <strong>Puget</strong> <strong>Sound</strong> Basin cannot be ecologically<br />
healthy or restored if we do not change how public and<br />
private infrastructure investment in built and green<br />
infrastructure is made. 3<br />
Value of the Ecosystem Services in <strong>Puget</strong><br />
<strong>Sound</strong><br />
In 2010, <strong>Earth</strong> <strong>Economics</strong> conducted a partial<br />
valuation of 14 ecosystem services across 17 land<br />
cover types in the <strong>Puget</strong> <strong>Sound</strong> Basin. This study<br />
showed the asset value of marine and terrestrial<br />
ecosystems in the <strong>Puget</strong> <strong>Sound</strong> Basin to be hundreds<br />
of billions of dollars, with benefits provided to the<br />
regional economy calculated at between $9.7 and $83<br />
billion per year.<br />
The natural systems in the <strong>Puget</strong><br />
<strong>Sound</strong> Basin provide up to $83 billion<br />
in economic benefits to the state’s<br />
economy per year. 3<br />
Environmental Restoration and Economic<br />
Development<br />
In restoration and conservation, the potential return<br />
on investment justifies significant investment. The<br />
rate of return on a particular restoration or green<br />
infrastructure investment depends on the physical<br />
and economics characteristics of the restoration<br />
work. Currently, the number of trees planted or miles<br />
of shoreline restored is tracked, but the economical<br />
impact of that work is not typically calculated. For<br />
example, the Thea Foss Waterway clean-up provided<br />
a 2:1 return: over $300 million in new investment.<br />
This return on investment is expected to support over<br />
1,036 jobs and return about $134 million in additional<br />
tax revenue to the state over the next 20 years. 15<br />
Figure 1: Value of Built and Natural Capital over Time<br />
Value of Build Capital<br />
Using a 3% discount rate, the asset or present<br />
value provided by 14 ecosystem services in the<br />
<strong>Puget</strong> <strong>Sound</strong> Basin is as much as $2.6 trillion. a For<br />
conventional purposes, a positive discount rate<br />
accommodates for the nominal value of future goods.<br />
Unlike regular goods and services, however, natural<br />
ecosystems do not depreciate over time. Figure 1<br />
(below) shows how the value of natural capital grows<br />
across time at an increasing rate relative to built<br />
capital, which depreciates. When using a 0% discount<br />
rate to reflect equal value, provided across time, over<br />
a span of 100 years, the asset or present value of<br />
ecosystem services in the <strong>Puget</strong> <strong>Sound</strong> Basin is $8.3<br />
trillion on the high end. b<br />
Value<br />
Time<br />
Value of Natural Capital<br />
Value<br />
a) Accounting for uncertainty, and the range of ecosystem<br />
services values, the net present value with a 3% discount rate<br />
calculated by <strong>Earth</strong> <strong>Economics</strong> is between $305 billion and $2.6<br />
trillion. 3<br />
b) The net present value with a 0% discount rate calculated by<br />
<strong>Earth</strong> <strong>Economics</strong> is between $967 billion and $8.3 trillion. 3<br />
PUGET SOUND: WASHINGTON STATE’S BEST INVESTMENT<br />
Time<br />
9
The expected dollar value of ecosystem services<br />
provided by restoration or green infrastructure<br />
investments can be estimated in the same way<br />
benefits from built capital are estimated. Table 1<br />
highlights some of the findings of the 2010 study<br />
showing a range of annual economic values for<br />
different vegetation covers. The great differences<br />
between minimum and maximum values reported<br />
in peer reviewed studies can be contributed to great<br />
variation in health of the study site, date studied and<br />
methodology used. Generally, higher values can be<br />
associated with healthier functioning ecosystems.<br />
Like a house or business appraisal, there is a range of<br />
“comps” for estimating value.<br />
10
Table 1. Range in annual benefits per acre ecosystems provide to the state economy.<br />
Ecosystem Type Minimum Maximum<br />
Salt Marsh $382.75 $122,098.87<br />
Beach $23,787.06 $86,757.22<br />
Wetland $14,377.14 $71,103.69<br />
Riparian Forest (Mid-Late) $3,706.70 $27,004.81<br />
Lakes and Rivers $77.71 $22,022.28<br />
Eel Grass Beds $5,860.22 $16,410.10<br />
Riparian Forest (Pole) $1,144.16 $11,780.13<br />
Late/Old Forest (30+ cm diameter) $426.17 $2,578.20<br />
Open Water Estuary $110.15 $1,863.11<br />
Mid Age Stage Forest (10 to 20 cm<br />
$83.28 $1,163.45<br />
diameter)<br />
When we compare restoration costs to the high value range, the return on investment is<br />
extraordinary. In Table 2, the restoration costs of salt marshes and estuaries are compared to the<br />
annual ecosystem service value of these land types in their pristine condition.<br />
Table 2 - Costs of restoration and benefits of ecosystem services for salt marshes and open water estuaries.<br />
Land Type Restoration Cost 16 Note<br />
Salt Marsh<br />
$900 per acre (minor project)<br />
to<br />
$9,000 per acre (major project)<br />
Minor project example: Removal of invasive<br />
plant species.<br />
Major project example: Large-scale sediment<br />
removal.<br />
This figure does not include septic system<br />
upgrades.<br />
Open Water<br />
Estuary<br />
Land Type<br />
Salt Marsh<br />
Open Water<br />
Estuary<br />
$8,000 per acre (minor project)<br />
to<br />
$250,000 per acre (major project)<br />
Ecosystem Service<br />
Economic Benefit 3<br />
Up to $122,098.87 per acre, per<br />
year<br />
Up to $1,863.11 per acre, per year<br />
Minor project example: Removal of invasive<br />
plant or animal species.<br />
Major project example: Removal of<br />
contaminants and restoration from an oil spill.<br />
Note<br />
Salt marshes serve as storm buffers by acting<br />
as a sponge for large storm surges and heavy<br />
rainfall.<br />
Estuaries provide a safe haven and spawning<br />
grounds for a diverse list of animals including<br />
birds and fish.<br />
PUGET SOUND: WASHINGTON STATE’S BEST INVESTMENT<br />
11
Restoration Impact on Jobs: Shellfish Example<br />
Healthy riparian areas directly support the<br />
<strong>Washington</strong> State economy by providing beneficial<br />
ecological functions for downstream shellfish beds.<br />
Proper salinity levels and limited pollution from storm<br />
water runoff and septic systems are key to sustaining<br />
healthy conditions for beds of Manila clams and other<br />
commercial mollusks found in <strong>Puget</strong> <strong>Sound</strong> mudflats<br />
and estuaries.<br />
Restoring watersheds will reverse the decline of<br />
harvestable shellfish beds. The <strong>Puget</strong> <strong>Sound</strong> Action<br />
Agenda sets a 2020 goal to restore 10,800 acres of<br />
shellfish bed to harvestable quality. That adds jobs<br />
and economic value to the <strong>Puget</strong> <strong>Sound</strong> Basin (see<br />
Table 3).<br />
Shellfish bacterial and pollutant<br />
contamination has devastated the<br />
industry, which has led to the closing<br />
of thousands of acres of beds for<br />
harvesting, further eliminating nearly<br />
half of the industry’s jobs in <strong>Washington</strong><br />
State since 2000. 17<br />
12
Table 3 - Jobs associated with shellfish fishing in <strong>Puget</strong> <strong>Sound</strong>.<br />
Jobs currently supported by shellfish<br />
fishing in <strong>Puget</strong> <strong>Sound</strong><br />
2011 Current Status (1) Note<br />
311 jobs per year<br />
This figure does not include jobs associated<br />
with shellfish farms due to data availability<br />
difficulties.<br />
Jobs currently supported elsewhere<br />
in the <strong>Washington</strong> State economy by<br />
shellfish fishing<br />
Short term jobs created from<br />
restoration of 10,800 acres of shellfish<br />
beds by 2020<br />
Annual Increase in shellfish fishing<br />
jobs after restoration<br />
467 jobs per year<br />
Restoration of Shellfish Beds (2)<br />
1,469 jobs total<br />
22 jobs per year<br />
This figure includes jobs associated with<br />
production of shellfish like truck drivers who<br />
deliver harvested shellfish to workers who<br />
process them for food.<br />
Note<br />
This figure includes planning, construction,<br />
planting, and monitoring jobs created by<br />
shellfish bed restoration projects.<br />
These jobs will be permanently created<br />
from the increased acres of shellfish beds.<br />
Jobs supported elsewhere in economy<br />
from post-restoration creation of<br />
shellfish fishing jobs<br />
25 jobs per year Similar to above.<br />
(1) Current job figures are available on the Bureau of Labors Statistics website 17 and supported jobs were provided by a collection of job multipliers. 18<br />
(2) Using shellfish bed restoration 2020 goals from the Action Agenda, 19 job multipliers were used to calculate job creation. 20 All jobs figures are based on<br />
the assumption that 1,080 acres are restored each year until 2020 for discounting purposes(using a 4.125% discount rate).<br />
PUGET SOUND: WASHINGTON STATE’S BEST INVESTMENT<br />
13
Employment Security<br />
Economies work when people work. Employment<br />
is a necessity. Besides paying for food and rent,<br />
jobs deliver personal satisfaction. Work enables the<br />
surplus available for leisure and essential collective<br />
investments such as schools, roads, and health care,<br />
which in turn fuel greater economic productivity and<br />
a rising quality of life. Surveys show that even our<br />
level of happiness relies on the productivity of our<br />
own labor. 21<br />
The <strong>Puget</strong> <strong>Sound</strong> Basin provides significant<br />
employment in <strong>Washington</strong> State. As of October<br />
2011, there were over 3.17 million people working<br />
in <strong>Washington</strong> State. 22 Nearly 71% of all jobs and<br />
77% of total income in <strong>Washington</strong> State are found<br />
in the <strong>Puget</strong> <strong>Sound</strong> Basin. 2 These jobs include<br />
manufacturing, services and shipping. Over 100,000<br />
jobs are considered “green jobs” under a traditional<br />
definition of contributing to energy efficiency,<br />
renewable energy, environmental restoration,<br />
pollution reduction, and environmental awareness.<br />
Through the financial crisis, while traditional jobs<br />
shrank, green jobs expanded in <strong>Washington</strong> State<br />
and the <strong>Puget</strong> <strong>Sound</strong> Basin. From green technology<br />
to salmon restoration, businesses in the <strong>Puget</strong> <strong>Sound</strong><br />
Basin are creating sustainable jobs with a healthier<br />
environment. 23<br />
Through the financial crisis, while<br />
traditional jobs shrank, green jobs<br />
expanded in <strong>Washington</strong> State and the<br />
<strong>Puget</strong> <strong>Sound</strong> Basin.<br />
Importantly, investments in the conservation and<br />
restoration of <strong>Puget</strong> <strong>Sound</strong> cannot be sent overseas.<br />
The full economic benefits of healthy forests, marine<br />
waters, and all the goods and services they provide,<br />
are garnered right here in <strong>Washington</strong> State, and<br />
directly employ <strong>Washington</strong> State workers. Products<br />
derived from <strong>Puget</strong> <strong>Sound</strong> contribute to a positive<br />
and sustainable trade balance for <strong>Washington</strong> State.<br />
<strong>Investment</strong>s and jobs in the<br />
conservation and restoration of <strong>Puget</strong><br />
<strong>Sound</strong> cannot be sent overseas.<br />
Products derived from <strong>Puget</strong><br />
<strong>Sound</strong> contribute to a positive<br />
and sustainable trade balance for<br />
<strong>Washington</strong> State.<br />
14
Steps for <strong>Washington</strong> State’s Leaders:<br />
1. Support health measures and track progress<br />
vis-à-vis the <strong>Puget</strong> <strong>Sound</strong> Action Agenda.<br />
2. Question if natural capital is correctly<br />
accounted for in projects.<br />
3. Create state standards for improved jobs<br />
analysis for restoration.<br />
4. Get jurisdictional scales to basin boundary.<br />
5. Support changes in Benefit-Cost Analysis.<br />
6. Strengthen Watershed Characterization<br />
studies.<br />
Building a well-rounded and sustainable <strong>Washington</strong><br />
State economy is dependent upon healthy natural<br />
systems in the <strong>Puget</strong> <strong>Sound</strong> Basin. Boeing and<br />
Paccar, for example, are two of the state’s largest<br />
manufacturers. Both are fully dependent upon<br />
the flood protection and abundant water supply<br />
provided by natural forests, wetlands and riparian<br />
corridors in the Snohomish, Cedar and Green River<br />
watersheds where their manufacturing plants are<br />
located. In addition, these and other companies such<br />
as Microsoft, Google, Real Networks and Amazon<br />
are able to attract a highly skilled labor force to the<br />
<strong>Puget</strong> <strong>Sound</strong> area because workers are attracted to<br />
the beauty, clean environment, outstanding outdoor<br />
opportunities and high quality of life provided by a<br />
healthy <strong>Puget</strong> <strong>Sound</strong> Basin.<br />
Creating a robust demand for employment with<br />
higher wages, greater resiliency, health, wealth,<br />
and diversity in the 21 st century <strong>Washington</strong> State<br />
economy requires investing in the coordination of<br />
investment within, restoration of, and conservation<br />
of the <strong>Puget</strong> <strong>Sound</strong> Basin.<br />
PUGET SOUND: WASHINGTON STATE’S BEST INVESTMENT<br />
15
Achieving Sustainability and<br />
Economic Prosperity<br />
Shifting investment requires accounting that includes<br />
the value of natural capital, improved measures and<br />
tracking, jobs analysis, better benefit-cost analysis,<br />
and accessible economic incentives that reward green<br />
investment.<br />
<strong>Puget</strong> <strong>Sound</strong> Health Measures<br />
Many human activities threaten the health of <strong>Puget</strong><br />
<strong>Sound</strong> ecosystems. There is agreement among<br />
regional scientists and community leaders that loss<br />
of habitat and rising pollution levels are the top two<br />
threats facing <strong>Puget</strong> <strong>Sound</strong> health. 19<br />
In 2006, the <strong>Washington</strong> State Legislature directed<br />
the <strong>Puget</strong> <strong>Sound</strong> Partnership ((“The Partnership”) to<br />
work closely with existing state, regional and local<br />
organizations as well as at all levels of government<br />
to develop and implement the scientifically sound<br />
Action Agenda to achieve recovery of <strong>Puget</strong> <strong>Sound</strong><br />
by 2020. 19 The Partnership was authorized to provide<br />
assistance to watershed groups implementing the<br />
Action Agenda. It was also charged with improving<br />
coordination among the jurisdictions and actors to<br />
improve efficiency and accelerate the implementation<br />
of the Action Agenda. The Partnership also helps set<br />
and monitor goals.<br />
The Action Agenda sets a plan at the actual<br />
scale of the problem and aligns stakeholders,<br />
jurisdictions and other partners. This clear plan,<br />
along with management and assessment by various<br />
state agencies (including the <strong>Washington</strong> State<br />
departments of Ecology, Department of Natural<br />
Resources and Fish and Wildlife) has delivered<br />
significant federal investment in <strong>Puget</strong> <strong>Sound</strong><br />
recovery. In the first three years since the formation<br />
of the Partnership in 2007, nearly $440 million has<br />
been invested in <strong>Puget</strong> <strong>Sound</strong>. In 2010, over $90<br />
million in federal funding was allocated to <strong>Puget</strong><br />
<strong>Sound</strong> recovery. c In 2010 alone, state, federal and<br />
organizational investment in <strong>Puget</strong> <strong>Sound</strong> generated<br />
roughly 6,494 <strong>Washington</strong> State jobs. d<br />
In 2010 alone, state, federal and<br />
organizational investment in <strong>Puget</strong><br />
<strong>Sound</strong> generated roughly 6,494<br />
<strong>Washington</strong> State jobs. Measuring and<br />
reporting progress vis-à-vis the Action<br />
Agenda is key to ensuring significant<br />
federal investment continues<br />
.<br />
RECOMMENDATION: Measure and report the<br />
economic benefits of <strong>Puget</strong> <strong>Sound</strong> restoration<br />
progress, under the Action Agenda framework:<br />
jobs created, ecosystem value and ecosystem<br />
health. Currently, the Partnership’s website<br />
features a Vital Signs dashboard that allows<br />
tracking of progress on restoration goals from the<br />
Action Agenda, and perhaps it could be updated<br />
to include more information on the economic<br />
benefits of the various restoration projects<br />
proposed and underway.<br />
c) This dollar figure was derived from a collection of 2010 grant<br />
data from the Pacific Coast Salmon Recovery Fund, the National<br />
Fish and Wildlife Foundation, Northwest Straits Commission and<br />
the Environmental Protection Agency.<br />
d) The job figures here were calculated by deriving the millions<br />
of dollars distributed to each project type (restoration type, land<br />
acquisition, maintenance, etc) and using a variety of multipliers<br />
specific to these project types. 18; 20; 24-28 In some cases, many job<br />
multipliers were averaged.<br />
16
Natural Capital Accounting<br />
Watershed-filtered water utilities like Seattle Public<br />
Utilities and Tacoma Water contribute billions of<br />
dollars to local and regional economies by managing<br />
lands that provide ecosystem services such as fresh<br />
water filtration, storage and supply, flood protection,<br />
habitat and recreation. Currently, natural capital is<br />
not recognized as a capital asset that is measurable<br />
within standard accounting systems. As a result, these<br />
assets are undervalued and investment in the form of<br />
capital improvements, maintenance, and operations<br />
are insufficient.<br />
In addition, funding mechanisms such as bonding are<br />
not available for restoring natural capital. <strong>Washington</strong><br />
State and the counties of the <strong>Puget</strong> <strong>Sound</strong> Basin<br />
can lead the way initiating changes in national<br />
accounting rules to accommodate the economic<br />
value that natural capital provides. <strong>Earth</strong> <strong>Economics</strong><br />
has identified concrete steps agencies can take to<br />
properly account for natural capital and is currently<br />
engaged in discussions with the Government<br />
Accounting Standards Review Board (GASB) to discuss<br />
rule changes for government agencies. Steps include<br />
disclosure to the public on financial transmittal<br />
letters and description of natural assets in financial<br />
footnotes.<br />
RECOMMENDATION: Disclose the value of natural<br />
capital in annual reports, in annual financial<br />
transmittal letters and in communications to<br />
the public. Agency finance directors can contact<br />
<strong>Earth</strong> <strong>Economics</strong> (info@eartheconomics.org) for<br />
example transmittal letter text.<br />
Jobs Analysis for Restoration<br />
Currently, jobs for restoration projects are measured<br />
in terms of shovels in the ground, not in terms of<br />
the long-term jobs created as a result of restored<br />
ecosystems. Restoring salmon populations, for<br />
example, increases recreational, commercial, and<br />
tribal jobs, as well as wholesale and retail jobs.<br />
As Table 4 shows below, estuarial and riparian<br />
restoration creates more jobs per $1 million spent<br />
than infrastructure projects such as road work.<br />
Job creation from land and estuarial restoration is<br />
significant because natural areas produce ecosystem<br />
goods (like increased salmon yields) which contribute<br />
to the economy both through industry and recreation.<br />
Creating jobs is increasingly important for the<br />
allocation of federal funds, therefore counting jobs<br />
created by restored ecosystem services is a vital part<br />
of any restoration effort.<br />
RECOMMENDATION: <strong>Washington</strong> State should have<br />
the capacity to calculate job growth resulting from<br />
natural system restoration for any projects in the<br />
<strong>Puget</strong> <strong>Sound</strong> Basin or in the state.<br />
Table 4 - Job Multipliers by Type<br />
Definitely<br />
Jobs Created per<br />
Million of $ Invested<br />
(2010 $)<br />
General Construction 28 11.95<br />
Highway & Street<br />
Construction 28 11.94<br />
Land Acquisition 27 13.9<br />
Sewer & Water<br />
14.68<br />
Construction 28<br />
Management &<br />
Administrative<br />
17.16<br />
(Education) 28 18; 24; 25<br />
Land Restoration 18.5 (average)<br />
Estuary & Riparian<br />
26; 29<br />
23.5<br />
Restoration<br />
(average)<br />
PUGET SOUND: WASHINGTON STATE’S BEST INVESTMENT<br />
17
Correct Jurisdictional Scale<br />
Single-purpose investments often create<br />
“infrastructure conflict,” where one infrastructure<br />
investment frustrates the single-purpose goals of<br />
other infrastructure investments. Coordinating<br />
the investment of single-purpose districts within<br />
watersheds, and then within the <strong>Puget</strong> <strong>Sound</strong> Basin,<br />
could provide far greater benefits at less cost. Where<br />
ecosystem services such as clean water and flood<br />
control are lost, new single-purpose tax districts<br />
such as shellfish districts, storm water districts, and<br />
flood districts are created, with investments that can<br />
undermine each other.<br />
For example, 16 cities in the Green/Duwamish River<br />
Watershed have built storm water systems, generally<br />
directing water more quickly into the Green River.<br />
This has increased peak flows and flood damage,<br />
including damage to levees. Both higher levees and<br />
current storm water systems have contributed to<br />
salmon mortality and a reduction in water quality,<br />
thereby damaging <strong>Puget</strong> <strong>Sound</strong>. Alternatively,<br />
multiple benefits are produced through allowing a<br />
flood district to pay the marginal difference between<br />
a green infrastructure storm water option that puts<br />
water back into the ground water. In turn, this handles<br />
storm water, which reduces flooding and contributes<br />
to higher flows in low-flow periods for salmon.<br />
RECOMMENDATION: The determination of the<br />
scale of any natural capital district should be<br />
informed by the nature of the watershed, the area<br />
that provides the service, actions that damage<br />
the service, and the location of the beneficiaries.<br />
Appropriately recognizing the scale of jurisdictions<br />
would vastly reduce costs and provide greater<br />
benefits to <strong>Washington</strong> State’s citizens.<br />
Watershed <strong>Investment</strong> District Example<br />
Seeing a tremendous opportunity to turn singlepurpose<br />
investments into win-win watershed<br />
investments that improve water quality and the<br />
health of <strong>Puget</strong> <strong>Sound</strong>, the Green/Duwamish River<br />
Watershed (WRIA 9) is pursuing a funding model<br />
that will serve as a case study for other watersheds<br />
in <strong>Washington</strong> State. WRIA 9 is one of the state’s<br />
most developed watersheds that is home to major<br />
industries (Boeing), agricultural development and<br />
over 600,000 people.<br />
With unanimous support from 16 cities, King County,<br />
the business community and non-profit groups within<br />
WRIA 9, <strong>Earth</strong> <strong>Economics</strong> held and participated in a<br />
series of discussions among city agencies, counties,<br />
businesses, NGOs and other members of <strong>Puget</strong><br />
<strong>Sound</strong> Watershed Resource Inventory Areas 7, 8,<br />
9, 10, 11 and 12 between 2008 and 2010. Through<br />
these engagements we developed the concept of<br />
creating an institution to be organized and operated<br />
at an appropriate (watershed) scale. The Watershed<br />
<strong>Investment</strong> District (WID) would facilitate an<br />
integrated approach to watershed and natural capital<br />
management.<br />
As watershed ecosystem services tend to conform to<br />
natural boundaries, this scale for a WID would be an<br />
appropriate scale for integrating planning, funding<br />
and management of services such as flood control,<br />
storm water management, and carbon sequestration.<br />
Such an integrated approach is consistent with<br />
86.15.035 RCW specifications for involving flood<br />
control districts, cooperative watershed management<br />
actions and with 39.34.200 RCW, which establishes<br />
a general precedent for watershed management<br />
partnerships.<br />
“King County, in partnership with a cross-WRIA<br />
coordination team, has created a rough draft of state<br />
legislation that would authorize the development<br />
of this integrated WID approach. The WID could be<br />
designed as a tax district to restore natural capital<br />
on a watershed scale. Just as the Transportation<br />
Department we need federal, state, regional and<br />
local transportation agencies to work cooperatively<br />
to maintain restores and maintains our road systems,<br />
we need local, regional, state and federal cooperation<br />
to maintain our green infrastructure.<br />
18
A WID It could also would help coordinate investment<br />
within the watershed between local agencies and<br />
institutions (i.e. utilities, flood districts, shell fish<br />
districts, stormwater districts, cities, counties) and<br />
other regional institutions (i.e. PSP), state agencies<br />
(i.e. <strong>Washington</strong> Departments of Ecology, Health,<br />
Natural Resources, Parks, and Fish and Wildlife), and<br />
federal agencies (i.e Environmental Protection Agency,<br />
Homeland Security, Department of Agriculture).<br />
Finally, for some counties, particularly rural counties,<br />
a WID framework could allow for the creation of<br />
a district that encompasses several institutions or<br />
jurisdictional efforts, such as a flood district, salmon<br />
restoration and storm water management.”<br />
While gaps in current Benefit-Cost methodology<br />
ignore services provided to the community, it also fails<br />
to inform urban planners of the costs of developing<br />
in floodplains. By not fully counting the benefits of<br />
natural floodplains, the current Benefit-Cost Analysis<br />
used by federal, state and local agencies tends to<br />
support repeat flooding and house reconstruction<br />
and repairs, rather than the purchase and removal of<br />
houses within the floodway.<br />
RECOMMENDATION: Review and consider<br />
supporting the legislation enabling the creation of<br />
a Watershed <strong>Investment</strong> District.<br />
Benefit-Cost Analysis<br />
Benefit-Cost Analysis, also known as Cost-Benefit<br />
Analysis, is the economic tool used by federal, state,<br />
and local agencies when making decisions about<br />
projects and programs. However, Benefit-Cost<br />
Analysis does not include the contributions of natural<br />
ecosystems in the protection and economic security<br />
of communities. Excluding the services of ecosystems<br />
will allow those services to degrade, ultimately<br />
harming communities and <strong>Washington</strong> State’s<br />
economy. Including these services - which is now<br />
possible and inexpensive to do - will give far better<br />
results.<br />
Flood and Community Response Example<br />
During a storm, a forest will retain rainwater, soil,<br />
and debris, which are valuable ecosystem services to<br />
flood-risk communities. Since the current methods<br />
of Benefit-Cost Analysis do not place value on these<br />
services, the flood protection the forest provides is<br />
often ignored. As a result, the forest will be cleared<br />
or degraded. The community will lose the flood<br />
protection services provided by the forest and will<br />
be at greater risk. This often strains the community’s<br />
engineered flood protection infrastructure.<br />
PUGET SOUND: WASHINGTON STATE’S BEST INVESTMENT<br />
<strong>Washington</strong> State is experiencing increased severity<br />
of flooding hazards, growing population, large-scale<br />
landscape alterations and rising stresses on critical<br />
ecosystems. As a result of increased risks from<br />
flooding, communities, businesses and ecosystems<br />
have incurred greater costs as they rebuild homes and<br />
livelihoods in the wake of flood events. The National<br />
Ocean and Atmospheric Administration (NOAA)<br />
reports that 2010 floods in the United States caused<br />
nearly $5.114 billion in damage. Of that total, $1.118<br />
billion was in agricultural crop loss. 30<br />
The impacts of flooding on communities can last for<br />
19
decades. Flooding displaces rural households and<br />
small businesses. The agricultural landscape is altered<br />
and crops are depleted. Infrastructure is destroyed.<br />
Lives are disrupted. Jobs are lost.<br />
RECOMMENDATION: The State of <strong>Washington</strong><br />
could lead the way by instituting changes in State<br />
Benefit-Cost Analysis protocols, using <strong>Puget</strong> <strong>Sound</strong><br />
Basin projects as an example. Agencies can now<br />
request improvements in Army Corps of Engineers<br />
and other federal agency Benefit-cost Analyses<br />
to include ecosystem services. Better Benefit-<br />
Cost Analysis tools are available to apply to this<br />
approach in <strong>Puget</strong> <strong>Sound</strong> and across <strong>Washington</strong><br />
State.<br />
RECOMMENDATION: All watersheds in the <strong>Puget</strong><br />
<strong>Sound</strong> Basin should have an ecosystem service<br />
analysis completed and updated every five years.<br />
The appropriate staff from government, private<br />
firms, and non-profits should have ecosystem<br />
service training and the capacity to apply<br />
ecosystem service tools in their work.<br />
Watershed Characterization Studies<br />
Watershed characterization studies are important<br />
to understanding the physical nature of watersheds.<br />
Watershed characterizations, salmon habitat plans,<br />
and other watershed-based analyses can be informed<br />
by an ecosystem service analysis. It is also important<br />
that state agencies, particularly the Department of<br />
Natural Resources and Department of Ecology (which<br />
have supported ecosystem service analyses), adopt<br />
this analysis as a normal part of operations.<br />
To date, several watershed inventory areas (WRIAs)<br />
have included ecosystem service analyses in<br />
decision-making, including the Snohomish River<br />
Watershed, Green River/Duwamish Central <strong>Puget</strong><br />
<strong>Sound</strong> Watershed, Puyallup White River Watershed,<br />
Nisqually River Watershed, and the Skykomish, Tolt,<br />
and Snoqualmie sub-watersheds.<br />
<strong>Earth</strong> <strong>Economics</strong> is developing tools and training for<br />
consulting companies, government agencies, and<br />
non-profits to conduct and update ecosystem service<br />
analysis at very low cost. We expect these tools to be<br />
available for inclusion in watershed characterization<br />
studies and for other uses in late 2012.<br />
20
Conclusion<br />
Our <strong>Puget</strong> <strong>Sound</strong> economy is built upon the land and<br />
waters of the <strong>Puget</strong> <strong>Sound</strong> Basin, and it contributes to<br />
a healthy and growing <strong>Washington</strong> State Economy. We<br />
cannot continue to advance economically and socially<br />
without acknowledgement of the ecosystem services<br />
the <strong>Puget</strong> <strong>Sound</strong> Basin provides. The tax revenues<br />
provided within the <strong>Puget</strong> <strong>Sound</strong> Basin help support<br />
<strong>Washington</strong> State, as they support roads, schools,<br />
police, parks, and other benefits for all citizens. Rural<br />
communities throughout <strong>Washington</strong> State see jobs<br />
and services decline when tax revenues from the<br />
<strong>Puget</strong> <strong>Sound</strong> Basin fall. 31<br />
Restoring <strong>Puget</strong> <strong>Sound</strong> generates jobs, goods, and<br />
services, in addition to drawing in greater investment.<br />
For example, the Thea Foss Waterway clean-up<br />
provided a 2:1 return, over $300 million in new<br />
investment. This return in investment is expected<br />
to support over 1,036 jobs and return about $134<br />
million in additional tax revenue to the state over<br />
the next 20 years. 15 Thanks in large part to the vision<br />
of <strong>Washington</strong> State’s leadership and the focused<br />
goals provided by the <strong>Puget</strong> <strong>Sound</strong> Partnership, this<br />
example is being replicated all over <strong>Puget</strong> <strong>Sound</strong> and<br />
is contributing to <strong>Washington</strong> State in hard economic<br />
times.<br />
The citizens of <strong>Washington</strong> State are on the threshold<br />
of seeing ecological economics play a significant role in<br />
infrastructure and planning at all levels of government.<br />
Imagine <strong>Washington</strong> State fostering a robust, holistic<br />
approach to urban and rural watersheds based on<br />
ecosystem services:<br />
• An approach where investments in storm water<br />
management, flood protection, drinking water,<br />
salmon habitat, biodiversity preservation,<br />
forestry, and conservation are integrated to<br />
provide greater benefits at lower costs —the<br />
foundation of a 21 st century green economy in<br />
<strong>Washington</strong> State.<br />
• An approach where land-use planning,<br />
systems modeling, GIS mapping, and new<br />
ES tools can help decision makers recognize<br />
ecosystem value and provide critical<br />
guidance for legally sound action in project<br />
and planning efforts.<br />
• An approach where agencies and<br />
jurisdictions have reliable funding<br />
mechanisms for conservation and<br />
restoration, based on the science and<br />
economics of ecosystem services,<br />
eliminating dependency on competition for<br />
scarce federal restoration grants.<br />
• An approach that acknowledges that it<br />
is less costly to protect now than restore<br />
later. The true cost of polluting is not only<br />
calculated but incurred, allowing for more<br />
spending on protection today in order to<br />
avoid unnecessary high payments required<br />
by restoration in the future.<br />
This vision is possible and it starts with <strong>Puget</strong> <strong>Sound</strong>.<br />
<strong>Investment</strong> can be shifted on a large scale to secure<br />
sustainability in watersheds, for both urban and<br />
rural areas. This new model is already underway in<br />
many Western <strong>Washington</strong> watersheds that feed<br />
<strong>Puget</strong> <strong>Sound</strong>, including the Cedar, Green River-<br />
Duwamish, Puyallup, Snohomish, and Nisqually. This<br />
vision is supported by critical stakeholders including<br />
Snohomish, King and Pierce County staff, the<br />
academic and scientific community, state agencies<br />
and <strong>Puget</strong> <strong>Sound</strong> Partnership, and community-based<br />
non-governmental organizations.<br />
<strong>Washington</strong> State is a national leader in smart<br />
investment in natural capital. But there is still more<br />
work to do and there are advancements to be made<br />
in terms of policy, implementation, and tracking.<br />
With focused effort from leaders at the state,<br />
regional, and local levels, together we can ensure a<br />
healthy, prosperous 21 st Century <strong>Washington</strong>.<br />
PUGET SOUND: WASHINGTON STATE’S BEST INVESTMENT<br />
21
Photo Credits<br />
Cover<br />
© NASA images<br />
PAGE 4<br />
© everystock photo | Kevin<br />
PAGE 5<br />
© Fotolia | John Matzick<br />
PAGE 8<br />
© Fotolia | NING RUAN<br />
PAGE 10<br />
© Fotolia | Paylessimages<br />
Page 12<br />
© fotolia | mlehmann78<br />
PAGE 14<br />
© Lars Sundström<br />
PAGE 15<br />
© wikimedia | snty-tact<br />
PAGE 19<br />
© Fotolia | dschreiber29<br />
22
References<br />
1<br />
<strong>Washington</strong> State Department of Ecology, 2008. Focus on <strong>Puget</strong> <strong>Sound</strong>: Economic Facts. Available at: http://<br />
www.ecy.wa.gov/pubs/0601006.pdf (Accessed December 2011). Publication Number: 06-01-006 (rev. 10/08).<br />
2<br />
U.S. Department of Commerce Bureau of Economic Analysis, 2012. Regional data: GDP & Personal Income.<br />
Available at: http://www.bea.gov/iTable/iTable.cfmReqID=70&step=1 (Accessed January 6, 2012).<br />
3<br />
Batker, D., Kocian, M., McFadden, J., Schmidt, R., 2010. Valuing The <strong>Puget</strong> <strong>Sound</strong> Basin: Revealing Our <strong>Best</strong><br />
<strong>Investment</strong>s. <strong>Earth</strong> <strong>Economics</strong>, Tacoma, WA, USA.<br />
4<br />
Boesch, D.F., 2006. Scientific requirements for ecosystem-based management in the restoration of the<br />
Chesapeake Bay and Coastal Louisiana. Ecological Engineering 26, 6-26.<br />
5<br />
Chesapeake Bay Foundation, Building blocks for emerging environmental non-profit organizations: Lessons<br />
from the Chesapeake Bay Foundation. Available at: http://www.cbf.org/document.docid=203 (Accessed<br />
December 2011).<br />
6<br />
United States Environmental Protection Agency, 2011. Chesapeake Bay. Available at: http://www.epa.gov/<br />
oaqps001/gr8water/xbrochure/chesapea.html (Accessed December 2011)<br />
7<br />
Bocksteal, N.E., McConnell, K.E., Strand, I.E., 1989. Measuring the Benfits of Improvements in Water Quality:<br />
The Chesapeake Bay. Marine Resource <strong>Economics</strong> 6, 1-18.<br />
8<br />
Chesapeake Bay Program, 2011. Status of Chesapeake 2000 Commitments. Available at: http://www.<br />
chesapeakebay.net/statusofc2kcommitments.aspxmenuitem=51573 (Accessed December 2011)<br />
9<br />
Chesapeake Bay Commission, 2003. The Cost of a Clean Bay: Assessing Funding Needs Throughout the<br />
Watershed. Available at: http://www.chesbay.us/Publications/C2Kfunding.pdf (Accessed December 12, 2011).<br />
10<br />
Van Cleve, F.B., Simenstad, C., Goetz, F., Mumford, T., 2004. Application of “best available science” in<br />
ecosystem restoration: lessons learned from large-scale restoration efforts in the USA. <strong>Puget</strong> <strong>Sound</strong> Nearshore<br />
Partnership Report No. 2004-01. Published by <strong>Washington</strong> Sea Grant Program, University of <strong>Washington</strong>,<br />
Seattle, <strong>Washington</strong>. Available at: http://pugetsoundnearshore.org (Accessed December 2011).<br />
11<br />
Chesapeake Bay Program, 2002. The State of the Chesapeake Bay: A Report to the Citizens of the Bay Region.<br />
Available at: http://www.chesapeakebay.net/content/publications/cbp_13112.pdf (Accessed December 2011).<br />
12<br />
Chesapeake Bay Partnership, 2011. Facts and Figures. Available at: http://www.chesapeakebay.net/<br />
factsandfigures.aspxmenuitem=14582 (Accessed December 2011)<br />
13<br />
Giles, B., November 27, 2011. Chesapeake Bay Cleanup could cost Prince George’s $800 million. http://<br />
washingtonexaminer.com/local/maryland/2011/11/chesapeake-bay-cleanup-could-cost-pg-800-million/<br />
(Accessed December,2011), <strong>Washington</strong> Examiner.<br />
PUGET SOUND: WASHINGTON STATE’S BEST INVESTMENT<br />
23
14<br />
<strong>Puget</strong> <strong>Sound</strong> Partnership, 2006. <strong>Sound</strong> Health, <strong>Sound</strong> Future: Protecting and Restoring <strong>Puget</strong> <strong>Sound</strong>. Available<br />
at: http://www.psparchives.com/publications/about_us/psi_reports/final/final/Final_wAPPx_lr.pdf (Accessed<br />
December 2011), p. 95.<br />
15<br />
<strong>Washington</strong> State Department of Ecology, 2010. Economic Vitality and Environmental Cleanup in <strong>Washington</strong><br />
State: Qualitative and Quantitative Case Study. Publication no. 10-09-046. Available at: http://www.ecy.wa.gov/<br />
biblio/1009046.html (Accessed December 2011). Toxics Cleanup Program, <strong>Washington</strong> State Department of<br />
Ecology, Olympia, <strong>Washington</strong>, USA.<br />
16<br />
Coastal Resources Management Council, 2012. Restoring Coastal Habitats for Rhode Island’s Future: Cost<br />
Analysis. Available at: http://www.edc.uri.edu/restoration/html/tech_sci/socio/costs.htm (Accessed December<br />
2011).<br />
17<br />
Bureau of Labor Statistics, 2012. State and County Employment and Wages. Available at: http://data.bls.gov/<br />
pdq/querytool.jspsurvey=en (Accessed December 2011).<br />
18<br />
Alderman, D., Catani, K., Fister, J., Huber, G., McCormick, E., Tchivzhel, A., Wood, E., 2010. Measuring the<br />
Economic Benefits of America’s Everglades Restoration. Prepared for the Everglades Foundation. Available at:<br />
http://everglades.3cdn.net/8edd03d0943ae993fe_e0m6i4gx2.pdf (accessed December 2011).<br />
19<br />
<strong>Puget</strong> <strong>Sound</strong> Partnership, 2009. Action Agenda (May 2009 update). Available at: http://www.psp.wa.gov/<br />
downloads/AA2009/Action_Agenda_FINAL_063009.pdf (Accessed December 2011).<br />
20<br />
Oaks, D., Stewardship Partners. December 23, 2011. Personal Interview.<br />
21<br />
The Happiness Initiative, 2011. Happiness Survey. Available at: http://happycounts.org/survey/GNH<br />
(Accessed December 2011).<br />
22<br />
U.S. Bureau of Labor Statistics, 2011. Economy at a Glance. Available at: http://www.bls.gov/eag/eag.wa.htm<br />
(Accessed December 2011).<br />
23<br />
Hardcastle, A., 2010. 2009 <strong>Washington</strong> State Green Economy Jobs. Available at: http://www.<br />
workforceexplorer.com/admin/uploadedPublications/10258_Green_Jobs_Report_for_Web_2009.pdf<br />
(Accessed December 2011).<br />
24<br />
Pincus-Nielson, M.a.M., C., 2009. A Preliminary Estimate of Economic Impact and Job Creation from the<br />
Oregon Watershed Enhancement Board’s Restoration <strong>Investment</strong>s, Institute for a Sustainable Environment,<br />
University of Oregon. Available at: http://www.roguebasinwatersheds.org/files/estimate%20of%20<br />
economic%20impact%20and%20job%20creation.pdf (Accessed December 2011).<br />
25<br />
Vaile, J., 2010. Restoring the Rogue: A PLan to Prioritize Restoration on Federal Lands in Rogue River<br />
Basin., Klamath-Siskiyou Wildlands Center. Available at: http://kswild.org/what-we-do-2/restoration-andcollaboration/RRR.FINAL_SM.pdf<br />
(Accessed December 2011).<br />
24
26<br />
Buckley, M., 2010. Getting the Demand Right for Valuing Urban Ecosystem Services in the Pacific Northwest,<br />
ECONorthwest. Available at: http://conference.ifas.ufl.edu/aces10/Presentations/Tuesday/C-/pm/<br />
Yes/0350%20M%20buckley.pdf (Accessed December 2011).<br />
27<br />
Department of Interior, 2011. The Department of the Interior’s Economic Contributions. Available at: http://<br />
www.blm.gov/or/socioeconomic/files/DOI-Econ-Report-6-21-2011.pdf (Accessed December 2011).<br />
28<br />
<strong>Washington</strong> State Recreation and Conservation Office, 2012. <strong>Washington</strong> State Input Output Model.<br />
29<br />
Restore America’s Estuaries, 2011. Jobs & Dollars: Big Returns from Coastal Habitat Restoration. Available at:<br />
http://www.estuaries.org/images/stories/rae17.pdf (Accessed December 2011).<br />
30<br />
National Oceanic and Atmospheric Administration, 2011. Economic Costs: Annual U.S. Flooding Summary.<br />
Available at: http://www.economics.noaa.gov/goal=weather&file=events/precip&view=costs<br />
31<br />
Batker, D., et. al. 2012. EverGreen Jobs: Sustainable Employment in <strong>Washington</strong> State. In Press.<br />
PUGET SOUND: WASHINGTON STATE’S BEST INVESTMENT<br />
25
<strong>Earth</strong> <strong>Economics</strong><br />
107 N. Tacoma Avenue<br />
Tacoma, WA 98403<br />
www.eartheconomics.org<br />
253.539.4801


