Journal of Low Temperature Physics 171, 619 - DR. CLAUDIO ...
Journal of Low Temperature Physics 171, 619 - DR. CLAUDIO ...
Journal of Low Temperature Physics 171, 619 - DR. CLAUDIO ...

You also want an ePaper? Increase the reach of your titles
YUMPU automatically turns print PDFs into web optimized ePapers that Google loves.
J<strong>Low</strong>TempPhys<br />
DOI 10.1007/s10909-012-0828-8<br />
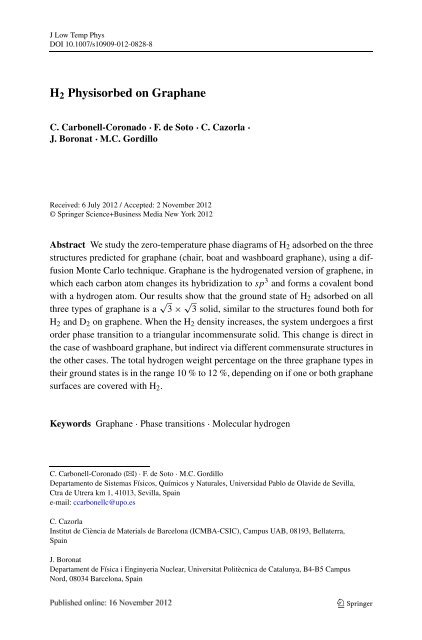
H 2 Physisorbed on Graphane<br />
C. Carbonell-Coronado · F. de Soto · C. Cazorla ·<br />
J. Boronat · M.C. Gordillo<br />
Received: 6 July 2012 / Accepted: 2 November 2012<br />
© Springer Science+Business Media New York 2012<br />
Abstract We study the zero-temperature phase diagrams <strong>of</strong> H 2 adsorbed on the three<br />
structures predicted for graphane (chair, boat and washboard graphane), using a diffusion<br />
Monte Carlo technique. Graphane is the hydrogenated version <strong>of</strong> graphene, in<br />
which each carbon atom changes its hybridization to sp 3 and forms a covalent bond<br />
with a hydrogen atom. Our results show that the ground state <strong>of</strong> H 2 adsorbed on all<br />
three types <strong>of</strong> graphane is a √ 3 × √ 3 solid, similar to the structures found both for<br />
H 2 and D 2 on graphene. When the H 2 density increases, the system undergoes a first<br />
order phase transition to a triangular incommensurate solid. This change is direct in<br />
the case <strong>of</strong> washboard graphane, but indirect via different commensurate structures in<br />
the other cases. The total hydrogen weight percentage on the three graphane types in<br />
their ground states is in the range 10 % to 12 %, depending on if one or both graphane<br />
surfaces are covered with H 2 .<br />
Keywords Graphane · Phase transitions · Molecular hydrogen<br />
C. Carbonell-Coronado () · F. de Soto · M.C. Gordillo<br />
Departamento de Sistemas Físicos, Químicos y Naturales, Universidad Pablo de Olavide de Sevilla,<br />
Ctra de Utrera km 1, 41013, Sevilla, Spain<br />
e-mail: ccarbonellc@upo.es<br />
C. Cazorla<br />
Institut de Ciència de Materials de Barcelona (ICMBA-CSIC), Campus UAB, 08193, Bellaterra,<br />
Spain<br />
J. Boronat<br />
Departament de Física i Enginyeria Nuclear, Universitat Politècnica de Catalunya, B4-B5 Campus<br />
Nord, 08034 Barcelona, Spain
J<strong>Low</strong>TempPhys<br />
1 Introduction<br />
The interest in graphene as a structure formally derived from graphite has risen lately,<br />
due, among other things, to the possibility <strong>of</strong> using it as adsorbent. Studying the<br />
physisorption <strong>of</strong> H 2 on C-surfaces has the additional interest <strong>of</strong> assessing whether<br />
these surfaces could be used as reservoir in fuel cells. To do so, a certain amount<br />
<strong>of</strong> hydrogen has to be captured by the substrate. Hence, an ideal structure will be<br />
the hydrogenated version <strong>of</strong> graphene, which has been called graphane. In graphane,<br />
each carbon forms a covalent bond with a hydrogen atom. The existence <strong>of</strong> graphane<br />
was theoretically predicted by S<strong>of</strong>o and collaborators [1], who proposed two different<br />
types <strong>of</strong> graphane, the chair graphane (C-graphane) and the boat one (B-graphane).<br />
Elias and collaborators [2] were able to synthesize the chair graphane in 2009. In 2010<br />
a third type <strong>of</strong> graphane, the washboard graphane (W-graphane), was predicted [3].<br />
Here, we present zero-temperature calculations <strong>of</strong> the phase diagrams <strong>of</strong> H 2 adsorbed<br />
on the three different types <strong>of</strong> graphane, using the diffusion Monte Carlo technique.<br />
The aim <strong>of</strong> this work will be to compare those diagrams to those obtained on<br />
graphene and estimate the weight percentage <strong>of</strong> H 2 that can be adsorbed on top <strong>of</strong><br />
these novel structures.<br />
The plan <strong>of</strong> this work is as follows. In Sect. 2 we will describe the computational<br />
method used in our calculations, indicating the parameters and auxiliary hypotheses<br />
necessary to carry out the simulations. In Sect. 3 the simulation results will be<br />
discussed and lastly, Sect. 4 will present our conclusions.<br />
2 Method<br />
In order to obtain the zero-temperature phase diagrams we have to solve the manybody<br />
Schrödinger equation for a set <strong>of</strong> H 2 molecules adsorbed on graphane. The<br />
diffusion Monte Carlo method makes this possible for a system <strong>of</strong> bosons, such as<br />
the para-H 2 molecules considered here. The starting point <strong>of</strong> the method is the trial<br />
function, an initial approximation to the ground state wave function <strong>of</strong> the system.<br />
To simulate a liquid arrangement, we have to use the translational invariant. In this<br />
work, this means,<br />
Ψ L (r 1 , r 2 ,...,r N ) = ∏ i
J<strong>Low</strong>TempPhys<br />
i.e., we used the product <strong>of</strong> a liquid-like wave function by a Gaussian term whose<br />
purpose is to confine the H 2 molecules around the crystallographic positions (x I ,y I )<br />
corresponding to the particular solids we are interested in. The parameters b and<br />
c on Eq. (1) and Eq. (2) were optimized using previous Variational Monte Carlo<br />
calculations on each <strong>of</strong> the phases considered.<br />
The H 2 –H 2 interactions were modeled by the Silvera and Goldman potential [4]<br />
and the H 2 –C and H 2 –H by a Lennard-Jone one. In this last case, we used the<br />
Lorentz-Berthelot combination rules to obtain the mixed parameters from the C–C<br />
and H–H interactions given in Ref. [5] and from the H 2 –H 2 ones in Ref. [6].<br />
3 Results<br />
A summary <strong>of</strong> our simulation results on C-graphane is displayed in Fig. 1. From there,<br />
we can see that the ground state for H 2 on this structure is a √ 3 × √ 3 commensurate<br />
solid (solid circles in Fig. 1), since its energy per particle is lower than that <strong>of</strong> any<br />
other arrangement. This structure is similar to the ground state <strong>of</strong> H 2 on graphene [7].<br />
When the H 2 density increases, we observe a phase transition (see Table 2)toaδ commensurate<br />
phase (similar to the one obtained for D 2 on graphene [8, 9]) that changes<br />
to a triangular incommensurate solid (see Table 2) upon further hydrogen intake. The<br />
stability limits for these arrangements were determined by means <strong>of</strong> Maxwell doubletangent<br />
constructions. In this figure we also display the data for other structures: a 2/5<br />
commensurate phase, a 3/7 commensurate arrangement and third structure found stable<br />
on B-graphane (see below). Any <strong>of</strong> those structures are metastable with respect<br />
to a mixture <strong>of</strong> the √ 3 × √ 3 phase and the δ phase (in the case <strong>of</strong> the 2/5 structure)<br />
or the incommensurate solid (for the 3/7 phase and the commensurate one), due to<br />
their relatively high energies per particle .<br />
Fig. 1 Energy per particle for<br />
different H 2 phases adsorbed on<br />
C-graphane. Solid circle,<br />
√<br />
3 ×<br />
√<br />
3 registered solid; solid<br />
square, δ phase; inverted solid<br />
triangles, liquid arrangement;<br />
and circles, incommensurate<br />
triangular solid. Solid triangle,<br />
commensurate structure; square,<br />
3/7 phase; solid diamond, 2/5<br />
phase. The dashed and the solid<br />
line are fourth order polynomial<br />
fits to their corresponding data<br />
sets. The statistical error bars<br />
due to the uncertainties in the<br />
DMC calculation are smaller<br />
than the symbols are were not<br />
displayed for simplicity (Color<br />
figure online)
J<strong>Low</strong>TempPhys<br />
Table 1 Energies per particle at the ground state (E √ 3× √ 3<br />
), compared to the energies <strong>of</strong> the liquid<br />
phases at the same density (E liquid ) for the three types <strong>of</strong> graphane. The result for the same structure on<br />
graphene is also shown for comparison [7]. In the solid structures, the error bars are the ones derived from<br />
the Diffusion Monte Carlo calculation, since these structures are produced at a single density. On the other<br />
hand, the uncertainties in the liquid densities derive from four order polynomial fits to obtain the minimum<br />
point in a energy versus density representation<br />
E √ 3× √ 3 /K<br />
E liquid/ K<br />
C-graphane −401.180 ± 0.005 −397 ± 1<br />
B-graphane −407.09 ± 0.01 −404.3 ± 0.7<br />
W-graphane −414.140 ± 0.005 −406.9 ± 0.2<br />
Graphene [7] −461.12 ± 0.01 −451.88 ± 0.03 a<br />
a Energy per H 2 molecule for the liquid phase at the equilibrium density ρ 0 = (0.05948 ± 0.00005) Å<br />
Table 2 Stable phases and densities at which the phase transitions occur<br />
Phase<br />
Density/Å −2<br />
C-graphane<br />
B-graphane<br />
W-graphane<br />
√ √<br />
3 × 3 0.0600<br />
δ 0.0743<br />
incommensurate 0.081<br />
√ √<br />
3 × 3 0.0615<br />
δ 0.0762<br />
commensurate 0.0922<br />
incommensurate 0.1032<br />
√ √<br />
3 × 3 0.0674<br />
incommensurate 0.0719<br />
In the case <strong>of</strong> H 2 adsorbed on B-graphane and W-graphane, our results also show<br />
that the lowest energy per particle in both cases corresponds to √ 3 × √ 3 commensurate<br />
solid (see Table 1). In B-graphane (see Table 2), there is also a phase transition<br />
from a √ 3 × √ 3toaδ phase, in a similar way to what happens on C-graphane.<br />
However, an increase in the hydrogen density does not produce a triangular incommensurate<br />
solid right away, but another stable commensurate structure. This is a novel<br />
arrangement, whose layout is displayed in Fig. 3. There, we show the projection <strong>of</strong><br />
the positions on the z = 0 plane <strong>of</strong> 300 H 2 configurations (each one containing a set <strong>of</strong><br />
(x, y) coordinates taken from our simulations) on the B-graphane. Those projections<br />
produce the splotches displayed in Fig. 3, while the circles are the (x, y) coordinates<br />
<strong>of</strong> the C atoms <strong>of</strong> the graphane skeleton. The hydrogen atoms bound to those carbon<br />
atoms were not displayed for simplicity. We can see then that in this new structure,<br />
the H 2 molecules are located in between two <strong>of</strong> the carbon atoms whose C–H bonds<br />
point upwards. Since those positions are not isotropically distributed, the pair distribution<br />
function for this arrangement, displayed in Fig. 2, shows a set <strong>of</strong> two peaked<br />
maxima instead <strong>of</strong> the regular structures characteristic <strong>of</strong> a liquid phase.
J<strong>Low</strong>TempPhys<br />
Fig. 2 Pair distribution<br />
functions on the xy plane for<br />
different structures on<br />
B-graphane. The blue line<br />
represents the liquid phase at a<br />
density <strong>of</strong> 0.0740 Å −2 and the<br />
purple one, the new<br />
commensurate structure<br />
observed to be stable on<br />
B-graphane at a density <strong>of</strong><br />
0.0921 Å −2 (Color figure<br />
online)<br />
In the case <strong>of</strong> H 2 adsorbed on W-graphane, the δ phase is not stable. This means<br />
that the phase transition goes directly from a √ 3 × √ 3 phase to a triangular incommensurate<br />
solid. In Fig. 4 we represent the pair distribution function for the stable<br />
triangular incommensurate phase at a density <strong>of</strong> 0.0843 Å −2 and the corresponding<br />
ones for δ and liquid phases at similar densities. From this figure, we can see that<br />
even the solid structures (the stable triangular phase and the unstable δ solid) are more<br />
isotropic than the commensurate structure already described for the B-graphane. This<br />
is probably due to their smaller density in comparison to the one in the B-graphene.<br />
This increases the average distances between first (and successive) neighbors and<br />
blurs the differences between them to merge the maxima in the pair correlation functions.<br />
4 Conclusions<br />
We presented the zero-temperature H 2 phase diagrams on three types <strong>of</strong> graphane.<br />
In all cases, the ground state is the √ 3 × √ 3 commensurate solid, the similar result<br />
than the obtained for graphene [7]. From this structure, one or several phase transitions<br />
takes the system to a stable triangular incommensurate solid if the density<br />
increases enough. For W-graphane, the transition is direct. However, for C-graphane<br />
and B-graphane there are intermediate stable structures. In the case <strong>of</strong> C-graphane,<br />
the intermediate arrangement is a δ phase, a commensurate solid similar to the found<br />
for D 2 graphene and graphite [8]. On B-graphane, the phase transition goes first to<br />
the δ commensurate phase and later to an another commensurate structure.
J<strong>Low</strong>TempPhys<br />
Fig. 3 Simulation cell used for<br />
the new commensurate solid on<br />
B-graphane. Solid circles are the<br />
projection <strong>of</strong> the positions <strong>of</strong> the<br />
carbon atoms on the z = 0plane.<br />
In purple, werepresenttheC<br />
atoms bound to the H atoms<br />
located on top <strong>of</strong> the carbon<br />
skeleton, while the blue dots are<br />
the C atoms bound to the H<br />
atoms located on the bottom part<br />
<strong>of</strong> the structure. The rectangle<br />
demarcates the unit cell <strong>of</strong> this<br />
arrangement (Color figure<br />
online)<br />
Fig. 4 Pair distribution<br />
functions on the xy plane for<br />
different structures on<br />
W-graphane. The blue line<br />
represents the liquid phase at<br />
density 0.0812 Å −2 ,thered one<br />
the triangular incommensurate<br />
solid at density 0.0843 Å −2<br />
(stable phase) and the green one<br />
the delta phase at density<br />
0.0836 Å −2 (unstable<br />
arrangement) (Color figure<br />
online)<br />
In graphane, each carbon is bound to a hydrogen atom. This means that in bare<br />
graphane the hydrogen weight percentage is 7.7 %. When H 2 is added, the ground<br />
state (the one for which the total pressure is zero) is a √ 3 × √ 3 phase, in which we<br />
have two H 2 molecules on each unit cell containing three graphane hexagons. This
J<strong>Low</strong>TempPhys<br />
means that the total hydrogen percentage increases to about 10 % or 12 % depending<br />
on if one or both graphane surfaces are covered with H 2 . Those values are above the<br />
6.5 % in weight necessary for graphane to be used in fuel cells. However, further tests<br />
would be necessary in order to ascertain if such a system is suitable for reversible H 2<br />
adsorption in the working conditions <strong>of</strong> a fuel cell.<br />
Acknowledgements We acknowledge partial financial support from the Junta de Andalucía Group PAI-<br />
205, Grant No. FQM-5985, MICINN (Spain) Grants No. FIS2010-18356 and FIS2011-25275, and Generalitat<br />
de Catalunya Grant 2009SGR-1003.<br />
References<br />
1. J.O. S<strong>of</strong>o, A.S. Chaudhari, G.D. Barber, Phys. Rev. B 75, 153401 (2007)<br />
2. D.C. Elias, R.R. Nair, T.M.G. Mohiuddin, S.V. Morozov, P. Blake, M.P. Halsall, A.C. Ferrari, D.W.<br />
Boukhvalov, M.I. Katsnelson, A.K. Geim, K.S. Novoselov, Science 323, 610 (2009)<br />
3. E. Cadelano, P.L. Palla, S. Giordano, L. Colombo, Phys. Rev. B 82, 235414 (2010)<br />
4. I.F. Silvera, V.V. Goldman, J. Chem. Phys. 69, 4209 (1978)<br />
5. J.M. Phillips, M.D. Hammerbacher, Phys. Rev. B 29, 5859 (1984)<br />
6. G. Stan, M.J. Bojan, S. Curtarolo, S.M. Gatica, M.W. Cole, Phys. Rev. B 62, 2173 (2000)<br />
7. M.C. Gordillo, J. Boronat, Phys. Rev. B 81, 155435 (2010)<br />
8. C. Carbonell-Coronado, M.C. Gordillo, Phys. Rev. B 85, 155427 (2012)<br />
9. H. Freimuth, H. Wiechert, H.P. Schildberg, H.J. Lauter, Phys. Rev. B 42, 587 (1990)