Risk analysis case study of enthalpy wheels for laboratory exhaust
Risk analysis case study of enthalpy wheels for laboratory exhaust
Risk analysis case study of enthalpy wheels for laboratory exhaust

Create successful ePaper yourself
Turn your PDF publications into a flip-book with our unique Google optimized e-Paper software.
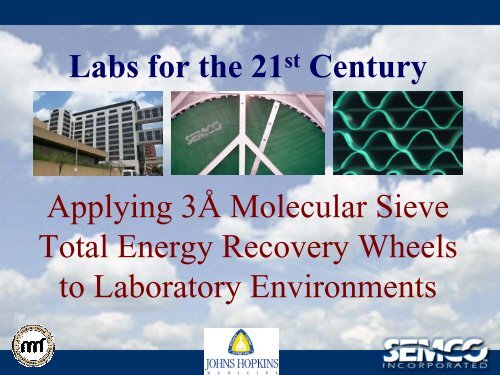
Labs <strong>for</strong> the 21 st Century<br />
Applying 3Å Molecular Sieve<br />
Total Energy Recovery Wheels<br />
to Laboratory Environments
Joint Presentation By:<br />
Mike Dausch P.E.<br />
– Director <strong>of</strong> Design & Construction<br />
Johns Hopkins School <strong>of</strong> Medicine<br />
Duane Pinnix P.E.<br />
– President, RMF Engineering Inc.<br />
John Fischer<br />
– Technology Consultant, SEMCO<br />
Inc.
Johns Hopkins Ross Research Building:<br />
The Owner’s Perspective
Johns Hopkins Ross Research Building:<br />
• 450,000 cfm <strong>of</strong> combined<br />
<strong>laboratory</strong>/vivarium<br />
• 164 fume hoods, 154 biosafety<br />
cabinets and general <strong>exhaust</strong><br />
through recovery <strong>wheels</strong><br />
• Eight SEMCO 3Å molecular<br />
sieve coated total energy<br />
recovery <strong>wheels</strong> (14’ diameter)<br />
• 13 years <strong>of</strong> successful operation
Initial <strong>Risk</strong> Assessment Process:<br />
• Head <strong>of</strong> Health and Safety, Project Engineer, Project<br />
Manager and others visited a successful <strong>laboratory</strong><br />
installation using the wheel technology<br />
• Johns Hopkins installed a 20,000 cfm pilot system in<br />
Animal Virology to allow in-house testing by the<br />
Health and Safety Office<br />
• Good results led to the acceptance <strong>of</strong> the technology<br />
<strong>for</strong> the Ross Research Building<br />
• ASHRAE Paper on results by Hopkins Staff (1996)
Ross Building Life Cycle Analysis<br />
Total recovery <strong>wheels</strong> <strong>of</strong>fset 1452 tons <strong>of</strong> chiller<br />
capacity and 680 boiler horsepower<br />
Provided a positive present value cash flow <strong>of</strong><br />
$9,100,000 based on 20 year life cycle<br />
Will provide estimated energy savings in the<br />
amount <strong>of</strong> $16,600,000 over the 20 year life<br />
cycle <strong>analysis</strong> period<br />
Assumes: inflation at 2.5% and cost <strong>of</strong> capital <strong>of</strong> 6%, no taxes
Maintenance Requirements<br />
• All wheel maintenance is completed in the supply<br />
airstream, no need to go in <strong>exhaust</strong><br />
• Bearing maintenance, check drive belt, idler and<br />
gear motor<br />
• No need to clean media or change labyrinth seals<br />
unless damaged<br />
• Media sections replaceable should damage or<br />
corrosion occur<br />
• Purge angle adjusted at commissioning<br />
• Initial 5 year parts and labor warranty
Ross Building Maintenance Cost<br />
• No filters in the <strong>exhaust</strong> air compartment, current<br />
pressure loss is within 10% <strong>of</strong> what it was when<br />
new<br />
• Over 13 years maintenance costs amounted to<br />
approximately $94,000 in total involving:<br />
– Annual drive belt replacement<br />
– Frequency drive upgrade<br />
– Replaced transfer media in three <strong>wheels</strong> due to damage<br />
• Maintenance cost less than 1% <strong>of</strong> energy savings<br />
over first 13 years ($94,000/$9,890,000)
Johns Hopkins Ross Research Building:<br />
Designs Engineer’s Perspective
Challenges: Laboratory HVAC Design<br />
• High outdoor quantity <strong>of</strong> air (<strong>of</strong>ten 100%)<br />
• Large cooling/heating plant capacity requirements<br />
• Desire <strong>for</strong> redundant chiller and boiler capacity<br />
• Corresponding high energy and first cost<br />
• Need <strong>for</strong> tight temperature & humidity control<br />
• High humidification loads (non-boiler steam)<br />
• Optimize occupant safety within allocated Budget
Comparing Recovery Options<br />
Recovery Efficiency (%)<br />
vs.<br />
Face Velocity<br />
Pressure Loss (in.wg.)<br />
vs.<br />
Face Velocity<br />
Relative Energy Savings<br />
10,000 CFM System<br />
in St. Louis<br />
80<br />
2.0<br />
$20K<br />
70<br />
1.5<br />
$15K<br />
60<br />
1.0<br />
$10K<br />
50<br />
.5<br />
$5K<br />
400 700 1000<br />
Face Velocity<br />
400 700 1000<br />
Face Velocity<br />
Different Technology<br />
Options<br />
Total Energy Wheel<br />
Plate Exchanger<br />
Heat Pipe<br />
Run Around Coils<br />
Source: ASHRAE and SMACNA Design Guide
Design Considerations<br />
NFPA 45 and IMC code compliance<br />
Program functions: Bio-medical, Chemistry,<br />
Vivariums<br />
Fume hood and BSC density<br />
<strong>Risk</strong> assessment with safety <strong>of</strong>ficer<br />
System configuration – penthouse size, height<br />
Life Cycle Cost Analysis<br />
Procurement methods
Ross Building: Benefits Recognized<br />
• Economical application <strong>of</strong> constant volume, 100%<br />
outdoor air system to <strong>laboratory</strong> (preferred by the<br />
Head <strong>of</strong> Health and Safety)<br />
• Significant reduction in first cost, operating cost<br />
and life cycle cost. Provided exceptional ROI<br />
• Reduced chiller/boiler capacity requirements<br />
allowed <strong>for</strong> the use <strong>of</strong> central plant utilities<br />
• Improved humidity control, reduced condensate on<br />
cooling coils by 65% and size <strong>of</strong> steam to steam<br />
humidifiers.<br />
• Resolved “freeze-stat” alarms with frozen coils
Johns Hopkins Ross Research Building<br />
Benchmark Capacity:<br />
• 335,000 Gross Program Square Feet – 580 Program Modules<br />
13% Lobby/Core, 43% Lab, 23% Circulation, 14% Office, 7% Vivarium<br />
• Fume Hood: 155 Orig.164 Current 6% Increase<br />
BSC’s: 88 Orig. 154 Current 75% Increase<br />
• 450,000 CFM 1.34 CFM/gsf and 9.5 ACH (8.5’ Avg. Clg.)<br />
8.5 Watts/gsf<br />
• 3493 Tons Cooling or 96 gsf/Ton wo/HR<br />
1951 Tons Cooling or 172 gsf/Ton w/HR 44% Reduction<br />
• 27,850 MBH or 83 BTU/HR/gsf wo/HR<br />
5,168 MBH or 15 BTU/HR/gsf w/HR 81% Reduction
Cooling Mode: Ross Building<br />
455,000 cfm<br />
75 o F<br />
66 gr.<br />
94 o F<br />
106 gr.<br />
400,000 cfm<br />
420,000 cfm<br />
100 o F<br />
82 o F<br />
52 o F<br />
52 o F<br />
475,000 cfm<br />
118 gr.<br />
80 gr.<br />
56 gr.<br />
56 gr.<br />
Data reflects initial project design conditions <strong>for</strong> the cooling mode
Heating Mode: Ross Building<br />
455,000 cfm<br />
75 o F<br />
66 gr.<br />
22.5 o F<br />
19 gr.<br />
400,000 cfm<br />
420,000 cfm<br />
475,000 cfm<br />
5 o F<br />
3.4 gr.<br />
55 o F<br />
48 gr.<br />
55 o F<br />
48 gr.<br />
55 o F<br />
55 gr.<br />
Data reflects initial project design conditions <strong>for</strong> the heating mode
Johns Hopkins Ross Research Building<br />
AHU-1 Heat Wheel Test Data<br />
100<br />
95<br />
90<br />
Outside Air<br />
91.71° F<br />
85<br />
Heatwheel Supply EAT<br />
97.04° F<br />
80<br />
Heatwheel Supply LAT<br />
85.10° F<br />
75<br />
Heatwheel Exhaust EAT<br />
76.62° F<br />
70<br />
Heatwheel Exhaust LAT<br />
92.46° F<br />
Test Date: 6/26/03 16:24:00<br />
65<br />
60<br />
12:00 AM<br />
1:00 AM<br />
2:00 AM<br />
3:00 AM<br />
4:00 AM<br />
5:00 AM<br />
6:00 AM<br />
7:00 AM<br />
8:00 AM<br />
9:00 AM<br />
10:00 AM<br />
11:00 AM<br />
12:00 PM<br />
1:00 PM<br />
2:00 PM<br />
3:00 PM<br />
4:00 PM<br />
5:00 PM<br />
6:00 PM<br />
7:00 PM<br />
8:00 PM<br />
9:00 PM<br />
10:00 PM<br />
11:00 PM<br />
12:00 AM<br />
Time<br />
Temperature (F)
Johns Hopkins Ross Research Building<br />
AHU-1 Heat Wheel Test Data<br />
100<br />
95<br />
90<br />
Energy Recovered<br />
85<br />
80<br />
75<br />
70<br />
65<br />
60<br />
12:00 AM<br />
12:48 AM<br />
1:36 AM<br />
2:24 AM<br />
3:12 AM<br />
4:00 AM<br />
4:48 AM<br />
5:36 AM<br />
6:24 AM<br />
7:12 AM<br />
8:00 AM<br />
8:48 AM<br />
9:36 AM<br />
10:24 AM<br />
11:12 AM<br />
12:00 PM<br />
12:48 PM<br />
1:36 PM<br />
2:24 PM<br />
3:12 PM<br />
4:00 PM<br />
4:48 PM<br />
5:36 PM<br />
6:24 PM<br />
7:12 PM<br />
8:00 PM<br />
8:48 PM<br />
9:36 PM<br />
10:24 PM<br />
11:12 PM<br />
12:00 AM<br />
Time<br />
Temperature (F)
Johns Hopkins Ross Research Building<br />
100<br />
AHU-2 Heat Wheel Test Data<br />
95<br />
90<br />
Outside Air<br />
91.71° F<br />
85<br />
80<br />
75<br />
70<br />
Heatwheel Supply EAT<br />
97.04° F<br />
Heatwheel Supply LAT<br />
85.83° F<br />
Heatwheel Exhaust EAT<br />
77.31° F<br />
Temperature (F)<br />
Heatwheel Exhaust LAT<br />
93.97° F<br />
Test Date: 6/26/03 15:48:00<br />
65<br />
60<br />
12:00 AM<br />
1:00 AM<br />
2:00 AM<br />
3:00 AM<br />
4:00 AM<br />
5:00 AM<br />
6:00 AM<br />
7:00 AM<br />
8:00 AM<br />
9:00 AM<br />
10:00 AM<br />
11:00 AM<br />
12:00 PM<br />
1:00 PM<br />
2:00 PM<br />
3:00 PM<br />
4:00 PM<br />
5:00 PM<br />
6:00 PM<br />
7:00 PM<br />
8:00 PM<br />
9:00 PM<br />
10:00 PM<br />
11:00 PM<br />
12:00 AM<br />
Time
Johns Hopkins Ross Research Building<br />
100<br />
AHU-2 Heat Wheel Test Data<br />
95<br />
90<br />
Energy Recovered<br />
85<br />
80<br />
Temperature (F)<br />
75<br />
70<br />
65<br />
60<br />
12:00 AM<br />
12:48 AM<br />
1:36 AM<br />
2:24 AM<br />
3:12 AM<br />
4:00 AM<br />
4:48 AM<br />
5:36 AM<br />
6:24 AM<br />
7:12 AM<br />
8:00 AM<br />
8:48 AM<br />
9:36 AM<br />
10:24 AM<br />
11:12 AM<br />
12:00 PM<br />
12:48 PM<br />
1:36 PM<br />
2:24 PM<br />
3:12 PM<br />
4:00 PM<br />
4:48 PM<br />
5:36 PM<br />
6:24 PM<br />
7:12 PM<br />
8:00 PM<br />
8:48 PM<br />
9:36 PM<br />
10:24 PM<br />
11:12 PM<br />
12:00 AM<br />
Time
Johns Hopkins Ross Research Building<br />
Benchmark Capacity:<br />
• 7 th Floor North – 10,545 gsf<br />
Lighting and Equipment:<br />
Maximum – 6.0 w/gsf<br />
Average – 3.3 w/gsf<br />
Minimum – 1.8 w/gsf<br />
240<br />
220<br />
200<br />
180<br />
7th Floor North Electrical Load: Total Lab Equipment & Lighting Use<br />
Equipment:<br />
Maximum – 5.0 w/gsf<br />
Average – 2.3 w/gsf<br />
Minimum – 0.6 w/gsf<br />
Current (Amps)<br />
160<br />
140<br />
120<br />
100<br />
A Phase<br />
B Phase<br />
C Phase<br />
80<br />
60<br />
40<br />
20<br />
0<br />
5:00<br />
AM<br />
6:00<br />
AM<br />
7:00<br />
AM<br />
8:00<br />
AM<br />
9:00<br />
AM<br />
10:00<br />
AM<br />
11:00<br />
AM<br />
12:00<br />
PM<br />
1:00<br />
PM<br />
2:00<br />
PM<br />
3:00<br />
PM<br />
4:00<br />
PM<br />
5:00<br />
PM<br />
6:00<br />
PM<br />
7:00<br />
PM<br />
8:00<br />
PM<br />
9:00<br />
PM<br />
Time<br />
7/21/03
Johns Hopkins Ross Research Building<br />
Benchmark Capacity:<br />
• 7 th Floor North – 10,545 gsf<br />
Lighting and Equipment:<br />
Maximum – 6.0 w/gsf<br />
Average – 3.3 w/gsf<br />
Minimum – 1.8 w/gsf<br />
Equipment:<br />
• 11 th Floor South – 11,225 gsf<br />
Lighting and Equipment:<br />
Maximum – 6.2 w/gsf<br />
Average – 4.3 w/gsf<br />
Minimum – 2.9 w/gsf<br />
Equipment:<br />
Maximum – 5.0 w/gsf<br />
Average – 2.3 w/gsf<br />
Minimum – 0.6 w/gsf<br />
Maximum – 5.3 w/gsf<br />
Average – 3.4 w/gsf<br />
Minimum – 1.9 w/gsf<br />
Current (Amps)<br />
240<br />
220<br />
200<br />
180<br />
160<br />
140<br />
120<br />
100<br />
80<br />
60<br />
40<br />
20<br />
0<br />
11th Floor South Electrical Load: Total Lab Equipment & Lighting Use<br />
5:00 AM<br />
6:00 AM<br />
7:00 AM<br />
8:00 AM<br />
9:00 AM<br />
10:00 AM<br />
11:00 AM<br />
12:00 PM<br />
1:00 PM<br />
2:00 PM<br />
3:00 PM<br />
4:00 PM<br />
5:00 PM<br />
6:00 PM<br />
7:00 PM<br />
8:00 PM<br />
9:00 PM<br />
Time<br />
7/21/03<br />
A Phase<br />
B Phase<br />
C Phase
Ross Chiller/Boiler Reduction<br />
3500<br />
Chiller Tons/Boiler Horsepower<br />
3000<br />
2500<br />
2000<br />
1500<br />
1000<br />
500<br />
0<br />
Chiller<br />
Capacity<br />
Without<br />
Wheels<br />
Boiler<br />
Capacity<br />
Without<br />
Wheels<br />
Chiller<br />
Capacity<br />
With<br />
Wheels<br />
Boiler<br />
Capacity<br />
With<br />
Wheels
Ross Energy Cost: Modeling vs. Actual<br />
$1,400,000<br />
Total Annual Energy Cost<br />
$1,200,000<br />
$1,000,000<br />
$800,000<br />
$600,000<br />
$400,000<br />
$200,000<br />
With Wheels (Actual)<br />
With Wheels (Estmate)<br />
Without Wheels (Estimate)<br />
$0<br />
With Wheels<br />
(Actual)<br />
With Wheels<br />
(Estmate)<br />
Without<br />
Wheels<br />
(Estimate)<br />
Analysis based on actual energy cost and wheel per<strong>for</strong>mance
Recovery Wheel Economic Summary<br />
Energy Savings<br />
Annual Chilled water savings $226,392<br />
Annual Steam savings $459,440<br />
Total Annual Energy savings $685,832<br />
Chiller/Boiler Plant Savings<br />
Chiller Capacity required without <strong>wheels</strong> 3361<br />
Chiller Capacity required with <strong>wheels</strong> 1780<br />
Tons <strong>of</strong> Chiller Capacity <strong>of</strong>fset (Tons) 1581<br />
Boiler Capacity required without <strong>wheels</strong> 761<br />
Boiler Capacity required with <strong>wheels</strong> 82<br />
Boiler Capacity <strong>of</strong>fset (BHP) 679
Background <strong>for</strong> Economic Analysis<br />
Actual Energy Consumed<br />
Actual Ross Building Energy Consumption (2002)<br />
Chilled water $726,767<br />
Steam $624,741<br />
Baseline (non-AHU) steam consumption $556,019<br />
Net AHU steam consumption $68,722<br />
Vivarium Energy Consumption (2002)<br />
(37,000 cfm)<br />
Main ERU east and West Energy Consumption (2002)<br />
(440,000 cfm)<br />
Chilled water $73,038<br />
Steam $40,820<br />
Chilled water $653,729<br />
Steam $27,902<br />
Total Energy Consumed $681,631
Background <strong>for</strong> Economic Analysis<br />
Modeled Energy Consumed (With Wheels)<br />
Main ERU east and West Energy Consumption (2002)<br />
(440,000 cfm)<br />
Chilled water $628,344<br />
Steam $25,976<br />
Total Energy Consumed $654,320<br />
Modeled Energy Consumed (Without Wheels)<br />
Main ERU east and West Energy Consumption (2002)<br />
(440,000 cfm)<br />
Chilled water $854,736<br />
Steam $485,416<br />
Total Energy Consumed $1,340,152
Actual Per<strong>for</strong>mance After 13 Years<br />
.85"<br />
Pressure Loss<br />
76 o F<br />
63 gr.<br />
Measured Literature<br />
System Total Effectiveness 78% 80%<br />
Supply Total Efficiency 61% 66%<br />
92 o F<br />
116 gr.<br />
380,000 cfm<br />
455,000 cfm<br />
97 o F<br />
130 gr.<br />
84.5 o F<br />
89 gr.<br />
53 o F<br />
58 gr.<br />
53 o F<br />
58 gr.<br />
1.1"<br />
Pressure Loss<br />
Note actual trended data and field measurements: July 6 th 2003 reflecting current airflow capacities<br />
Note airflows shown reflect actual field measurements collected May 13 th 2003
Cross-contamination Test Results<br />
Johns Hopkins Ross Research Facility:<br />
Results <strong>of</strong> Air Sampling Around the SEMCO Total Energy Wheels<br />
Total Contaminant (TVOC)<br />
Concentration (ug/M3)<br />
250<br />
200<br />
150<br />
100<br />
50<br />
0<br />
Outdoor Air<br />
East & West<br />
Supply Air<br />
East<br />
Supply Air<br />
West<br />
Exhaust Air<br />
East<br />
Exhaust Air<br />
West<br />
Sampling Location<br />
Actual field samples collected May 13 th 2003 and analyzed via mass spectrometer by GTRI
Johns Hopkins Ross Research Building:<br />
Recovery Wheel <strong>Risk</strong> Assessment
Potential Sources <strong>for</strong> Carry-over <strong>of</strong><br />
Airborne Contaminants<br />
1) Energy wheel desiccant carry-over<br />
2) Purge inefficiency<br />
3) Seal leakage from dirty to clean<br />
airstream<br />
4) Short circuiting between <strong>exhaust</strong> air<br />
outlet to fresh air inlet (system not<br />
wheel related)
SEMCO Fluted Media: Face Coating
3Å Angstrom Molecular Sieve<br />
Desiccant Coating (SEM 10,000 X)
GTRI Pollutant Carry-over Research<br />
Desiccant materials other than a 3Å molecular<br />
sieve have been shown to transfer up to 50% <strong>of</strong><br />
the airborne pollutants back to the space<br />
The 3Å molecular sieve coating was found to<br />
limit contaminant carry-over in the lab as well<br />
as in numerous field studies
Importance <strong>of</strong> the 3Å Molecular Sieve<br />
Silica Gel (No humidity transfer)<br />
60<br />
45<br />
Silica Gel (With humidity transfer)<br />
4A Molecular Sieve (No humidity transfer)<br />
4A Molecular Sieve (With humidty transfer)<br />
3A Molecular Sieve (With humidity transfer)<br />
40.1<br />
46.6<br />
47.5<br />
54<br />
49.4<br />
43.2<br />
% Transference<br />
30<br />
32.1<br />
33.9<br />
28<br />
32.1<br />
30.6 32<br />
30.9<br />
29<br />
15<br />
0<br />
4<br />
3<br />
2.4<br />
1.4<br />
0.5 0<br />
0.4 0.9<br />
0 0 0 0 0<br />
0<br />
0<br />
SF6<br />
Propane<br />
CO2<br />
p-Xylene<br />
MIBK<br />
IPA<br />
Compound Investigated<br />
Source: Independent Georgia Tech Research Institute Investigation 1993, 1999<br />
Acetaldehyde<br />
Methanol/IPA<br />
0
Function <strong>of</strong> the Purge Section<br />
Purge dirty air trapped in wheel media as it<br />
rotates from the dirty to the clean airstream<br />
Purge angle adjustable and driven by the<br />
pressure differential existing between the<br />
outdoor air and return air streams<br />
Proper setting shown to limit carry-over to<br />
well below .045% in actual field<br />
commissioning tests
Bacteria and Virus Carry-over<br />
• Organisms are not transferred by 3A molecular<br />
sieve, they are too large <strong>for</strong> the 3 angstrom pore<br />
(smallest virus is .3 microns or 3,000 angstroms)<br />
• Particles have been shown to behave like gases<br />
and are limited to less than .045% <strong>of</strong> the <strong>exhaust</strong><br />
air concentration based on lab and field testing<br />
• Particulate can be easily filtered out, further<br />
reducing carry-over with 95.9995% efficiency<br />
(National Cancer Institute Investigation)
<strong>Risk</strong> Assessment Questions<br />
• Should all lab hood <strong>exhaust</strong> be handled through the<br />
<strong>wheels</strong> Some hood <strong>exhaust</strong><br />
• Can the hoods be safely <strong>exhaust</strong>ed to the outdoors<br />
• If biological, HEPA filtration <strong>of</strong> supply and return<br />
air can drop carry-over limit from
Assessment Procedure<br />
• Assume worst <strong>case</strong> spill scenario <strong>for</strong> facility<br />
• Evaluate chemicals used against resultant TLV<br />
levels using the .045% carry-over specification<br />
• Evaluate <strong>for</strong> health risk and nuisance odors using<br />
% TLV and odor threshold values<br />
• Determine which chemicals should be designated<br />
to separate hoods<br />
• Choose appropriate system design, <strong>for</strong> example all<br />
<strong>exhaust</strong> through the <strong>wheels</strong> or just general <strong>exhaust</strong>
SEMCO <strong>Risk</strong> Assessment Database:<br />
AEI "Worst Case" Spill Scenario 3<br />
Chemical Compound Total Quantity 1 TLV NIOSH 2 Supply Air Concentration % <strong>of</strong> TLV Comments<br />
ACETIC ACID BAR PVC CS6 500ML Total 171 liters 10 PPM 0.05 PPM 0.50% Odor detection level 2 PPM<br />
ACETIC ACID,REAG PVC CS-6X2.5L Total 8 liters 10 PPM 0.05 PPM 0.50% "<br />
ACETONE ACS REAGENT 20L Total 580 liters 750 PPM 0.05 PPM 0.01% Odor detection level 2 PPM<br />
ACETONE GR ACS 1L Total 508 liters 750 PPM 0.05 PPM 0.01% "<br />
ACETONE, 10L CS/2X10L Total 1100 liters 750 PPM 0.05 PPM 0.01% "<br />
ACETONE,ACS,REAG CS-4X4L Total 32 liters 750 PPM 0.05 PPM 0.01% "<br />
ACETONE-D6 (D,99.9%) 10G Total 1920 grams 750 PPM 0.05 PPM 0.01% "<br />
ACETONITRILE ACS REAGENT 500ML Total 109 liters 40 PPM 0.05 PPM 0.12% Odor detection level 170 PPM<br />
ACETONITRILE D3, 10GM Total 920 grams 40 PPM 0.05 PPM 0.12% "<br />
ACETONITRILE REAGENT 500ML Total 16 liters 40 PPM 0.05 PPM 0.12% "<br />
ACETONITRILE UV 4L Total 3980 liters 40 PPM 0.05 PPM 0.12% "<br />
ACETONITRILE UV, CS/2X10L Total 3600 liters 40 PPM 0.05 PPM 0.12% "<br />
ACRYLAMIDE BIS 29:1, 40% 500ML Total 4 liters 0.2 PPM 0.05 PPM 25% No odor problem<br />
AMMON HYDROX ACS PVC CS6 500ML Total 243 liters 25 PPM 0.05 PPM 0.20% Odor detection level .04 PPM<br />
BORIC ACID, UPR BIO-REA 500G Total 1 grams N/A* 0.00 PPM 0.00%<br />
CHLOROFORM,ACS,REAG CS-4X4L Total 9 liters 10 PPM 0.05 PPM 0.50% Odor detection level 190 PPM<br />
CHLOROFORM,ACS,REGT 500ML Total 12 liters 10 PPM 0.05 PPM 0.50% "<br />
CHLOROFORM,REAG SS 500ML Total 16 liters 10 PPM 0.05 PPM 0.50% "<br />
CHLOROFORM-D (D,99.8%) 50GM Total 16750 grams 10 PPM 0.05 PPM 0.50% "<br />
DEUTERIUMOXIDE-D2(D,99.9%)100G Total 9200 grams N/A* No odor or health problem<br />
DICHLOROMETH W/CYCLOHEX 4L Total 2724 liters 50 PPM 0.05 PPM 0.10% Odor detection level 100 PPM<br />
DICHLOROMETHANE ACS REAGE 1L Total 511 liters 50 PPM 0.05 PPM 0.10% "<br />
DICHLOROMETHANE HR-GC 4L Total 16 liters 50 PPM 0.05 PPM 0.10% "<br />
DIMETHYL SULFOXIDE AR 500ML Total 68 liters High 0.05 PPM
Laboratory Systems Should be<br />
Commissioned with Tracer Gas<br />
Tracer Gas Test Data<br />
Project Tested by GTRI Exhaust Air Recirculation Carry-over<br />
to Outdoor Air Intake Total Energy Wheel<br />
University Research Laboratory 0.14%
Separating Hood Exhaust from<br />
General Exhaust<br />
• Some <strong>laboratory</strong> projects may involve research that<br />
will not tolerate even
Labs <strong>for</strong> the 21 st Century<br />
Applying 3Å Molecular Sieve<br />
Total Energy Recovery Wheels<br />
to Laboratory Environments