ISEC-250 Instruction and Operating Manual - Wass.net
ISEC-250 Instruction and Operating Manual - Wass.net
ISEC-250 Instruction and Operating Manual - Wass.net

Create successful ePaper yourself
Turn your PDF publications into a flip-book with our unique Google optimized e-Paper software.
@<br />
. <strong>Instruction</strong><br />
<strong>and</strong> <strong>Operating</strong><br />
<strong>Manual</strong><br />
fo,' riO",'<br />
•<br />
"sec <strong>250</strong><br />
Model C <strong>and</strong> D<br />
Read carefully before buying or selling securities .<br />
•<br />
~~<br />
Isec Route #206 Center, Princeton, New Jersey 08540 / (609) 924·3366
(<br />
Model C <strong>and</strong> D<br />
5 6 7 8<br />
o<br />
rn--I--I---""\ 2<br />
o<br />
o l--·41----{.16<br />
4<br />
11<br />
12<br />
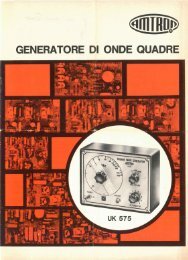
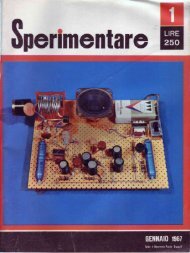
I. FOLDING LEG 6. DOW·JONES DIAL 12. INPUT C DIAL<br />
2. ON·OFF SWITCH 7. STOCK PRICE DIAL 13. PRESS TO READ<br />
3. METER 8. STOCK PR ICE SWITCH 14. PRESS TO RESET<br />
4. ZERO ADJUST 9. C RANGE SWITCH 15. MARKET INDICATORS<br />
5. MARKET TREND SWITCH 10. INPUT A DIAL 16. INDEX MARKS<br />
II. INPUT B DIAL<br />
IS@C Route #206 Center, Princeton, New Jersey 08540 / (60S) 924·3366
TABLE OF CONTENTS<br />
INTRODUCTION ................................................. 2<br />
USING THE COMPUTER ............................................ 3<br />
DESCRIPTION OF UNIT<br />
SET-UP INSTRUCTIONS<br />
FORMAT EXPLANATION<br />
US ING THE COMPUTER<br />
PRACTICE PROGRAMS<br />
SYSTEM PHIIDSOPHY ......................•..................... 12<br />
PRELIMINARY STOCK SCREENING ................................... 15<br />
DEFINITIONS ............•...................................... 16<br />
OPERATING RULES .•......•..................••................. 17<br />
A. Four <strong>Operating</strong> Strategies<br />
B. Market Trend<br />
1. ISETEK Forecast Chart<br />
2. Ten-Day Rule<br />
C. SPIN<br />
D. Input B-1 or Price Momentum<br />
SPECIAL TECHNIQUES .•................•••.•..........•.......... 26<br />
BUY AND SELL OBJECTIVES<br />
FAIR VALUE PRICES<br />
EARNINGS ESTIMATES<br />
PRICE PREDICTIONS -- VOLATILITY INDEX<br />
PROGRAM .....•................................•.............. 31<br />
PRACTICAL APPLICATIONS ...••...............•.................. 34<br />
MODEL PORTFOLIO OPERATION .................••..•.............. 38<br />
IN EVENT OF DIFFICULTY •...•....•.••........... , .............. 39<br />
WARRANTY .•..•.•...........•....•.....•....•................. 42<br />
•<br />
,sec<br />
1
INTRODUCTION<br />
(<br />
Analog Computers<br />
The <strong>ISEC</strong> <strong>250</strong> is a solid state electronic analog computer. In<br />
general, an analog computer is designed to study mathematical models<br />
of problems with changing variables. One such problem is stock investment<br />
analysis. The <strong>ISEC</strong> <strong>250</strong> is designed to correlate current<br />
investment information resulting in meaningful stock evaluation.<br />
To underst<strong>and</strong> how the computer does this, a brief description of<br />
the computer's operation is given below.<br />
The <strong>ISEC</strong> <strong>250</strong>, like other analog computers, is designed with<br />
the following operations in mind.<br />
1. An analog computer will accurately obey the mathematical<br />
instruct ions it is given.<br />
2. Input quantities must be readily available for programming<br />
ease.<br />
3. The results should be in meaningful form.<br />
4. The system parameters can be adjusted to judge the effect<br />
of changing variables.<br />
(<br />
5. The computation is carried out on all parts of the equation<br />
simultaneously as opposed to the digital process of successive<br />
steps.<br />
6. The computation requires only a few milliseconds to complete .<br />
...<br />
IS@C<br />
2
USING THE COMPUTER<br />
Description of Unit<br />
The <strong>ISEC</strong> <strong>250</strong> is a scientifically engineered <strong>and</strong> precision<br />
manufactured instrument. A few minutes taken to familiarize<br />
yourself with the function of each control before attempting<br />
to operate the unit will prove most beneficial. Referring<br />
to the diagram on inside front cover each control or item<br />
is identified by a reference designation number.<br />
1. Folding Leg: The instrument is equipped with a folding leg<br />
bar which enables the unit to be tilted for a more desirable<br />
viewing <strong>and</strong> operating position.<br />
2. ON-OFF Switch: The slide type switch is located on the right<br />
side of the panel <strong>and</strong> is labeled "POWER".<br />
3. Meter: The result of each computation is read out on the<br />
meter which is calibrated between -30 <strong>and</strong> +30. The number<br />
which the readout meter indicates is called the Stock<br />
potential Index Number (SPIN).<br />
4. Zero Adjust: The zero adjust knob is recessed directly<br />
behind the folding leg on the underside of the cabi<strong>net</strong>.<br />
Occasionally, it may be necessary to re-zero the meter.<br />
This adjustment is made by rotating the knob.<br />
5. Market Trend Switch: A two-position lever switch labeled<br />
UP <strong>and</strong> DOWN.<br />
6. Dow Jones Dial: This control, which is calibrated 0 to 2000<br />
programs the computer with the current industrial average.<br />
7. Stock Price Dial: This control, calibl'ated 0 to 100, programs<br />
the computer with the current price of the stock. This control<br />
is used in conjunction with the Stock Price Switch.<br />
8. Stock Price Switch: A two-position lever switch labeled<br />
100 <strong>and</strong> 1000 used in conjunction with the Stock Price Dial.<br />
9. C Range Switch: This two-position lever switch is operated<br />
in conjunction with the "e" Input dial in precisely the<br />
same manner that the stock price dial <strong>and</strong> sWitch are operated.<br />
•<br />
3
4<br />
foe,"<br />
10. Input Dial A<br />
11. Input Dial B<br />
12. Input Dial C<br />
00"'.', , .. ".m co"<br />
compute, with the A, B, <strong>and</strong><br />
C inputs obtained from the<br />
Weekly Index Sheets.<br />
13. Press to Read: This control activates the computer.<br />
14. Press to Reset: This illuminated button lights when<br />
(1) the unit has been improperly programmed; (2)<br />
sudden line voltage changes occur; or (3) unusually<br />
high or low SPIN's endanger computer circuitry.<br />
15. Market Indicators: These lights indicate market<br />
action.<br />
16. Index Marks: These are the dial set points.<br />
Set Up <strong>Instruction</strong>s<br />
Please unpack your computer carefully. Accidental<br />
abuse can shorten its useful life <strong>and</strong>, more importantly, can<br />
cause incorrect readings which could result in costly buying or<br />
selling errors.<br />
Before each use you will go through a series of 8<br />
steps to obtain your first reading. Each stock evaluated after<br />
the first one will require only 6 steps <strong>and</strong> should take less<br />
than a minute.<br />
1. Plug the unit into a 120 volt A.C. 60 cycle outlet.<br />
2. The front leg may be folded down to tilt the unit<br />
to the best angle for easy viewing (#1 in illustration).<br />
3. Turn the Power Switch on (#2 in illustration).<br />
4. Make sure the Meter light <strong>and</strong> Press to Read lights<br />
are on (#3 in illustration). Should the Press to<br />
Reset light be lit push it in until the light goes<br />
out <strong>and</strong> the Press to Read light comes back on.<br />
(See "In Event of Difficulty", page 38.)<br />
5. Meter should read O. If not; look under computer.<br />
There is a hole in the case with a knob visible.<br />
Turn the knob until the meter reads O. Very little<br />
adjustment should be necessary (#4 in illustration).<br />
6. To check the computer circuits, set up the following<br />
tests.<br />
...
5<br />
Test #1 Test #2 Test<br />
#3<br />
Market Trend Switch UP DOWN UP<br />
(#5 in illustration)<br />
Dow Jones Dial 900 900 900<br />
(#6 in illustration)<br />
Stock Price Dial 92 92 11<br />
(#7 in illustration)<br />
Stock Price Switch 100 100 1000<br />
(#8 in illustration)<br />
C Range Switch 100 100 100<br />
(#9 in illustration)<br />
A Dial 80 80 80<br />
(#10 in illustration)<br />
B. Dial 128 128 94<br />
(#11 in illustration)<br />
C Dial 50 50 30<br />
(#12 in illustration)<br />
Test #1 - Result: Push Press to Read button (#13 in illustration).<br />
Pointer of meter should move to +10<br />
+3 marks on the meter face, with the Buy<br />
light (#15 in illustration) on.<br />
Test #2 - Result: The meter pOinter should move to white hold<br />
area <strong>and</strong> the Sell light (#15 in illustration)<br />
should be on.<br />
Test #3 - Result: Push Press to Read button. Pointer of meter<br />
should move to -10 +3 marks on the meter face,<br />
with the Buy light on.<br />
Note: In setting any computer dial, make sure the input number<br />
on the dial skirt is set at the Index line (#16 in illustration).<br />
You have now completed the test equations <strong>and</strong> if they<br />
check your computer is operating properly. If you are<br />
having difficulty see "In Event of Difficulty", P. 38.<br />
IS@C
6<br />
Format Explanation<br />
(<br />
The format of the Weekly Input Data Sheet calls for some explanation.<br />
Typical entry appears as follows:<br />
-<br />
-<br />
-<br />
><br />
-<br />
---<br />
><br />
-<br />
-<br />
(Columns)<br />
I 2 3 4 5 6 7 8 9 10 11<br />
INPUT A = 93<br />
FUNDAMENTAL TECHNICAL LATEST<br />
INPUTS INPUTS 12 MO<br />
DESCRIPTION LP B C BI VLTY EARN IN G<br />
BAXTER LABORATORIES 45 135 I 12 +03+ 03 + .79<br />
BAYUK CIGARS INC I 6 134 346 +03+ 07 + .68<br />
BEARINGS INC 4 I' 195 243 +03+ I 6 + 3.20<br />
BEATRICE FOODS CO 80 129 73 +02+ 06 + 3.68<br />
BECKMAN INSTRUMENTS 49 I 1 7 108 +03+ 04 + 1.23<br />
BECTON DICKINSN & CO 68 135 87 +06+ 06 + 1.26<br />
BEECH AIRCRAFT CORP 44 132 126 -01+ 05 + 1 .81<br />
BELCO PETROLEUM CORP 50 134 90 -04+ 06 + 1.54<br />
BELDING HEMINGWAY CO 41 147 127 +06+ 08 + 2.04 E<br />
BELL & HO\OiELL CO 72 133 73 +03+ as + 2.25 E<br />
BELL INTERCONT INENTL 14 137 26, a -, or blank. The signs indicate<br />
the approximate area of the computer scale that this company<br />
should read. A> sign indicates a possible buying situation or in<br />
any case a situation close to the low risl;;: area. A "_" indicates<br />
a possible sell situation or in any case a situation close to the<br />
high risk area. No sign present indicates a probable hold situation.<br />
Each symbol is correct as of the printing date of the<br />
Index only.<br />
...<br />
Isec
Column #2. This is the company nrune. All common stocks selling<br />
on the NYSE <strong>and</strong> AMEX for more than $4.00 with regularly reported<br />
earnings are listed.<br />
Column #3. This column, labeled "LP", indicates the last price<br />
of the stocl" as of the Data Processing Date, rounded off to the<br />
nearest dollar. It is correct as of the date when we begin Data<br />
Processing.<br />
Columns 4 <strong>and</strong> 5 are fundamentally derived figures.<br />
Column #4. This colUmn is labeled "Input B" <strong>and</strong> is the number<br />
entered on the B Dial when checking any given stock. It is<br />
calculated from fUndamental information <strong>and</strong> should be used for<br />
earnings estimates, etc., as described in this manual.<br />
Column #5.<br />
This column is "Input C" <strong>and</strong> is used to set the C Dial.<br />
I/N /1& !btl/PI'< +0'//t>w/-v1 '~ '';/)1'''/'$0'//;:;& er:/(1:''''''-;!,y flil
Using the Computer<br />
1. Set Dial itA" with the number following "Input A" at the<br />
top of your latest Input Data Sheet.<br />
2. Set the Dow Jones Dial to the value of the current Dow Jones<br />
Industrial Average which you will find listed in the Wall<br />
Street Journal, New York Times, or other daily paper.<br />
3. Determine the market trend <strong>and</strong> set the market trend switch.<br />
For practice set the switch in the "up" position unless<br />
otherwise specified. (See ISETEK Market Forecast Chart Section).<br />
You have now completed the general steps. These first three steps<br />
need not be repeated when evaluating additional stocks.<br />
4. Pick a stock you wish to evaluate J set Dial "B" to the<br />
number shown on the <strong>ISEC</strong> Index for the specific stock.<br />
5. Set the lie Range" switch in the 1000 position if "e" on the<br />
Data Sheet is between 101 <strong>and</strong> 1000. Set the "c Range" switch<br />
in the 100 position if "c" is between 0 <strong>and</strong> 100. Now set Dial<br />
"c" to the number shown on the <strong>ISEC</strong> Index for the stock.<br />
(Picture 1) (Picture 2)<br />
Example 1.<br />
Example 2.<br />
In Picture #1, the "e" setting is equal to 45.<br />
In Picture #2, the "ell setting is equal to 135.<br />
6. Set the Stock Price Switch to 100 if the price of the stock<br />
is between 0 <strong>and</strong> 100 dollars/share. Set the Stock Price<br />
Isec<br />
8
Switch to 1000 if the price of the stock is between 101<br />
<strong>and</strong> 1000 dollars/share.<br />
7. The Stock Price Dial is set to the current price of the<br />
stocle The Stock Price Switch sets the correct decimal<br />
pOint. For example, prices of 80 <strong>and</strong> 800 are both set at<br />
80 on the dial. In order to convert from one to the other,<br />
the stock price switch is moved from the 100 range (a price<br />
of 80), to the 1000 range, giving a price of 800. Other<br />
typical settings are illustrated below.<br />
1000<br />
100 i<br />
Off ;.<br />
Off<br />
-III<br />
(Picture 3)<br />
POWfR<br />
(Picture 4)<br />
POWJR<br />
Stock Price<br />
Stock Price<br />
Dial Setting<br />
Stock Price<br />
Switch Setting<br />
Example 1<br />
Example 2<br />
Example 3<br />
Example 4<br />
Example 5<br />
Example 6<br />
45-1/2<br />
125<br />
50<br />
510<br />
5-1/2<br />
240<br />
between 45-46<br />
(See Picture 3)<br />
between 12-13<br />
(See Picture 4)<br />
50<br />
51<br />
between 5 & 6<br />
24<br />
100<br />
1000<br />
100<br />
1000<br />
100<br />
1000<br />
8.<br />
Push the Press to Read button. Read the degree of risk from<br />
the, meter <strong>and</strong> make a note of the answer.<br />
To check another stock or stocks, repeat the steps starting with<br />
#4. IMPORTANT: The most common mistake is incorrect setting of the Stock<br />
Price Switch (8), or the "e" Range Switch (9).<br />
9. When the switches are set in the wrong position, the meter<br />
pOinter may swing off the scale <strong>and</strong>/or the "Press to Reset"<br />
button light up. The settings should be rechecked <strong>and</strong> the<br />
"Reset" button pushed. If the settings are correct the<br />
computer will repeat its action. This means that the<br />
particular stock is a "needle bender". It is either<br />
such a good buy 01' sell c<strong>and</strong>idate that it is off the<br />
scale. Action to be taken will be discussed later.<br />
Isec<br />
9
Practice Programs<br />
(<br />
The examples below indicate the basic method of programming <strong>and</strong><br />
provide practice in using the computer. Note that the Market<br />
Trend Switch, Dial "A", <strong>and</strong> the dial for the Dow Jones remain<br />
set from reading to reading. This simplifies the programming<br />
of the computer.<br />
Example 1<br />
Step 1<br />
Step 2<br />
Step 3<br />
Step 4<br />
Step 5<br />
Step 6<br />
Step 7<br />
Step 8<br />
Step 9<br />
Step 10 -<br />
Example 2<br />
General Motors is selling at 95; the Market Trend<br />
is up <strong>and</strong> the Dow Jones Industrial Average is 900.<br />
Look up the Input numbers on the Data Input Sheet<br />
(<strong>ISEC</strong> Index). Input "A" is found at the top of<br />
Page 1 <strong>and</strong> is common to all stocks. It does not<br />
need to be reset until you receive the next issue<br />
of the Index. The dial should be checked before<br />
each use to make sure it has not been accidentally<br />
moved, however. Inputs "B" <strong>and</strong> lie" are specific<br />
for General Motors <strong>and</strong> are found in Columns 4 <strong>and</strong><br />
5 of the <strong>ISEC</strong> Index (see "Format Explantion"). In<br />
this case, let us assume the Inputs are "A" = 80,<br />
"B" = 128 <strong>and</strong> "e" = 45.<br />
Set Dial "A" at 80.<br />
Set Dial liB" at 128.<br />
Set Dial "e" at 45.<br />
Set the switch marked "c Range" to the 100 position,<br />
because " e" is between a <strong>and</strong> 100.<br />
Set the Stock Price dial to 95.<br />
Set the Dow Jones dial to 900.<br />
Set the Market Trend Switch in the "up" position.<br />
Set the Stock Price Switch to the 100 range.<br />
Check all the settings <strong>and</strong> then press the "Push to<br />
Read" button. The "Buy" light should go on <strong>and</strong> the<br />
pointer should read about +12-1/2 indicating a low<br />
risk purchase.<br />
Admiral Corp. is selling at 130; the market trend is<br />
up <strong>and</strong> the Dow Jones is 900. This situation is programmed<br />
as follows:<br />
Isec<br />
10
11<br />
Step 1<br />
Step 2<br />
Step 3<br />
Step 4<br />
Step 5<br />
Step 6<br />
Step 7<br />
Step 8<br />
Step 9<br />
Step 10 -<br />
Example 3<br />
Look up the Inputs in the <strong>ISEC</strong> Index. In this case<br />
aSSume they are "A" = 80, "B" ~ 94 <strong>and</strong> !'C" = 25.<br />
Set "A" at 80.<br />
Set "B" at 94.<br />
Set " e" at 25.<br />
Check the Dow Jones dial to make sure it is still<br />
properly set.<br />
Set the Stock Price Dial to 13 (the machine reads<br />
this as 130 when the Stock Price Range Switch is set<br />
in the 1000 position.)<br />
Set the Stock Price Switch to the 1000 position.<br />
Make sure the Market Trend Switch is in the "up"<br />
position.<br />
Set the "c" Range Switch to the 100 position.<br />
Check all settings <strong>and</strong> push the "Press to Read" button<br />
in. The "BUy" lig'ht should go on find the pointer should<br />
move into the red high risk area <strong>and</strong> read about -10.<br />
This indicates a favorable market climate but an unfavorable<br />
stock.<br />
Try Bell Intercontinental using the figures from the<br />
format explanation. Set "A" at 93, "B" at 137, "e"<br />
at 268, the Dow Jones Dial at 967 <strong>and</strong> the stock price<br />
at 14. Check Stock Price <strong>and</strong> lie Range" switches for<br />
correct settings (Stock Price switch should be at 100<br />
position. "C Rangel! switch at 1000 position.)<br />
The answer should be about +12.<br />
Examples 4 <strong>and</strong> 5 Try Baxter Laboratories <strong>and</strong> Bayuk Cigar.<br />
answers are about 0 for Baxter <strong>and</strong> -6 for Bayuk.<br />
The<br />
If<br />
you did not get these answers check your Input "e"<br />
setting. The "c" dial should be set at 112 or slightly<br />
over 11 with "e" Range switch in the 1000 position for<br />
Baxter <strong>and</strong> the "c" dial should be set at 346 or halfway<br />
between 34 <strong>and</strong> 35 with the "e" Range switch in the<br />
1000 position for Bayuk. If you are still having trouble<br />
try the other examples. The correct answers are near<br />
the end of the manual.<br />
Isec
12<br />
PHILOSOPHY OF THE <strong>ISEC</strong> INVESTMENT SYSTEM<br />
The Market<br />
The market (usually represented by the Dow Jones Industrial Average,<br />
St<strong>and</strong>ard & Poor's 500 01' the Exchange Averages) is the context<br />
within which every investor operates.<br />
A market that is moving strongly downward will tend to carry most<br />
stocks along with it. Some will move down faster <strong>and</strong> some more<br />
slowly. Some stocks will even move up, but they are rare. In a<br />
strong downtrend less than 5% of all stocks will manage to post<br />
substantial gains.<br />
Given this context, it is important for every investor to try to<br />
time his moves in <strong>and</strong> out of stocks so that they tend to be "in<br />
tune" with the market movement. Buying a security that is undervalued<br />
when the market is oversold (popular averages are low) can<br />
help add many pOints to an investor's profit because the market<br />
will tend to carry the stock up to a fair .price more quickly <strong>and</strong><br />
very possibly into the area where it is overpriced for its current<br />
earnings.<br />
To illustrate this, let us say the market has moved from 900 to 800<br />
on the Dow Jones Industrial Average. It has now steadied <strong>and</strong> even<br />
gone back up to 810. Business <strong>and</strong> international news is stable <strong>and</strong><br />
you have some cash to invest. This is the perfect time to invest<br />
in a stock that has been carried by the market below its true value.<br />
DO NOT ASK YOUR INVESTOR FRIENDS IF NOW IS THE TIME TO INVEST!<br />
They will all tell you it isn't The reason is simple. The have<br />
just lost a lot of money. If a man had $9000 in the mar]
13<br />
If you can control your emotions, very ordinary stocks will turn<br />
in tidy profits, simply because they follow the market up <strong>and</strong> down.<br />
In the <strong>ISEC</strong> System we will have you buyihg stocks just after the<br />
valleys (lows) <strong>and</strong> selling tham just after the peaks (highs).<br />
o<br />
Selecting Stocks<br />
It is one thing to judge the market <strong>and</strong> quite another to select,<br />
hold <strong>and</strong> sell a few stocks. Let's consider some of the factors<br />
that affect stocks aside from the general market which we have<br />
already discussed.<br />
Basic to the evaluation of every stock is its earnings. The<br />
<strong>ISEC</strong> System carefully computes a firm's earnings <strong>and</strong> the rate<br />
of growth that the company has shown. It is the cornerstone of<br />
the System that an increasing rate of earnings growth will be<br />
reflected in higher stock prices. Conversely, lower earnings<br />
or a lower rate of earnings growth will be reflected by a lower<br />
price/earnings ratio for the stock <strong>and</strong> lower stock prices.<br />
Perhaps the single most important factor in determing the price<br />
of a stock at any given moment is emotion. Most amateurs buy a<br />
stock when they are told "we expect it to dOUble." Another line<br />
you hear is that "a stock is going to 100 in six months." Many<br />
stocks are purchased because "the company has a great new product."<br />
A major manufacturer we know introduces between ten <strong>and</strong> fifteen<br />
"great new products" every year into test markets, Only one or<br />
two eventually sees the light of day as a profit contributor.<br />
The foolishness of buying stocks based on unsupported statements<br />
should be obvious. What is not so obvious is that the people<br />
who buy on this kind of evidence will make a stock rise above<br />
its true value range <strong>and</strong> when these people panic they can depress<br />
the prlc"e of a stock below its true value. You can make money<br />
by recognizing these stock price distortion. The <strong>ISEC</strong> System<br />
will not let you purchase a security unless the corporate earnings<br />
picture is very bright <strong>and</strong> shows c.onsistent growth over,<br />
an extended period. But this is not enough. The System will<br />
also insist that you act on recent ea,rnings reports, not data<br />
that is older <strong>and</strong> which may be already discounted by the market.<br />
Even this 1s not enough. While a firm may have sound fundamentals,<br />
emotional factors (such as pending law suits or government contracts<br />
awards) may depress the stock or raise it. above rational levels<br />
for extended periods. So <strong>ISEC</strong> will not allow purchase or sale<br />
until technical factors also indicate that a move is about to<br />
get underway.
Lastly, we consider volatility. A stock may be undervalued at 50<br />
<strong>and</strong> overpriced at 53. On such a trade most of your profit is eaten<br />
up by commissions. Using the <strong>ISEC</strong> computer you can predict (with<br />
better than 75% accuracy) the price range of any stock for the next<br />
90 days. The idea is to help you pick stocks which will have the<br />
biggest price swings.<br />
(<br />
Remember: Over 50% of all major stock moves begin to occur after<br />
the release of good or bad earnings news about a company. There<br />
are two inferences you can draw from this:<br />
1. <strong>ISEC</strong> does not catch every stock. That is correct. Many<br />
stocks have moved out of the buying range by the time we<br />
have hard news about the firm (as opposed to rumors).<br />
Since we don't invest in more than a few stocks at a time<br />
<strong>and</strong> since we have never had fewer than 17 potentially<br />
undervalued situations on the NYSE (the lowest number<br />
ever in one weel,) that still leaves several situations<br />
a week to look at. Typically, we will have about 200<br />
for you to scan. So just ignore the ones that get away.<br />
There is plenty of money to be made in the stocks that<br />
people are guessing incorrectly abQut.<br />
2. The second inference is that if about 50% of stocks start to<br />
move before earnings announcements because someone foresaw<br />
what was going to happen, then either they guessed incorrectly<br />
about the others or they weren't even looking at them. As<br />
one professional invester once confessed to us, "I sometimes<br />
get behind on my homework."<br />
SUMMARY<br />
The <strong>ISEC</strong> System correlates the market level with fundamental data on<br />
each of over 2100 stocks, then technical factors are used for timing,<br />
along with volatility measures in the final selection of a purchase<br />
or sale.<br />
The System also allows you to compare stocks in different industries<br />
<strong>and</strong> even update or insert earnings estimates.<br />
The <strong>ISEC</strong> System is a little different because it doesn't give you<br />
warm words about the soundness of management (that's reflected in<br />
their earnings) or the prospects for the industry. But if you<br />
can relax, try it with a few stocks <strong>and</strong> see what it can do, we<br />
are confident you will find the <strong>ISEC</strong> System both rewarding <strong>and</strong><br />
fun to use.<br />
...
15<br />
PRELIMINARY STOCK SCREENING<br />
The <strong>ISEC</strong> <strong>250</strong> can be used to evaluate any of the 2100 or more stocks<br />
listed in the <strong>ISEC</strong> Index. However, in the past, the group of stocks<br />
pre-keyed by <strong>ISEC</strong> have done substantially better than the rest of<br />
the market. Do not go through the entire list. Each stock is<br />
already keyed for you with one of three symbols which will accurately<br />
reflect its status -- as of the time of printing the Index. Low<br />
Risk Stocks: II ~ II indicates a potential buy as of printing date<br />
of the Index. Hold Stocks: these stocks have no symbol preceding<br />
the name. High Risk Stocks: II 11 indicates a stocl{ that is a high<br />
risk.<br />
We have also provided an liE" or liD" which follows the earnings<br />
figures, The "E" or "D" indicates that the data is based upon<br />
new information. It is important to note the number of weeks<br />
since the last "E" or "DII so that you will not purchase a security<br />
which is about to reflect new earnings.<br />
To find likely investment c<strong>and</strong>idates, we recommend that the list<br />
be scanned for those stocks which are marked with a ">" <strong>and</strong> a<br />
favorable Input B-1 or an "E". While it is not particularly<br />
important to have an "E" in the week a ·security is purchased,<br />
it is important that the liE" has occurred on that stock within<br />
the past few weeks.<br />
Once you have a list of stocks which are likely c<strong>and</strong>idates, then<br />
determine the strategy best suited to your market philosophy. These<br />
follow "Definitions". Now check each of the screened stocks on<br />
the computer, using the current prices <strong>and</strong> market levels.<br />
After you have a list of securities which appear to be good selections<br />
you should then investigate each of these stocks using the techniques<br />
<strong>and</strong> strategy selected <strong>and</strong> then make sure that the outlook for the<br />
firm(s) you intend to buy into are indeed as bright as the computer<br />
indicates. THEN BUY THE SECURITIES:<br />
Isec
16<br />
DEFINITIONS<br />
MARKET TOP - A market TOP occurs anytime the ISETEK Forecast Chart<br />
reads over 60%. A market sell signal is given if the ISETEK Forecast<br />
Chart goes from above 60% to below 60%.<br />
FLOATING POINT STOP LOSS - A price projected with a stock's own volatility<br />
which gives a logical point to sell. A price range can be<br />
projected with the <strong>ISEC</strong> computer. If a stock can reach the lower<br />
end of its projected price range it is probably weak enough to consider<br />
selling. All prices are projected from the highest price that<br />
stock reaches after purchase. All projections are done with the<br />
current volatility figures.<br />
MARKET BOTTOM - A Market Bottom occurs anytime the ISETEK Forecast<br />
Chart reads under 30%. A market buy signal is given when the ISETEK<br />
Forecast Chart goes from below 30% to above 30%.<br />
SPIN - Stock Potential Index Number. This is the answer that the<br />
computer giyes. It is the number the readout meter indicates <strong>and</strong><br />
shows the relative fundamental position of each stock.<br />
VOLATILITY - <strong>ISEC</strong> calculates a volatility for each stock based on a<br />
three-month price movement. The volatility numbers in the <strong>ISEC</strong> Index<br />
are computer-generated numbers indicating number of meter marks to be<br />
used in price projection.<br />
PRICE OBJECTIVE - This is the price projected by the computer as<br />
being the most probable price to be reached in the succeeding three<br />
months.<br />
INPtrr B-1 - This is a computer~generated number which describes<br />
the length <strong>and</strong> strength of the current price movement of each stock.<br />
-5 RULE - This rule states that a stock should be sold whenever<br />
the Input B-1 reaches -5 while the ISETEK Forecast Chart is at a<br />
Market Top or within two weeks after a Market Sell signal. This<br />
rule was formulated to prevent holding stocks through a severe decline.
OPERATING RULES<br />
The basic <strong>ISEC</strong> System consists of four parts:<br />
A. Four <strong>Operating</strong> Strategies.<br />
B. The ISETEK Forecast Chart to determine the overall<br />
market climate (favorable or unfavorable).<br />
C. The fundamental rating (SPIN) to determine which<br />
stocks to consider.<br />
D. The technical rating (Input B-l) to determine when<br />
to take action.<br />
A. The overall System can be applied to a number of different operating<br />
strategies. The one used will depend on your tax position<br />
<strong>and</strong> emotional makeup.<br />
The various strategies are sUmmarized below:<br />
1. Buy - Hold - Buy">" stocks when the ISETEK Forecast<br />
Chart gives a buy signal. Hold for long periods of<br />
time until company outlook significantly changes.<br />
2. Long-Term Gains - Buy">" stocks when the ISETEK Forecast<br />
Chart gives a buy signal <strong>and</strong> the Input B-1 is higher than<br />
the prior week. Sell when stock becomes a high risk <strong>and</strong><br />
Input B-1 goes from + to -<br />
3. Preferred Long Term Gain - Buy high SPIN (+15 or greater),<br />
High Volatile (15% or better potential) stocks when the<br />
ISETEK Forecast Chart gives a buy signal <strong>and</strong> the Input B-1<br />
is higher than the prior week. Sell when stocl< reaches. a<br />
Floating Point Stop-Loss or a -5 Input 8-1 near a market<br />
top (as defined by the ISETEK Forecast Chart.)<br />
4. Trading - Buy high SPIN (+15 or greater), high volatility<br />
(15% or better potential) stocks when the ISETEK Forecast<br />
Chart gives a buy signal <strong>and</strong> the Input 8-1 is higher than the<br />
prior week. Sell when stock reaches price objective. Sell<br />
balance of stocks on a Floating Point Stop-Loss or a -5<br />
Input 8-1 near a Market Top (as defined by the ISETEK<br />
Forecast Chart).<br />
...<br />
Illec<br />
17
lS<br />
Continuing computer analysis is being done on the use of the <strong>ISEC</strong><br />
System. In one analysis a number of commonly used operating strategies<br />
were tested, with the four listed below showing the best results.<br />
All potentially undervalued stocks on the New York Stock Exchange<br />
were included. There were four ISETEK Forecast Chart buy signals<br />
<strong>and</strong> these were the starting point for the analysis.<br />
1. Buy-Hold - Buy">" stocks when the ISETEK Forecast Chart<br />
gives a buy signal. Hold for long periods.<br />
RESULTS: The average ">" stock bought under this strategy<br />
performed 3.7 times better than the popular averages. In<br />
other words the ">" stocks substantially outperformed the<br />
market for the fifty-four week period of study.<br />
2. Long Term Gains - Buy" >' stocks when the ISETEK Forecast<br />
Chart gives a buy signal <strong>and</strong> the Input B-1 is higher than<br />
the prior week.<br />
Sell when the stock becomes a high risk <strong>and</strong> Input B-1 goes<br />
from plus to minus.<br />
RESULTS: The average stock under this strategy outperformed<br />
the popular averages by a factor of 4.S times. When purchases<br />
were made the week of the ISETEK Chart buy signal only, the<br />
average was 7.1 times better than the popular averages. In<br />
other words money was kept in stocks as long as they were<br />
not overpriced <strong>and</strong> while they were still moving up.<br />
3. Preferred Long Term Gain Strategy - Buy high SPIN (15 or<br />
greater), high volatility (15% of better) potential stocks<br />
when the ISETEK Forecast Chart gives a buy signal <strong>and</strong> the<br />
Input B-1 is higher than the prior week.<br />
Sell when the stock reaches a FLOATING POINT STOP LOSS or<br />
a -5 Input B-1 during a market top (as defined by the ISETEK<br />
Forecast Chart).<br />
RESULTS: The average stock under this strategy outperformed<br />
the popular averages by a factor of S.l times. In other<br />
words, this method kept money in stocks moving up regardless<br />
of overevaluation but caused sales to be made when a good<br />
indication of a technical downtrend occurred.<br />
(<br />
Isec
19<br />
4. Trading - Buy high SPIN (15 or greater), high volatility<br />
(15% or better potential) stocks when the ISETEK Forecast<br />
Chart gives a buy signal <strong>and</strong> the Input B-1 is higher than<br />
a week ago.<br />
Sell when the stock reaches the short term prices objective<br />
set at the time of purchase.<br />
Sell balance of stocks on a FLOATING POINT STOP LOSS or<br />
a -5 Input B-1 at a market top (as defined by the ISETEK<br />
Forecast Chart).<br />
RESULTS: The average stock under this strategy outperformed<br />
the popular averages for short periods of time by 13.0 times.<br />
The average ovjective was reached in about six weeks if it<br />
Was reached at all. In other words, money was made constantly<br />
available for new fast moving situations <strong>and</strong> presumably could<br />
have been used in short sales.<br />
It is possible to use a combination of some features in each of the<br />
strategies. For example, half of a position could be sold when<br />
reaching its objective <strong>and</strong> the balance held under the Preferred<br />
Long Term Gain Strategy. Some other percentage could be used.<br />
Results would depend on the strategy mix.<br />
B .<br />
HOW TO USE THE ISETEK FORECAST CHART<br />
The two charts of the New York <strong>and</strong> American Stock Exchange Averages<br />
also include a graph of an accurate market forecasting technique.<br />
This is called the ISETEK Market Trend Indicator.<br />
ISETEK is a positive nleasure of current market climate <strong>and</strong> is a major<br />
advance toward the objective of making percentages work for the investor.<br />
All figures in the ISETEK System are mathematically derived. Use of<br />
the ISETEK Forecast Chart will help prevent whipsaws. ISETEK will show<br />
if the market climate is favorable for intermediate or longer term<br />
investing. ISETEK Chart #1 contains three graphs:<br />
1. Weekly closing, New York Stock Exchange Average;<br />
2. A dotted line;<br />
3. A solid line.<br />
The dotted line is an Input B-1 number calculated for the New York<br />
Stock Exchange composite average itself. The solid line is the<br />
percentage of NYSE stocks in technical uptrends.<br />
...<br />
Isec
20<br />
ISETEK Chart #2 contains three graphs:<br />
1. Weekly clos ing American Stock Exchange Average;<br />
2. A dotted line;<br />
3. A solid line.<br />
The dotted line is an Input B-1 number calculated for the American<br />
Exchange Price Index itself. The solid line is the percentage of<br />
AMEX stocks in technical uptrends.<br />
ISETEK MARKET FORECAST CHART OPERATING RULES<br />
Buy Signals<br />
1. When the solid line goes from below 30 to above 30 <strong>and</strong><br />
the dotted line is in an uptrend.<br />
2. When the solid line goes from below 60 to above 60 <strong>and</strong><br />
the market average is higher than it was ten days ago.<br />
Sell Signals<br />
1. When the solid line goes from above 60 to below 60 <strong>and</strong><br />
the dotted line is in a downtrend.<br />
2. When the solid line goes from above 30 to below 30 <strong>and</strong><br />
the market average is lower than it was ten days ago.<br />
A rising dotted line indicates a strong or strengthening market.<br />
A falling dotted line indicates a weak or weakening market.<br />
A strong market is not possible unless most stocks are in uptrends.<br />
This is indicated by the solid line. Also, a weal;;: market is not<br />
possible unless most stocks are in downtrends. This is indicated<br />
by the solid line also. Most changes in market trend will be signaled<br />
by these overall market factors.<br />
The ISETEK System developed by <strong>ISEC</strong> is unique in that there is no chart<br />
interpretation necessary to determine if the market is in an UP-TREND.<br />
The mathematical model used to determine stock trends will often call<br />
trend changes at or near the top or bottom of the trend. This allows<br />
us to use the sum of these changes in the ISETEK System.<br />
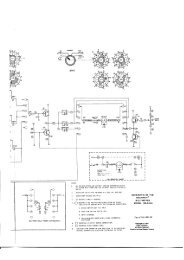
Applying the rules, the accompanying chart shows a sell signal was<br />
given on September 29, 1967, a buy signal on November 24, 1967, a sell<br />
signal on January 26, 1968, a buy signal on April 5, 1968, a sell<br />
signal on June 28, 1968, <strong>and</strong> a buy signal on August 23, 1968. The<br />
ISETEK Market Trend Indicator helps prevent whipsaws <strong>and</strong> allows<br />
you to stay invested with confidence on both the long <strong>and</strong> short<br />
side, whichever is the major trend of the market.<br />
.sec
ISETEK FORECAST CHART<br />
WEEKly HYSI CLOSING AVERAGE<br />
60<br />
59<br />
58<br />
57<br />
56<br />
55<br />
54<br />
53<br />
52<br />
51<br />
50<br />
49<br />
100<br />
60<br />
30<br />
a<br />
A<br />
...:.....-:-<br />
'.<br />
- -<br />
AUG<br />
SELL<br />
/ -,<br />
:-:); ~<br />
SEP<br />
1967<br />
OCT<br />
t\ V'"<br />
UY<br />
V<br />
SEI<br />
r V' /<br />
r Ell " /'v l/ V. f..I<br />
""'\<br />
r<br />
\ /<br />
'--- ABU<br />
~ f ~ A. V<br />
- - ~<br />
'tv<br />
M . . .~ -<br />
C" -<br />
~<br />
- - - ~<br />
~<br />
-<br />
RP d .. ~ '<br />
- - - - - -.<br />
BUY<br />
- - ~ -<br />
- -<br />
NOV OEC JAN FEB MAR APR MAY JUN JUl AUG SEp OCT<br />
1968<br />
US ING THE SYSTEM<br />
When you receive your first ISETEK Forecast Chart the chances are small<br />
that it will be the exact week when a market signal is given. If it<br />
is, go ahead <strong>and</strong> buy or sell just as the Forecast Chart indicates you<br />
should. If, as is more usual, the last market signal was given some<br />
weeks ago you have three options:<br />
1. Go ahead <strong>and</strong> buy or sell securities as though the signal<br />
had just been given;<br />
2. Wait for the next signal.<br />
3. Use the Ten-Day Rule. (Explained below.)<br />
Over the course of the chart period ISETEK averaged nearly ten weeks<br />
between signals, ranging from a high of twelve to a low of eight .<br />
• sec<br />
21
Therefore, if the signal was given five weeks ago or more, it would<br />
probably be best to wait for the next signal. If the signal was<br />
given less then five weeks ago, it is probably safe to act as indicated<br />
by the last signal. It is conceivable that the market could<br />
continue a trend in one direction for considerably longer periods<br />
than twelve weeks. The System does not give any indication of the<br />
length of time a trend will continue <strong>and</strong> so the initial tim;,ng of<br />
getting into or out of the market can be difficult. If you are in<br />
doubt, the best course may be to proceed as indicated by the latest<br />
signal, underst<strong>and</strong>ing that, should another signal be given within<br />
a few weeks, positions taken during the "start Up'l period will be<br />
less profitable than those encompassing a full "buy" to "sell"<br />
cycle.<br />
If the market continued in a bullish trend for a long period of<br />
time no buy signals would be given. The best way to enter the<br />
market at that point would be using the Ten-Day Rule. This rule<br />
states that the market trend is considered "up" if the closing<br />
value of any major stock average (Dow Jones, St<strong>and</strong>ard & Poor,<br />
New York Stock Exchange) is bigher than it was ten bUsiness days<br />
ago. The trend is considered "down" if the average is lower than<br />
it was ten business days ago. To determine whether the average<br />
is up or down, use a newspaper with a chart of one of the averages.<br />
(The Wall Street Journal charts the Dow Jones Industrials, for<br />
instance.) The trend can then be determined by inspection of the<br />
chart. Under this rule the best point to take a position is when<br />
the signal is first given.<br />
960<br />
DOW JONES INDUSTRIAL AVERAGE<br />
OCT. NOV. DEC. JAN.<br />
29 6 13 20 27 3 10 17 24 8 15 22 29 5 12<br />
950<br />
940<br />
930<br />
920<br />
910<br />
900 I<br />
SEll<br />
,<br />
-<br />
,<br />
,<br />
890<br />
;<br />
880<br />
870 Sell<br />
'UY<br />
I<br />
860<br />
. SELL<br />
8'"<br />
840<br />
,<br />
BUY<br />
SELL<br />
830<br />
'UY<br />
Chari IIIntraling tho u .. of tho Ton .. Day Rulo<br />
22
C. SPIN<br />
The number which the readout meter indicates is called the Stock<br />
Potential Index Number (SPIN). This SPIN will vary between -30<br />
<strong>and</strong> +30. The nwnber is a relative indication of stock potential<br />
<strong>and</strong> is a positive method of evaluating stock purchases, When<br />
evaluations are run on the computer, there is little difference<br />
in gain potential where the ratings are +10 <strong>and</strong> +11 for two stocks.<br />
However, there is a considerable difference in stocks evaluated<br />
at +1 <strong>and</strong> +10. In this case, the stock reading +10 (the reading<br />
closer to the green area of the meter) would have the better<br />
potential.<br />
In general the higher the reading in the low risk area the higher<br />
the chances of gain. After purchase, when a stock is re-evaluated<br />
periodically, different readings will be obtained, usually in the<br />
white or hold area. The drop in the SPIN indicates that the market<br />
is tending to agree with your choice <strong>and</strong> is correcting an undervalued<br />
situation. This change may occur slowly or rapidly.<br />
There are two possible reasons why the red area is reached. First,<br />
where there has been a change in the company fundamentals, such as<br />
an earnings decrease or slow-down in growth, the stock should be<br />
sold promptly when the stock turns down. (reflected in B-l) The<br />
second reason is that the price of the stock may have had a rapid<br />
rise <strong>and</strong> outrun its growth rate.<br />
From time to time there will be a few stocks which will give results<br />
off the end of the meter scale. In order to check these "needle<br />
benders" for the best reading the Input A Dial should be turned<br />
until the meter can be read. All the off scale "needle benders"<br />
then should be reprogrammed. This should allow the highest reading<br />
stock to be determined.<br />
Since neither the market nor any stock continues to move in one<br />
direction forever, it should be apparent that the market is more<br />
likely to go down than up next week, if there have been ten consecutive<br />
weeks of gains. The same is true for any given stock,<br />
Therefore, we recommend buying <strong>and</strong> selling as close to market<br />
trend changes (as defined in the System) as possible. The further<br />
you are in time from the point at which the market changed direction,<br />
the more likely the results are to be disappointing.<br />
The <strong>ISEC</strong> System is based on a mathematical model of the market<br />
place <strong>and</strong> cannot take into account some types of distortion. The<br />
most significant distortion occurs when earnings are being compared<br />
.sec<br />
23
against periods encompassing strike losses. This will cause a<br />
higher earnings growth rate to appear than is warranted. Therefore,<br />
as a minimum check before buying a stock we recommend looking<br />
at the current earnings quality. If no major distortions<br />
have occurred in the last fifteen months the <strong>ISEC</strong> ratings will<br />
be correct. This is a ve-ry important cross check:<br />
Several other considerations will aid in improving results. When<br />
the market is at very high levels, as indicated by relatively few<br />
buying opportunities, short sales should be considered or, at the<br />
very least, a prudent approach to investment commitments should<br />
be maintained.<br />
D. INPur B-1 or PRICE MOMENTUM<br />
The number appearing in column labeled "Input B-l lI describes the<br />
strength <strong>and</strong> direction of the current price move of the stock.<br />
A stock in an uptrend will have a positive Input B-1 or at the<br />
very least it will have a positive direction to its Input B-1.<br />
(Such as going from -4 in week 1 to -2 in week 2.) A stock in<br />
a downtrend will have a minus B-1 or at the very least it will<br />
have a minus direction to its Input B-1. A large value will indicate<br />
a very strong trend in progress.<br />
In general, the stronger the trend, the more likely it is that<br />
the stock is closer to the end of that trend. The best time to<br />
buy a stock is near the start of an uptrend. (a minus Input B-1<br />
starting up). If purchases are delayed until a strong uptrend<br />
is evident (a high + value) there is a high probability the purchase<br />
will be made at an intermediate top for that stock. The<br />
idea is to buy low <strong>and</strong> not at the top.<br />
To sum up: The technical buying rules are to buy when a minus<br />
Input B-1 starts up. The latest time to ~'y is when Input B-1<br />
goes from - to +.<br />
The Input B-1 is used in selling in the reverse manner (sell<br />
when Input B-1 is starting down).<br />
A Simple rule is used to help prevent losses. This rule is to<br />
sell a stock anytime Input B-1 moves DOWN to -5 from a higher<br />
level <strong>and</strong> the ISETEK Forecast Chart is over 60% or is less than<br />
two weeks after a sell signal. The reasoning here is that the<br />
stock is showing substantial weakness ahead of the market. Such<br />
securities often have further substantial down moves. If it is<br />
longer than two weeks after the sell signal then the stock is<br />
probably having a normal reaction <strong>and</strong> the -5 rule can be ignored.<br />
This is particularly true if the stock has a low risk SPIN rating .<br />
...<br />
Isec<br />
24
One final word on investment selection: If, after pnrchase of<br />
an issue meeting all the above criteria it does not inunediately<br />
make a sUbstantial rise, do not become impatient. You may have<br />
made a poor selection, but as long as the <strong>ISEC</strong> System gives a<br />
reasonable risk rating for that issue, the market should eventually<br />
recognize its undervalued state. When that happens, the<br />
stock will more than likely have a substantial move.<br />
...<br />
25
SPECIAL TECHNIQUES<br />
(<br />
"Buy" <strong>and</strong> "Sell" Object i ves<br />
It is possible to determine at what price any stock becomes a<br />
buy or sell under current earnings <strong>and</strong> market conditions. This is<br />
done by rotating the Stock Price dial until a reading of +12.5<br />
is obtained <strong>and</strong> observing the price that the dial indicates is<br />
the buy point. The sell area can be determined in the same way<br />
by adjusting the dial to a reading of -12.5. These prices are<br />
long-term objectives based on fundamentals <strong>and</strong> many times will<br />
appear out of line with reality. Furthermore, they tend to change<br />
dramatically as new information becomes available. The changes,<br />
however, reflect constantly shifting market evaluations. (The<br />
prices arrived at are only valid under current market conditions.)<br />
Fair Value Price<br />
To determine the current degree of distort ion from a Fair Value<br />
Price is a simple rna tter. A stock is progranuned into the computer<br />
<strong>and</strong> the stock price dial is turned until the meter reads zero.<br />
The price on the dial is the price that the computer System would<br />
call a fair value. There are times, it should be noted, that this<br />
price will appear considerably out of line with reality. This<br />
can occur when the earnings are in a strong trend. The System<br />
is then saying that an extreme change in earnings trend so distorts<br />
the fair value price as to make it ridiculous. Accurate figures<br />
would have to wait until the earnings trend becomes more stable.<br />
Earnings Estimates<br />
<strong>ISEC</strong> does not use estimates of earnings in its statistical<br />
model; however, it is possible to put in your own estimates to<br />
check the effect on a stock's evaluation. This is done in the<br />
following manner!<br />
1. For each 2% rise in estimated earnings for the next 12<br />
months period, add 1 to the B Input. For example, the<br />
B Input is 130 <strong>and</strong> a 10% rise in earnings is estimated.<br />
Add 5 to 130 <strong>and</strong> use 135 as the new B Input. The change<br />
in evaluation that results shows the stock potential<br />
based on estimated earnings.<br />
2. To estimate next year's stock price based on estimated<br />
earnings, proceed as follows. Before changing the<br />
B Input as in 1 above, note the meter reading. Then<br />
change the B Input to conform to the new estimates.<br />
Isec<br />
26
Now change the Stock Price dial until the meter has<br />
the same reading as the current actual stock rating,<br />
based on your latest <strong>ISEC</strong> Index. The stock price now<br />
indicated on the stock price dial is the price that<br />
the stock can be expected to go to if the earnings<br />
estimates are valid <strong>and</strong> the market evaluates that<br />
stock at the same PIE. Whether the meter is reading<br />
high risk or low risk makes no difference. The computer<br />
is saying that if the market is willing to pay<br />
that risk level 12 months from when the estimate is<br />
entered, the price of the stock will reflect that risk<br />
level. This predicted stock price is the price that<br />
reflects the same PIE as the current level, but based<br />
on the estimated earnings.<br />
3. For estimating the effect of an earnings decline, the<br />
same procedure is used except that the numbers to change<br />
the B Input are subtracted. Example: For each 2% decline<br />
in estimate subtract 1 from the B Input. An example<br />
might be: The B Input is 130 <strong>and</strong> 10% decline is<br />
estimated; subtract 5 from 130 = 125 for the new B Input.<br />
A problem arises when earnings have been non-existent or at<br />
a very low level. An example is where the earnings are going from<br />
a deficit to a positive value, Obviously, projected earnings of<br />
$1.00 when previous earnings have been 0 is an infinitely large<br />
percentage increase. Therefore, a maximum projected percentage<br />
gain of 100% or adding 50 to the B Input is the maximum increase.<br />
The technique will give results within the accuracy of the<br />
estimates. It should be remembered that data published by <strong>ISEC</strong><br />
does not use this estimating technique. Estimation of earnings<br />
involves large risks of error if one does not possess extensive<br />
current information on a corporation. Therefore, we do not recommend<br />
the use of estimates.<br />
Price Prediction -- Volatility Index<br />
One of the most important uses of the <strong>ISEC</strong> computer is fore-<br />
casting price ranges for stocks. This arises in trying to determine<br />
which of several stocks with close to the same SPIN (Stock<br />
Potential Index Number) should be purchased for maximum price<br />
appreciation.<br />
Many stocks may have favorable ratings, but the most volatile<br />
are more likely to produce substantial gains. However, these are<br />
also most volatile on the downSide, <strong>and</strong> investment in volatile<br />
stocks is recommended only when all the circumstances are favorable.<br />
27 '
Non-volatile stocl,s can also produce capital gains if they<br />
are purchased at the right time. Non-volatile stocks havE3 a<br />
higher degree of safety <strong>and</strong> since, in general, there will be<br />
less price movement, a projection of how far such a stock will<br />
go becomes very important in selecting these stocks.<br />
To determine the most probable range for any stock, a volatility<br />
measure is used. The current volatility numbers to be<br />
used are included in each issue of the <strong>ISEC</strong> Index for each stock.<br />
They are used in determining the projected price l'ange for any<br />
stock for the next three-month period in the following manner:<br />
All evaluations for purchase should be made with the Market<br />
Trend Switch in the "up" position. Then let us select a stock<br />
such as Englehard Industries. In the November 10, 1967 issue<br />
of the <strong>ISEC</strong> Index, Input A was 95, Input B was 152, <strong>and</strong> Input C<br />
was 112. There was an asterisk next to Englehard <strong>and</strong>, on checking<br />
back, there was an X beside the stock in a recent issue,<br />
indicating the ratings would be based on recent information.<br />
The stock price was about 41. When these figures are entered<br />
into the computer, the rating comes out a respectable positive<br />
value.<br />
,JIII/<br />
"<br />
!II!! 'II~I<br />
~"HT<br />
,,({lItiS<br />
,-_/ ~<br />
II<br />
Englehard Industries is certainly not a High Flyer, but is<br />
somewhat more speculative than averag8, so the volatility number<br />
5 appears on your <strong>ISEC</strong> Index next to Englehard. This number is<br />
now used to determine the most probable range for the next three<br />
months. First J a note is made of the rating for Englehard, then<br />
the Stock Price dial is turned until the Readout Meter is 5 marks<br />
...<br />
• sec<br />
28
higher. For example, if the Englehard reading was +12, the meter<br />
would then read +17. A note is made of the price on the Stock<br />
Price dial. The Stock Price dial is now turned to read 5 marks<br />
less than the original reading. In this case, +7 would now be<br />
on the meter. A note is made of this price. These two prices<br />
are the most probable limits that Englehard will trade between<br />
in the next three months. In this case, the indicated range<br />
is between 46 <strong>and</strong> 36.<br />
.1111111113<br />
"<br />
"" ~ = ~ ~ ~=<br />
~~----~~~---<br />
VIIHI<br />
"'!tll(l!<br />
•<br />
Next, see if such a trading range offers a reasonable chance<br />
for profit. With a positive reading, the most probable price for<br />
Englehard is 46. Therefore, with a current price of 41 <strong>and</strong> a good<br />
prospect of reaching 46, Englehard offers a reasonable investment<br />
opportunity. Purchase should have been made when the market turned<br />
up on November 22, 1967.<br />
An example of a more speculative situation is E G & G at 70.<br />
In the February 17 issue of the <strong>ISEC</strong> Index, with the DJIA at 850,<br />
Input A is 116, Input B is 113, <strong>and</strong> Input C is 81. The market<br />
trend had just turned down <strong>and</strong> E G & G rated well over in the<br />
high risk side. A short sale might have been considered <strong>and</strong><br />
should have been checked as follows: The volatility number for<br />
E G & G was 10. Since the stock is rated off the scale, the<br />
meter must be adjusted to give an on-scale reading. This is<br />
accomplished by turning the Input A dial until the meter pointer<br />
is near the center of the scale. We are checking the range <strong>and</strong><br />
most probable price of a specific stock, so the market action can<br />
be ignored for this particulal' test. Therefore, it is permissible<br />
to get the meter to read on scale by adjusting Input A. A good<br />
point to adjust to is O.<br />
...<br />
Isec<br />
29
Now, the stock price dial is turned until the meter moves +10<br />
marks <strong>and</strong> -10 marks. This indicates a most probable range for<br />
E G & G of 80-60. The most probable price would be 60 because<br />
of the strong negative evaluation. In fact, this price was reached<br />
before the end of February. With the price objective reached,<br />
a prudent investor would close his short position or protect<br />
his short position profit with a stop-loss.<br />
(<br />
In general, this procedure will give reasonable price ranges<br />
<strong>and</strong> objectives. On test runs these limits were correct about<br />
80% of the time. The most probable price was reached about 70%<br />
of the time. We feel that this will offer individuals the flexibility<br />
of setting realistic price objectives.<br />
..<br />
30
PROGRAM<br />
Your <strong>ISEC</strong> <strong>250</strong> computer is programmed to solve a formula based on a<br />
combination of fundamental <strong>and</strong> technical factors derived by conservative<br />
analytical techniques. The computer combines historical data from<br />
the <strong>ISEC</strong> Index with up to the minute information to give an instant<br />
evaluation of any programmed stock.<br />
The program is based on several premises.<br />
1. There is a good time to buy <strong>and</strong> a good time to sell every<br />
stock. No stock should be locked away forever. On the<br />
other h<strong>and</strong>, no stock should be sold without good reason,<br />
The <strong>ISEC</strong> program was developed to help in timing these moves.<br />
2. The Dow Jones Industrial Average has an enormous influence<br />
on market activity whether it is justified economically or<br />
not. The <strong>ISEC</strong> program takes this fact into account.<br />
3. The New York <strong>and</strong> American Exchange Averages are becoming<br />
increasingly meaningful. The <strong>ISEC</strong> program incorporates<br />
significant information from these averages in its program.<br />
4. Because the current tax structure favors capital gains the<br />
<strong>ISEC</strong> program is clesigned to select stocks which offe;· better<br />
than average opportunities for capital appreciation <strong>and</strong><br />
with a good chance for long term gains.<br />
5. A combination of factors such as market climate, stock<br />
fundamentals <strong>and</strong> technical trends give better results when<br />
combined in a proper relationship.<br />
6. Factors incorporated for picking long term gain possibilities<br />
can assist traders as well in making investment decisions.<br />
The fundamental Inputs supplied with the <strong>ISEC</strong> Index are the<br />
result of hundreds of calculations done on a central computer.<br />
The numbers are obtained by combining a stock's historical<br />
evaluation, its earnings <strong>and</strong> earnings growth rate with the<br />
relationship of the stock to these factors for the market<br />
as a whole. These are then compared to the current market<br />
<strong>and</strong> stock levels.<br />
The central <strong>ISEC</strong> computer calculates a fair value price for<br />
each stocl{. This value determines the Index numbers sent<br />
each week in the <strong>ISEC</strong> Index. The small individual analog<br />
computer determines the current value <strong>and</strong> direction of<br />
price distortion from the fair value price.<br />
•<br />
.sec<br />
31
The <strong>ISEC</strong> Index consists of a nnmber of dial settings for<br />
yonr computer. These settings are called Inputs. These<br />
Inputs are Input "A II, liB" <strong>and</strong> "ell. Inputs A, B<strong>and</strong> C<br />
are based essentially on historical fundamental information.<br />
Inputs d-l <strong>and</strong> volatility are primarily technically derived<br />
numbers.<br />
Input "All is a whole market number derived from a consideration<br />
of the Dow Jones Average. <strong>ISEC</strong> considers each stock as well<br />
as the whole market to move in its own price-earnings channel.<br />
For example, the Dow Jones Average during 1965 went between<br />
15-20 times earnings. In general, if the average CQuid have<br />
been purchased when it was at 15 times <strong>and</strong> sold when it was<br />
at 20 times earnings, substantial profits would have resulted.<br />
Input "A" is also the mathematically derived description of<br />
the channel. These numbers will shift as the channel limits<br />
change, or, since the channel is pa rtly described by earnings J<br />
as the Dow Jones earnings change. A two-year history is used<br />
to initiate a channel <strong>and</strong> the importance of the limits of<br />
the channel are weighted by the growth rate. Furthermore,<br />
historical analysis shows that when the Dow Jones exceeds<br />
20 times earnings it is on vulnerable ground <strong>and</strong> the weighting<br />
is such that when this situatlon occurs, all stocks have<br />
a higher degree of risk.<br />
Inputs "B" <strong>and</strong> "e" are derived in the same manner for individual<br />
stocks. This allows a comparison of ea,ch stock against the<br />
current market level as well as against any other stocks<br />
programmed.<br />
\<br />
A number of other factors are used in setting up our weighting<br />
system. For example, stocks that have high PIE ratios do not<br />
have their earnings weighted as heavily as low PIE stocks<br />
with the same growth rate. Furthermore, the <strong>ISEC</strong> System<br />
has a strong bias against stocks with declining 'earnings.<br />
For this reason some stocks will show a "fair value" price<br />
of $0, also, there will be times when well-known companies<br />
will appear as strong sell Situations, particularly when<br />
their earnings have been distorted by strikes or other<br />
events. However, when this occurs the fact of a strike<br />
is public knowledge <strong>and</strong> evaluations can be used with this<br />
consideration in mind. The System, being a mathematical<br />
model, cannot take emotional factors into account, <strong>and</strong> as<br />
a result, will not show stocks as buying situations while<br />
earnings are in major downtrends.<br />
..<br />
Isec<br />
32
Input B-1 is a mathematical description of the price movement<br />
<strong>and</strong> direction for a stock. A large + figure would<br />
indicate a strong uptrend. A large minus figure would<br />
indicate a strong downtrend. A number near zero would<br />
indicate a possible change in trend. The Input B-1 is<br />
calculated independently of the other imputs but is<br />
used in conjunction to determine when to buy or sell.<br />
The volatility is a function of the three-month price<br />
fluctuations of the stock. It is used to help determine<br />
price objectives <strong>and</strong> selection of one security over<br />
another.<br />
<strong>ISEC</strong> does not use estimates of earnings for stocks, nor<br />
does the computer attempt to predict the action of the<br />
overall market. Too many unexpected changes can occur<br />
making the use of estimates unrealistic. However, if<br />
reliable estimates are available, they may be llsed in<br />
the pret'iously described procedure. The fundamental<br />
inputs supplied by <strong>ISEC</strong> will tend to change slowly,<br />
since corporate fundamentals do not change rapidly.<br />
The public's evaluation of a stock tends to change<br />
rapidly. The technical aspects of the <strong>ISEC</strong> program<br />
lets you take advantage of this fact, buying before<br />
a stock is "discovered" <strong>and</strong> selling before the ultimate<br />
price breakdown of a "hot" stock. <strong>ISEC</strong> believes<br />
that the intelligent investor, using his own computer,<br />
can be more rapidly informed of price distortions in<br />
a given stock <strong>and</strong> so insure satisfactory capital appreciation<br />
on the modern investment battleground.<br />
.sec<br />
33
PRACTICAL APPLICATION AND INTERPRETATION OF THE <strong>ISEC</strong> COMPUTER SYSTEM<br />
Test 1 -<br />
Assume a Buy-Hold strategy, (see page 17), is being<br />
followed. Which of the stocks in the format explanation<br />
on page 6 are purchased<br />
Test 2 -<br />
Assume a Long-Term strategy is being followed.<br />
stocks on page 6 are purchased<br />
Which<br />
Which are sold<br />
Test 3 -<br />
Assume a Preferred Long-Term strategy is being followed,<br />
which stocks are purchased<br />
Test 4 -<br />
In the example of Test 3, assume that a high price of<br />
90 is reached for Bermec. What is the Floating Point<br />
Stop-Loss price if all figures used are the same as<br />
in the format explanation Remember this is the price<br />
projection from the high to the lower end of the range.<br />
Test 5 -<br />
Assume a Trading Strategy. What is the price objective<br />
of the stocks to be purchased<br />
Test 6 -<br />
Assume a Long-Term Preferred strategy.<br />
(A) What do you do if a stock goes to a high risk<br />
after purchase ___________________ _<br />
(B) If the Input B-1 goes + to -<br />
________ _<br />
Isec<br />
34
(C) If both of the above happen <strong>and</strong> the ISETEK Chart<br />
gives a sell signal ______________________________ ___<br />
(D) If stock then has an Input B-1 of -5 ________ __<br />
(E) Use the format explanation figures (page 6) <strong>and</strong><br />
assume the previous high price was 33 for Bethlehem<br />
Steel <strong>and</strong> 37 for Big Three Ind. Gas. Do you sell<br />
either or both _____________________________________<br />
Test 7 -<br />
Assume a Trading Strategy. Have you sold Bermec if<br />
the high price subsequently reached was 90 ________<br />
...<br />
Isec<br />
35
ANSWERS<br />
1. Bell Intercontinental<br />
Bermec Corp.<br />
2. Bell Intercontinental -- purchased under Long Term Gain<br />
Bermec Corp. -- purchased under Long Term Gain<br />
Benguet Consolidated Fgn. -- sold under Long Term Gain<br />
3. Bermec Corp. -- because it has the best potential gain<br />
<strong>and</strong> a SPIN of more than +15.<br />
4. The Floating Point Price is approzimately 79. As one<br />
can see, the stop loss area will quickly become a confirmed<br />
profit if the stock has a substantial upward move.<br />
5. Bell Intercontinental -- 16-1/2 from 14.<br />
Bermec Corp. -- 80 from 68.<br />
6.<br />
(A)<br />
(B)<br />
(C)<br />
(D)<br />
(E)<br />
Nothing unless a Floating Point Price is reached.<br />
NotJ;ling unless a Floating Point Price is reached.<br />
Nothing unless a Floating Point Price is reached.<br />
Sell if within two weeks of ISETEK sell signal.<br />
Do not sell Bethlehem Steel because it did not<br />
reach a Floating Point Price;<br />
Sell Big Three because it has surpassed its Floating<br />
Point Price.<br />
7. Yes, because it surpassed its price objective.<br />
•<br />
36
COMPLETE FORMAT CALCULATIONS<br />
ORIGINAL SUBSEQUENT<br />
SPIN PRICE HIGH<br />
---<br />
BAXTER LABORATORIES - 2 45 45<br />
BAYUK CIGARS - 7 16 21-3/4<br />
BEARINGS, INC. + 5 41 45<br />
BEATRICE FOODS -19 80 84-1/2<br />
BECKMAN INST. -25 49 57<br />
BECTON DICKINSON -12 68 73-1/2<br />
BEECH AIRCRAFT -11 44 46-1/2<br />
BELCO PETROLEUM 0 50 50<br />
BELDING HEMMINGWAY + 6 41 43-1/2<br />
BELL & HOWELL - 9 72 78<br />
BELL INTERCONTINENTAL +11 14 16 "<br />
BEMIS CO. - 6 69 75<br />
BENDIX CORP. -21 50 53-1/2<br />
BENEFICIAL FINANCE -17 55 57<br />
BENGUET CONSOLIDATED -15 13 20<br />
BENGUET CONSOLo FGN. - 8 11 19<br />
BERKEY PHOTO - 2 42 47/7/8<br />
BERMEC CORP. (Needle Bender) + 68 90<br />
BETHLEHEM STEEL - 2 31 33-1/2<br />
BIG THREE IND. GAS - 8 33 36<br />
BLACK & DECKER MFG. - 6 62 66<br />
BLISS LAUGHLIN IND. -13 34 36<br />
As can be seen the <strong>ISEC</strong> System picl
38<br />
MODEL PORTFOLIO OPERATION<br />
Every time a market signal is given or whenever changes occur, <strong>ISEC</strong><br />
will bring you up to date on the <strong>ISEC</strong> Model Portfolio changes. This<br />
portfolio is only an illustration of the <strong>ISEC</strong> System <strong>and</strong> does not<br />
represent any real investment. However, its success <strong>and</strong> operation<br />
are such as can be duplicated by any subscriber who picks the same<br />
securities.<br />
The <strong>ISEC</strong> Model Portfolio is operated under the Preferred Long Term<br />
Gain strategy. Prior to January 1969 the portfolio was being operated<br />
under a loOng-Term Gain strategy in which purchases were made when the<br />
Input B-1 went from - to + when market buy signals occurred. After<br />
computer analysis of the whole <strong>ISEC</strong> System showed that better results<br />
were likely by changing strategies slightly, the Preferred Long Term<br />
Gain strategy was decided upon as one representing an average investor's<br />
practical approach to the market.<br />
(<br />
(<br />
• sec<br />
(
IN EVENT OF DIFFICULTY<br />
Investigation shows that most apparent difficulties<br />
are the result of improper settings on the dials <strong>and</strong> switches<br />
of your computer. Please check this instruction manual carefully<br />
to make sure that you have set the unit properly.<br />
1.<br />
Unit doesn't light.<br />
- Remedy: Check to make sure that computer is plugged<br />
in <strong>and</strong> turned on, Make sure there is power at the<br />
outlet. If unit still fails to light up, notify <strong>ISEC</strong>.<br />
2.<br />
Meter not lighted but Press to Read or Press to Reset<br />
buttons do light.<br />
- Notify <strong>ISEC</strong>.<br />
3.<br />
Meter lighted but neither Press to Read nor Press to<br />
Reset buttons are lighted.<br />
- The light bulb in one or both of the buttons may be<br />
burned out. Check the test equations. If they are<br />
correct, computer is operating properly <strong>and</strong> <strong>ISEC</strong><br />
will supply you with new bulbs.<br />
4.<br />
Meter does not read 0 when the Press to Read button is<br />
lighted.<br />
- Adjust meter with knob underneath case (#4 in illustration).<br />
5.<br />
Meter does not read 0 when Press to Reset button is<br />
lighted.<br />
- This is correct for Model C Units. Meter should<br />
read in minus area. Push Press to Reset button until<br />
the Pl'ess to Read button is lighted. Meter should<br />
now read 0; if not, adjust as in #4 above.<br />
D Model Computers will read near zero when Press<br />
to Reset button is lighted.<br />
6.<br />
Press to Reset button stays on <strong>and</strong> immediately comes<br />
back on after pushing <strong>and</strong> releasing.<br />
- Set up test equation settings. Try Push to Reset.<br />
If the Reset light goes out the previous settings<br />
were considerably off scale. If the Push to Read<br />
button still will not stay on, try a different outlet .<br />
• sec<br />
39
IN EVENT OF DIFFICULTY<br />
(continued)<br />
Voltage fluctuations will sometimes cause this problem.<br />
They do not affect the computer results, but may cause<br />
the Press to Reset button to remain on or come on<br />
frequently. Voltage fluctuations on another line may<br />
be less severe.<br />
If this does not work, set up test equation #1<br />
<strong>and</strong> carefully push both buttons at the same time.<br />
If the meter gives the correct answer, the computer<br />
is operating properly <strong>and</strong> the trouble is in the<br />
particular outlet being used. If not, try another<br />
outlet. If no satisfactory outlet can be found,<br />
notify <strong>ISEC</strong>. If the meter goes rapidly off scale<br />
when both buttons are pushed, release them immediately<br />
<strong>and</strong> notify <strong>ISEC</strong>.<br />
7.<br />
Buy light comes on when stock is in hi~h<br />
risk area.<br />
- This is normal operation. The system is saying<br />
that although the market is in a buying area, this<br />
part icular stock is not.<br />
8.<br />
Sell light comes on when stock is in low risk area.<br />
- This is normal operation. The system is saying that<br />
this ,will be a good stock to look at when the market<br />
becomes favorable.<br />
9.<br />
Buy 01' Sell light on all the time (Model Conly.<br />
These are units with Serial # 's 1-200).<br />
- This is normal for these units.<br />
10.<br />
o on dials does not line up exactly with index marks<br />
when turned to the mechanical stop.<br />
- This is normal. Do not try to adjust these dials<br />
as they are precisely adjusted at the factory <strong>and</strong><br />
are correct for the usable range of the dial.<br />
11.<br />
Never attempt to remove the unit from cabi<strong>net</strong>. In<br />
addition to the danger from high voltage, evidence<br />
of attempted removal of the unit will void our warranty .<br />
...<br />
40
IN EVENT OF DIFFICULTY<br />
(continued)<br />
12. Other problems:<br />
- If any question arises as to the operation, reliability<br />
or use of the <strong>ISEC</strong> System, please notify<br />
<strong>ISEC</strong> by phone; (609) 924-3366. We will put you<br />
in touch with a regional distributor with repa ir<br />
facilities or ship a new computer to you.<br />
PLEASE, if you return the unit to us, indicate the nature of the<br />
trouble on a sheet of paper <strong>and</strong> include it with the unit. This<br />
will speed servicing <strong>and</strong> aid in the prompt return of your computer .<br />
...<br />
41
WARRANTY<br />
Each unit is warranted to be free from defects in parts<br />
<strong>and</strong> workmanship for a period of one year from the date of shipment.<br />
<strong>ISEC</strong> shall be the sale judge of whether or not a defect in operation<br />
is due to faulty parts or assembly, or to abuse or accidental<br />
damage on the part of the user. Units sent for repair will be<br />
reshipped at buyer's expense to the user no later than the second<br />
working day after receipt.<br />
While every effort is made to insure the accuracy of<br />
data, we cannot guarantee the accuracy of results, since information<br />
supplied to us may, in some instances, be incorrect; nor are we<br />
able to insure proper operation of the computer, since computer<br />
readings are the result of settings by individual operators.<br />
..<br />
\<br />
42