Tom Hootman, AIA, LEED AP BD+C RNL, Director of ... - Archive - ULI
Tom Hootman, AIA, LEED AP BD+C RNL, Director of ... - Archive - ULI
Tom Hootman, AIA, LEED AP BD+C RNL, Director of ... - Archive - ULI

Create successful ePaper yourself
Turn your PDF publications into a flip-book with our unique Google optimized e-Paper software.
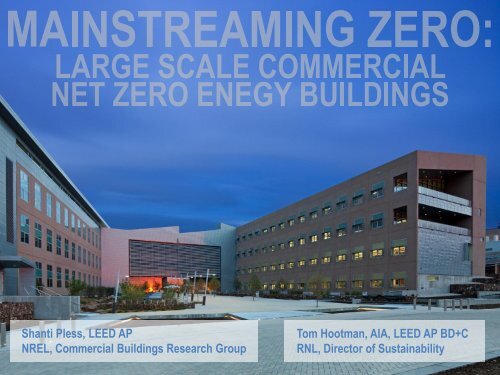
Shanti Pless, <strong>LEED</strong> <strong>AP</strong><br />
NREL, Commercial Buildings Research Group<br />
<strong>Tom</strong> <strong>Hootman</strong>, <strong>AIA</strong>, <strong>LEED</strong> <strong>AP</strong> <strong>BD+C</strong><br />
<strong>RNL</strong>, <strong>Director</strong> <strong>of</strong> Sustainability
WHO IS PURSUING<br />
NET ZERO ENERGY
1<br />
1<br />
1<br />
2<br />
1<br />
6<br />
1<br />
1<br />
1 1<br />
1<br />
1<br />
1<br />
2<br />
New Buildings Institute<br />
Getting to Zero 2012 Status Update: A<br />
First Look at the Costs and Features <strong>of</strong><br />
Zero Energy Commercial Buildings<br />
(March 2012)
1<br />
1<br />
1<br />
2<br />
1<br />
6<br />
1<br />
1<br />
1 1<br />
1<br />
1<br />
1<br />
2<br />
New Buildings Institute<br />
Getting to Zero 2012 Status Update: A<br />
First Look at the Costs and Features <strong>of</strong><br />
Zero Energy Commercial Buildings<br />
(March 2012)
1<br />
1<br />
1<br />
2<br />
1<br />
6<br />
1<br />
1<br />
1 1<br />
1<br />
1<br />
1<br />
2<br />
New Buildings Institute<br />
Getting to Zero 2012 Status Update: A<br />
First Look at the Costs and Features <strong>of</strong><br />
Zero Energy Commercial Buildings<br />
(March 2012)
California PUC 2030<br />
Massachusetts 2030<br />
Federal / EISA 2030<br />
ASHRAE Vision 2020<br />
2030 Challenge<br />
Living Building Challenge
13<br />
1K-5K<br />
11<br />
19 5<br />
5K-10K 10K-25K 25K-50K<br />
New Buildings Institute<br />
Getting to Zero 2012 Status Update: A<br />
First Look at the Costs and Features <strong>of</strong><br />
Zero Energy Commercial Buildings<br />
(March 2012)<br />
8 4<br />
50K-100K >100K
NREL – RESEARCH SUPPORT FACILITY<br />
NREL – RESEARCH SUPPORT FACILITY II<br />
SMUD – CAMPUS OPERATIONS<br />
SING<strong>AP</strong>ORE – CASE STUDY
DOE / NREL: Client<br />
Haselden Construction: General Contractor<br />
<strong>RNL</strong>: Architecture, Interiors, Landscape, Lighting<br />
Stantec: MEP Engineering, Energy Modeling<br />
KL&A: Structural Engineering<br />
Martin/Martin: Civil Engineering<br />
AEC: <strong>LEED</strong>, Daylight Modeling, Commissioning<br />
Namaste Solar: Solar Consultant
Federal Office Building<br />
222,000 SF<br />
822 Occupants<br />
$64M Firm Fixed Price<br />
$57.4M Construction<br />
Complete June 2010
Project objectives<br />
Absolute energy target<br />
Risk / reward / control balance<br />
Substantiation<br />
Incentive award fee
I want a green building<br />
Design a <strong>LEED</strong> building<br />
Design a building to use 30% less<br />
energy than ASHRAE 90.1-2004<br />
Design a building to use less than<br />
25,000 BTU/sqft<br />
Design a net zero energy building
PREDICTIVE MODELING<br />
(Absolute energy target)<br />
VERSUS<br />
COMPLIANCE MODELING<br />
(Percent better than ASHRAE 90.1)
New Buildings Institute<br />
Energy Performance <strong>of</strong> <strong>LEED</strong> for New Construction Buildings<br />
(March 2008)
Heifer International Center<br />
NVCI Cancer Research<br />
Kitsap County Admin Building<br />
The Signature Centre<br />
Great River Energy Headquarters<br />
Ft. Carson Brigade/Battalion HQ<br />
NREL Research Support Facility<br />
International Fund for Animal Welfare<br />
Omega Center<br />
Chevron Office<br />
Bremerton BEQ<br />
University <strong>of</strong> Denver Sturm College<br />
Naval Facilities<br />
Ft. Lewis Barracks and Dinning<br />
Dillard University<br />
EPA Region 8 Headquarters<br />
Fernald Visitors Center<br />
Commerce City Civic Center<br />
Leo Trombatore Office<br />
ASU School <strong>of</strong> Journalism<br />
ASU College <strong>of</strong> Nursing & Health<br />
Federal Reserve Bank <strong>of</strong> Kansas City<br />
Leprino Building<br />
San Joaquin Admin Building<br />
Las Cruces Courthouse<br />
NASA Sustainability Base<br />
Applied Research & Development<br />
Aircraft RSF<br />
National Association <strong>of</strong> Realtors<br />
Oregon Sustainability<br />
Fort Bragg Forces Command HQ<br />
San Joaquin Comm. College<br />
DC Federal Building<br />
Cost per Square Foot<br />
$600<br />
$500<br />
$400<br />
$300<br />
RSF Cost: $259/SF<br />
Average Cost: $334/SF<br />
$200<br />
$100<br />
$-<br />
Other<br />
Certified<br />
Silver<br />
Gold<br />
Platinum<br />
Source: DBIA Project Database
Net Zero Site Energy Building<br />
Net Zero Source Energy Building<br />
Net Zero Energy Emissions Building<br />
Net Zero Energy Cost Building
Demand-Side:<br />
Reduce site energy though low-energy building<br />
technologies<br />
On-Site Supply:<br />
Renewable energy within building footprint<br />
Renewable energy within site<br />
Off-Site Supply:<br />
Renewable energy <strong>of</strong>f site to generate energy on site<br />
Purchase <strong>of</strong>f-site renewable energy sources
Baseline Energy Use<br />
Passive Design<br />
Reduced Energy Use
Efficient Systems<br />
Dramatically Reduced<br />
Energy Use<br />
Renewable Energy
Energy driven form<br />
115,000 SF<br />
Conventional form<br />
65,000 SF
70%<br />
Window to Wall Ratio
Ambient lighting with<br />
daylight sensors for 25 fc<br />
Ambient daylight<br />
6 watt task light<br />
50 fc
Source: NREL, “Reducing Plug and Process Loads for a Large Scale, Low Energy Office Building: NREL’s Research Support Facility”
RSF Staff Parking<br />
RSF<br />
RSF II<br />
RSF Visitor Parking
New Building = 35 kBtu/SF/year<br />
Leased Building = 133 kBtu/SF/year<br />
Annual Energy Savings = $275,590
20 Year NPV = $4.4M or $20/SF<br />
30 Year NPV = $6.0M or $27/SF
Monthly EUI (kBtu/ft 2 )<br />
Credit: Chad Lobato/NREL<br />
Model<br />
RSF<br />
PV<br />
Model<br />
RSF<br />
PV<br />
Model<br />
RSF<br />
PV<br />
Model<br />
RSF<br />
PV<br />
Model<br />
RSF<br />
PV<br />
Model<br />
RSF<br />
PV<br />
Model<br />
RSF<br />
PV<br />
Model<br />
RSF<br />
PV<br />
Model<br />
RSF<br />
PV<br />
Model<br />
RSF<br />
PV<br />
Model<br />
RSF<br />
PV<br />
Model<br />
RSF<br />
PV<br />
Annual EUI (kBtu/ft 2 )<br />
Measured Versus Modeled Monthly and Cumulative EUI<br />
4.5<br />
4.0<br />
36<br />
32<br />
The PV system is sized<br />
for an annual EUI <strong>of</strong><br />
35.1 kBtu/ft 2 .<br />
3.5<br />
28<br />
3.0<br />
2.5<br />
2.0<br />
1.5<br />
24<br />
20<br />
16<br />
12<br />
PV<br />
Data Center<br />
Mechanical Systems<br />
Plug Loads<br />
Lighting<br />
Heating<br />
Cooling<br />
Model Annual EUI<br />
RSF Annual EUI<br />
1.0<br />
8<br />
0.5<br />
4<br />
0.0<br />
0<br />
October<br />
2010<br />
November<br />
2010<br />
December<br />
2010<br />
January<br />
2011<br />
February<br />
2011<br />
March<br />
2011<br />
April<br />
2011<br />
May<br />
2011<br />
June<br />
2011<br />
July<br />
2011<br />
August<br />
2011<br />
September<br />
2011<br />
Note: The annual EUI values<br />
are demand side values<br />
and do not include the<br />
61<br />
Innovation for Our Energy Future
Power Density (W/ft 2 )<br />
October 2010 – September 2011 Lighting Power Density<br />
0.35<br />
0.33<br />
0.30<br />
0.28<br />
0.25<br />
0.23<br />
0.20<br />
0.18<br />
0.15<br />
0.13<br />
0.10<br />
0.08<br />
Model Average<br />
October 2010<br />
November 2010<br />
December 2010<br />
January 2011<br />
February 2011<br />
March 2011<br />
April 2011<br />
May 2011<br />
June 2011<br />
July 2011<br />
August 2011<br />
September 2011<br />
0.05<br />
0.03<br />
0.00<br />
0 2 4 6 8 10 12 14 16 18 20 22 24<br />
Credit: Chad Lobato/NREL<br />
Time <strong>of</strong> Day<br />
Innovation for Our Energy Future
Power Density (W/ft 2 )<br />
0.65<br />
October 2010 – September 2011 Plug Load Power<br />
Density<br />
0.60<br />
0.55<br />
0.50<br />
0.45<br />
0.40<br />
0.35<br />
Credit: Matthew Luckwitz/NREL<br />
0.30<br />
0.25<br />
0.20<br />
0.15<br />
0.10<br />
0.05<br />
0.00<br />
0 2 4 6 8 10 12 14 16 18 20 22 24<br />
Credit: Chad Lobato/NREL<br />
Time <strong>of</strong> Day<br />
Innovation for Our Energy Future<br />
Model Average<br />
October 2010<br />
November 2010<br />
December 2010<br />
January 2011<br />
February 2011<br />
March 2011<br />
April 2011<br />
May 2011<br />
June 2011<br />
July 2011<br />
August 2011<br />
September 2011<br />
Note: The elevators are included in the plug loads
WHAT ARE THE<br />
BEST PRACTICES
1 Performance-based procurement<br />
2<br />
3<br />
4<br />
5<br />
6<br />
Predicting energy use<br />
Passive architecture and load reduction<br />
Low energy active systems<br />
Integrated renewable energy<br />
Zero energy operation
WHO IS PURSUING<br />
NET ZERO ENERGY