4.2 Practice with Examples - WorthysAlgebraClass
4.2 Practice with Examples - WorthysAlgebraClass
4.2 Practice with Examples - WorthysAlgebraClass

You also want an ePaper? Increase the reach of your titles
YUMPU automatically turns print PDFs into web optimized ePapers that Google loves.
LESSON<br />
<strong>4.2</strong> <strong>Practice</strong> <strong>with</strong> <strong>Examples</strong><br />
For use <strong>with</strong> pages 210–217<br />
NAME _________________________________________________________<br />
DATE ___________<br />
GOAL<br />
Graph a linear equation using a table or a list of values and<br />
graph horizontal and vertical lines<br />
VOCABULARY<br />
A solution of an equation in two variables x and y is an ordered pair<br />
x, y that makes the equation true.<br />
The graph of an equation in x and y is the set of all points x, y that are<br />
solutions of the equation.<br />
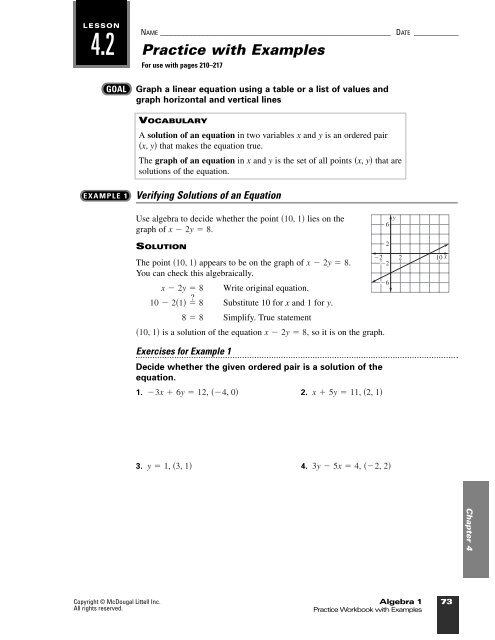
EXAMPLE 1<br />
Verifying Solutions of an Equation<br />
Use algebra to decide whether the point 10, 1 lies on the<br />
graph of x 2y 8.<br />
6<br />
y<br />
2<br />
SOLUTION<br />
The point 10, 1 appears to be on the graph of x 2y 8.<br />
You can check this algebraically.<br />
x 2y 8 Write original equation.<br />
10 21 8 Substitute 10 for x and 1 for y.<br />
8 8 Simplify. True statement<br />
2<br />
2<br />
6<br />
10, 1 is a solution of the equation x 2y 8, so it is on the graph.<br />
2 10 x<br />
Exercises for Example 1<br />
Decide whether the given ordered pair is a solution of the<br />
equation.<br />
1. 3x 6y 12, 4, 0<br />
2. x 5y 11, 2, 1<br />
3. y 1, 3, 1<br />
4. 3y 5x 4, 2, 2<br />
Chapter 4<br />
Copyright © McDougal Littell Inc.<br />
All rights reserved.<br />
Algebra 1 73<br />
<strong>Practice</strong> Workbook <strong>with</strong> <strong>Examples</strong>
LESSON<br />
<strong>4.2</strong><br />
CONTINUED<br />
NAME _________________________________________________________<br />
<strong>Practice</strong> <strong>with</strong> <strong>Examples</strong><br />
For use <strong>with</strong> pages 210–217<br />
DATE ____________<br />
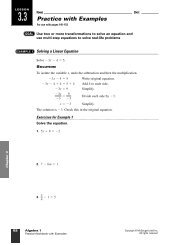
EXAMPLE 2<br />
Graphing a Linear Equation<br />
Use a table of values to graph the equation x 2y 4.<br />
SOLUTION<br />
Rewrite the equation in function form by solving for y.<br />
x 2y 4<br />
Write original equation.<br />
2y x 4 Subtract x from each side.<br />
y x 2 2<br />
Divide each side by 2.<br />
Choose a variety of values of x and make a table of values.<br />
Choose x. 4 2 0 2 4<br />
Evaluate y. 4 3 2 1 0<br />
Using the table of values, you can write five ordered pairs.<br />
4, 4, 2, 3, 0, 2, 2, 1, 4, 0<br />
Plot each ordered pair. The line through the points is the graph<br />
of the equation.<br />
Exercises for Example 2<br />
Use a table of values to graph the equation.<br />
5. y 3x 4<br />
6. 3y 3x 6<br />
7. y 3x 1<br />
6<br />
2<br />
y<br />
6<br />
2<br />
6<br />
6<br />
x<br />
Chapter 4<br />
74 Algebra 1<br />
<strong>Practice</strong> Workbook <strong>with</strong> <strong>Examples</strong><br />
Copyright © McDougal Littell Inc.<br />
All rights reserved.
LESSON<br />
<strong>4.2</strong><br />
CONTINUED<br />
EXAMPLE 3<br />
NAME _________________________________________________________<br />
<strong>Practice</strong> <strong>with</strong> <strong>Examples</strong><br />
For use <strong>with</strong> pages 210–217<br />
Graphing y b<br />
DATE ____________<br />
Graph the equation y 3.<br />
SOLUTION<br />
The y-value is always 3, regardless of the value of x. The<br />
points 1, 3, 0, 3, 2, 3 are some solutions of the<br />
equation. The graph of the equation is a horizontal line 3 units<br />
below the x-axis.<br />
y<br />
1<br />
3 1 1 3 x<br />
1<br />
(1, 3) (0, 3)<br />
y = 3 (2, 3)<br />
5<br />
EXAMPLE 4<br />
Graphing x a<br />
Graph the equation x 5.<br />
SOLUTION<br />
The x-value is always 5, regardless of the value of y. The points<br />
5, 2, 5, 0, 5, 3 are some solutions of the equation. The<br />
graph of the equation is a vertical line 5 units to the right of the<br />
y-axis.<br />
6<br />
2<br />
2<br />
2<br />
6<br />
y<br />
x = 5<br />
(5, 3)<br />
(5, 0)<br />
2 6 10 x<br />
(5, 2)<br />
Exercises for <strong>Examples</strong> 3 and 4<br />
Graph the equation.<br />
8. y 0<br />
9. x 4<br />
10.<br />
x 0<br />
11. y 6<br />
12. y 5<br />
13. x 2<br />
Chapter 4<br />
Copyright © McDougal Littell Inc.<br />
All rights reserved.<br />
Algebra 1 75<br />
<strong>Practice</strong> Workbook <strong>with</strong> <strong>Examples</strong>