Nucleic Acid and Fluorescent Dye Concentration ... - NanoDrop
Nucleic Acid and Fluorescent Dye Concentration ... - NanoDrop
Nucleic Acid and Fluorescent Dye Concentration ... - NanoDrop

You also want an ePaper? Increase the reach of your titles
YUMPU automatically turns print PDFs into web optimized ePapers that Google loves.
APPLICATION NOTE <strong>NanoDrop</strong> 1000<br />
<strong>Nucleic</strong> <strong>Acid</strong> <strong>and</strong> <strong>Fluorescent</strong> <strong>Dye</strong><br />
<strong>Concentration</strong> Measurement<br />
Introduction<br />
Europroteome is a leading biomedical<br />
firm focusing on R&D <strong>and</strong> product<br />
development in the area of epithelial<br />
cancers. Gene expression analysis at<br />
Europroteome is performed either by<br />
real-time quantitative PCR or with the<br />
DNA-microarray technology.<br />
Information quality is dependent on<br />
accurate <strong>and</strong> reproducible measurement<br />
of RNA concentrations. In both cases,<br />
total RNA from paired non-tumor <strong>and</strong><br />
tumor samples are systematically<br />
analyzed in parallel <strong>and</strong> the relative levels<br />
of expression of one or thous<strong>and</strong>s of<br />
genes are compared.<br />
<strong>Nucleic</strong> <strong>Acid</strong> Measurement<br />
The proteomics <strong>and</strong> gene expression<br />
laboratory in Hennigsdorf, Germany,<br />
utilizes immunopurified epithelial cells<br />
extracted from already limited human<br />
tissue samples resected at one of the<br />
networking hospitals. Samples are<br />
screened, at a proteomics <strong>and</strong><br />
transcriptomics level, to identify cancer<br />
markers <strong>and</strong> diagnostic targets. To<br />
accomplish this, Europroteome needed to<br />
establish procedures that limit sample<br />
consumption without interfering with the<br />
data quality. One aspect of this<br />
optimization process was the<br />
quantification of extracted total RNA for<br />
rt-PCR <strong>and</strong> cDNA microarray<br />
experiments. The Thermo Scientific<br />
<strong>NanoDrop</strong> 1000 Spectrophotometer has<br />
met the stringent requirements of very<br />
<strong>and</strong> the Amersham Ultrospec 3100 pro<br />
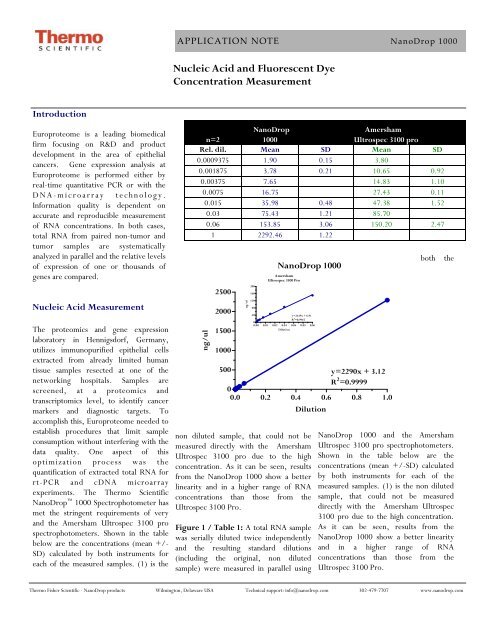
spectrophotometers. Shown in the table<br />
below are the concentrations (mean +/-<br />
SD) calculated by both instruments for<br />
each of the measured samples. (1) is the<br />
<strong>NanoDrop</strong><br />
Amersham<br />
n=2 1000 Ultrospec 3100 pro<br />
Rel. dil. Mean SD Mean SD<br />
0.0009375 1.90 0.15 3.80<br />
0.001875 3.78 0.21 10.65 0.92<br />
0.00375 7.65 14.83 1.10<br />
0.0075 16.75 27.43 0.11<br />
0.015 35.98 0.48 47.38 1.52<br />
0.03 75.43 1.21 85.70<br />
0.06 153.85 3.06 150.20 2.47<br />
1 2292.46 1.22<br />
ng/ul<br />
2500<br />
2000<br />
1500<br />
1000<br />
<strong>NanoDrop</strong> 1000<br />
Amersham<br />
Ultrospec 3100 Pro<br />
40<br />
y=2449x + 6.91<br />
R 2 =0.9945<br />
0<br />
0.00 0.01 0.02 0.03 0.04 0.05 0.06<br />
500<br />
y=2290x + 3.12<br />
0<br />
R 2 =0.9999<br />
0.0 0.2 0.4 0.6 0.8 1.0<br />
Dilution<br />
non diluted sample, that could not be<br />
measured directly with the Amersham<br />
Ultrospec 3100 pro due to the high<br />
concentration. As it can be seen, results<br />
from the <strong>NanoDrop</strong> 1000 show a better<br />
linearity <strong>and</strong> in a higher range of RNA<br />
concentrations than those from the<br />
Ultrospec 3100 Pro.<br />
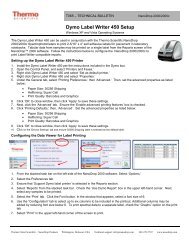
Figure 1 / Table 1: A total RNA sample<br />
was serially diluted twice independently<br />
<strong>and</strong> the resulting st<strong>and</strong>ard dilutions<br />
(including the original, non diluted<br />
sample) were measured in parallel using<br />
ng/ul<br />
200<br />
160<br />
120<br />
80<br />
Dilution<br />
both<br />
the<br />
<strong>NanoDrop</strong> 1000 <strong>and</strong> the Amersham<br />
Ultrospec 3100 pro spectrophotometers.<br />
Shown in the table below are the<br />
concentrations (mean +/-SD) calculated<br />
by both instruments for each of the<br />
measured samples. (1) is the non diluted<br />
sample, that could not be measured<br />
directly with the Amersham Ultrospec<br />
3100 pro due to the high concentration.<br />
As it can be seen, results from the<br />
<strong>NanoDrop</strong> 1000 show a better linearity<br />
<strong>and</strong> in a higher range of RNA<br />
concentrations than those from the<br />
Ultrospec 3100 Pro.<br />
Thermo Fisher Scientific - <strong>NanoDrop</strong> products Wilmington, Delaware USA Technical support: info@nanodrop.com 302-479-7707 www.nanodrop.com
2<br />
APPLICATION NOTE <strong>NanoDrop</strong> 1000<br />
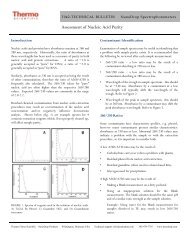
Table 2. <strong>NanoDrop</strong> 1000<br />
Final<br />
concentration<br />
Amersham Ultrospec<br />
3100 pro<br />
Final<br />
concentration<br />
Dil Factor Mean SD Mean SD Mean SD Mean SD<br />
1066.7 1.9 0.1 2021.3 158.4 3.8 4053.3<br />
533.3 3.8 0.2 2016.0 113.1 10.7 0.9 5680.0 490.3<br />
266.7 7.7 2040.0 14.8 1.1 3953.3 292.3<br />
133.3 16.8 2233.3 27.4 0.1 3656.7 14.1<br />
66.7 36.0 0.5 2398.7 32.1 47.4 1.5 3158.3 101.4<br />
33.3 75.4 1.2 2514.2 40.3 85.7 2856.7<br />
16.7 153.8 3.1 2564.1 51.0 150.2 2.5 2503.3 41.2<br />
1.0 2292.5 1.2 2292.5 1.2<br />
Mean 2260.0 3694.5<br />
SD 221.3 1044.6<br />
CV (%) 9.8 28.3<br />
Figure 2.<br />
Uniformity of the Calculated <strong>Concentration</strong>s<br />
after Applying the Dilution Factor<br />
hybridized to the array.<br />
With the <strong>NanoDrop</strong> 1000, for the first<br />
time, we now have the possibility to check<br />
the efficiency of the cDNA labeling process<br />
<strong>and</strong> to control the quality of the hybridization<br />
probes in our microarray experiments.<br />
Before the <strong>NanoDrop</strong> 1000 was<br />
used it was not possible to quality control<br />
the labeling procedure. The sample volume<br />
of the hybridization solution must not<br />
exceed 25µl. For an analysis in a regular<br />
spectrophotometer at least about 50µl are<br />
needed. The <strong>NanoDrop</strong> 1000 enables the<br />
researcher to check for Cy3 <strong>and</strong> Cy5 labeling<br />
efficiencies by using only 1µl of the<br />
hybridization solution. The quality <strong>and</strong><br />
quantity control of the hybridization<br />
probes is of great value because the experiment<br />
can be stopped if one of the labeling<br />
reactions did not perform well therefore<br />
saving the costs of an expensive cDNA<br />
microarray chip which would have been<br />
hybridized with a bad sample.<br />
ng/ul of the original sample<br />
6000<br />
5000<br />
4000<br />
3000<br />
2000<br />
1000<br />
0<br />
1066.7<br />
533.3<br />
Dilution factor<br />
<strong>NanoDrop</strong> 1000<br />
Amersham Ultraspec<br />
3100 Pro<br />
266.7<br />
133.3<br />
66.7<br />
33.3<br />
16.7<br />
1.0<br />
In addition to the nucleic acid <strong>and</strong> microarray<br />
applications, the <strong>NanoDrop</strong> 1000 can<br />
also be used as an UV/Vis spectrophotometer.<br />
Collectively, the <strong>NanoDrop</strong><br />
1000 is of great value for us. It is very easy<br />
to use. A major advantage is very low sample<br />
consumption, which is especially important<br />
when using precious materials like<br />
human tissue samples. Also significant is<br />
elimination of cuvettes <strong>and</strong>, in many cases,<br />
no need to dilute the samples because the<br />
<strong>NanoDrop</strong> 1000 can measure higher concentrations<br />
than any other commercially<br />
available spectrophotometers. Thus, costs<br />
are reduced <strong>and</strong> measurements are much<br />
faster.<br />
<strong>Fluorescent</strong> <strong>Dye</strong> Labeling Efficiency<br />
For gene expression analysis on cDNAmicroarrays,<br />
about 10µg total RNA corresponding<br />
to only 100ng mRNA is used<br />
as starting material. During the labeling<br />
process, the mRNA is reverse transcribed<br />
into cDNA with concurrent Cy-dye labeled<br />
nucleotide incorporation. The two<br />
samples, derived from the tumor <strong>and</strong> nontumor<br />
specimen, are combined <strong>and</strong><br />
Rev 5/08<br />
Thermo Fisher Scientific - <strong>NanoDrop</strong> products Wilmington, Delaware USA Technical support: info@nanodrop.com 302-479-7707 www.nanodrop.com