APGeneticsLab
APGeneticsLab
APGeneticsLab

Create successful ePaper yourself
Turn your PDF publications into a flip-book with our unique Google optimized e-Paper software.
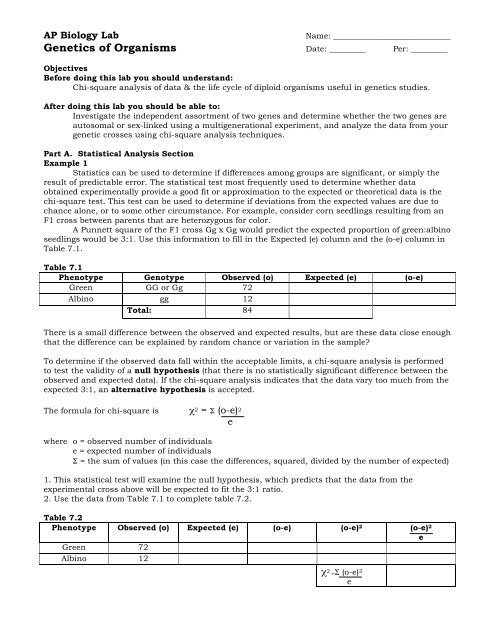
AP Biology Lab<br />
Genetics of Organisms Date: _________ Per: _________<br />
Name: _____________________________<br />
Objectives<br />
Before doing this lab you should understand:<br />
Chi-square analysis of data & the life cycle of diploid organisms useful in genetics studies.<br />
After doing this lab you should be able to:<br />
Investigate the independent assortment of two genes and determine whether the two genes are<br />
autosomal or sex-linked using a multigenerational experiment, and analyze the data from your<br />
genetic crosses using chi-square analysis techniques.<br />
Part A. Statistical Analysis Section<br />
Example 1<br />
Statistics can be used to determine if differences among groups are significant, or simply the<br />
result of predictable error. The statistical test most frequently used to determine whether data<br />
obtained experimentally provide a good fit or approximation to the expected or theoretical data is the<br />
chi-square test. This test can be used to determine if deviations from the expected values are due to<br />
chance alone, or to some other circumstance. For example, consider corn seedlings resulting from an<br />
F1 cross between parents that are heterozygous for color.<br />
A Punnett square of the F1 cross Gg x Gg would predict the expected proportion of green:albino<br />
seedlings would be 3:1. Use this information to fill in the Expected (e) column and the (o-e) column in<br />
Table 7.1.<br />
Table 7.1<br />
Phenotype Genotype Observed (o) Expected (e) (o-e)<br />
Green GG or Gg 72<br />
Albino gg 12<br />
Total: 84<br />
There is a small difference between the observed and expected results, but are these data close enough<br />
that the difference can be explained by random chance or variation in the sample<br />
To determine if the observed data fall within the acceptable limits, a chi-square analysis is performed<br />
to test the validity of a null hypothesis (that there is no statistically significant difference between the<br />
observed and expected data). If the chi-square analysis indicates that the data vary too much from the<br />
expected 3:1, an alternative hypothesis is accepted.<br />
The formula for chi-square is χ 2 = Σ (o-e) 2<br />
e<br />
where o = observed number of individuals<br />
e = expected number of individuals<br />
Σ = the sum of values (in this case the differences, squared, divided by the number of expected)<br />
1. This statistical test will examine the null hypothesis, which predicts that the data from the<br />
experimental cross above will be expected to fit the 3:1 ratio.<br />
2. Use the data from Table 7.1 to complete table 7.2.<br />
Table 7.2<br />
Phenotype Observed (o) Expected (e) (o-e) (o-e) 2 (o-e) 2<br />
Green 72<br />
Albino 12<br />
χ 2 =Σ (o-e) 2<br />
e<br />
e
Critical Values Table<br />
Degrees of Freedom (df)<br />
Probability (p) 1 2 3 4 5<br />
0.05 3.84 5.99 7.82 9.49 11.1<br />
0.01 6.64 9.21 11.3 13.2 15.1<br />
0.001 10.8 13.8 16.3 18.5 20.5<br />
How to use the Critical Values Table<br />
1. Determine the degrees of freedom (df) for your experiment. It is the number of phenotypic classes<br />
minus 1. Since there are two possible phenotypes, for this experiment df=1 (two samples -1). If this<br />
experiment had gathered data for a dihybrid cross, there would be four possible phenotypes and<br />
therefore 3 degrees of freedom.<br />
2. Find the p value. Under the 1 df column, find the critical value in the probability (p) = 0.05 row; it<br />
is 3.84. What does this mean If the calculated chi-square value is greater than or equal to the<br />
critical value from the table, then the null hypothesis is rejected. Since in our example χ 2 =<br />
5.14 and 5.14 > 3.84, we reject our null hypothesis that there is no statistically significant<br />
difference between the observed and expected data. In other words, chance alone cannot explain<br />
the deviations we observed and there is, therefore, a reason to doubt our original hypothesis (or to<br />
question our data collection accuracy.) The minimum probability for rejecting a null hypothesis is<br />
generally 0.05, so this is the row to use in s chi-square table.<br />
3. These results are said to be significant at a probability of p = 0.05. This means that only 5% of the<br />
time would you expect to see similar data if the null hypothesis was correct; thus, you are 95%<br />
sure that the data did not fit a 3:1 ratio.<br />
4. Since these data do not fit the expected 3:1 ratio, you must consider reasons for this variation.<br />
Additional experimentation would be necessary. Perhaps the sample size was too small, or errors<br />
were made in data collection. In this example, perhaps, the albino seedlings are underrepresented<br />
because they died before the counting was performed.<br />
Example 2<br />
In a study of incomplete dominance in tobacco seedlings, the counts in table 7.3 were made from a<br />
cross between two heterozygous plants.<br />
Table 7.3<br />
Phenotype Observed (o) Expected (e) (o-e) (o-e) 2 (o-e) 2<br />
Green 22<br />
Yellow Green 50<br />
Albino 12<br />
χ 2 =Σ (o-e) 2<br />
e<br />
A Punnett square for this cross indicates an expected ratio of 1 green:2 yellow green:1 albino.<br />
Calculate the expected for each and fill out the Table 7.3.<br />
How many degrees of freedom are there _______<br />
Using the critical values chart, what is the probability value for these data _____<br />
According to the critical value of χ 2 , can you accept or reject the null hypothesis (does the data fit the<br />
expected 1:2:1 ratio)<br />
e
Practice Problem<br />
An investigator observes that when pure-breeding, long-winged fruit flies are mated with purebreeding,<br />
short-winged flies, the F 1 offspring have an intermediate wing length. When several<br />
intermediate-winged flies are allowed to interbreed, the following results are obtained:<br />
230 long-winged flies, 510 intermediate winged flies, 260 short winged flies.<br />
a. What is the genotype of the F 1 intermediate-wing-length flies<br />
b. Write a hypothesis describing the mode of inheritance of wing length in fruit flies (this is your null<br />
hypothesis).<br />
c. Complete Table 7.4<br />
Table 7.4<br />
Phenotype Observed (o) Expected (e) (o-e) (o-e) 2 (o-e) 2<br />
e<br />
d. How many degrees of freedom (df) are there _____<br />
e. Chi-square (χ 2 ) = _____<br />
f. What is the probability value for these data _____<br />
g. Can you accept or reject the null hypothesis Explain why.<br />
χ 2 =Σ (o-e) 2<br />
e
Part B. Fruit Fly Crosses<br />
Procedure 1: Monohybrid Cross<br />
1. Go to the website: http://www.sciencecourseware.com/vcise/drosophila/ and log in as a guest.<br />
2. “Order” a pair of flies: a male wild type for wing size and a female with vestigial wing size. Put them<br />
in your “Shopping Cart”. Check out.<br />
3. Breed the flies, click on the “Mating Jar” and record the Data in Table 7.5.<br />
Table 7.5-F1 Generation<br />
Phenotype and Symbol Females Males<br />
4. Add one female and one male from the F 1 Generation and put them into a new mating jar. Breed<br />
them and record the F 2 generation data in Table 7.6<br />
Table 7.6-F2 Generation<br />
Phenotype and Symbol Females Males<br />
5. Write a hypothesis that describes the mode of inheritance of the trait you studied. This is your null<br />
hypothesis.<br />
6. Construct Punnett squares to predict the expected results of both parental and F 1 generational<br />
crosses from your null hypothesis.<br />
Parental Cross<br />
F1 Cross<br />
7. Refer to the Punnett squares above. In the table below, record the expected ratios for the genotypes<br />
and phenotypes of the F 1 and F 2 crosses in the experiment.<br />
F1 generation<br />
F2 generation<br />
Expected Genotypic Ratio<br />
Expected Phenotypic Ratio<br />
8. From the results, describe your cross.<br />
Is the mutation sex-linked or autosomal<br />
Is the mutation dominant or recessive<br />
Is the cross monohybrid of dihybrid<br />
_________________<br />
_________________<br />
_________________
9. Perform a chi-square test on your F 2 results to see if the deviations are within limits expected by<br />
chance.<br />
Phenotype Observed (o) Expected (e) (o-e) (o-e) 2 (o-e) 2<br />
e<br />
10. Calculate the chi-square value for these data.<br />
How many degrees of freedom are there<br />
χ 2 =Σ (o-e) 2<br />
e<br />
Chi-square (X 2 )<br />
What is the probability for this data<br />
11. Can you accept or reject your null hypothesis Explain why.<br />
Procedure 2: Monohybrid Cross<br />
1. Return to the lab and click the “trash” to clear the lab of flies.<br />
2. “Order” a pair of flies: a male wild type and a female with a yellow body. Check out<br />
3. Breed the flies, click on the “Mating Jar” and record the Data in Table 7.7.<br />
Table 7.7-F1 Generation<br />
Phenotype and Symbol Females Males<br />
4. Add one female and one male from the F 1 Generation and put them into a new mating jar. Breed<br />
them and record the F 2 generation data in Table 7.8<br />
Table 7.8-F2 Generation<br />
Phenotype and Symbol Females Males<br />
5. Write a null hypothesis that describes the mode of inheritance of the trait you studied.
6. Construct Punnett squares to predict the expected results of both parental and F 1 generational<br />
crosses from your null hypothesis.<br />
Parental Cross<br />
F1 Cross<br />
7. Refer to the Punnett squares above. In the table below, record the expected ratios for the genotypes<br />
and phenotypes of the F 1 and F 2 crosses in the experiment.<br />
F1 generation<br />
F2 generation<br />
Expected Genotypic Ratio<br />
Expected Phenotypic Ratio<br />
8. From the results, describe your cross.<br />
Is the mutation sex-linked or autosomal<br />
Is the mutation dominant or recessive<br />
_________________<br />
_________________<br />
9. Perform a chi-square test on your F 2 results to see if the deviations are within limits expected by<br />
chance.<br />
Phenotype Observed (o) Expected (e) (o-e) (o-e) 2 (o-e) 2<br />
e<br />
10. Calculate the chi-square value for these data.<br />
How many degrees of freedom are there _____<br />
χ 2 =Σ (o-e) 2<br />
e<br />
Chi-square (χ 2 ) = _____<br />
What is the probability for this data _____<br />
11. Can you accept or reject your null hypothesis Explain why.
Procedure 3: Dihybrid Cross<br />
1. Return to the lab and click the “trash” to clear the lab of flies.<br />
2. Order a wild type female and order a male with sepia eyes and black body.<br />
3. Breed the flies, click on the “Mating Jar” and record the Data in Table 7.9.<br />
Table 7.9-F1 Generation<br />
Phenotype and Symbol Females Males<br />
4. Add one female and one male from the F 1 Generation and put them into a new mating jar. Breed<br />
them and record the F 2 generation data in Table 7.10<br />
Table 7.10-F2 Generation<br />
Phenotype and Symbol Females Males<br />
5. Write a null hypothesis that describes the mode of inheritance of the traits you studied.<br />
6. Construct Punnett squares to predict the expected results of both parental and F 1 generational<br />
crosses from your null hypothesis.<br />
Parental Cross<br />
F1 Cross<br />
7. Refer to the Punnett squares above. In the table below, record the expected ratios for the genotypes<br />
and phenotypes of the F 1 and F 2 crosses in the experiment.<br />
F1 generation<br />
F2 generation<br />
Expected Genotypic Ratio<br />
Expected Phenotypic Ratio<br />
8. From the results, describe your cross.<br />
Are the mutations sex-linked or autosomal _________________<br />
Are the mutations dominant or recessive _________________<br />
Is the cross monohybrid of dihybrid _________________
9. Perform a chi-square test on your F 2 results to see if the deviations are within limits expected by<br />
chance.<br />
Phenotype Observed (o) Expected (e) (o-e) (o-e) 2 (o-e) 2<br />
e<br />
10. Calculate the chi-square value for these data.<br />
How many degrees of freedom are there _____<br />
Chi-square (χ 2 ) = _____<br />
What is the probability for this data _____<br />
11. Can you accept or reject your null hypothesis Explain why.<br />
χ 2 =Σ (o-e) 2<br />
e