Power from marine sediment fuel cells: the influence of anode material
Power from marine sediment fuel cells: the influence of anode material
Power from marine sediment fuel cells: the influence of anode material

Create successful ePaper yourself
Turn your PDF publications into a flip-book with our unique Google optimized e-Paper software.
1316 J Appl Electrochem (2008) 38:1313–1319<br />
Ecell / mV<br />
Current density / mA m -2<br />
800<br />
30<br />
1<br />
700<br />
2 25<br />
600<br />
20<br />
500<br />
400<br />
15<br />
300<br />
10<br />
200<br />
5<br />
100<br />
0<br />
0<br />
0 20 40 60 80 100 120 140<br />
Fig. 2 Cell voltage and power density curves <strong>of</strong> <strong>the</strong> <strong>sediment</strong> <strong>fuel</strong><br />
cell with carbon cloth <strong>anode</strong>s. Two sets <strong>of</strong> data are for polarisation in<br />
successive weeks <strong>of</strong> <strong>the</strong> study. h: first polarisation; 9: second<br />
polarisation<br />
<strong>Power</strong> density / mW m -2<br />
Potential vs. Ag/AgCl / mV<br />
400<br />
300<br />
200<br />
100<br />
0<br />
0 20 40 60 80 100 120 140<br />
-100<br />
-200<br />
-300<br />
-400<br />
1<br />
2<br />
Current density / mA m -2<br />
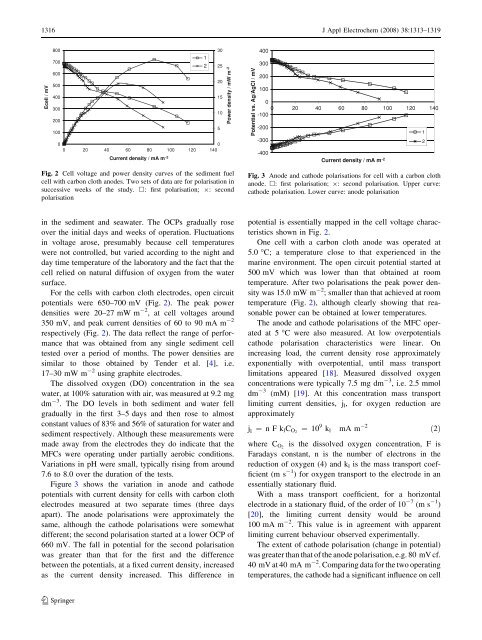
Fig. 3 Anode and cathode polarisations for cell with a carbon cloth<br />
<strong>anode</strong>. h: first polarisation; 9: second polarisation. Upper curve:<br />
cathode polarisation. Lower curve: <strong>anode</strong> polarisation<br />
in <strong>the</strong> <strong>sediment</strong> and seawater. The OCPs gradually rose<br />
over <strong>the</strong> initial days and weeks <strong>of</strong> operation. Fluctuations<br />
in voltage arose, presumably because cell temperatures<br />
were not controlled, but varied according to <strong>the</strong> night and<br />
day time temperature <strong>of</strong> <strong>the</strong> laboratory and <strong>the</strong> fact that <strong>the</strong><br />
cell relied on natural diffusion <strong>of</strong> oxygen <strong>from</strong> <strong>the</strong> water<br />
surface.<br />
For <strong>the</strong> <strong>cells</strong> with carbon cloth electrodes, open circuit<br />
potentials were 650–700 mV (Fig. 2). The peak power<br />
densities were 20–27 mW m -2 , at cell voltages around<br />
350 mV, and peak current densities <strong>of</strong> 60 to 90 mA m -2<br />
respectively (Fig. 2). The data reflect <strong>the</strong> range <strong>of</strong> performance<br />
that was obtained <strong>from</strong> any single <strong>sediment</strong> cell<br />
tested over a period <strong>of</strong> months. The power densities are<br />
similar to those obtained by Tender et al. [4], i.e.<br />
17–30 mW m -2 using graphite electrodes.<br />
The dissolved oxygen (DO) concentration in <strong>the</strong> sea<br />
water, at 100% saturation with air, was measured at 9.2 mg<br />
dm -3 . The DO levels in both <strong>sediment</strong> and water fell<br />
gradually in <strong>the</strong> first 3–5 days and <strong>the</strong>n rose to almost<br />
constant values <strong>of</strong> 83% and 56% <strong>of</strong> saturation for water and<br />
<strong>sediment</strong> respectively. Although <strong>the</strong>se measurements were<br />
made away <strong>from</strong> <strong>the</strong> electrodes <strong>the</strong>y do indicate that <strong>the</strong><br />
MFCs were operating under partially aerobic conditions.<br />
Variations in pH were small, typically rising <strong>from</strong> around<br />
7.6 to 8.0 over <strong>the</strong> duration <strong>of</strong> <strong>the</strong> tests.<br />
Figure 3 shows <strong>the</strong> variation in <strong>anode</strong> and cathode<br />
potentials with current density for <strong>cells</strong> with carbon cloth<br />
electrodes measured at two separate times (three days<br />
apart). The <strong>anode</strong> polarisations were approximately <strong>the</strong><br />
same, although <strong>the</strong> cathode polarisations were somewhat<br />
different; <strong>the</strong> second polarisation started at a lower OCP <strong>of</strong><br />
660 mV. The fall in potential for <strong>the</strong> second polarisation<br />
was greater than that for <strong>the</strong> first and <strong>the</strong> difference<br />
between <strong>the</strong> potentials, at a fixed current density, increased<br />
as <strong>the</strong> current density increased. This difference in<br />
potential is essentially mapped in <strong>the</strong> cell voltage characteristics<br />
shown in Fig. 2.<br />
One cell with a carbon cloth <strong>anode</strong> was operated at<br />
5.0 °C; a temperature close to that experienced in <strong>the</strong><br />
<strong>marine</strong> environment. The open circuit potential started at<br />
500 mV which was lower than that obtained at room<br />
temperature. After two polarisations <strong>the</strong> peak power density<br />
was 15.0 mW m -2 ; smaller than that achieved at room<br />
temperature (Fig. 2), although clearly showing that reasonable<br />
power can be obtained at lower temperatures.<br />
The <strong>anode</strong> and cathode polarisations <strong>of</strong> <strong>the</strong> MFC operated<br />
at 5 °C were also measured. At low overpotentials<br />
cathode polarisation characteristics were linear. On<br />
increasing load, <strong>the</strong> current density rose approximately<br />
exponentially with overpotential, until mass transport<br />
limitations appeared [18]. Measured dissolved oxygen<br />
concentrations were typically 7.5 mg dm -3 , i.e. 2.5 mmol<br />
dm -3 (mM) [19]. At this concentration mass transport<br />
limiting current densities, j l , for oxygen reduction are<br />
approximately<br />
j l ¼ nFk l C O2 ¼ 10 9 k l mA m 2 ð2Þ<br />
where C O2 is <strong>the</strong> dissolved oxygen concentration, F is<br />
Faradays constant, n is <strong>the</strong> number <strong>of</strong> electrons in <strong>the</strong><br />
reduction <strong>of</strong> oxygen (4) and k l is <strong>the</strong> mass transport coefficient<br />
(m s -1 ) for oxygen transport to <strong>the</strong> electrode in an<br />
essentially stationary fluid.<br />
With a mass transport coefficient, for a horizontal<br />
electrode in a stationary fluid, <strong>of</strong> <strong>the</strong> order <strong>of</strong> 10 -7 (m s -1 )<br />
[20], <strong>the</strong> limiting current density would be around<br />
100 mA m -2 . This value is in agreement with apparent<br />
limiting current behaviour observed experimentally.<br />
The extent <strong>of</strong> cathode polarisation (change in potential)<br />
was greater than that <strong>of</strong> <strong>the</strong> <strong>anode</strong> polarisation, e.g. 80 mV cf.<br />
40 mV at 40 mA m -2 . Comparing data for <strong>the</strong> two operating<br />
temperatures, <strong>the</strong> cathode had a significant <strong>influence</strong> on cell<br />
123