Power from marine sediment fuel cells: the influence of anode material
Power from marine sediment fuel cells: the influence of anode material
Power from marine sediment fuel cells: the influence of anode material

Create successful ePaper yourself
Turn your PDF publications into a flip-book with our unique Google optimized e-Paper software.
1318 J Appl Electrochem (2008) 38:1313–1319<br />
In <strong>the</strong> case <strong>of</strong> <strong>the</strong> data <strong>from</strong> our study, which were<br />
obtained during cell voltage measurements under variable<br />
load, an approximate exponential rise in current density<br />
with overpotential can be seen (Fig. 4), except for carbon<br />
sponge. In <strong>the</strong> case <strong>of</strong> carbon sponge <strong>the</strong> variation <strong>of</strong> current<br />
density with overpotential was probably <strong>influence</strong>d by<br />
internal resistance (IR) voltage loss and <strong>the</strong> onset <strong>of</strong> some<br />
mass transport limitation, at <strong>the</strong> higher current densities<br />
experienced with this <strong>anode</strong>. For carbon sponge, <strong>the</strong><br />
change in overpotential (Tafel slope) in <strong>the</strong> lower overpotential<br />
range, <strong>of</strong> 60–100 mV, was approximately<br />
100 mV per decade (Fig. 4a). This would suggest that <strong>the</strong><br />
carbon sponge <strong>anode</strong> had more favourable electrochemical<br />
characteristics compared to graphite; although <strong>the</strong> latter<br />
<strong>material</strong> used by Lowy et al. [14] was not porous.<br />
To compare <strong>the</strong> relative activity <strong>of</strong> <strong>the</strong> <strong>anode</strong>s in this<br />
work <strong>the</strong> electrochemical behaviour was quantified by<br />
using <strong>the</strong> low overpotential range (\40 mV), linear<br />
approximation <strong>of</strong> <strong>the</strong> Butler Volmer equation<br />
j ¼ 2aj o CanFg=RT ¼ 2aj o Cg=b<br />
ð3Þ<br />
where, j o , is <strong>the</strong> exchange current density, a, is <strong>the</strong> transfer<br />
coefficient, a, is <strong>the</strong> active area per unit cross sectional<br />
area <strong>of</strong> <strong>the</strong> electrode and depends on <strong>the</strong> particular<br />
<strong>material</strong> used. C is <strong>the</strong> concentration <strong>of</strong> active species and<br />
b = RT/anF is <strong>the</strong> Tafel slope.<br />
Thus <strong>from</strong> (1), a plot <strong>of</strong> overpotential against current density<br />
(or specifically j/2) gives a slope, b/aCj o (ohm cm 2 ), a measure<br />
<strong>of</strong> charge transfer resistivity. Low Tafel slopes and high<br />
exchange current densities thus give lower charge transfer<br />
resistivities and are a measure <strong>of</strong> relative <strong>anode</strong> activity.<br />
The values <strong>of</strong> overpotential were measured against <strong>the</strong><br />
mixed potential for a particular <strong>anode</strong> <strong>material</strong> measured at<br />
zero current density. Table 1 compares <strong>the</strong> slopes <strong>of</strong> <strong>the</strong><br />
plots <strong>of</strong> overpotential against current density, i.e. kinetic<br />
resistivity, for <strong>the</strong> <strong>anode</strong>s tested in this work. The resistivities<br />
vary <strong>from</strong> 1.0 (sponge) to 100 (RVC) ohm cm 2 and<br />
<strong>the</strong> relative activity <strong>of</strong> <strong>the</strong> <strong>anode</strong>s corresponded to <strong>the</strong>ir<br />
relative performance in <strong>fuel</strong> <strong>cells</strong>.<br />
Table 1 also compares <strong>the</strong> performance (<strong>the</strong> peak power<br />
density) <strong>of</strong> <strong>the</strong> <strong>fuel</strong> <strong>cells</strong> used in this study. The data clearly<br />
Table 1 Peak power densities and electrochemical activities <strong>of</strong> MFC<br />
with different carbon <strong>anode</strong>s<br />
Anode<br />
Peak power<br />
density<br />
(mW m -2 )<br />
Carbon sponge 55 1.0<br />
Carbon cloth 19–27.5 3.0<br />
Carbon cloth (5 °C) 15 3.4<br />
Carbon fibre 4.5 20<br />
RVC 0.2 100<br />
Anode charge transfer<br />
resistivity/ohm cm 2<br />
(b/aCj o )<br />
identify carbon sponge as a potential electrode <strong>material</strong> for<br />
<strong>the</strong> <strong>sediment</strong> <strong>fuel</strong> cell giving peak power densities above<br />
50 mW cm -2 . This performance is approximately 2.5<br />
times that reported by Tender [4] for graphite <strong>anode</strong>s,<br />
although it is approximately 55–60 % <strong>of</strong> that reported by<br />
Lowy et al. [14] for modified graphite <strong>anode</strong>s incorporating<br />
anthraquinone disulphonic acid (AQDS) or Ni 2+ and<br />
Mn 2+ . However, in <strong>the</strong> case <strong>of</strong> <strong>the</strong> latter modified <strong>anode</strong>s,<br />
power performance decayed with time and fell to values<br />
achieved with <strong>the</strong> un-modified graphite <strong>anode</strong><br />
(*20 mW m -2 )[15].<br />
4 Constant load testing<br />
The MFCs used in this study were maintained under a<br />
constant load (380 X resistor), which gave potentials close<br />
to <strong>the</strong> point where <strong>the</strong> peak power density was obtained,<br />
and continuously monitored to study <strong>the</strong>ir stability over<br />
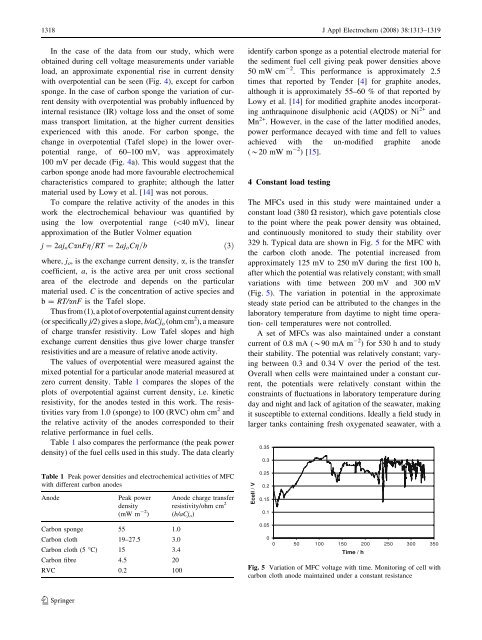
329 h. Typical data are shown in Fig. 5 for <strong>the</strong> MFC with<br />
<strong>the</strong> carbon cloth <strong>anode</strong>. The potential increased <strong>from</strong><br />
approximately 125 mV to 250 mV during <strong>the</strong> first 100 h,<br />
after which <strong>the</strong> potential was relatively constant; with small<br />
variations with time between 200 mV and 300 mV<br />
(Fig. 5). The variation in potential in <strong>the</strong> approximate<br />
steady state period can be attributed to <strong>the</strong> changes in <strong>the</strong><br />
laboratory temperature <strong>from</strong> daytime to night time operation-<br />
cell temperatures were not controlled.<br />
A set <strong>of</strong> MFCs was also maintained under a constant<br />
current <strong>of</strong> 0.8 mA (*90 mA m -2 ) for 530 h and to study<br />
<strong>the</strong>ir stability. The potential was relatively constant; varying<br />
between 0.3 and 0.34 V over <strong>the</strong> period <strong>of</strong> <strong>the</strong> test.<br />
Overall when <strong>cells</strong> were maintained under a constant current,<br />
<strong>the</strong> potentials were relatively constant within <strong>the</strong><br />
constraints <strong>of</strong> fluctuations in laboratory temperature during<br />
day and night and lack <strong>of</strong> agitation <strong>of</strong> <strong>the</strong> seawater, making<br />
it susceptible to external conditions. Ideally a field study in<br />
larger tanks containing fresh oxygenated seawater, with a<br />
Ecell / V<br />
0.35<br />
0.3<br />
0.25<br />
0.2<br />
0.15<br />
0.1<br />
0.05<br />
0<br />
0 50 100 150 200 250 300 350<br />
Time / h<br />
Fig. 5 Variation <strong>of</strong> MFC voltage with time. Monitoring <strong>of</strong> cell with<br />
carbon cloth <strong>anode</strong> maintained under a constant resistance<br />
123