

Ocean Circulation - Water Types and Water Masses
Ocean Circulation - Water Types and Water Masses
Ocean Circulation - Water Types and Water Masses

Create successful ePaper yourself
Turn your PDF publications into a flip-book with our unique Google optimized e-Paper software.
1566 OCEAN CIRCULATION / <strong>Water</strong> <strong>Types</strong> <strong>and</strong> <strong>Water</strong> <strong>Masses</strong><br />
salinity like with the Mediterranean <strong>Water</strong> in the<br />
Atlantic. Instead there is a confusing plethora of upper<br />
water masses that clearly separate the east–west <strong>and</strong><br />
north–south portions of the basin. So we have Eastern<br />
North Pacific Central <strong>Water</strong> (ENPCW) <strong>and</strong> Western<br />
North Pacific Central <strong>Water</strong> (WNPCW), as well as<br />
Eastern South Pacific Central <strong>Water</strong> (ESPCW) <strong>and</strong><br />
Western South Pacific Central <strong>Water</strong> (WSPCW).<br />
The central waters all refer to open ocean upper<br />
water masses. The more coastal water masses such as<br />
the Eastern North Pacific Transition <strong>Water</strong> (ENPTW)<br />
are typical of the change in upper water mass<br />
properties that occurs near the coastal regions. The<br />
same is true of the South Pacific as well. In general the<br />
fresher upper-layer water masses of the Pacific are<br />
located in the east where river runoff introduces a lot<br />
of fresh water into the upper ocean. To the west the<br />
upper water masses are saltier as shown by the<br />
quasilinear portions of the TS curves corresponding<br />
to the western upper water masses. The Pacific<br />
Equatorial <strong>Water</strong> (PEW) is unique in the Pacific<br />
probably due to well-developed equatorial circulation<br />
system. As seen in Figure 7, the PEW TS properties lie<br />
between the east <strong>and</strong> west central waters.<br />
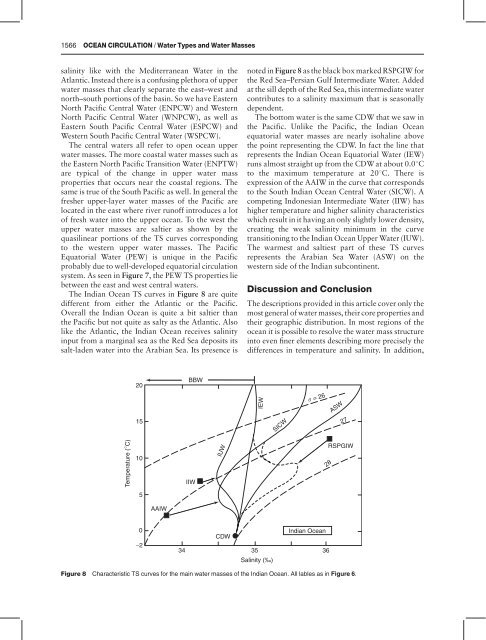
The Indian <strong>Ocean</strong> TS curves in Figure 8 are quite<br />
different from either the Atlantic or the Pacific.<br />
Overall the Indian <strong>Ocean</strong> is quite a bit saltier than<br />
the Pacific but not quite as salty as the Atlantic. Also<br />
like the Atlantic, the Indian <strong>Ocean</strong> receives salinity<br />
input from a marginal sea as the Red Sea deposits its<br />
salt-laden water into the Arabian Sea. Its presence is<br />
noted in Figure 8 as the black box marked RSPGIW for<br />
the Red Sea–Persian Gulf Intermediate <strong>Water</strong>. Added<br />
at the sill depth of the Red Sea, this intermediate water<br />
contributes to a salinity maximum that is seasonally<br />
dependent.<br />
The bottom water is the same CDW that we saw in<br />
the Pacific. Unlike the Pacific, the Indian <strong>Ocean</strong><br />
equatorial water masses are nearly isohaline above<br />
the point representing the CDW. In fact the line that<br />
represents the Indian <strong>Ocean</strong> Equatorial <strong>Water</strong> (IEW)<br />
runs almost straight up from the CDW at about 0.01C<br />
to the maximum temperature at 201C. There is<br />
expression of the AAIW in the curve that corresponds<br />
to the South Indian <strong>Ocean</strong> Central <strong>Water</strong> (SICW). A<br />
competing Indonesian Intermediate <strong>Water</strong> (IIW) has<br />
higher temperature <strong>and</strong> higher salinity characteristics<br />
which result in it having an only slightly lower density,<br />
creating the weak salinity minimum in the curve<br />
transitioning to the Indian <strong>Ocean</strong> Upper <strong>Water</strong> (IUW).<br />
The warmest <strong>and</strong> saltiest part of these TS curves<br />
represents the Arabian Sea <strong>Water</strong> (ASW) on the<br />
western side of the Indian subcontinent.<br />
Discussion <strong>and</strong> Conclusion<br />
The descriptions provided in this article cover only the<br />
most general of water masses, their core properties <strong>and</strong><br />
their geographic distribution. In most regions of the<br />
ocean it is possible to resolve the water mass structure<br />
into even finer elements describing more precisely the<br />
differences in temperature <strong>and</strong> salinity. In addition,<br />
20<br />
BBW<br />
IEW<br />
σ = 26<br />
ASW<br />
15<br />
SICW<br />
27<br />
Temperature (°C)<br />
10<br />
IIW<br />
IUW<br />
RSPGIW<br />
28<br />
5<br />
AAIW<br />
0<br />
−2<br />
Indian <strong>Ocean</strong><br />
CDW<br />
34 35 36<br />
Salinity (‰)<br />
Figure 8 Characteristic TS curves for the main water masses of the Indian <strong>Ocean</strong>. All lables as in Figure 6.


![Chapt 2.5 [PDF]](https://img.yumpu.com/24218624/1/190x146/chapt-25-pdf.jpg?quality=85)