Annual Report year ended 2012.DOC - Rotorua District Council
Annual Report year ended 2012.DOC - Rotorua District Council
Annual Report year ended 2012.DOC - Rotorua District Council

Create successful ePaper yourself
Turn your PDF publications into a flip-book with our unique Google optimized e-Paper software.
<strong>Rotorua</strong> <strong>District</strong> <strong>Council</strong><br />
Te Kaunihera ā rohe o <strong>Rotorua</strong><br />
<strong>Annual</strong> <strong>Report</strong> 2011/2012
THE ROTORUA DISTRICT<br />
Te Rohe o <strong>Rotorua</strong><br />
<strong>Rotorua</strong> <strong>District</strong> lies within the<br />
Bay of Plenty and Waikato<br />
Regional <strong>Council</strong> areas.<br />
According to oral history,<br />
many of <strong>Rotorua</strong>’s Maori<br />
residents trace their ancestry<br />
to Tamatekapua, the captain<br />
of the Arawa canoe that<br />
arrived in New Zealand from<br />
the fabled homeland of<br />
Hawaiki more than six<br />
centuries ago. The Arawa<br />
canoe was beached at<br />
Maketu on the Bay of Plenty<br />
coast where the new arrivals<br />
settled down to live.<br />
They had been at Maketu for<br />
some time when an ancestor called Kahumatamomoe journeyed inland to explore. He discovered what is<br />
now known as Lake <strong>Rotorua</strong>, and settled at what is now Kawaha Point.<br />
The local environment encompasses 16 lakes, active geothermal areas, and a considerable amount of public<br />
open space. Land cover in the district is now dominated by pasture (48%) and planted forest (20%), as well as<br />
indigenous forest and lakes. There are 137 Protected Natural Areas in the district, covering more than 30,620<br />
ha. More than half of this area comprises scenic reserves. <strong>Rotorua</strong> has an increasingly broad industry base<br />
that includes tourism, agriculture, forestry, retail, manufacturing, business services, social services and<br />
education.<br />
<strong>District</strong> Facts<br />
Area: 2,614.9km 2<br />
Dwellings:<br />
Gross Land Valuation:<br />
Gross Capital Valuation:<br />
Local Roads:<br />
Reserves:<br />
Population:<br />
26,823 (2006 Census)<br />
$6.6 billion<br />
$12.5 billion<br />
More than 1,000km - 82% sealed<br />
800ha<br />
65,901 (2006 Census)<br />
33,897 Female<br />
32,004 Male<br />
57% European<br />
34% Maori<br />
4% Pacific Islands<br />
5% Asian and others<br />
Gross Domestic Product:<br />
$2.88 billion per annum
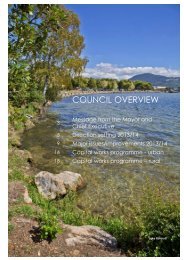
Contents<br />
COUNCIL OVERVIEW<br />
3 MESSAGE FROM THE MAYOR AND THE CHIEF EXECUTIVE<br />
5 OUR PROGRESS AGAINST 2011/2012 ISSUES<br />
12 MAORI INVOLVEMENT IN DECISION MAKING<br />
GOVERNANCE AND MANAGEMENT<br />
YEAR IN REVIEW<br />
15 MAYOR AND COUNCILLORS<br />
16 COMMITTEE STRUCTURE<br />
17 MANAGEMENT<br />
18 COMMUNITY OUTCOMES<br />
21 FINANCIAL SUMMARY<br />
23 ACTIVITIES AT GLANCE<br />
SERVICE PERFORMANCE<br />
23 CORPORATE AND CUSTOMER SERVICES GROUP<br />
39 ECONOMIC AND REGULATORY SERVICES GROUP<br />
77 INFRASTRUCTURE SERVICES GROUP<br />
113 CASTLECORP<br />
COUNCIL CONTROLLED ORGANISATIONS<br />
115 ROTORUA REGIONAL AIRPORT LIMITED<br />
117 ROTORUA DISTRICT COUNCIL HOLDINGS LIMITED<br />
117 GROW ROTORUA LIMITED<br />
118 LOCAL AUTHORITY SHARED SERVICES LIMITED<br />
119 BAY OF PLENTY LOCAL AUTHORITY SHARED SERVICES LIMITED<br />
FINANCIAL STATEMENTS<br />
121 STATEMENT OF COMPLIANCE<br />
121 STATEMENT OF FINANCIAL INVOLVEMENT IN CCTO’s<br />
122 STATEMENT OF COMPREHENSIVE INCOME<br />
123 STATEMENT OF CHANGES IN EQUITY<br />
124 STATEMENT OF FINANCIAL POSITION<br />
125 STATEMENT OF CASH FLOWS<br />
126 NOTES TO THE FINANCIAL STATEMENTS<br />
AUDIT AND SUPPORT<br />
INDEX<br />
177 AUDITORS’ REPORT<br />
180 PARTNERS’ SUPPORT<br />
181 INDEX<br />
Contents<br />
ISSN No. 117-8700<br />
Copies of this <strong>Annual</strong> <strong>Report</strong> are distributed widely amongst community groups such as ratepayer associations, service organisations etc, as<br />
well as being available to view at <strong>Council</strong>’s <strong>District</strong> Library, City Focus, and Civic Centre, Haupapa Street. The <strong>Annual</strong> <strong>Report</strong> can also be<br />
viewed on the internet at www.rdc.govt.nz.<br />
<strong>Rotorua</strong> <strong>District</strong> <strong>Council</strong> ANNUAL REPORT 2011/12<br />
1
Aerial view of <strong>Rotorua</strong>
Message from the mayor and the chief<br />
executive<br />
Message from the mayor and chief executive<br />
<strong>Rotorua</strong> <strong>District</strong> <strong>Council</strong> chief executive, Peter Guerin (left)<br />
and <strong>Rotorua</strong> Mayor, Kevin Winters<br />
Tena koutu katoa<br />
We are pleased to be able to introduce <strong>Rotorua</strong><br />
<strong>District</strong> <strong>Council</strong>’s <strong>Annual</strong> report for the 2011/12<br />
<strong>year</strong>.<br />
The council remains in very good shape having<br />
completed another challenging but successful<br />
<strong>year</strong>. Financial management has proved to be<br />
very sound with tight controls and effective<br />
reporting systems in place, and we have achieved<br />
our targets.<br />
Our Statement of comprehensive income includes<br />
non-cash expenses due to downwards asset<br />
revaluations of $12.2 million which were not<br />
budgeted for.<br />
In line with our commitment to accountability and<br />
transparency, reporting on accounts, targets and<br />
activities for the <strong>year</strong> are set out in this annual<br />
report and have been independently audited by<br />
the Office of the Auditor-General, which has given<br />
the council a clean bill of health.<br />
Maintaining <strong>Rotorua</strong>’s high level of services while<br />
operating within very tight budgets has not been<br />
easy. However despite continuing economic<br />
constraints, we can report that the council has<br />
been substantially successful in achieving the<br />
ambitious programme we committed to for the<br />
2011/12 <strong>year</strong>. Of 144 performance measures<br />
across council activities 113 were achieved in full.<br />
In reaching these outcomes the council again<br />
resisted the temptation to slash services or cut<br />
quality levels but instead tightened belts, worked<br />
smarter and sought additional revenue<br />
opportunities whenever we could.<br />
While it is never possible to “please all of the<br />
people, all of the time” it would appear that our<br />
community is generally satisfied with the services<br />
we provide them. This was evidenced in the NRB<br />
independent survey of residents which showed a<br />
very positive response to most council services,<br />
with many achieving approval ratings of 90% or<br />
higher. Our sewerage system, city appearance<br />
and cleanliness, beautification and landscaping,<br />
water supply, parks and reserves, and rubbish<br />
collection actually hit outstanding approval levels<br />
of between 90% and 97%.<br />
The council welcomed community input into many<br />
plans and proposals while still at draft stage. We<br />
received numerous submissions on a wide variety<br />
of issues and in many cases were able to adjust<br />
proposals to take into account valuable<br />
community feedback. While this engagement with<br />
the community is a resource-intensive component<br />
of our strategic planning functions we regard it as<br />
vital for robust decision making.<br />
We are therefore also pleased to report that in the<br />
NRB residents’ perceptions survey 82% or residents<br />
said they had been able to have an influence on<br />
council decisions to some extent.<br />
While information on the council’s work this <strong>year</strong> is<br />
covered in more detail elsewhere in this report we<br />
also draw your attention to some significant<br />
highlights.<br />
In 2011/12 we maintained a major focus on<br />
improving the water quality of <strong>Rotorua</strong>’s iconic<br />
lakes though our very effective partnership with Te<br />
Arawa Lakes Trust, Bay of Plenty Regional <strong>Council</strong><br />
and the Crown. We are very encouraged by some<br />
<strong>Rotorua</strong> <strong>District</strong> <strong>Council</strong> ANNUAL REPORT 2011/12<br />
3
Message from the mayor and chief executive<br />
of the water quality results coming through in<br />
recent times indicating water quality<br />
advancement in many areas where remediation<br />
programmes have been implemented.<br />
The <strong>Rotorua</strong> community and the council received<br />
widespread plaudits for our role in successfully<br />
hosting three test matches and five international<br />
teams as part of New Zealand’s Rugby World Cup<br />
2011 event. It proved to be a spectacular festive<br />
event attracting many thousands of visitors to our<br />
city and giving a welcome boost to the local<br />
economy.<br />
In 2011/12 we also introduced the international<br />
business efficiency and improvement concept<br />
known as ‘Lean Thinking’ into the operations of the<br />
council. Over time this will transform the way we do<br />
business at RDC providing a greater customer<br />
focus, elimination of waste and efficiency gains<br />
across the organisation. In short it is about doing<br />
things better, faster, easier and at less cost.<br />
Finally we extend our sincere thanks to elected<br />
members for their continuing hard work and<br />
dedication to their council governance and<br />
community leadership roles, and to staff for their<br />
ongoing professionalism and commitment.<br />
<strong>Rotorua</strong>’s community is clearly very well served by<br />
the people at RDC. We also acknowledge the<br />
tireless support provided by Mayoress Sue Winters<br />
throughout the <strong>year</strong>. Thank you all.<br />
Ma te mahi tahi ka tutuki – working together we will<br />
succeed.<br />
<strong>Rotorua</strong> mayor Kevin Winters shows off a miniature<br />
replica of the Webb Ellis Cup presented to the city. Mr<br />
Winters is pictured with Harry van der Merwe, ANZ<br />
Business Development Manager (left) and Crispian<br />
Stewart, Operations Manager-International Stadium<br />
Photo courtesy Daily Post<br />
Economic growth remains another focus of the<br />
council and during the <strong>year</strong>, in partnership with<br />
local business and iwi leaders, we finalised the<br />
ground-breaking <strong>Rotorua</strong> Sustainable Economic<br />
Growth Strategy which is to be driven by a new<br />
CCO (council controlled organisation), Grow<br />
<strong>Rotorua</strong> Ltd.<br />
Facilities for our young citizens were also<br />
enhanced in 2011/12 with the completion of<br />
award winning Youth Spaces in Wrigley Road and<br />
Park Road for suburban communities.<br />
Our draft <strong>District</strong> Plan received excellent feedback<br />
from stakeholders and we held back notification to<br />
allow full processing of all the valuable comments<br />
made in submissions during the consultation phase.<br />
Notification is now scheduled to be undertaken<br />
during 2012/13.<br />
<strong>Council</strong> held a by-election on 17 November 2011<br />
to replace former councillor Geoff Kenny. Six<br />
candidates were confirmed with Merepeka<br />
Raukawa-Tait being successful.<br />
Development of our 2012-2022 Long-term Plan was<br />
another major project completed during the <strong>year</strong>.<br />
This key document sets our organisation’s strategic<br />
direction for the next 10 <strong>year</strong>s and focuses on the<br />
three key themes of economic prosperity,<br />
environmental improvement and continuous<br />
business improvement.<br />
Kevin Winters JP<br />
Mayor<br />
Peter Guerin<br />
Chief Executive<br />
4<br />
<strong>Rotorua</strong> <strong>District</strong> <strong>Council</strong> ANNUAL REPORT 2011/12
Our progress against 2011/2012 issues<br />
As is the nature of local government, planning for<br />
the Long-term Plan 2012-2022 was underway<br />
virtually before the ink was dry on the adopted<br />
2011/12 <strong>Annual</strong> Plan. The Long-term Plan provided<br />
the opportunity to test and redefine the direction<br />
of council, addressing major issues identified for<br />
the 2011/12 <strong>year</strong>.<br />
Progression through the <strong>year</strong> ending 30 June 2012,<br />
including project development and confirmation<br />
of the council’s future direction is updated in the<br />
following commentary.<br />
Fresh vision for the district<br />
The vision statement for the district is now well<br />
integrated into the <strong>Rotorua</strong> Sustainable Economic<br />
Growth Strategy developed in partnership with<br />
local business and other community leaders. The<br />
vision statement is:<br />
ROTORUA: Living the dream<br />
- world class in every way!<br />
The key elements of the vision statement are:<br />
Living the dream - promotes lifestyle, prosperity,<br />
sustainability and vibrancy. This element<br />
encompasses a wide variety of ideas in a<br />
concise statement, describing aspirations for an<br />
ideal community, environment, economy and<br />
infrastructure.<br />
World Class - sets a benchmark for businesses<br />
and organisations to strive for. It builds on<br />
<strong>Rotorua</strong>’s reputation for world class sectors such<br />
as tourism, geothermal, and forestry and wood<br />
processing, and challenges stakeholders to set<br />
similar standards.<br />
Organisational structure<br />
2011/12 was the first full financial <strong>year</strong> under a<br />
reorganised council management structure<br />
encompassing three key operational groups:<br />
Corporate and Customer Services Group,<br />
Economic and Regulatory Services Group and<br />
Infrastructure Services Group. The council is<br />
placing greater emphasis on growing and<br />
strengthening local economic opportunities and<br />
the realignment of some council activities is<br />
expected to help achieve this focus.<br />
2012 National Research Bureau Communitrak<br />
Survey<br />
Activity<br />
Appearance<br />
and<br />
cleanliness<br />
of CBD<br />
Parking in<br />
<strong>Rotorua</strong> city<br />
Very/fairly<br />
satisfied<br />
(<strong>Rotorua</strong>)<br />
<strong>Council</strong><br />
peer group<br />
average<br />
National<br />
average<br />
97% 78% 79%<br />
70% 68% 66%<br />
Dog control 77% 76% 77%<br />
Noise control 83% 75% 77%<br />
Museum 84% 63% 68%<br />
Events<br />
promotion<br />
Marketing of<br />
<strong>Rotorua</strong> as a<br />
place to visit<br />
Marketing of<br />
<strong>Rotorua</strong> as a<br />
place to<br />
live, work<br />
and invest<br />
86% 63% 68%<br />
89% 63% 68%<br />
67%<br />
(Highest ever<br />
and the<br />
largest<br />
increase in<br />
satisfaction)<br />
63% 67%<br />
April 2012 - NRB Public Perceptions of <strong>Council</strong> Services &<br />
Representation<br />
<strong>Rotorua</strong> Sustainable Economic Growth<br />
Strategy<br />
To focus on driving our economy upwards, a<br />
strategic direction and set of objectives have<br />
come together in the <strong>Rotorua</strong> Sustainable<br />
Economic Growth Strategy. Adopted in<br />
September 2011 the strategy has the very clear<br />
aim for <strong>Rotorua</strong> of:<br />
• Lifting the district’s reputation as a leader in the<br />
forestry and wood processing, tourism,<br />
geothermal and agricultural sectors;<br />
• Being recognised as a preferred lifestyle<br />
destination;<br />
• Being an attractive and easy place to invest<br />
and do business in; and<br />
• Being a district with an enabling regulatory<br />
environment<br />
This direction is designed to contribute to<br />
realisation of the district vision of ‘ROTORUA: Living<br />
the dream – world class in every way.’<br />
Our progress against 2011/2012 issues<br />
The Economic and Regulatory Services Group was<br />
developed to strengthen and support those<br />
activities that being focused on to drive <strong>Rotorua</strong>’s<br />
economic recovery. Latest NRB survey results show<br />
activities of the Economic and Regulatory Services<br />
Group received their highest ratings in the past<br />
three <strong>year</strong>s. All results are all above their national<br />
and peer group council comparison and in many<br />
cases substantially ahead:<br />
<strong>Rotorua</strong> <strong>District</strong> <strong>Council</strong> ANNUAL REPORT 2011/12<br />
5
Our progress against 2011/2012 issues<br />
<strong>Rotorua</strong> Tourism Committee and strategy<br />
The Tourism Committee is a formally appointed<br />
committee of <strong>Council</strong> that Destination <strong>Rotorua</strong><br />
Marketing (DRM) reports to on a six-weekly basis.<br />
The committee and DRM are tasked with<br />
promoting innovation and fresh strategic thinking<br />
to assist <strong>Rotorua</strong> in retaining and building on its<br />
position as New Zealand's first and premiere<br />
tourism destination. Key areas of focus include<br />
changing tourism trends, strengthening the local<br />
market and brand positioning of the destination.<br />
While the past few <strong>year</strong>s have been difficult in<br />
tourism as a result of natural disasters, continuing<br />
uncertainty in global financial markets and<br />
noticeable declines in traditional markets of<br />
Europe, United Kingdom and the US, the <strong>Rotorua</strong><br />
industry has remained resilient overall. The <strong>year</strong> has<br />
seen some strong domestic numbers return, which<br />
is pleasing given the visitation displacement during<br />
the 2011 Rugby World Cup and an unseasonably<br />
wet summer period. New investment and product<br />
has also come into the market, including Rainbow<br />
Springs’ ‘Big Splash’ and live bird shows, Rail<br />
Cruising, <strong>Rotorua</strong> Canopy Tours and Treetops Day<br />
Spa.<br />
<strong>Rotorua</strong> Tourism Committee members are:<br />
• Tony Marks (Chairman)<br />
• Maureen Waaka - <strong>Council</strong>lor<br />
• Bruce Thomasen – General Manager, Skyline<br />
<strong>Rotorua</strong><br />
• Kiri Atkinson-Crean – General Manager - Sales<br />
and Marketing, Te Puia<br />
• Brett Marvelly – owner Princes Gate Hotel<br />
<strong>Rotorua</strong><br />
• Fiona Suurenbroek – Chairperson, <strong>Rotorua</strong><br />
Association of Motels and owner/operator of<br />
local motel Cedarwood Lakeside Holiday<br />
Resort.<br />
• Tim Cossar – Chief Executive, Maori Cultural<br />
Centre Te Puia<br />
Destination marketing plan<br />
During the <strong>year</strong> a revised strategic direction was<br />
set by the <strong>Rotorua</strong> Tourism Committee to best<br />
reflect a three-<strong>year</strong> focus. The strategic priorities<br />
are reflected in the points below:<br />
1 Increase the Auckland visitor market by 5%<br />
(50,000) visitor nights<br />
2 Increase average room nights and spend, to at<br />
least equal the national average for domestic<br />
and international<br />
3 Increase <strong>Rotorua</strong>’s share of Australian visitor<br />
arrivals to NZ<br />
4 Aggressively target and grow the Asian visitor<br />
market – specifically China<br />
5 Take a leadership position in online marketing<br />
and travel search<br />
6 Create value, and work in partnership with<br />
<strong>Rotorua</strong> region operators<br />
7 Increase ease of access to <strong>Rotorua</strong> as a visitor<br />
destination.<br />
The strategy is supported by an annual business<br />
plan. The plan has been adopted aligning with<br />
investment being made by DRM in the strategy<br />
and the council’s Long-term Plan 2012-2022.<br />
Grow <strong>Rotorua</strong> Ltd - new council<br />
controlled organisation<br />
In November 2011 council agreed to consider<br />
establishment of a council controlled organisation<br />
(CCO) as the preferred structure to drive<br />
implementation of the <strong>Rotorua</strong> Sustainable<br />
Economic Growth Strategy. The CCO operating as<br />
Grow <strong>Rotorua</strong> Ltd is 100% owned by <strong>Rotorua</strong><br />
<strong>District</strong> <strong>Council</strong>. In the development and adoption<br />
of the Long-term Plan 2012-2022 <strong>Council</strong> has<br />
allocated a budget of $850,000 in the 2012/13 <strong>year</strong><br />
to fund the establishment and operation of the<br />
CCO. Grow <strong>Rotorua</strong> Ltd will have an independent<br />
skills-based board of six members plus a<br />
chairperson, and will employ its own CEO and<br />
staff.<br />
As at 30 June 2012 the CCO was not operational.<br />
Lean Thinking<br />
<strong>Rotorua</strong> <strong>District</strong> <strong>Council</strong> is<br />
implementing a bold programme<br />
aimed at increased efficiencies and<br />
continuous improvement based on<br />
the successful international business<br />
concept known as ‘Lean Thinking.’<br />
RDC started integrating Lean Thinking is into the<br />
organisation’s operations in 2011. In the short time<br />
this has been in place teams and individuals across<br />
the organisation have already developed new<br />
skills, improved a number of systems and<br />
processes, and brought better performance to<br />
several council activities.<br />
Under Lean Thinking, staff members are<br />
encouraged to bring more flexibility to their work,<br />
to be innovative, and to find creative solutions to<br />
problems, so the expectations of customers are<br />
better met. In simple terms it is about doing things<br />
better, faster, easier, and at less cost.<br />
The core objective is to lift service standards for<br />
customers while minimising waste. Lean Thinking<br />
means the creation of more value for the council's<br />
customers while using fewer resources. As a Lean<br />
Thinking organisation we understand customer<br />
expectations and we focus on key processes that<br />
continuously increase value for those customers.<br />
The following characteristics are integral to RDC's<br />
Lean Thinking approach:<br />
• We take a customer service perspective by<br />
seeking to optimise value for the general<br />
public, the regulated community, and other<br />
community stakeholders;<br />
• We involve employees and external<br />
stakeholders in ongoing improvement and<br />
problem-solving activities;<br />
6<br />
<strong>Rotorua</strong> <strong>District</strong> <strong>Council</strong> ANNUAL REPORT 2011/12
• We deploy a continuous improvement<br />
framework that emphasises rapid<br />
implementation rather than prolonged<br />
planning;<br />
• We aim to reduce the complexity of processes<br />
and variation in process outputs;<br />
• We use performance metrics and visual controls<br />
to provide rapid communication and feedback<br />
in order to improve real-time decision-making<br />
and problem-solving.<br />
Airport development funding<br />
In the 2011/12 annual plan, council acknowledged<br />
that the impact of a combination of challenges to<br />
the airport’s business and planning environment<br />
over <strong>year</strong>s meant some rates funding had become<br />
necessary. An amount of $4 million from general<br />
rates was therefore included in airport<br />
infrastructure activity last <strong>year</strong>. In developing the<br />
Long-term Plan council determined that it was<br />
prudent for rates-sourced funding to continue<br />
beyond the 2011/12 <strong>year</strong>. Therefore $4 million has<br />
been allocated in each <strong>year</strong> of the Long-term Plan<br />
2012-2022.<br />
The airport needs to be considered the way other<br />
council infrastructural assets are considered. Like<br />
those assets it is community-owned, providing<br />
numerous benefits to residents and is of significant<br />
strategic importance to the district’s economic<br />
future.<br />
company and Air New Zealand promoting the<br />
Central North Island as a short stay holiday region<br />
for Australian visitors. The recent announcement<br />
that Virgin Australia will cease trans-Tasman flights<br />
from Hamilton to Brisbane also provides added<br />
potential.<br />
During the <strong>year</strong> Air NZ also announced that it will<br />
recommence its daily jet services to Queenstown<br />
via Christchurch towards the end of 2012.<br />
Parking changes<br />
The 2011/12 <strong>year</strong> saw implementation of a new<br />
public parking policy, approved by council in<br />
September 2010. The policy is relatively straight<br />
forward. The effect is to manage demand better<br />
and to favour short-term occupation of parking<br />
spaces in high demand retail areas, ie favour retail<br />
and business customer parking over all day<br />
workers’ parking.<br />
The public parking policy has enabled the council<br />
to promptly make changes where targets were not<br />
being reached, for example Hinemoa, Haupapa<br />
and Eruera streets. <strong>Council</strong> continues to monitor<br />
occupancy of CBD parking spaces to ensure<br />
turnover of spaces is providing adequate parking<br />
availability for businesses and retail customers.<br />
Our progress against 2011/2012 issues<br />
Providing an airport comes at significant cost to<br />
ratepayers …<br />
but failure to provide an airport comes at an even<br />
greater cost -<br />
to our community and to our future potential.<br />
Joint Venture marketing for trans-Tasman<br />
air services<br />
<strong>Rotorua</strong>’s trans-Tasman flights to Sydney continue<br />
to gain traction with Australian visitors and locals<br />
alike. Launched in December 2009 with two return<br />
flights a week, Air New Zealand will increase this<br />
schedule to three return flights a week during the<br />
peak summer period. This is a significant<br />
development for both <strong>Rotorua</strong> International Airport<br />
and the local community. The additional flight<br />
schedule is a result of the joint marketing efforts of<br />
Destination <strong>Rotorua</strong> Marketing, the airport<br />
A target set at ensuring 15% average parking<br />
availability (1 in 7 spaces available between 10am<br />
and 3pm) was achieved throughout the <strong>year</strong>.<br />
Alongside this, a 70% satisfaction rate with parking<br />
in the CBD was recorded. Pricing is the only<br />
control and this continues to be developed by the<br />
<strong>Council</strong>. Pricing reviews are undertaken annually<br />
in areas where it is considered the occupancy<br />
levels are not being met. <strong>Council</strong> continues to roll<br />
out more ‘pay and display’ units replacing the<br />
traditional ‘lollipop’ parking meters as they<br />
become damaged or reach the end of their<br />
working life.<br />
<strong>Rotorua</strong> <strong>District</strong> <strong>Council</strong> ANNUAL REPORT 2011/12<br />
7
Our progress against 2011/2012 issues<br />
CBD revitalisation - Urban Design<br />
Framework<br />
As part of the CBD revitalisation project an Urban<br />
Design Framework was developed in 2010. The<br />
framework has been useful for prompting<br />
discussion about the future form and development<br />
of the CBD and to traverse some of the problems<br />
currently being experienced with high levels of<br />
shop and upper floor vacancies, and continued<br />
business ‘drift’ out of the CBD.<br />
As part of the Urban Design Framework<br />
Implementation Strategy several projects have<br />
been initiated including;<br />
Eat Streat design project - Work with APR Architects<br />
is well underway on the future design of Eat Streat.<br />
A project reference group, including staff from<br />
across council departments, building owners and<br />
business owners has been meeting to oversee<br />
progress and provide feedback to the architects.<br />
National Cycleway - significant progress was<br />
made on our part of the National Cycleway, ‘Te<br />
Ara Ahi - go thermal by bike.’ At the end of the<br />
financial <strong>year</strong> significant work had been<br />
completed along State Highway 5 with a concrete<br />
surface leading out from the southern side of<br />
Hemo Gorge to Highlands Loop Road.<br />
Other sections were well underway with Te Ara Ahi<br />
expected to be fully open by October 2012. The<br />
trail will officially start from the Princes Gate at<br />
Government Gardens and will be a two day, 74km<br />
cycle trail from <strong>Rotorua</strong> to the Orakei Korako<br />
thermal area on the Waikato River.<br />
CBD free public wifi - Investigations have been<br />
underway to examine opportunities and options<br />
for providing a CBD-wide free public WiFi service to<br />
enhance our destination for visitors, and provide<br />
additional tools for RDC to communicate with<br />
local residents.<br />
Walkable city project - In a bid to influence the<br />
way visitors use the city centre and make it more<br />
walkable, a series of new colour-coded walking<br />
routes has been developed. When completed,<br />
highly visible signboards will be placed at strategic<br />
spots around the city centre and environs to<br />
encourage visitors to explore the CBD as a<br />
combination shopping, walking and discovery<br />
option. Colourful, double-sided and lit from within,<br />
the large 2.4m high perspex signs will glow softly,<br />
providing a directional beacon both day and<br />
night.<br />
A total of 17 information signboards will be erected<br />
during 2012/13.<br />
<strong>Rotorua</strong> Museum development<br />
September 2, 2011, marked the official opening of the completed <strong>Rotorua</strong> Museum Centennial Project. The<br />
third and final stage, the Don Stafford Wing was opened by patron Dame Catherine Tizard.<br />
An intensive fundraising campaign resulted in more than 75% of the $22 million dollar project coming from<br />
external funding sources.<br />
Completed <strong>Rotorua</strong> Museum viewed from the Civic Centre<br />
The Don Stafford Wing features a permanent Museum exhibition on the ground floor, called Nga Pumanawa o<br />
Te Arawa – the Beating Hearts of Te Arawa. Spanning eight galleries, this major exhibition follows the journey of<br />
Te Arawa people from their origins in Hawaiiki to their descendants today. Upstairs are two new art galleries<br />
hosting a range of regularly changing exhibitions.<br />
Admission remains free for <strong>Rotorua</strong> residents.<br />
8<br />
<strong>Rotorua</strong> <strong>District</strong> <strong>Council</strong> ANNUAL REPORT 2011/12
<strong>District</strong> Plan<br />
During the 2011/12 financial <strong>year</strong> the council<br />
undertook a pre-draft consultation process which<br />
achieved exceptional engagement with the<br />
community. As a result, council decided to delay<br />
notification timing for the <strong>District</strong> Plan to provide<br />
the opportunity for inclusion of identified changes.<br />
The Proposed <strong>District</strong> Plan will now be notified early<br />
in the 2012/13 financial <strong>year</strong>.<br />
Lakefront development plan<br />
During the <strong>year</strong> discussions have continued with<br />
land owners and operators to ensure that the most<br />
appropriate development for the lakefront can<br />
proceed.<br />
Pin Oak tree replacements near Civic<br />
Centre<br />
The council has replaced six large Pin Oak trees<br />
growing on Hinemaru Street, adjacent to the<br />
council Civic Centre and near Government<br />
Gardens. The trees had become larger than was<br />
predicted when first planted and were adversely<br />
affecting existing more valuable tree specimens in<br />
Government Gardens. The Pin Oaks are being<br />
progressively replaced with Maples and underplanted<br />
with Azaleas that will grow to about 10 to<br />
12 metres in height (rather than the 23 metre<br />
height and 20 metre width that the Pin Oaks<br />
reach). The further removal of the remaining nine<br />
Pin Oaks was scheduled to be undertaken in the<br />
first quarter of the 2012/13 <strong>year</strong>.<br />
Debt over ten <strong>year</strong> period<br />
<strong>Council</strong> keeps a very close eye on its level of debt,<br />
particularly the level of debt in ten <strong>year</strong>s time. This<br />
is to ensure that debt levels are always managed<br />
within council’s prudent debt management policy<br />
and so there is ‘head room’ in the final <strong>year</strong>s of a<br />
long-term plan so future generations can use that<br />
capacity for their aspirations. During the 2011/12<br />
<strong>year</strong> council reviewed its Treasury Policy. Treasury<br />
Policy targets ensure borrowing limits are realistic in<br />
the forecast financial climate.<br />
RDC debt at 30 June 2012 is $151 million. Using<br />
forecasting undertaken in 2011/12 for the Longterm<br />
Plan preparation, debt is now expected to<br />
peak at $208 million in the 2017/18 <strong>year</strong> and will<br />
progressively reduce down to $183 million by the<br />
end of the Long-term Plan 2012-2022.<br />
Asset revaluations<br />
Our Statement of comprehensive income includes<br />
non-cash expenses due to downwards asset<br />
revaluations of $12.2 million which were not<br />
budgeted for.<br />
Development Contributions Policy<br />
The Development Contributions Policy was<br />
reviewed again in this financial <strong>year</strong> as<br />
preparations were made for development of the<br />
Long-term Plan 2012-2022. The revised policy was<br />
adopted by council on 29 June 2012 at the same<br />
time as the Long-term Plan was adopted.<br />
Our progress against 2011/2012 issues<br />
Visualisation of Hinemaru Street with mature street trees<br />
following replacement of Pin Oaks (looking north)<br />
Visualisation of Hinemaru Street with mature street trees<br />
following replacement of pin Oaks (looking south)<br />
During the 2011/12 <strong>year</strong> a CBD incentive scheme<br />
was introduced along with the development and<br />
implementation of a development contributions<br />
management module within council’s financial<br />
management system.<br />
Removing rubbish bins from reserves<br />
A two <strong>year</strong> litter bin-free trial was started on the 1st<br />
March 2011. The first <strong>year</strong> of the trial has consisted<br />
of inspections of the litter found at the nominated<br />
reserves. This has been completed by Castlecorp<br />
as part of their routine litter run operations. The<br />
findings from this investigation are still being<br />
analysed. Once this has been completed then a<br />
trail period in which bins will be removed will be<br />
started. Before and after rubbish bin removal<br />
comparisons will then be made and reported back<br />
to council.<br />
The nominated reserves are:<br />
• Centennial Park, Tihiotonga Domain (Tree Trust)<br />
• Murray Linton Park<br />
• Pullar Park (West)<br />
• Elliott Park<br />
• Ray Boord Park<br />
• Sheaf Park<br />
• Warwick Drive Reserve<br />
• Lake Okaro Reserve<br />
<strong>Rotorua</strong> <strong>District</strong> <strong>Council</strong> ANNUAL REPORT 2011/12<br />
9
Our progress against 2011/2012 issues<br />
Rugby World Cup<br />
Rugby World Cup fever came to <strong>Rotorua</strong> in 2011<br />
when the district hosted three games and five<br />
international teams in the biggest sporting event<br />
ever hosted in New Zealand.<br />
10 September Fiji V Namibia<br />
(attendance 11,000)<br />
14 September Tonga V Namibia<br />
(attendance 13,000)<br />
25 September Ireland V Russia<br />
(attendance 26,000)<br />
Birds eye view of <strong>Rotorua</strong> International Stadium, hosts of the Rugby World Cup 2011<br />
Asset renewals in the asset management plan allowed <strong>Rotorua</strong> International Stadium to be presented in<br />
superb condition for Rugby World Cup 2011. Works included new floor coverings within the grandstand,<br />
resealing and improved field access, and the widely-acclaimed repainting of the terrace seating area as the<br />
Pink and White Terraces. In addition some stadium infrastructure supplied by Rugby World Cup has been<br />
retained for our future use.<br />
In addition <strong>Rotorua</strong> had the opportunity to host all five of visiting teams for various periods during the<br />
tournament adding to the colour and excitement of the World Cup event.<br />
Local residents’ interest was highlighted by the attendance of more than 18,000 visitors to the 11 big screen<br />
Fan Zones successfully staged at the Energy Events Centre and the <strong>Rotorua</strong> Convention Centre. The city was<br />
appropriately decorated to celebrate hosting the Rugby World Cup and numerous activities and events<br />
promoted interest in the Cup and successfully met visitors’ expectations.<br />
Rugby World Cup 2011 Fanzones, hosted at the Energy Events Centre<br />
for families and friends to enjoy the games<br />
With a concentration of games in the North Island, <strong>Rotorua</strong> also benefitted from visits by supporter groups from<br />
various nations as they moved from game to game, optimising <strong>Rotorua</strong>’s economic impact from New<br />
Zealand’s hosting of this very special event.<br />
10<br />
<strong>Rotorua</strong> <strong>District</strong> <strong>Council</strong> ANNUAL REPORT 2011/12
Sewerage schemes<br />
Hamurana/Awahou sewerage scheme<br />
The funding policy for this scheme has been<br />
adopted and it includes the option of making a<br />
lump sum contribution of $10,154.10 (plus GST). It is<br />
estimated that the targeted rate (over 25 <strong>year</strong>s) for<br />
being connected to the scheme would be $805.53<br />
(excluding GST) per annum. Central government<br />
continues to provide up to 50% subsidy towards the<br />
cost of sewerage schemes at four priority lakes.<br />
This community also receives a contribution to the<br />
sewerage scheme of nearly $1.5 million from the<br />
Bay of Plenty Regional <strong>Council</strong> and $1.02 million<br />
from the <strong>Rotorua</strong> <strong>District</strong> <strong>Council</strong>.<br />
With external funding from Government and<br />
Regional <strong>Council</strong>, and subsidy from the <strong>District</strong><br />
<strong>Council</strong>, the cost of connecting all properties in the<br />
defined area to the council’s waste water<br />
treatment plant is considerably less than individual<br />
property owners would incur if installing complying<br />
septic tanks.<br />
Okere Falls / Otaramarae / Whangamarino<br />
sewerage scheme<br />
This scheme was completed in August 2011, ahead<br />
of the programmed completion date of<br />
September 2011. The final adopted funding policy<br />
for this scheme included the option of making a<br />
lump sum contribution of $4,981.15 (plus GST).<br />
Under a targeted rate option covering a 25 <strong>year</strong><br />
period the cost for those being connected to the<br />
scheme is $423.37 (plus GST) per annum.<br />
Central Government continues to provide up to<br />
50% subsidy towards the cost of this sewerage<br />
schemes. The community also receives a<br />
contribution to the Okere / Otaramarae /<br />
Whangamarino sewerage scheme of nearly $1.75<br />
million from the Bay of Plenty Regional <strong>Council</strong> and<br />
$0.61 million from the <strong>Rotorua</strong> <strong>District</strong> <strong>Council</strong>.<br />
With external funding from Government and<br />
Regional <strong>Council</strong>, and subsidy from the <strong>District</strong><br />
<strong>Council</strong> the cost of connecting all properties in the<br />
defined area to the council’s waste water<br />
treatment plant is also considerably less than<br />
individual property owners would incur if installing<br />
complying septic tanks.<br />
These projects continue this council’s commitment<br />
to improving the water quality of <strong>Rotorua</strong>’s iconic<br />
lakes.<br />
Changes to rates framework<br />
<strong>Rotorua</strong> <strong>District</strong> <strong>Council</strong> increased its overall rates<br />
requirements (from all rating sources) by 3.1% in the<br />
2011/12 <strong>year</strong>, well under inflation forecasts at 4% to<br />
5%. The increase followed sub-inflation increases<br />
of just 1.9% and 1% in the two previous two <strong>year</strong>s -<br />
significantly lower than most councils in New<br />
Zealand over this period.<br />
system. This was prompted by major shifts in official<br />
property valuations across the district which<br />
resulted in distortions to the rating framework.<br />
A summary of the valuation movements for each<br />
category of property for 2011 since 2008 is set out<br />
below:<br />
Property<br />
category<br />
Capital value<br />
change<br />
(2008-2011)<br />
Land value<br />
change<br />
(2008-2011)<br />
Residential -8% -6%<br />
Commercial -14% -14%<br />
Industrial -5% -9%<br />
Lifestyle -6% -9%<br />
Dairy Farms -32% -38%<br />
Pastoral Farms -37% -38%<br />
In examining options the council endeavoured to<br />
ensure the rating framework remains stable<br />
enough to minimise the need for adjustments<br />
every three <strong>year</strong>s, to compensate for the impact<br />
of fluctuating valuations.<br />
<strong>Council</strong> has made the following changes to its<br />
rating framework which came into effect from<br />
1 July 2012.<br />
• Change from a land value to capital value<br />
system.<br />
• Remove all general rate differentials, with<br />
exceptions being to apply an:<br />
85% differential to Rural Residential<br />
properties.<br />
220% differential to business properties.<br />
NOTE: exceptions are envisaged to be<br />
temporary to assist with transition in the longer<br />
term to an undifferentiated rating system.<br />
• Merge targeted rates for Roading, and<br />
Stormwater & Drainage, back into the general<br />
rate.<br />
• Change the way the Business and Economic<br />
Development Targeted Rate is allocated across<br />
the three targeted sectors to 80% business, 10%<br />
industrial, 10% farming.<br />
• Replace the Business and Economic<br />
Development variable targeted rate from the<br />
home-based short term accommodation (B&B)<br />
sector with a stepped fixed charge based on<br />
the number of rooms let.<br />
• Remove rating apportionments (parts) for those<br />
properties where the minor part has not been<br />
created for the purposes of assessing rates for a<br />
higher rated use, eg motels, with a minor<br />
residential part.<br />
• Clarified that holiday homes will be rated as<br />
residential so long as not let for more than 100<br />
days per annum. Beyond this will be considered<br />
to be principally business use.<br />
• Merge all rural water supplies with the urban<br />
supply in a single targeted rate (excluding the<br />
two predominantly farm supplies of Kaharoa<br />
and Reporoa).<br />
Our progress against 2011/2012 issues<br />
While developing the Long-term Plan 2012-2022,<br />
council made the decision to change the rating<br />
<strong>Rotorua</strong> <strong>District</strong> <strong>Council</strong> ANNUAL REPORT 2011/12<br />
11
Maori participation in decision making<br />
Maori participation in decision making<br />
Introduction<br />
<strong>Council</strong> has a long standing history of working<br />
closely with Te Arawa and its hapū as the<br />
Confederated Iwi of <strong>Rotorua</strong> district. A number of<br />
mechanisms have been developed for<br />
consultation, engagement and communication<br />
purposes, and to involve Maori of the district in<br />
council decision-making processes. They will<br />
continue to be developed and reviewed to ensure<br />
their effectiveness.<br />
These mechanisms provide a broad range of<br />
services on matters to do with Te Arawa, to ensure<br />
Te Arawa are able to participate in decisionmaking<br />
processes. The LGA has a number of<br />
references to Maori and the Treaty of Waitangi<br />
(Section 4 Part 1), Parts 2, 6 and schedule 10 clause<br />
5 and Schedule 11.<br />
Te Pukenga Koeke o te Whare Taonga o<br />
Te Arawa<br />
Te Arawa Kaumatua contribute to decisionmaking<br />
processes pertaining to care and<br />
protection of Te Arawa taonga within the <strong>Rotorua</strong><br />
Museum. The committee met periodically during<br />
the <strong>year</strong> to give guidance on the management of<br />
Te Arawa taonga.<br />
Te Pukenga Koeke have been working steadily<br />
towards the goals of repatriating Te Arawa taonga<br />
from other Museums. To date a number of<br />
repatriations from the Auckland Museum have<br />
been successful. These taonga feature<br />
predominately in the Don Stafford Wing of the<br />
Museum opened to the public on 2 September<br />
2011. They were also involved in the relocation of<br />
Pukaki from the Civic Centre to <strong>Rotorua</strong> Museum.<br />
The Resource Management Act (RMA) 1991 and<br />
the LGA 2002 are both specific in how local<br />
authorities must consult and include Maori and<br />
tangata whenua in decision making processes.<br />
The following Maori groups within council provide<br />
opportunities for greater involvement by Maori in<br />
council’s decision-making processes.<br />
Te Arawa Standing Committee (TASC)<br />
In 1989 Te Arawa mooted the formation of a Maori<br />
advisory committee to meet the requirements of a<br />
number of statutes that were in the making at the<br />
time.<br />
In January 1993 council resolved to adopt a<br />
strategy to visit marae in the district to ascertain<br />
the wishes of the Maori community, with respect to<br />
an appropriate structure to give tangata whenua<br />
the ability to contribute to the decisions of <strong>Council</strong><br />
on issues affecting tangata whenua.<br />
In July 2007 at a Te Arawa hui-a-iwi at Te Papaiouru<br />
Marae, Ohinemutu, a recommendation was made<br />
that the Te Arawa Standing Committee be<br />
reviewed and that the review include<br />
representation and election model, functions, roles<br />
and accountabilities of the committee.<br />
Following the review six representatives were<br />
elected to the Te Arawa committee on 29 May<br />
2010 at Te Papaiouru Marae. The elections process<br />
was supported by Te Arawa Lakes Trust, Te<br />
Kotahitanga o Te Arawa Fisheries and Te<br />
Pumautanga o Te Arawa. Information about<br />
elected Te Arawa Standing committee members is<br />
on <strong>Rotorua</strong> <strong>District</strong> <strong>Council</strong>’s website.<br />
Ngati Whakaue Gifted Reserves Protocol<br />
This is an agreement between the <strong>Rotorua</strong> <strong>District</strong><br />
<strong>Council</strong> and Pukeroa Oruawhata Trust on behalf of<br />
the original owners of the Pukeroa Oruawhata<br />
Block (known as the City of <strong>Rotorua</strong>) and their<br />
descendants. <strong>Council</strong> gives effect to the protocol<br />
through consultation when there is a significant or<br />
important decision to change status of any<br />
affected reserve.<br />
Iwi Consultative Group<br />
The Iwi Consultative Group holds two to three<br />
weekly meetings to assess resource consent<br />
applications and advise council on section 6(e) of<br />
the Resource Management Act 1991, and to<br />
provide relevant tangata whenua contacts for<br />
consent matters.<br />
Kauae Cemetery Committee<br />
Kauae Cemetery Committee trustees meet twice<br />
a <strong>year</strong> to work through operations, policies and<br />
procedures, including provisions for the burial of<br />
descendants of Ngati Whakaue and the general<br />
public. The Kauae Cemetery Committee consists<br />
of members from council and Ngati Whakaue.<br />
They are appointed by the Maori Land Court.<br />
Pukaki ki <strong>Rotorua</strong> Charitable Trust<br />
The Trust meets to ensure the safe-keeping,<br />
conservation and maintenance of Pukaki. In 2011<br />
Pukaki was moved to Te Whare Taonga o Te<br />
Arawa – <strong>Rotorua</strong> Museum.<br />
12<br />
<strong>Rotorua</strong> <strong>District</strong> <strong>Council</strong> ANNUAL REPORT 2011/12
Waka Taua Trust<br />
The main function of this trust is to ensure that Te<br />
Arawa Waka Taua and the shelter that houses the<br />
waka are both well maintained. The trust is<br />
administered by the Te Arawa Lakes Trust. The<br />
members of the trust are representatives of Te<br />
Arawa and the <strong>Rotorua</strong> <strong>District</strong> <strong>Council</strong>.<br />
<strong>Council</strong>’s Kaupapa Māori Department<br />
This department maintains council relationships<br />
with Tangata Whenua and Maori as well as<br />
strengthening the organisation’s ability to<br />
effectively engage with Maori through training in<br />
tikanga and te reo. The department provides<br />
whanau, hapu, iwi and marae contacts and<br />
consultation advice to various council<br />
departments. The department has also produced<br />
resources such as ‘Whare Korero’, a pocket<br />
booklet for staff, councillors and the public. The<br />
booklet is a guide to Maori protocol, rituals and<br />
basic Maori language and pronunciation. The aim<br />
of the booklet is to provide an easy-to-use guide<br />
for Maori rituals, structures (marae) practices and<br />
language that council and members of the public<br />
may encounter in <strong>Rotorua</strong>. The Kaupapa Maori<br />
department is involved in various projects<br />
including, MOU development with various Te<br />
Arawa iwi; <strong>District</strong> Plan Review, central business<br />
district revitalisation, <strong>Rotorua</strong> Eastern Arterial route,<br />
te reo training for staff and councillors, ongoing<br />
support to the Te Arawa Standing Committee.<br />
Another significant role of the Kaupapa Maori<br />
department is building relationships and sharing<br />
information with private and public agencies, iwi<br />
and other councils that work with iwi and Maori in<br />
their regions and/or districts.<br />
Mana Whenua Funding Policy<br />
In 2005/06 council reviewed its support of iwi<br />
management plans and developed a new Mana<br />
Whenua funding policy with objectives aimed at<br />
supporting the intent of section 81 of the Local<br />
Government Act 2002, and promoting resource<br />
management objectives. This policy was<br />
launched in October 2007. Since that time 14<br />
Maori land trust projects have been supported.<br />
The projects have included papakainga feasibility<br />
studies, commercial feasibility studies,<br />
environmental enhancement projects, waahi tapu<br />
maintenance and enhancement, environmental<br />
rejuvenation project, replanting projects,<br />
kaumatua housing and marae study and<br />
restoration study.<br />
The overall aim of the policy is to stimulate and<br />
encourage sustainable development of<br />
unoccupied Maori land in the district. The intent is<br />
to investigate viable strategies; build capacity of<br />
Maori land owners and develop joint projects that<br />
will benefit owners and the wider community.<br />
Recipients of the fund are Maori Ahu Whenua land<br />
trusts in the district, however Maori land<br />
reservations or marae undertaking projects that will<br />
improve water quality may also be eligible.<br />
<strong>Rotorua</strong> Te Arawa Lakes Strategy Group<br />
This joint committee, with representatives from Bay<br />
of Plenty Regional <strong>Council</strong>, Te Arawa Lakes Trust<br />
and <strong>Rotorua</strong> <strong>District</strong> <strong>Council</strong>, meet regularly to<br />
ensure a proactive strategic approach to<br />
coordinating lakes quality improvement in the<br />
district. This structure has been enshrined in<br />
legislation as part of the Te Arawa <strong>Rotorua</strong> Lakes<br />
Settlement.<br />
Lakes Restoration and Rehabilitation<br />
Programme<br />
This programme was established for both the<br />
strategic and operational delivery of action to<br />
enhance fresh water sustainability of <strong>Rotorua</strong> lakes<br />
and has iwi representatives. A number of action<br />
plans for specific lakes have been developed with<br />
contributions from a range of stakeholders<br />
including iwi.<br />
Tuhourangi Memorandum of<br />
Understanding<br />
In April 2005, council signed a memorandum of<br />
understanding (MOU) with Tuhourangi. The<br />
founding statements of the memorandum include:<br />
“<strong>Council</strong> also wishes to establish and maintain<br />
processes to provide the opportunity for<br />
Tuhourangi to contribute to the decision-making of<br />
the council”.<br />
Tuhourangi meetings with council have included<br />
the following projects: Tarawera and Okareka<br />
Landscape Assessment; proposed Crater Lake Park<br />
Development update; traffic and parking<br />
management plan for Punaromia, Tarawera<br />
Landing; Lake Tarawera boat trailer parking;<br />
Whakarewarewa Forest Vision and Tarawera Trail.<br />
Te Arawa Lakes Trust and <strong>Rotorua</strong> <strong>District</strong><br />
<strong>Council</strong> Memorandum of Understanding<br />
On 18 December 2009 a protocol between the<br />
<strong>Rotorua</strong> <strong>District</strong> <strong>Council</strong> and the Te Arawa Lakes<br />
Trust was signed. The purpose is to ensure that<br />
engagement and communication between the<br />
organisations is effective, that respect for both<br />
organisation’s roles and responsibilities is upheld,<br />
and that the cultural and spiritual relationship Te<br />
Arawa has with the 16 lakes and lake beds in<br />
<strong>Rotorua</strong> is recognised.<br />
Ngati Rangiwewehi, Ngati Rangiteaorere,<br />
Tapuika (Nga Tokotoru) – MOU<br />
2010 saw the development and completion of<br />
three new MOU between RDC and Nga Tokotoru.<br />
The purpose of these MOUs is to build relationships<br />
and to forge new partnerships with respective iwi<br />
and hapu.<br />
Maori participation in decision making<br />
<strong>Rotorua</strong> <strong>District</strong> <strong>Council</strong> ANNUAL REPORT 2011/12<br />
13
Maori participation in decision making<br />
Other Memoranda of Understanding<br />
Other MOUs are being developed between<br />
<strong>Rotorua</strong> <strong>District</strong> <strong>Council</strong> and hapu of Te Arawa.<br />
Community and Public Arts<br />
Local Maori artists, writers, performers and<br />
composers work with RDC on activities and events<br />
which have included; the Matariki festival, Artists in<br />
Residence, implementation of public art concepts<br />
and mural design and development in Western<br />
Heights and Brooklands, modernisation of<br />
Lakefront public facilities with a locally made<br />
mural, collaborative partnership in the Magma<br />
Film Festival, kaitiaki sculptures in Ngongotaha,<br />
Children’s Day and consultation with iwi for<br />
gateway designs for the Northern entry into<br />
<strong>Rotorua</strong>. These activities and events contribute to<br />
<strong>Rotorua</strong> <strong>District</strong>’s community outcomes for a living<br />
Maori culture and a thriving community.<br />
Whare Korero<br />
This handbook guides staff in gaining a basic<br />
understanding of Maori rituals, protocol and<br />
etiquette. The pocket booklet includes Maori<br />
language and pronunciations, a guide to rituals or<br />
marae etiquette, names and contact addresses of<br />
marae, formal and informal greetings, waiata,<br />
chants and karakia.<br />
14<br />
<strong>Rotorua</strong> <strong>District</strong> <strong>Council</strong> ANNUAL REPORT 2011/12
Mayor and <strong>Council</strong>lors<br />
Mayor and councillors<br />
His Worship the Mayor<br />
Kevin Winters JP<br />
Cr Trevor Maxwell MNZM<br />
Deputy Mayor<br />
Cr Maggie Bentley<br />
Cr Julie Calnan JP<br />
Cr Dave Donaldson QSM Cr Mark Gould JP Cr Karen Hunt<br />
Cr Mike McVicker Cr Merepeka Raukawa-Tait Cr Glenys Searancke QSM<br />
Cr Charles Sturt Cr Maureen Waaka, MNZM, JP Cr Janet Wepa<br />
<strong>Rotorua</strong> <strong>District</strong> <strong>Council</strong> ANNUAL REPORT 2011/12<br />
15
Committee structure<br />
Committee structure<br />
Bay of Plenty Regional <strong>Council</strong><br />
Kawerau <strong>District</strong> <strong>Council</strong><br />
Opotiki <strong>District</strong> <strong>Council</strong><br />
Tauranga <strong>District</strong> <strong>Council</strong><br />
Western Bay of Plenty <strong>District</strong> <strong>Council</strong><br />
Whakatane <strong>District</strong> <strong>Council</strong><br />
Citizens of <strong>Rotorua</strong> <strong>District</strong><br />
<strong>Rotorua</strong> <strong>District</strong> <strong>Council</strong><br />
<strong>Rotorua</strong> Te Arawa Lakes Strategy Group<br />
His Worship the Mayor (Chair)<br />
Cr Hunt<br />
Cr Searancke (Alternate)<br />
BOP Regional <strong>Council</strong><br />
Civil Defence Emergency<br />
Management Joint Committee<br />
His Worship the Mayor<br />
Cr Donaldson (alternate)<br />
<strong>Rotorua</strong> Regional Airport Ltd<br />
Directors:<br />
Mr Guerin<br />
Mr Kingi<br />
Mr Cook (Chair)<br />
Mr Crosby<br />
Te Arawa Lakes Trust<br />
<strong>Rotorua</strong> Lakes Community Board<br />
Mr Bond (Chair)<br />
Mr Callaghan<br />
Mr Palmer (Deputy Chair) Cr Bentley<br />
Mr Meharry<br />
Cr Donaldson<br />
Grow <strong>Rotorua</strong> Ltd<br />
Est. March 2012<br />
Mr Green (Chair) Mr Parker<br />
Ms Nees<br />
Mr Barnett<br />
Mr Marks Ms Rangi<br />
Mr Rolleston<br />
Chief Executive’s Performance<br />
Review Committee<br />
Audit Committee<br />
Executive Committee<br />
Corporate and<br />
Customer Services<br />
Committee<br />
Economic and<br />
Regulatory Services<br />
Committee<br />
Infrastructure<br />
Services<br />
Committee<br />
Te Arawa<br />
Standing<br />
Committee<br />
Tourism<br />
Committee<br />
Cr Wepa (Chair)<br />
Cr Calnan (Deputy Chair)<br />
His Worship the Mayor<br />
All <strong>Council</strong>lors<br />
Cr McVicker (Chair)<br />
Cr Hunt (Deputy Chair)<br />
His Worship the Mayor<br />
All <strong>Council</strong>lors<br />
Statutory Hearings<br />
Subcommittee<br />
Cr Waaka (Chair)<br />
Cr Hunt<br />
Cr Bentley<br />
Cr Searancke<br />
Cr Wepa<br />
Cr Searancke (Chair)<br />
Cr Donaldson (Deputy<br />
Chair)<br />
His Worship the Mayor<br />
All <strong>Council</strong>lors<br />
His Worship the Mayor<br />
(Chair)<br />
Cr Maxwell (Deputy<br />
Chair)<br />
Cr Waaka<br />
Mrs Mitchell<br />
Mr Biasiny-Tule<br />
Mr Mihinui<br />
Mr Tahana<br />
Ms Tait-Rolleston<br />
Mr Biddle<br />
Mr Marks (Chair)<br />
Mr Thomasen<br />
Ms Atkinson-Crean<br />
Mr Marvelly<br />
Ms Suurenbroek<br />
Mr Cossar<br />
Cr Waaka<br />
16<br />
<strong>Rotorua</strong> <strong>District</strong> <strong>Council</strong> ANNUAL REPORT 2011/12
Management<br />
Management<br />
Community<br />
(residents, ratepayers, customers and<br />
stakeholders)<br />
Mayor, <strong>Council</strong> and<br />
Committees<br />
Internal Auditor<br />
Service provided by external<br />
contractor<br />
Chief Executive<br />
Peter Guerin<br />
Corporate and Customer<br />
Services Group<br />
Economic and Regulatory<br />
Services Group<br />
Infrastructure Services<br />
Group<br />
Group Manager,<br />
Corporate and Customer<br />
Services<br />
Jean-Paul Gaston<br />
Community Policy &<br />
Resources; Corporate Planning<br />
& Support; Customer Centre;<br />
<strong>District</strong> Library; Emergency<br />
Management; Finance;<br />
Information Services;<br />
Procurement & Sustainability<br />
Group Manager,<br />
Economic and Regulatory<br />
Services<br />
Mark Rawson<br />
Building Services; City Services;<br />
Destination <strong>Rotorua</strong> Marking;<br />
Economic Projects; Events &<br />
Venues; Planning Services;<br />
Regulatory Services; <strong>Rotorua</strong><br />
Museum; Travel & Information<br />
Group Manager,<br />
Infrastructure Services<br />
Nico Claassen<br />
Asset Management; Aquatic<br />
Facility; Cemeteries;<br />
Engineering Services; Hydrus<br />
Engineering Consultants; Parks<br />
and Recreation; Transport and<br />
Road Safety; Waste<br />
Management; Wastewater,<br />
Water Supplies<br />
M A N A G E M E N T T E A M<br />
Kaupapa Maori<br />
Department<br />
Director,<br />
Kaupapa Maori<br />
Mauriora Kingi<br />
Iwi liaison, iwi communication, protocol and<br />
advice<br />
Communications<br />
Department<br />
Manager, Strategic<br />
Communication<br />
Rex Moore<br />
Internal and external communication<br />
support, website and branding<br />
Human<br />
Resources<br />
Department<br />
Manager,<br />
Human Resources<br />
Judy Holden<br />
Human resources, payroll services and<br />
health & safety<br />
Castlecorp<br />
Business Unit<br />
General Manager,<br />
Castlecorp<br />
Mike Davies<br />
Physical works for: land drainage, refuse<br />
collection, litter collection, mowing,<br />
water/wastewater, network maintenance,<br />
fleet management, janitorial services,<br />
specialist horticulture maintenance<br />
<strong>Rotorua</strong> <strong>District</strong> <strong>Council</strong> ANNUAL REPORT 2011/12<br />
17
Community Outcomes<br />
Community Outcomes<br />
A strategic framework called the ‘Bright Future<br />
<strong>Rotorua</strong> - Community Outcomes’ originally<br />
provided an overarching set of strategic goals that<br />
council and other organisations used to guide<br />
service delivery and resource allocation. They<br />
were a focal point for promoting closer working<br />
relationships, to ensure resources are used<br />
effectively and in a coordinated manner.<br />
Amendments made to the Local Government Act<br />
in 2010 have changed the focus of community<br />
outcomes. They are now seen as statements of<br />
what councils want to achieve – the council’s high<br />
level objectives. Freedom has been given to<br />
councils to decide how best to structure these<br />
outcomes and how to monitor and report on<br />
them.<br />
their objectives are well reflected in the existing<br />
community outcomes framework. This framework<br />
was developed with extensive community input<br />
and the key priorities of the community have been<br />
tested over the last six <strong>year</strong>s. With this in mind<br />
council focused on re-defining its role, with minor<br />
changes, to better reflect more emphasis on<br />
aligning the goals of its services to the strategic<br />
long term goals of council.<br />
Going forward the council’s eight objectives are<br />
linked by ‘visionary community leadership’, with<br />
each considered of equal importance. Together<br />
these objectives provide the basis for what the<br />
council wants to achieve for a bright, successful<br />
<strong>Rotorua</strong>. The updated council objectives are<br />
shown in the diagram below.<br />
During the 2011/12 <strong>year</strong> while preparing for the<br />
Long-term Plan 2012-2022 council decided that<br />
18<br />
<strong>Rotorua</strong> <strong>District</strong> <strong>Council</strong> ANNUAL REPORT 2011/12
Visionary Community Leadership<br />
Overarching these community outcomes is a<br />
desire by council to exercise visionary, inclusive<br />
leadership, supported and fostered within <strong>Rotorua</strong><br />
communities<br />
Ko te tūāpapa e whakamaru ana i nga whāinga ā<br />
hāpori he ākina na te kaunihera ki te whakamahi i<br />
ana tirohanga whakamua, tōna rangatiratanga,<br />
mā nga hāpori o <strong>Rotorua</strong> e tautoko e kōkiri<br />
<br />
<br />
<br />
<br />
<strong>Rotorua</strong> communities have a clear<br />
vision for sustainable development,<br />
prosperity and wellbeing.<br />
Communities are informed and<br />
engaged in planning and<br />
developing the district’s future.<br />
Organisations and communities work<br />
together at all levels to achieve<br />
shared outcome.<br />
Maori are respected as partners in<br />
decision-making and have a voice<br />
in issues affecting the district.<br />
Prosperous Economy<br />
A district with a reputation as an attractive place<br />
to live, work and play, with desirable living and skills<br />
standards, and sustainable economic growth<br />
He rohe e rongo nuitia ana mo te noho mo te<br />
mahi me te tākaro, he pai kē atu nga āhuatanga<br />
e paana ki te ōranga, te noho me te toko ake i te<br />
taha whai hua<br />
<br />
<br />
<br />
<br />
<br />
<br />
<br />
<br />
<br />
<br />
<br />
Encouraging private enterprise<br />
Enhancing tourism as an iconic<br />
sector of <strong>Rotorua</strong>’s economy<br />
Encouraging development of Mâori<br />
land and resources<br />
Reducing unemployment rate<br />
More investment in our district<br />
More employment opportunities<br />
More new business<br />
Celebrating and promoting our<br />
district’s unique qualities<br />
Encouraging growth<br />
An attractive and lively city centre<br />
Sustainable development<br />
Community Outcomes<br />
Safe and Caring<br />
A community in which our families and whanau<br />
feel safe, strong and supported<br />
He hāpori e haumaru ana e tautoko nuitia ana i<br />
ngā whānau<br />
<br />
<br />
<br />
<br />
<br />
<br />
<br />
<br />
<br />
Safe homes and streets<br />
Fewer road accidents<br />
Organisations working together on<br />
agreed priorities<br />
Providing safe public spaces<br />
Families and whanau work, play<br />
and talk together<br />
Strong sense of community spirit<br />
Respect for cultural<br />
diversity/strengthening relationships<br />
between all cultures<br />
Support for new New Zealanders to<br />
become part of the <strong>Rotorua</strong><br />
community<br />
Support for young people and older<br />
people`<br />
Excellent Facilities and Services<br />
A well planned district that is easy to get around,<br />
has essential services available to everyone, and<br />
offers accessible quality facilities that promote<br />
vibrancy.<br />
He mārama te haerere haere i roto i te rohe, he<br />
rātonga me nga rātonga whare e wātea ana ki te<br />
katoa<br />
<br />
<br />
<br />
<br />
<br />
<br />
Easy to get from place to place<br />
Good, safe, maintained services<br />
and facilities<br />
Provision of good quality event,<br />
conference and tourism facilities<br />
Good quality infrastructure for<br />
future<br />
Excellent reliable communication<br />
infrastructure<br />
A great trans-Tasman airport<br />
<strong>Rotorua</strong> <strong>District</strong> <strong>Council</strong> ANNUAL REPORT 2011/12<br />
19
Community Outcomes<br />
Environment<br />
A district where we value our environs, understand<br />
and respect our lakes, streams, forests and<br />
geothermal resources, and where the community<br />
is committed to protecting, monitoring and<br />
improving the natural environment.<br />
He rohe e ngākau nuitia ana ki tōna taiao, te tiaki i<br />
nga roto, nga awa, nga ngāhere me nga puna<br />
ngāwha, ko tā te hāpori he whakaihi i nga<br />
ahuatanga o tiaki i te taiao<br />
<br />
<br />
<br />
<br />
<br />
<br />
<br />
<br />
<br />
Looking after our air, land and water<br />
resources<br />
Improved lake water quality<br />
Beautiful, litter-free urban<br />
environments<br />
Waste reduction, re-use and<br />
recycling<br />
Kaitiakitanga (guardianship)<br />
People using and enjoying our<br />
natural environment<br />
Historical sites and buildings are<br />
protected and promoted<br />
Managing and protecting<br />
geothermal resources and our<br />
springs, trout, lakes, forests, geysers<br />
Encouraging sustainable modes of<br />
transport<br />
Thriving<br />
An exciting place offering a wide range of<br />
activities and events, where diversity is<br />
encouraged and creativity inspires.<br />
He waahi e hihiko ana e tuku ana i ētahi<br />
matatinitanga me ētahi kaupapa nunui hei<br />
haerenga mā te hāpori me te iwi whānui<br />
<br />
<br />
<br />
<br />
Lots of events including sporting,<br />
cultural, festivals, arts<br />
Leading edge activities and events<br />
Foster artistic expression, art, music,<br />
dancing, public performances and<br />
exhibitions<br />
Great facilities to visit e.g. museum,<br />
arts village, aquatic centre<br />
Healthy<br />
A community that is healthy and active, where air<br />
and water is of the highest quality, and where<br />
parks, reserves, walkways, cycleways and<br />
programmes encourage participation in<br />
recreational activity at all levels.<br />
He hāpori hauora, hāpori kakama he rawe katoa<br />
te hau me nga ara wai. E wātea ana nga papa<br />
rēhia, nga whenua rāhui, nga ara hikoi, nga ara<br />
paihikara hei waahi tākaro mā te katoa<br />
Living Maori Culture<br />
A district where the history of Te Arawa in the<br />
district and the value of Maori culture is recognised<br />
and fostered.<br />
He rohe tēnei e whakanuia ana e tiaki ana e<br />
pupuri ana i nga kōrero o nehe rā e paana ki a Te<br />
Arawa<br />
<br />
<br />
<br />
<br />
<br />
Increasing recreational<br />
opportunities<br />
Safe drinking water<br />
Improved youth health<br />
Effective responses to developing<br />
health issues<br />
Warm, healthy homes<br />
<br />
<br />
<br />
<br />
Preservation and sustainable<br />
development of Maori resources<br />
Respecting Te Arawa as part of the<br />
unique heritage of <strong>Rotorua</strong> district<br />
Celebrating and nurturing<br />
traditional Maori culture<br />
Maori are respected as partners in<br />
decision-making and have a voice<br />
in issues affecting the <strong>District</strong><br />
Learning<br />
A district offering opportunities to expand the<br />
minds of its community, to explore ideas and to<br />
form strong well supported opinions.<br />
He hāpori e tuku ana i ētahi huarahi angitu hei<br />
whakarahi ake i te tirohanga o te hāpori me te<br />
rangahau i ētahi atu ara hou hei whainga ma te<br />
katoa<br />
<br />
Learning activities accessible for<br />
everyone<br />
There is no longer a legislative requirement to<br />
monitor and report on the progress of council<br />
objectives. However legislation does dictate that<br />
where monitoring is undertaken on council<br />
objectives the results must be reported in the<br />
annual report. <strong>Council</strong> will continue to monitor the<br />
objectives and will produce a full monitoring report<br />
bringing together all of the stakeholders monitoring<br />
areas on a five <strong>year</strong>ly basis. This reporting will be<br />
aligned with the State of the Environment report.<br />
The next reporting on Community Outcomes will<br />
be published in 2016.<br />
20<br />
<strong>Rotorua</strong> <strong>District</strong> <strong>Council</strong> ANNUAL REPORT 2011/12
Financial summary<br />
Statement of comprehensive income (<strong>Council</strong>)<br />
For the <strong>year</strong> <strong>ended</strong> 30 June:<br />
2012<br />
$000<br />
2011<br />
$000<br />
2010<br />
$000<br />
2009<br />
$000<br />
2008<br />
$000<br />
General rates 35,023 34,614 34,201 45,974 42,919<br />
Targeted rates 36,751 33,935 31,725 18,487 16,805<br />
Other revenue 49,774 43,848 39,469 38,856 35,332<br />
Non operating adjustments 0 2,577 8,384 868 4,345<br />
Total revenue 121,548 114,974 113,779 104,185 99,401<br />
Operating expenditure 114,447 105,235 100,414 98,122 91,706<br />
Non operating expenditure 10,504 2,083 4,775 0 0<br />
Taxation 0 0 0 0 0<br />
Total expenditure 124,951 107,318 105,189 98,122 91,706<br />
Financial summary<br />
Net surplus/(deficit) -3,403 7,656 8,590 6,063 7,695<br />
Statement of financial position (<strong>Council</strong>)<br />
For the <strong>year</strong> <strong>ended</strong> 30 June:<br />
2012<br />
$000<br />
2011<br />
$000<br />
2010<br />
$000<br />
2009<br />
$000<br />
2008<br />
$000<br />
Current assets 23,467 21,555 20,545 18,454 19,815<br />
Current liabilities 28,902 32,442 30,652 28,556 25,111<br />
Working capital -5,435 -10,887 -10,107 -10,102 -5,296<br />
Investments 2,147 2,220 2,063 2,440 2,500<br />
Non current assets 1,032,807 1,044,415 961,905 912,430 860,016<br />
1,029,519 1,035,748 953,861 904,768 857,220<br />
Financed by:<br />
Rate payers equity 853,102 848,433 821,812 805,484 781,994<br />
Debt 151,756 135,110 115,632 100,751 82,860<br />
Other term liabilities 3,147 2,661 2,516 2,237 2,172<br />
Reserves 21,514 49,548 13,901 (3,704) (9,806)<br />
1,029,519 1,035,752 953,861 904,768 857,220<br />
Revenue<br />
Rates revenue is higher than the previous <strong>year</strong> due<br />
to growth in the rating base and particularly the<br />
increased number of properties connected to the<br />
wastewater system as a result of the new<br />
sewerage schemes. Other revenue is higher than<br />
last <strong>year</strong> due to more capital revenue received for<br />
infrastructure from central government.<br />
Expenditure<br />
Expenditure is higher than last <strong>year</strong> due to non<br />
cash downwards asset valuation transactions<br />
totalling $12.2 million. This has contributed to the<br />
deficit reported as the revaluation movements<br />
were not budgeted for.<br />
<strong>Rotorua</strong> <strong>District</strong> <strong>Council</strong> ANNUAL REPORT 2011/12<br />
21
Financial summary<br />
Non-current assets<br />
Non current assets decreased by $9.5 million due<br />
to asset valuation movements.<br />
Public debt<br />
Debt increased by $16 million over the financial<br />
<strong>year</strong> to fund capital expenditure.<br />
Revenue mix<br />
Operating expenditure<br />
150,000<br />
160,000<br />
$ in thousands<br />
125,000<br />
100,000<br />
75,000<br />
50,000<br />
25,000<br />
0<br />
2012 2011 2010 2009 2008<br />
$ in thousands<br />
140,000<br />
120,000<br />
100,000<br />
80,000<br />
60,000<br />
40,000<br />
20,000<br />
0<br />
124,951<br />
107,318 105,189 98,122<br />
91,706<br />
2012 2011 2010 2009 2008<br />
Rates<br />
Other revenue<br />
Total debt<br />
Ratepayers’ equity<br />
$ in thousands<br />
160,000<br />
140,000<br />
120,000<br />
100,000<br />
80,000<br />
60,000<br />
40,000<br />
20,000<br />
151,756<br />
135,110<br />
115,632<br />
100,751<br />
82,860<br />
$ in thousands<br />
900,000<br />
750,000<br />
600,000<br />
450,000<br />
300,000<br />
150,000<br />
853,102 848,433<br />
821,812 805,484 797,326<br />
0<br />
2012 2011 2010 2009 2008<br />
0<br />
2012 2011 2010 2009 2008<br />
22 <strong>Rotorua</strong> <strong>District</strong> <strong>Council</strong> ANNUAL REPORT 2011/12
Corporate and Customer Services Group<br />
Contribution to outcomes<br />
Visionary Community<br />
Leadership<br />
Community Outcomes<br />
Page Activities within this group<br />
25 Community Engagement and Support <br />
29 <strong>District</strong> Library <br />
33 Emergency Management/Rural Fire <br />
Safe and caring<br />
Prosperous economy<br />
Environment<br />
Excellent facilities<br />
and services<br />
36 Governance and Strategic Direction <br />
Living Maori culture<br />
Thriving<br />
Healthly<br />
Learning<br />
Corporate and Customer Services Group<br />
Overview of group<br />
The Corporate and Customer Services Group<br />
underpins council’s democratic processes and<br />
provides policy and priorities for strategic direction,<br />
advocacy, and delivery of services to best meet<br />
the community’s needs.<br />
Significant emphasis is being placed on a ‘whole<br />
of council’ approach to customer service and<br />
continuous improvement.<br />
This group is central to ensuring that <strong>Rotorua</strong> <strong>District</strong><br />
<strong>Council</strong>’s services are contributing towards the<br />
promotion of community outcomes and improving<br />
social, cultural, economic and environmental<br />
wellbeing for the people of the district.<br />
Procurement processes continue to be a key focus<br />
enabling council to hold rates over the previous<br />
three <strong>year</strong>s to levels well below CPI. More gains are<br />
expected in this area based on greater use of<br />
‘Whole of Government’ contracts that are being<br />
made available to Local Government.<br />
This group is made up of the following activities of<br />
council:<br />
• Community Engagement and Support, which<br />
includes:<br />
Community Grants<br />
Pensioner Housing<br />
Halls and Community House<br />
Policy and Resources<br />
◦ Community arts<br />
◦ Community safety<br />
◦ Youth activities<br />
• <strong>District</strong> Library<br />
• Emergency Management/Rural Fire<br />
• Governance and Strategic Direction, which<br />
includes:<br />
Chief Executive Group<br />
Corporate Planning and Support<br />
Corporate Property<br />
Customer Services<br />
Democracy<br />
Financial Services<br />
Human Resources<br />
Information Services<br />
Kaupapa Maori<br />
Land Information Services<br />
Procurement and Sustainability<br />
Records<br />
Issues/risks/negative impacts<br />
Potential negative effects associated with<br />
undertaking the activities within this group have<br />
been assessed and it is believed that there has<br />
been no impact to the social, cultural,<br />
environmental and economic well-being of the<br />
community/district during the <strong>year</strong>. potential<br />
effects were reviewed in preparing the Long-term<br />
Plan. these will be monitored and reported upon<br />
in future annual reports.<br />
<strong>Rotorua</strong> <strong>District</strong> <strong>Council</strong> ANNUAL REPORT 2011/12<br />
23
Corporate and Customer Services Group<br />
Performance targets<br />
Targets<br />
Achieved<br />
Not<br />
measured<br />
Not<br />
achieved<br />
Community Engagement and Support 9 9 - -<br />
<strong>District</strong> Library 11 9 - 2<br />
Emergency Management 5 3 - 2<br />
Governance and Strategic Direction 6 1 3 2<br />
Total 31 22 3 6<br />
Targets not measured were within the Governance<br />
and Strategic Direction activity and relate to<br />
targets that are only measured in a local body<br />
election <strong>year</strong>. Local elections will be held again in<br />
2013.<br />
Targets not achieved in the Library activity are the<br />
result of reduced membership numbers and the<br />
number of issues per capita. The biggest downturn<br />
is in rental fiction. In Emergency Management a<br />
full mobilisation exercise was not undertaken due<br />
to a delay in receiving national EMIS programme<br />
and a structure review at local and regional level.<br />
Also, not all plans/strategies were reviewed<br />
however, the existing ones remain current. The<br />
Governance and Strategic Direction targets not<br />
achieved were in relation to residents’ satisfaction<br />
with council, information communicated to the<br />
public and Mana Whenua plans not being<br />
completed.<br />
Net cost of service<br />
$ in thousands<br />
Governance and Strategic<br />
Direction<br />
$4,807<br />
Emergency Management<br />
$639<br />
<strong>District</strong> Library<br />
$3,691<br />
Community Engagement<br />
and Support<br />
$2,732<br />
$- $500 $1,000 $1,500 $2,000 $2,500 $3,000 $3,500 $4,000 $4,500 $5,000<br />
Capital expenditure<br />
$ in thousands<br />
Community Engagement<br />
and Support<br />
$112<br />
<strong>District</strong> Library<br />
$542<br />
Emergency Management<br />
$1<br />
Governance and Strategic<br />
Direction<br />
$2,801<br />
$- $500 $1,000 $1,500 $2,000 $2,500 $3,000<br />
24 <strong>Rotorua</strong> <strong>District</strong> <strong>Council</strong> ANNUAL REPORT 2011/12
Community Engagement and Support<br />
of the community. Grants are usually up to<br />
$1,500. The funds can be used for most<br />
purposes except for the purchase of equipment<br />
and buildings. An annual fund of $28,000 per<br />
<strong>year</strong> is available, which will be allocated to<br />
organisations for a three <strong>year</strong> period.<br />
• Creative Communities<br />
<strong>Council</strong> acts as an agent for central<br />
government, with $49,000 per <strong>year</strong> received<br />
from Creative New Zealand and distributed by<br />
the council’s <strong>Rotorua</strong> Creative Communities<br />
Committee.<br />
• Community safety<br />
Designed to assist local not-for-profit groups<br />
and organisations undertaking projects with a<br />
crime prevention focus. Funding of $25,000 per<br />
<strong>year</strong> is available.<br />
Community Engagement and Support<br />
What we do<br />
This activity covers a range of specific functions, in<br />
particular roles that work towards social wellbeing<br />
outcomes. The focus areas are:<br />
Engaging communities<br />
The council works with community organisations to<br />
ensure their sustainability. When strong, these<br />
organisations can make positive contributions to<br />
the social and cultural wellbeing of people in the<br />
district. Engagement includes programmes,<br />
projects and activities for specific groups. The<br />
scope of work includes engagement with young<br />
and older people, those interested in art and the<br />
arts community, ethnic communities, people who<br />
are disadvantaged, and crime and safety<br />
concerns. This work includes research to track the<br />
social impact of societal and demographic<br />
changes, and other activities within the district.<br />
Community Assistance<br />
<strong>Council</strong> provides contestable funding schemes<br />
which allow community groups to make<br />
contributions towards achieving <strong>Rotorua</strong>'s<br />
community outcomes. The schemes are:<br />
• Community Asset Development Fund (CADF)<br />
$50,000 per <strong>year</strong> is available in this fund.<br />
• Community Grants<br />
Designed to assist and support a wide range of<br />
'not for profit' community organisations to<br />
continue their work around meeting the needs<br />
• Grants for services<br />
<strong>Council</strong> currently provides grants of over $5,000<br />
per annum to 10 local organisations for services<br />
– Te Papa Takaro O Te Arawa, <strong>Rotorua</strong> Arts<br />
Village Experience, Older Persons Community<br />
Centre Trust, Citizens Advice Bureau <strong>Rotorua</strong>,<br />
<strong>Rotorua</strong> Community Youth Centre, <strong>Rotorua</strong><br />
Neighbourhood Support Trust, Sport Bay of<br />
Plenty, <strong>Rotorua</strong> Night Shelter Trust, <strong>Rotorua</strong><br />
Christmas Parade Trust, <strong>Rotorua</strong> Branch of SPCA<br />
Inc. These grants operate in the form of three<br />
<strong>year</strong> contracts with agreed deliverables.<br />
Another level of grants for services of less than<br />
$5,000 per annum also exists. Funding available<br />
for these grants for services is currently $23,500.<br />
Community halls<br />
The council maintains eight rural and one urban<br />
community hall, and makes a financial<br />
contribution to two other halls used by residents of<br />
the district. The halls provide indoor meeting<br />
places for people who live within the district. They<br />
are hired out to users, and managed by local<br />
volunteer committees. The halls are in<br />
Ngongotaha, Mamaku, Kaharoa, Lake Okareka,<br />
Waikite, Reporoa, Broadlands, Rerewhakaaitu, and<br />
Ngakuru. Financial contributions are made to halls<br />
in Atiamuri and Lake Rotoma.<br />
Pensioner housing<br />
The council provides and maintains pensioner<br />
housing complexes in Ngongotaha, Westbrook,<br />
Glenholme and Fenton Park. There are 152 units.<br />
Community House<br />
Community House was purchased by <strong>Rotorua</strong><br />
<strong>District</strong> <strong>Council</strong> in 1993. The house provides office<br />
accommodation for many of the district’s not-forprofit<br />
groups which offer health and social services<br />
to the people of the <strong>Rotorua</strong> district.<br />
<strong>Rotorua</strong> <strong>District</strong> <strong>Council</strong> ANNUAL REPORT 2011/12<br />
25
Community Engagement and Support<br />
Community House is a three-storey building in<br />
Haupapa Street, in the central business district.<br />
There are 23 social service organisations housed on<br />
the ground and first floor. Rental for these tenants<br />
is subsidised by RDC. The third floor is leased out at<br />
market rates.<br />
Citizens Advice Bureau acts as lead tenant and<br />
manages day-to-day issues for the first two floors.<br />
Why we do it<br />
To foster social and cultural wellbeing, by<br />
engaging with communities to help them achieve<br />
their objectives, build their capacity, strengthen<br />
their identity, and ensure their sustainability.<br />
This <strong>year</strong>’s highlights and achievements<br />
included:<br />
• Children’s and Family Fun Day – held March 4<br />
at the Redwoods.<br />
• Music at the Rotunda - ran over 6 weeks on<br />
Sunday’s through February and March.<br />
• Community Assistance<br />
− Creative Communities - allocated $29,660 to<br />
23 organisations for arts and culture<br />
initiatives, including 2012 Stage Challenge, a<br />
short documentary film (Spirit of <strong>Rotorua</strong>),<br />
rural school musical, and a<br />
flaxmaking/craftmaking initiative in the<br />
Fordland’s Community.<br />
− Community Grants - allocated $38,475 to 26<br />
organisations including Mokoia Community<br />
Association for their newsletter, <strong>Rotorua</strong><br />
Parents Centre for operational costs,<br />
Growing through Grief to assist with grief<br />
counselling programme and Linton Park<br />
Community Trust to assist with heating costs.<br />
− Creative Communities <strong>Rotorua</strong> - made 10<br />
grants totalling $10,530 at their discretionary<br />
round allocation meeting in October.<br />
Projects included teaching people with<br />
intellectual disabilities how to work with clay,<br />
singing and instrumental workshops, and<br />
assisting with the production of a book<br />
about the history of <strong>Rotorua</strong> Jazz musicians.<br />
− Community Safety Projects Fund - a total of<br />
$25,000 was awarded to six organisations to<br />
implement projects to improve safety in our<br />
community. The organisations that received<br />
grants are: New Zealand Red Cross for "Save<br />
a Mate"; Reporoa Lions Charitable Trust for<br />
"CACTUS" (Combined Adolescent Training<br />
Unit and Support); Youth Projects Trust for<br />
"Manaakitanga Youth Programme";<br />
Empowered Learning Trust for "Irlens<br />
Screening Project"; Sexual Abuse Centre for<br />
"Smartsex Website"; Netball <strong>Rotorua</strong> for<br />
security cameras<br />
• Youth in Local Government - three local young<br />
people att<strong>ended</strong> the conference in April, in<br />
Invercargill, with RDC’s Youth Projects Officer,<br />
and came home with the national Youth<br />
Spaces Award<br />
• Youth Spaces - Western Height’s and Fordlands’<br />
Youth Spaces opened in February.<br />
• FreeParking programming - funded by a grant<br />
from Ministry of Youth Development the<br />
programme supports youth recreation<br />
programmes on the youth spaces, for young<br />
people aged 12 to 20 <strong>year</strong>s.<br />
• Treasure <strong>Rotorua</strong> Alcohol Harm reduction -<br />
external funding granted to RDC, to<br />
commence six month project.<br />
• Good Health 2012 - directory of local health<br />
and social service providers was updated -<br />
available on RDC website.<br />
• Safe City Guardians - Central city safety<br />
programme, approved for a further 12 months.<br />
• Magma Short Film Festival - held at the Civic<br />
Theatre April 26-29.<br />
• NZ Music Month - Auckland based musician<br />
and music manager Jan Hellriegel, Wellington<br />
based guitarist and pedal developer Ben<br />
Fulton, local percussionist Michael Barker,<br />
drummer Mickey Ututaonga and bassist Rob<br />
Patterson ran workshops for budding musicians<br />
at <strong>Rotorua</strong> Lakes High School. 15 students under<br />
24 <strong>year</strong>s of age participated.<br />
Community Outcomes<br />
Safe and Caring<br />
• By working with a range of organisations on<br />
agreed priorities, including Safe Community<br />
designation (Treasure <strong>Rotorua</strong>)<br />
• By working towards safe homes and streets,<br />
lowering crime rates, improving perceptions of<br />
safety among residents, curbing alcohol related<br />
violence in the district<br />
• By providing safe public spaces through use of<br />
Crime Prevention Through Environmental Design<br />
(CPTED) principles<br />
• By actively working to create supportive<br />
environments for those affected by child abuse<br />
and family violence in the district<br />
• By supporting activities undertaken by <strong>Rotorua</strong><br />
Safer Families<br />
• By contracting with local ‘not for profit’<br />
organisations to ensure services are available<br />
for residents<br />
• By implementing the RDC Crime Prevention<br />
Plan<br />
• By contributing to the support of local not-forprofit<br />
organisations through accommodation<br />
and grants for services contracts.<br />
Prosperous Economy<br />
• By working with organisations which support<br />
young people involved in education, training<br />
and employment<br />
• By facilitating capacity building amongst local<br />
artists and arts organisations<br />
Excellent Facilities and Services<br />
• By contributing to the support of local not for<br />
profit organisations through the provision of<br />
subsidised accommodation and grants for<br />
services contracts<br />
• By partnering with other agencies around<br />
priority projects e.g. <strong>Rotorua</strong> Safe Families<br />
26 <strong>Rotorua</strong> <strong>District</strong> <strong>Council</strong> ANNUAL REPORT 2011/12
What it cost us<br />
Operating expenses<br />
2012<br />
actual<br />
$000<br />
<strong>Annual</strong><br />
Plan<br />
$000<br />
2011<br />
actual<br />
$000<br />
Direct costs 2,753 2,718 2,464<br />
Financial costs 61 67 39<br />
Depreciation 1,020 845 841<br />
Other* -4 0 0<br />
Total costs 3,830 3,630 3,344<br />
Revenue<br />
Capital revenue 10 0 0<br />
General rates 0 0 0<br />
Fees and charges 868 849 814<br />
Investment income 1 1 1<br />
Subsidies and grants 219 44 238<br />
Targeted Rates 0 0 0<br />
Other Income* 0 0 0<br />
Total revenue 1,098 894 1,053<br />
Net cost of service 2,732 2,736 2,291<br />
Capital expenditure<br />
2012<br />
actual<br />
$000<br />
Lucas Place flats upgrade 110<br />
Rawhiti flats upgrade 2<br />
Variance from budget<br />
112<br />
• Direct costs are higher than budget due to City<br />
Safe Guardian personnel costs which are<br />
recovered through Ministry of Justice grants.<br />
• Fees and charges are favourable compared to<br />
budget due to additional rental income from<br />
Community House and Community Halls.<br />
• Subsidies and grants is favourable compared to<br />
budget due to additional funding from<br />
Creative NZ, Ministry of Justice, SportNZ, and the<br />
Ministries for Social and Youth Development for<br />
various projects.<br />
Community Engagement and Support<br />
Capital costs<br />
Renewals 112 118 46<br />
Growth 0 0 0<br />
Backlog 0 0 0<br />
Level of service 0 0 124<br />
Total capital 112 118 170<br />
Operational funding<br />
Net cost of service of<br />
general rate activities<br />
2,732 2,736 2,291<br />
Plus capital revenue 13 0 0<br />
Less depreciation -1,033 -845 -841<br />
Depreciation funded by<br />
general rates<br />
0 18 13<br />
Add back half share<br />
roading depreciation<br />
0 0 0<br />
Self funding/DC reserve<br />
movements<br />
-76 4 143<br />
Operations funded by<br />
general rates<br />
1,636 1,913 1,606<br />
Capital funding<br />
Funding from<br />
depreciation (rates)<br />
0 18 13<br />
Loans from/(to)<br />
corporate fund<br />
0 0 62<br />
Capital grants 0 0 62<br />
Development<br />
contributions<br />
0 0 0<br />
Reserves net 112 100 33<br />
Asset sales 0 0 0<br />
Total capital 112 118 170<br />
* Non cash adjustments due to revaluation<br />
<strong>Rotorua</strong> <strong>District</strong> <strong>Council</strong> ANNUAL REPORT 2011/12<br />
27
Community Engagement and Support<br />
How we performed<br />
Level of Service Performance measures Target for 2011/12 Achievement Comments<br />
Directly and indirectly<br />
provide assistance to<br />
community groups to<br />
build their capacity<br />
and help them<br />
achieve their<br />
objectives.<br />
Management of<br />
pensioner housing<br />
tenancies so that the<br />
account is self<br />
funding.<br />
Ensure quality<br />
information on the<br />
social and cultural<br />
composition and<br />
trends of the<br />
community are<br />
available and used in<br />
the direction setting<br />
of <strong>Rotorua</strong> district.<br />
Implement and maintain<br />
proposed safety<br />
initiatives.<br />
All rural and urban halls<br />
have a building warrant<br />
of fitness.<br />
Community grants rounds<br />
are completed each<br />
<strong>year</strong>.<br />
Grants for services<br />
contracts are in place<br />
with local not-for-profit<br />
groups and annual<br />
accountability reports are<br />
completed.<br />
% of tenancy level in<br />
Community House.<br />
Rental income covers<br />
100% of operational costs.<br />
Maintain WHO Safe<br />
Community<br />
designation.<br />
Maintain Safe<br />
Families and Crime<br />
Prevention Action<br />
Plans.<br />
Achieved<br />
Treasure <strong>Rotorua</strong> committee<br />
members have met monthly<br />
during 2011/12 <strong>year</strong> to plan<br />
and implement activities to<br />
maintain designation as a<br />
Safe Community.<br />
The Crime Prevention Plan<br />
was implemented through a<br />
variety of projects in the<br />
period 01.07.11-30.06.12.<br />
RDC representatives<br />
att<strong>ended</strong> <strong>Rotorua</strong> Safer<br />
Families monthly meetings<br />
during 2011/12, and<br />
contributed to action plan<br />
activities.<br />
100% Achieved All warrants of fitness were<br />
renewed by June 2012.<br />
4 Achieved Community grants rounds<br />
were undertaken as follows:<br />
Community Safety Fund –<br />
31.10.11.<br />
Creative Communities – main<br />
round 15.04.11. Discretionary<br />
round 15.10.11.<br />
Community Asset<br />
Development Fund 24.02.11.<br />
Community Grants 02.06.12.<br />
8 9 (achieved) Deliverables for 9 not-for-profit<br />
groups were negotiated by<br />
14. 08.11.<br />
One group received only 3 of<br />
4 payments due as unable to<br />
meet deliverables.<br />
Supported The Homeless<br />
Shelter however not ready to<br />
uplift grant by 30.6.12, no<br />
contract prepared.<br />
Accountability reports were<br />
completed by <strong>year</strong> end and<br />
received by 31.01.12 and<br />
27.07.12.<br />
98% 99.24% (achieved) One office was empty for 61<br />
days when RNZFB moved out<br />
and the new tenant was<br />
unable to move in<br />
immediately. Also rented out<br />
a previously unused storage<br />
cupboard.<br />
No cost to ratepayer Achieved Total operational costs<br />
(excluding depreciation) was<br />
$639k while revenue was<br />
$746k.<br />
% of unit occupancy. 95% 98.6% (achieved) Occupancy 2.5% higher than<br />
in 2010/11 <strong>year</strong>.<br />
% of tenants rate overall<br />
satisfaction with their units<br />
as good/very good in<br />
two-<strong>year</strong>ly satisfaction<br />
surveys.<br />
Update Good Health,<br />
Social Monitor and youth<br />
services information<br />
annually.<br />
85% 86.2% (achieved) Survey undertaken in August<br />
2011 to fit in with Pensioner<br />
Housing service level review.<br />
100% Achieved Good Health 2012 published<br />
17.07.12.<br />
Social Monitor 2011 released<br />
13.03.12.<br />
Social Sector survey report<br />
2011 released 17.02.12.<br />
Youth Services Directory<br />
provides for services listed in it<br />
to update their own details as<br />
required.<br />
28 <strong>Rotorua</strong> <strong>District</strong> <strong>Council</strong> ANNUAL REPORT 2011/12
<strong>District</strong> Library<br />
Mobile Library/House Bound service<br />
The mobile library travels to outlying areas of the<br />
district, to rural schools, retirement homes and<br />
other areas where location and transport is an<br />
issue. The housebound service delivers books and<br />
resources to members of the community who are<br />
restricted to their homes due to illness or disability.<br />
The books are selected by staff and delivered<br />
fortnightly by volunteer drivers.<br />
<strong>District</strong> Library<br />
What we do<br />
Collections/lending services<br />
The library provides a range of children’s, teens’<br />
and adults’ fiction and non-fiction books in normal<br />
and large print, magazines, not-for-loan reference<br />
books, special collections of NZ books, an historical<br />
collection of local newspapers on microfiche,<br />
talking books, music CDs, E-Audio books and DVDs.<br />
The library houses the Community Toy Library, a<br />
collection of material belonging to the <strong>Rotorua</strong><br />
Branch NZ Society of Genealogists, Te<br />
Rangikaheke papers (held in trust for Ngati<br />
Rangiwewehi) and a variety of Maori Land Court<br />
minute books. All of these are available to the<br />
public.<br />
Kete <strong>Rotorua</strong><br />
This web-based facility provides a ‘kete’ (basket)<br />
for collecting images and information about<br />
<strong>Rotorua</strong> and its inhabitants both past and present.<br />
It is managed by the library and enables<br />
individuals, community groups and associations to<br />
share information.<br />
Website<br />
A new website was launched in 2011. This easy-touse<br />
website (www.rotorualibrary.govt.nz) provides<br />
free access to the library’s catalogue and a range<br />
of government, education and research<br />
databases, as well as the library’s facebook and<br />
twitter pages.<br />
Programmes/displays and exhibitions<br />
Various programmes are provided to cover<br />
differing age groups belonging to or using the<br />
library. These include:<br />
• Rhyme ‘n’ Rumpus (twice a week)<br />
• School holiday programmes<br />
• Teens’ programmes<br />
• Author evenings (at least six times a <strong>year</strong>)<br />
• Reading Round for adults (monthly)<br />
Toi Tangata is a special exhibition area provided<br />
for local artists to display their work. There are also<br />
display cases and notice boards throughout the<br />
library to showcase community and national<br />
events.<br />
Library mascot<br />
The Library’s mascot, Fletcher Tuatara, visits schools<br />
with staff to inform students about the library and<br />
encourages them to become members/users. All<br />
new entrants in the district’s primary schools are<br />
invited to special library events throughout the<br />
<strong>year</strong> where they can join the library and receive a<br />
free book.<br />
Why we do it<br />
• To provide education, information, cultural and<br />
recreational resources and to minimise<br />
economic, social and cultural barriers to<br />
information access.<br />
• To provide a repository for local history<br />
reflecting the community's culture and diversity,<br />
including special collections of New Zealand,<br />
Maori and Polynesian history, for future<br />
generations, and information and books in<br />
European, Asian and Pacific languages.<br />
This <strong>year</strong>’s highlights and achievements<br />
included:<br />
• Library website - a new look library website was<br />
launched in October. The new format has<br />
made searching for library products and<br />
services much easier and has provided the<br />
library with more opportunities for marketing<br />
those services and products.<br />
• NZ book month – the library hosted two authors<br />
– Paul Thomas, and Dame Anne Salmond, and<br />
<strong>Rotorua</strong> <strong>District</strong> <strong>Council</strong> ANNUAL REPORT 2011/12<br />
29
<strong>District</strong> Library<br />
a presentation by a local police photographer<br />
of the book ‘Christchurch 22.2: Beyond the<br />
Cordon”.<br />
• Friends of the Library – funded the new signage<br />
on the Mobile Library $5,630; shelving for<br />
TeenZown $14,300; children’s holiday<br />
programme $1,500; and sponsorship for author<br />
visits $650.<br />
• E-audio books- Infoshare libraries purchased a<br />
selection of e-audio books as a co-operative<br />
venture. These are available online.<br />
• National film archive – Medianet - Friends of the<br />
Library have sponsored the setting up of this<br />
programme. The films go back to around 1906<br />
and make fascinating viewing. The database<br />
also includes old film and television advertising,<br />
including party political broadcasts, and as film<br />
is rescued and archived it will become<br />
available on the database.<br />
• Discover your library day - the Library opened<br />
on Sunday 31 July, the first Sunday opening<br />
since the 1920s. This one-off Sunday opening,<br />
10am – 4pm, was an opportunity for individuals<br />
and families to explore the Library. The day was<br />
run like any other opening day, but included<br />
special presentations and activities for all ages<br />
throughout the day. The day was hugely<br />
successful with more than 1,500 people<br />
participating.<br />
• <strong>Rotorua</strong> Business Community Services Award -<br />
was won by the Library in July 2011.<br />
• North Island Children’s and Teens Librarians<br />
Conference 2011 - the first of its kind in the North<br />
Island, held in <strong>Rotorua</strong>.<br />
Community Outcomes<br />
Excellent Facilities and Services<br />
• By providing an excellent facility and resources<br />
to the community that would not otherwise be<br />
provided by private enterprise<br />
Living Maori Culture<br />
• By fostering Maori cultural activities and<br />
expression<br />
• By respecting Te Arawa as part of the unique<br />
heritage of <strong>Rotorua</strong> <strong>District</strong><br />
Learning<br />
• By providing learning activities accessible for<br />
everyone<br />
• By providing excellent pre-school/infant<br />
facilities<br />
• By providing whanau supported learning<br />
• By encouraging literacy and lifelong learning,<br />
supporting formal and informal education<br />
Thriving<br />
• By providing leading edge activity events<br />
• By fostering artistic expression, art, music,<br />
dancing, public performances and exhibitions<br />
• By providing great facilities to visit<br />
What it cost us<br />
Operating expenses<br />
2012<br />
actual<br />
$000<br />
<strong>Annual</strong><br />
Plan<br />
$000<br />
2011<br />
actual<br />
$000<br />
Direct costs 2,904 3,004 2,925<br />
Financial costs 203 226 182<br />
Depreciation 853 903 782<br />
Other* 41 0 0<br />
Total costs 4,001 4,133 3,889<br />
Revenue<br />
Capital revenue 10 14 39<br />
General rates 0 0 0<br />
Fees and charges 297 341 329<br />
Investment income 0 0 0<br />
Subsidies and grants 3 0 0<br />
Targeted rates 0 0 0<br />
Other income* 0 0 0<br />
Total revenue 310 355 368<br />
Net cost of service 3,691 3,778 3,521<br />
Capital costs<br />
Renewals 488 509 352<br />
Growth 0 0 29<br />
Backlog 54 54 37<br />
Level of service 0 0 0<br />
Total capital 542 563 418<br />
Operational funding<br />
Net cost of service of<br />
general rate activities<br />
3,691 3,778 3,521<br />
Plus capital revenue 10 14 39<br />
Less depreciation -894 -903 -782<br />
Depreciation funded by<br />
general rates<br />
488 509 352<br />
Add back half share<br />
roading depreciation<br />
0 0 0<br />
Self funding/DC reserve<br />
movements<br />
0 0 0<br />
Operations funded by<br />
general rates<br />
3,295 3,398 3,130<br />
Capital funding<br />
Funding from<br />
depreciation (rates)<br />
488 509 352<br />
Loans from/(to)<br />
corporate fund<br />
54 54 37<br />
Capital grants 0 0 29<br />
Development<br />
contributions<br />
0 0 0<br />
Reserves net 0 0 0<br />
Asset sales 0 0 0<br />
Total capital 542 563 418<br />
* Non cash adjustments due to revaluation<br />
30 <strong>Rotorua</strong> <strong>District</strong> <strong>Council</strong> ANNUAL REPORT 2011/12
Capital expenditure<br />
2012<br />
actual<br />
$000<br />
Library asset replacement 1<br />
New books 541<br />
542<br />
Variance from budget<br />
• Direct costs show savings in plant and building<br />
maintenance, cleaning, postage, freight<br />
charges and subscriptions.<br />
• Fees and charges income is slightly lower than<br />
budget after an adjustment was made earlier<br />
in the <strong>year</strong> moving the income from rent for the<br />
third floor to internal recoveries.<br />
<strong>District</strong> Library<br />
How we performed<br />
Level of service Performance measures Target for 2011/12 Achievement Comments<br />
Library readily<br />
accessible to<br />
residents and visitors<br />
and meets the needs<br />
of the community.<br />
Maintain a collection<br />
of local Maori and<br />
European print<br />
resources for<br />
reference and study.<br />
Maintain collections<br />
of fiction and non<br />
fiction for information,<br />
education and<br />
recreation.<br />
Provide events that<br />
reflect the art and<br />
cultural interest of the<br />
community with a<br />
specific focus on<br />
literacy.<br />
% of population are<br />
members of the library.<br />
% of households who<br />
have used the library in<br />
the last 12 months.<br />
60% 59% (not achieved) Memberships not used are<br />
regularly deleted and there<br />
were twice the number<br />
deleted this financial <strong>year</strong> –<br />
2,279.<br />
75% 76% (achieved)<br />
<strong>Annual</strong> visits per capita. 5.5 5.58 per capita<br />
(achieved)<br />
% of residents who are<br />
very/fairly satisfied with<br />
the level of service (as<br />
measured by community<br />
satisfaction survey).<br />
% of published and<br />
unpublished print material<br />
reflecting <strong>Rotorua</strong>’s<br />
heritage and culture<br />
purchased each <strong>year</strong>.<br />
Average annual items<br />
issued per capita<br />
Number of items<br />
purchased p.a. per<br />
capita.<br />
Number of childrens<br />
programmes per <strong>year</strong>.<br />
Number of teens’<br />
programmes per <strong>year</strong>.<br />
Number of ‘toddler time’<br />
sessions per week during<br />
term time.<br />
Number of guest authors<br />
per <strong>year</strong>.<br />
86% 87% (achieved)<br />
379,366 people visited the<br />
library and the mobile<br />
library. A further 97,289<br />
visited the website.<br />
100% Achieved National Bibliography is<br />
regularly scanned to ensure<br />
these collections are<br />
maintained – all known<br />
sources of supply are<br />
checked for publications<br />
and any local material, self<br />
published or printed, is<br />
included.<br />
11 10.37 (not achieved) There were 705,726 items<br />
(10.37 per capita) issued for<br />
the <strong>year</strong>. Biggest downturn<br />
is in issues of rental fiction<br />
and could be reflection of<br />
the current economic<br />
climate.<br />
0.28 0.29 (achieved) There was a total of 20,257<br />
(0.29 per capita) purchased<br />
during 2011/12.<br />
4 pa Achieved There were 4 childrens<br />
programmes held in July,<br />
September, December/<br />
January and April.<br />
3 pa 7 pa (achieved) There were 7 teens’ library<br />
programmes held during the<br />
<strong>year</strong>, including special ones<br />
for NZ Music Month and NZ<br />
Book Month.<br />
2 per week Achieved Rhyme ‘n’ Rumpus sessions<br />
were held 2 days each<br />
week throughout the <strong>year</strong>.<br />
7 pa Achieved Dame Anne Salmond, Max<br />
Cryer, Paul Thomas, Paul<br />
Holmes, Stacy Gregg,<br />
Auntie Bea and Nick<br />
Voysey, police<br />
photographer involved with<br />
the creation of the book<br />
“22.2 Christchurch; Beyond<br />
the Cordon”.<br />
<strong>Rotorua</strong> <strong>District</strong> <strong>Council</strong> ANNUAL REPORT 2011/12<br />
31
<strong>District</strong> Library<br />
Community satisfaction survey<br />
The graphs below have been prepared from the annual Community Satisfaction Survey.<br />
Library<br />
Library<br />
100%<br />
86% 85%<br />
83%<br />
87%<br />
75% 68%<br />
82%<br />
66% 63%<br />
66%<br />
% very / fairly satisfied<br />
75%<br />
50%<br />
25%<br />
% very satisfied<br />
60%<br />
45%<br />
30%<br />
15%<br />
0%<br />
2008 2009 2010 2011 2012<br />
0%<br />
RDC<br />
2011<br />
RDC<br />
2012<br />
Peer<br />
Group<br />
National<br />
Average<br />
This graph shows the percentage of survey respondents very<br />
or fairly satisfied with this service over the last five <strong>year</strong>s.<br />
This graph shows the percentage of survey respondents “very”<br />
satisfied with this service over the last two <strong>year</strong>s and compares<br />
it with our peer group and the national average for 2012.<br />
32 <strong>Rotorua</strong> <strong>District</strong> <strong>Council</strong> ANNUAL REPORT 2011/12
Emergency Management<br />
3. Response - Actions taken immediately before,<br />
during or directly after a civil defence<br />
emergency to save lives and protect property,<br />
and to help communities recover.<br />
4. Recovery - The coordinated efforts and<br />
processes to bring about the immediate,<br />
medium-term and long-term holistic<br />
regeneration of a community following a civil<br />
defence emergency.<br />
Emergency Management<br />
What we do<br />
This activity covers Civil Defence and Rural Fire.<br />
Civil Defence<br />
The Civil Defence Emergency Management<br />
(CDEM) Act 2002 requires <strong>Rotorua</strong> <strong>District</strong> <strong>Council</strong><br />
to be responsible for civil defence emergency<br />
management within its boundaries. <strong>Rotorua</strong> is a<br />
member of the Bay of Plenty (BOP) CDEM Group<br />
and is involved in strategic and operational<br />
planning for the region. A new BOP CDEM Group<br />
Plan has been prepared.<br />
The local <strong>Rotorua</strong> <strong>District</strong> <strong>Council</strong> plan meets the<br />
obligations of the CDEM Act and is consistent with<br />
the BOP CDEM Group Plan. New Zealand has an<br />
integrated approach to CDEM, known as the ‘4Rs’<br />
i.e:<br />
1. Reduction - Identifying and analysing long-term<br />
risks to human life and property from hazards;<br />
taking steps to eliminate these risks if practical,<br />
and, if not, reducing the magnitude of their<br />
impact and the likelihood of occurrence.<br />
Rural Fire<br />
The National Rural Fire Authority established a<br />
steering committee of Central North Island rural fire<br />
authorities, with representation from forest owners,<br />
Department of Conservation and territorial<br />
authorities, to develop a proposal for an Enlarged<br />
Rural Fire <strong>District</strong> for the Central North Island. The<br />
proposal was designed to:<br />
• Clarify accountabilities and responsibilities for<br />
improving the effectiveness and efficiency of rural<br />
fire management by reducing duplication and<br />
improving the utilisation of existing resources;<br />
• Improve the capability and capacity of the fire<br />
authorities by pooling and sharing resources and<br />
expertise;<br />
• Increase the safety of the rural communities by<br />
providing better leadership and advice to<br />
landowners and the public, and creating a<br />
greater awareness of fire threats and risks in the<br />
region;<br />
• Improve the ability of fire authorities to comply<br />
with statutory obligations and meet the<br />
performance standards of the New Zealand Fire<br />
Service Commission;<br />
• Enhance integration of fire management<br />
principles, policies, plans and practices for fire<br />
management and administration across different<br />
land uses and owners of rural landscape.<br />
A proposal submitted for consultation<br />
recomm<strong>ended</strong> a hybrid structure. Submissions<br />
have been heard by the steering committee.<br />
More work is required on the details before a<br />
revised proposal referenced back to the New<br />
Zealand Fire Service for gazetting.<br />
Why we do it<br />
To support community wellbeing at a local,<br />
regional or national level through effective<br />
planning, training and education.<br />
2. Readiness - Developing operational systems<br />
and capabilities before a civil defence<br />
emergency happens; including self-help and<br />
response programmes for the general public,<br />
and specific programmes for emergency<br />
services, lifeline utilities and other agencies.<br />
<strong>Rotorua</strong> <strong>District</strong> <strong>Council</strong> ANNUAL REPORT 2011/12<br />
33
Emergency Management<br />
This <strong>year</strong>’s highlights and achievements<br />
included:<br />
• Minister for Civil Defence Emergency<br />
Management – Chris Tremaine visited <strong>Rotorua</strong><br />
and made comment on us having some best<br />
practice initiatives as identified in the National<br />
Capability Assessment <strong>Report</strong>.<br />
• Promotion of civil defence – a number of events<br />
att<strong>ended</strong> to promote civil defence including<br />
the Tipu Ora Whanau Day at the Village Green<br />
and the Home & Garden Show. The Bay Trust<br />
Helicopter open day proved very popular and<br />
was the source of 10 new recruits to the<br />
<strong>Rotorua</strong> Emergency Response Team.<br />
• Local community response plans – being<br />
developed by committees at Rotoma,<br />
Kaharoa, Hamurana, Rerewhakaaitu and<br />
Reporoa.<br />
Community Outcomes<br />
What it cost us<br />
Operating expenses<br />
2012<br />
actual<br />
$000<br />
<strong>Annual</strong><br />
Plan<br />
$000<br />
2011<br />
actual<br />
$000<br />
Direct costs 529 542 470<br />
Financial costs 8 6 3<br />
Depreciation 101 44 39<br />
Other* 19 0 0<br />
Total costs 657 592 512<br />
Revenue<br />
Capital revenue 0 60 0<br />
General rates 0 0 0<br />
Fees and charges 2 0 1<br />
Investment income 0 0 0<br />
Subsidies and grants 16 6 7<br />
Targeted rates 0 0 0<br />
Other income* 0 0 0<br />
Total revenue 18 66 8<br />
Safe and Caring - CDEM<br />
• CDEM awareness is promoted throughout the<br />
community by talks/presentations to schools,<br />
early learning centres, community groups,<br />
businesses and other organisations<br />
• Effective liaison is maintained with local<br />
emergency service personnel, including joint<br />
search and rescue activities. CDEM is a<br />
member of the Emergency Services<br />
Coordinating Committee<br />
• CDEM is a member of the RDC Community<br />
Safety Forum, Treasure <strong>Rotorua</strong> Steering<br />
Committee, Emergency Services Coordinating<br />
Committee and Lakes DHB key stakeholder<br />
forum<br />
Safe and Caring - Rural Fire<br />
• By providing bylaws that protect people,<br />
property and the environment form fire<br />
• By providing education around lighting fires in<br />
rural areas<br />
• By communicating with the community on<br />
reporting of fires and the control of fire<br />
Net cost of service 639 526 504<br />
Capital costs<br />
Renewals 1 152 2<br />
Growth 0 0 0<br />
Backlog 0 0 0<br />
Level of service 0 0 0<br />
Total capital 1 152 2<br />
Operational funding<br />
Net cost of service of<br />
general rate activities<br />
639 526 504<br />
Plus capital revenue 0 0 0<br />
Less depreciation -119 -44 -39<br />
Depreciation funded by<br />
general rates<br />
1 152 2<br />
Add back half share<br />
roading depreciation<br />
0 0 0<br />
Self funding/DC reserve<br />
movements<br />
0 0 0<br />
Operations funded by<br />
general rates<br />
521 634 467<br />
Capital funding<br />
Funding from<br />
depreciation (rates)<br />
1 74 2<br />
Loans from/(to)<br />
corporate fund<br />
0 0 0<br />
Capital grants 0 78 0<br />
Development<br />
contributions<br />
0 0 0<br />
Reserves net 0 0 0<br />
Asset sales 0 0 0<br />
Total capital 1 152 2<br />
* Non cash adjustments due to revaluation<br />
34 <strong>Rotorua</strong> <strong>District</strong> <strong>Council</strong> ANNUAL REPORT 2011/12
Capital expenditure<br />
2012<br />
actual<br />
$000<br />
Printers 1<br />
How we performed<br />
1<br />
Variance from budget<br />
• Direct costs are lower than budget due to<br />
consultation fees and travel not being required.<br />
This is associated with a lower level of regional<br />
activities.<br />
• Subsidies and grants are favourable compared<br />
to budget due to a higher level of subsidy<br />
received.<br />
Emergency Management<br />
Level of Service Performance measures Target for 2011/12 Achievement Comments<br />
Reduction<br />
Reduce the long-term<br />
risk to human life or<br />
property arising from all<br />
hazards.<br />
Readiness<br />
Training and resources<br />
in place (plans, training<br />
exercises, standard<br />
operating procedures<br />
(SOPs) and equipment<br />
or access to them).<br />
Response<br />
Action immediately<br />
before, during or<br />
directly after an<br />
emergency that can<br />
save lives, minimise<br />
property damage, or<br />
improve recovery.<br />
Recovery<br />
Training and<br />
resources/contacts in<br />
place (plans, training<br />
exercises, SOPs) to<br />
recover.<br />
Rural Fire<br />
Protection of people,<br />
property and the<br />
environment from the<br />
hazards of fire by<br />
prevention, suppression<br />
and control in rural<br />
areas.<br />
% of hazard maps<br />
reviewed, and changes<br />
to the hazardscape<br />
recorded and updated<br />
annually.<br />
Number of locally run<br />
exercises each <strong>year</strong> (desk<br />
top and full mobilisation<br />
of local EOC).<br />
Availability of Emergency<br />
Management<br />
Coordinator or acting<br />
EMC.<br />
Current database of<br />
trained personnel.<br />
% of plans/strategies are<br />
current and approved by<br />
Bay of Plenty CDEM<br />
Group.<br />
Rural Fire forces trained<br />
and equipped.<br />
Database of current fire<br />
permits kept up to date.<br />
Fire plan updated and<br />
certified annually.<br />
100% Achieved with<br />
review of <strong>District</strong><br />
Plan<br />
1 desk top exercise<br />
1 exercise involving<br />
the full mobilisation<br />
of local emergency<br />
operations centre<br />
Not achieved in<br />
entirety<br />
All hazard maps reviewed<br />
by GNS and published in<br />
<strong>District</strong> Plan.<br />
Desk top exercises have<br />
taken place including an<br />
exercise with the full<br />
Incident Management<br />
Team. Full mobilisation has<br />
not occurred due to the<br />
delay in receiving the<br />
national EMIS programme<br />
and structure review both at<br />
local and regional level. A<br />
date has been set (26 Sept)<br />
for a full mobilisation.<br />
100% Achieved EMC and alternate<br />
available to cover 24/7.<br />
100% Achieved Trained staff recorded<br />
through HR and volunteers<br />
through the Emergency<br />
Management office.<br />
100% Not achieved All plans are to be consistent<br />
with Group Plans and there<br />
have been notable delays<br />
in the review of these<br />
documents. However<br />
existing RDC plans are still<br />
accepted as current until<br />
reviewed with any<br />
necessary amendments<br />
made.<br />
100% Achieved Forced trained to minimum<br />
standard.<br />
100% Achieved Database kept up to date –<br />
352 permits issued since start<br />
of fire season.<br />
By 1 October each<br />
<strong>year</strong><br />
Achieved<br />
Fire plan updated.<br />
<strong>Rotorua</strong> <strong>District</strong> <strong>Council</strong> ANNUAL REPORT 2011/12<br />
35
Governance and Strategic Direction<br />
Governance and Strategic Direction<br />
What we do<br />
This activity covers a range of specific functions<br />
and is also the home of corporate leadership,<br />
planning and the technical and administrative<br />
support for <strong>Council</strong>’s many services. The focus<br />
areas include:<br />
• Chief Executive Group<br />
• Corporate Planning and Support<br />
• Corporate Property<br />
• Customer Centre<br />
• Democracy<br />
• Financial Services<br />
• Human Resources<br />
• Information Services<br />
• Kaupapa Maori<br />
• Land Information Services<br />
• Procurement and Sustainability<br />
• Records<br />
The role of this activity is to:<br />
• Provide leadership for council and the<br />
community.<br />
• Provide technical and administrative advice<br />
and support to elected members representing<br />
the <strong>Rotorua</strong> district.<br />
• Provide opportunities for public participation<br />
and involvement in decision-making and<br />
determining priorities and projects to meet<br />
community needs and aspirations.<br />
• Ensure our internal systems and processes are<br />
up-to-date and capable of supporting and<br />
enabling the organisation to perform its key<br />
tasks effectively and efficiently.<br />
• Manage three-<strong>year</strong>ly council elections.<br />
• Provide advice and assistance in the<br />
development of council policies which affect<br />
Maori and promote awareness and<br />
understanding of Maori culture and protocols.<br />
• Facilitate communication with Maori on issues<br />
and decisions that directly or indirectly affect<br />
them.<br />
• Manage council’s relationship with Te Arawa<br />
and tangata whenua and advise the council<br />
on protocol and Tikanga Maori.<br />
• Provide excellence in first contact customer<br />
service focused on getting it right first time,<br />
listen, respond promptly and take responsibility.<br />
• Provide easy access to council and district<br />
information via the internet by increasing online<br />
services including online transactions, web and<br />
social media.<br />
• Provide an overarching framework to consider<br />
sustainability across all of the council's functions<br />
by ensuring the prudent use and management<br />
of all resources balanced with the<br />
consideration and integration of environmental,<br />
social, cultural and economic wellbeing.<br />
• Deliver value for money in relation to the<br />
purchasing function in an open and<br />
transparent manner, managing risk and with<br />
adequate probity.<br />
Why we do it<br />
To provide the organisation and community with<br />
inspiring, competent leadership and direction; to<br />
ensure public awareness of and engagement in<br />
the council’s decision making processes; and to<br />
provide high quality governance, technical and<br />
administrative advice and support to elected<br />
members and staff.<br />
This <strong>year</strong>’s highlights and achievements<br />
included:<br />
• Overseas delegations – hosted 75 delegations,<br />
up from 33 the <strong>year</strong> prior.<br />
• Long-term Plan – council adopted its Long-term<br />
Plan 2012-2022. 443 written submissions were<br />
received of which 86 submitters were heard.<br />
Following changes made to Draft Long-term<br />
Plan the final still maintained a 2.9% average<br />
rate increase. The Long-term Plan received a<br />
clear audit report from Audit New Zealand.<br />
• By-election – following a <strong>Council</strong>lor resignation<br />
a by-election to elect incoming <strong>Council</strong>lor<br />
Merepeka Raukawa Tait was successfully<br />
undertaken.<br />
• Iwi Partners MOUs – following signing of these<br />
co-ordination and facilitation of the MOUs by<br />
way of hui to continue dialogue between the<br />
groups and RDC and to honour the intent of<br />
the MOUs.<br />
• Kaupapa Maori representation – actively<br />
involved/represented or facilitated in a number<br />
of events representing <strong>Council</strong> and the <strong>Rotorua</strong><br />
<strong>District</strong> including: opening of Don Stafford Wing<br />
of the <strong>Rotorua</strong> Museum, opening of No 1<br />
Queen Street, Auckland, opening of Rugby<br />
World Cup in <strong>Rotorua</strong>, the relocation of Pukaki<br />
to the <strong>Rotorua</strong> Museum to name but a few.<br />
36 <strong>Rotorua</strong> <strong>District</strong> <strong>Council</strong> ANNUAL REPORT 2011/12
• Lean Thinking – adopted a model of Lean<br />
Thinking to improve upon customer services<br />
and for obtaining and recognize savings by<br />
way of identifying and eliminating waste within<br />
processes.<br />
• All of Government procurement contracts -<br />
council is actively procuring products and<br />
services under this arrangement since central<br />
government opened up this opportunity to<br />
local government earlier last <strong>year</strong>. Savings are<br />
being achieved under the contracts for<br />
vehicles; office supplies; computers, air travel<br />
and multi function devices and printers. This<br />
has equated to $270,000 in net savings this<br />
<strong>year</strong>.<br />
Community Outcomes<br />
Visionary Community Leadership<br />
• By informing the community via <strong>Annual</strong> Plan,<br />
Long-term Plan, <strong>District</strong> News etc on<br />
developments and ideas that may lead to the<br />
district’s future<br />
• By going out to community groups, ratepayer<br />
associations etc to inform and engage with the<br />
community on topical issues.<br />
Living Maori Culture<br />
• By making decisions that respond to or plan for<br />
current and future community needs.<br />
• By increasing the organisation’s capacity to<br />
consult, inform and respond to concerns raised<br />
by Maori.<br />
• By undertaking the role of caretaker for many<br />
of the district’s resources, for todays and future<br />
generations.<br />
What it cost us<br />
Operating expenses<br />
2012<br />
actual<br />
$000<br />
<strong>Annual</strong><br />
Plan<br />
$000<br />
2011<br />
actual<br />
$000<br />
Direct costs 2,597 2,688 2,562<br />
Financial costs 224 19 466<br />
Depreciation 2,073 2,167 2,483<br />
Other* 1,022 0 -63<br />
Total costs 5,916 4,874 5,448<br />
Revenue<br />
Capital revenue 0 0 0<br />
General rates 0 0 0<br />
Fees and charges 968 905 1,021<br />
Investment income 71 0 78<br />
Subsidies and grants 23 100 4<br />
Targeted rates 47 50 42<br />
Other income* 0 6 1<br />
Total revenue 1,109 1,061 1,146<br />
Net cost of service 4,807 3,813 4,302<br />
Capital costs<br />
Renewals 1,021 1,182 422<br />
Growth 20 11 641<br />
Backlog 0 0 0<br />
Level of service 1,757 1,015 1,704<br />
Total capital 2,798 2,208 2,767<br />
Operational funding<br />
Net cost of service of<br />
general rate activities<br />
4,807 3,813 4,302<br />
Plus capital revenue 0 0 0<br />
Less depreciation -2,611 -2,167 -2,559<br />
Depreciation funded by<br />
general rates<br />
1,021 1,182 422<br />
Add back half share<br />
roading depreciation<br />
0 0 0<br />
Self funding/DC reserve<br />
movements<br />
0 0 0<br />
Operations funded by<br />
general rates<br />
3,217 2,828 2,165<br />
Governance and Strategic Direction<br />
Capital funding<br />
Funding from<br />
depreciation (rates)<br />
1,021 1,182 422<br />
Loans from/(to)<br />
corporate fund<br />
1,757 1,015 2,346<br />
Capital grants 20 11 0<br />
Development<br />
contributions<br />
0 0 0<br />
Reserves net 0 0 0<br />
Asset sales 0 0 0<br />
Total capital 2,798 2,208 2,768<br />
* Non cash adjustments due to revaluation<br />
<strong>Rotorua</strong> <strong>District</strong> <strong>Council</strong> ANNUAL REPORT 2011/12<br />
37
Governance and Strategic Direction<br />
Capital expenditure<br />
2012<br />
actual<br />
$000<br />
Photocopier 3<br />
Contract management 53<br />
e-services 80<br />
Hansen 8 33<br />
HR system 13<br />
Library website redevelopment 2<br />
New system 18<br />
RDC website 130<br />
Software development Ozone 14<br />
Imaging 106<br />
Orthophotography 85<br />
Core hardware replacements 395<br />
Desktop replacement 23<br />
Hardware new 59<br />
Hardware replacement 29<br />
Network new 3<br />
Network replacement 3<br />
Server replacement 7<br />
Services new 1<br />
Software replacement 1<br />
Storage new 22<br />
Civic building renewal 21<br />
Electrical 33<br />
Floor coverings 12<br />
Land purchases 1,626<br />
Mechanical plant 26<br />
2,798<br />
Variance from budget<br />
• Direct costs are favourable to budget due to<br />
the disestablishment of the Business Partnerships<br />
Manager role but overspent in services<br />
received as a result of holding a by-election;<br />
costs related to the Pressure on the Lakes<br />
survey, audit fees for the Long-term Plan 2012-<br />
2022, software maintenance costs and<br />
unexpected building maintenance.<br />
• Fees and charges are favourable to budget.<br />
The Increase in revenue is due to a higher than<br />
budgeted recovery from Land Information NZ<br />
and related legal costs, rent reviews on a<br />
number of commercial leases and new rental<br />
income from the acquisition of new properties.<br />
• The increase in Investment income relates to<br />
unbudgeted finance income.<br />
• Other income relates to non cash asset<br />
adjustment entries.<br />
How we performed<br />
Level of service Performance measures Target for 2011/12 Achievement Comments<br />
Governance,<br />
Leadership and<br />
Decision making.<br />
% of residents satisfied with<br />
<strong>Council</strong>’s decisions and<br />
actions 1 .<br />
% of residents rate level of<br />
council information to be<br />
sufficient 1 .<br />
73% 66% (not achieved)<br />
65% 64% (not achieved)<br />
Triennial election held without<br />
successful appeal.<br />
N/A<br />
N/A<br />
Review options for local<br />
government in <strong>Rotorua</strong><br />
district.<br />
N/A<br />
N/A<br />
Encourage the<br />
preservation and<br />
sustainable<br />
development of Maori<br />
resources.<br />
Provide funding and<br />
assistance for the preparation<br />
of Mana Whenua plans.<br />
1 Mana Whenua<br />
plan is produced for<br />
the <strong>year</strong><br />
Not achieved<br />
6 applications<br />
received. Plans still in<br />
progress.<br />
Foster partnership<br />
between <strong>Council</strong> and<br />
Maori on matters of<br />
mutual interest.<br />
Hold a workshop between<br />
Maori and <strong>Council</strong> to discuss<br />
matters of mutual interest.<br />
1 As measured by annual community satisfaction survey<br />
1 workshop per <strong>year</strong> Achieved 2 workshops held.<br />
38 <strong>Rotorua</strong> <strong>District</strong> <strong>Council</strong> ANNUAL REPORT 2011/12
Economic and Regulatory Services<br />
Group<br />
Contribution to outcomes<br />
Visionary Community<br />
Leadership<br />
Community Outcomes<br />
Page Activities within this group<br />
42 Animal Control <br />
45 Building Services <br />
Safe and caring<br />
Prosperous economy<br />
Environment<br />
Excellent facilities<br />
and services<br />
48 City Services Operations <br />
52 Economic Development <br />
54<br />
Environmental Planning<br />
Implementation<br />
<br />
57 Environmental Planning Policy <br />
59 Events and Venues <br />
62 Inspection <br />
66 Parking Enforcement <br />
68 <strong>Rotorua</strong> Museum <br />
73 Tourism <br />
Living Maori culture<br />
Thriving<br />
Healthy<br />
Learning<br />
Economic and Regulatory Services Group<br />
Overview of group<br />
The Economic and Regulatory Services Group<br />
underpins <strong>Council</strong>’s refreshed focus on a ‘whole of<br />
council’ approach to sustainable economic<br />
growth positioning itself in the best position possible<br />
to fulfil its critical role as one of the major<br />
influencers of <strong>Rotorua</strong>’s sustainable economic<br />
growth environment.<br />
Significant emphasis, through the economic and<br />
regulatory activities is being placed on <strong>Rotorua</strong><br />
<strong>District</strong> <strong>Council</strong> contributing to the roles identified<br />
in the <strong>Rotorua</strong> Sustainable Economic Growth<br />
Strategy.<br />
At a high level, <strong>Rotorua</strong> <strong>District</strong> <strong>Council</strong>’s role is<br />
focussed in four main areas:<br />
1. Setting a clear sustainable economic growth<br />
strategic direction;<br />
2. Creating an enabling regulatory policy<br />
environment that takes a sustainable<br />
approach to the management of the district’s<br />
physical and natural environment while<br />
supporting the strategic direction;<br />
3. Investing in Infrastructure and services that<br />
support the development of the strategic<br />
direction;<br />
4. Backing this approach with a customer<br />
friendly, can-do approach to delivery of<br />
services related to the strategic direction.<br />
The Economic and Regulatory Services Group<br />
contributes to <strong>Rotorua</strong> <strong>District</strong> <strong>Council</strong>’s role<br />
through the following key areas:<br />
• Alignment of regulatory and land-use planning<br />
policy with the sustainable growth strategy of<br />
the district.<br />
• Creation of an enabling regulatory function<br />
with a focus on an effective, efficient and<br />
customer-friendly can-do approach to doing<br />
business.<br />
• Promotion of the destination as a great place<br />
to visit, live, work, invest and do business.<br />
• Committing resources to sustainable economic<br />
growth initiatives in areas where <strong>Rotorua</strong> has a<br />
sustainable competitive advantage and where<br />
<strong>Rotorua</strong> <strong>District</strong> <strong>Council</strong> can genuinely<br />
influence outcomes in a manner that will<br />
complement and/or stimulate private sector<br />
investment opportunities.<br />
• A set of integrated CBD focussed actions and<br />
investments designed to contribute to the vision<br />
of “creating a public space where residents<br />
and visitors can enjoy recreation, outdoor<br />
<strong>Rotorua</strong> <strong>District</strong> <strong>Council</strong> ANNUAL REPORT 2011/12<br />
39
Economic and Regulatory Services Group<br />
dining, retailing and entertainment activities<br />
within a safe and attractive setting.”<br />
• Provision of high quality conference and event<br />
facilities and management services for the<br />
<strong>Rotorua</strong> community which support endeavours<br />
to attract large, high-yield local, regional,<br />
national and international events and<br />
conferences.<br />
• Provision of a world class museum experience.<br />
• Reducing the net cost to the ratepayer of those<br />
functions that can operate on a more<br />
commercially sustainable basis.<br />
• Leading in aligning local sustainable economic<br />
growth plans and initiatives with key players at<br />
the regional and national level.<br />
• Supporting the efforts of external sector<br />
focussed entities charged with assisting in the<br />
creation of a sustainable economic growth<br />
environment including the <strong>Rotorua</strong> Tourism<br />
Committee and the economic development<br />
council controlled organisation (CCO.)<br />
This group is made up of the following activities of<br />
<strong>Council</strong>:<br />
• Building Services<br />
• Economic Development (Economic Projects,<br />
City Services, Destination Marketing, Travel<br />
Office)<br />
• Planning Services<br />
• Regulatory Services; (Parking Enforcement,<br />
Health Inspection including noise, liquor<br />
licensing and Animal Control)<br />
• Events & Venues<br />
• <strong>Rotorua</strong> Museum - Te Whare Taonga o Te<br />
Arawa<br />
Issues/risks/negative impacts<br />
Potential negative effects associated with<br />
undertaking the activities within this group have<br />
been assessed and it is believed that there has<br />
been no impact to the social, cultural,<br />
environmental and economic well-being of the<br />
community/district during the <strong>year</strong>. potential<br />
effects were reviewed in preparing the Long-term<br />
Plan. these will be monitored and reported upon<br />
in future annual reports.<br />
Performance targets<br />
Targets Achieved<br />
Not Not<br />
measured achieved<br />
Animal Control 3 3 - -<br />
Building Services 5 4 - 1<br />
City Services Operations 4 4 - -<br />
Economic Development 6 2 3 1<br />
Environmental Planning Implementation 9 8 - 1<br />
Environmental Planning Policy 6 5 - 1<br />
Events and Venues 7 7 - -<br />
Inspection 8 6 - 2<br />
Parking Enforcement 2 2 - -<br />
<strong>Rotorua</strong> Museum 9 9 - -<br />
Tourism 9 5 2 2<br />
Total 68 55 5 8<br />
Targets not measured in the Economic<br />
Development activity are due to the projects/<br />
programmes being discontinued. In Tourism two<br />
targets are no longer measured due to Tourism<br />
New Zealand no longer reporting some statistics<br />
and the disestablishment of the Tourism Advisory<br />
Board.<br />
Targets not achieved in Inspection are a result of<br />
complaints that were not responded to within one<br />
working day. Economic Development and Tourism<br />
targets not achieved are attributed to a decline in<br />
international visitor activity as a result of the<br />
Christchurch earthquake and the continued<br />
economic downturn.<br />
40 <strong>Rotorua</strong> <strong>District</strong> <strong>Council</strong> ANNUAL REPORT 2011/12
Net cost of service<br />
$ in thousands<br />
Animal Control<br />
Building Services<br />
City Services<br />
Economic Development<br />
Environmental Planning Implementation<br />
Environmental Planning Policy<br />
Events and Venues<br />
Inspection<br />
-$521<br />
<strong>Rotorua</strong> Museum<br />
$445<br />
$647<br />
Parking Enforcement<br />
$1,218<br />
$1,375<br />
$1,485<br />
$1,551<br />
$1,204<br />
$2,601<br />
$3,104<br />
Economic and Regulatory Services Group<br />
Tourism<br />
$764<br />
-$1,000 -$500 $- $500 $1,000 $1,500 $2,000 $2,500 $3,000 $3,500<br />
Capital expenditure<br />
$ in thousands<br />
City Services Operations<br />
$92<br />
Economic Development<br />
$1<br />
Events and Venues<br />
$412<br />
Inspection<br />
$20<br />
<strong>Rotorua</strong> Museum<br />
$1,868<br />
Tourism<br />
$18<br />
$- $200 $400 $600 $800 $1,000 $1,200 $1,400 $1,600 $1,800 $2,000<br />
<strong>Rotorua</strong> <strong>District</strong> <strong>Council</strong> ANNUAL REPORT 2011/12<br />
41
Animal Control<br />
Animal Control<br />
Pound keeping function<br />
Dogs found wandering are impounded so they do<br />
not continue to be a nuisance and a risk to the<br />
public. They are kept in humane conditions. Those<br />
dogs not claimed by their owners after seven days<br />
from the date of impounding are disposed of.<br />
What we do<br />
• Register dogs in the district.<br />
• Provide a complaint resolution service in<br />
relation to uncontrolled dogs.<br />
• Control the number of dogs kept on individual<br />
properties in the urban area through a kennel<br />
licensing regime.<br />
• Undertake mobile patrols to apprehend and<br />
impound wandering dogs.<br />
• Provide an animal pound facility for the safe<br />
and humane containment of dogs and stock<br />
found wandering (1,900 dogs impounded each<br />
<strong>year</strong>; 800 dogs euthanised each <strong>year</strong>).<br />
• Respond immediately to reports of livestock<br />
wandering in public places.<br />
• Provide an educational programme on dog<br />
control which is available on an ‘on demand’<br />
basis to primary and intermediate schools in<br />
<strong>Rotorua</strong> district.<br />
Control function<br />
This involves registration of dogs, investigation and<br />
resolution of nuisance complaints, inspection of<br />
kennelling standards and the development and<br />
implementation of a council policy on dogs.<br />
An education programme on dog control is<br />
provided and available on a demand basis to<br />
primary and intermediate schools in <strong>Rotorua</strong><br />
<strong>District</strong>.<br />
Stray stock are impounded so they do not<br />
continue to be a nuisance or a public safety risk on<br />
roads and other public places. They are kept and<br />
fed until returned to owners, or disposed of by<br />
public auction.<br />
Why we do it<br />
To enhance the safety of the public by the control<br />
of nuisance dogs and stock wandering in public<br />
places. In addition both the Dog Control Act 1996<br />
and the Impounding Act 1953 place specific<br />
statutory functions on territorial authorities.<br />
This <strong>year</strong>’s highlights and achievements<br />
included:<br />
• Dogs on-line – successfully launched on 1 June.<br />
Dogs on-line will mean a more user friendly and<br />
accessible way to register dogs, saving dog<br />
owners time and the inconvenience of having<br />
to come into council. With microchipping of<br />
dogs, dog owners will be reunited with their<br />
dogs quicker should they go missing.<br />
• Microchipped dogs - 411 dogs were<br />
microchipped at the pound during the period.<br />
• Registered dogs - 10,833 dogs were registered<br />
to the end of the reporting period. This figure<br />
represents an increase of 439 registered dogs<br />
compared with the previous <strong>year</strong>.<br />
Community Outcomes<br />
Safe and Caring<br />
• By providing safe public places free from<br />
uncontrolled dogs and wandering stock.<br />
Environment<br />
• By facilitating the use and enjoyment of the<br />
natural environment without threat of<br />
uncontrolled dogs.<br />
42 <strong>Rotorua</strong> <strong>District</strong> <strong>Council</strong> ANNUAL REPORT 2011/12
What it cost us<br />
Operating expenses<br />
2012<br />
actual<br />
$000<br />
<strong>Annual</strong><br />
Plan<br />
$000<br />
2011<br />
actual<br />
$000<br />
Direct costs 1,084 1,035 858<br />
Financial costs 1 1 0<br />
Depreciation 4 4 6<br />
Other* 0 0 2<br />
Total costs 1,089 1,040 866<br />
Revenue<br />
Capital revenue 0 0 0<br />
General rates 0 0 0<br />
Fees and charges 644 633 560<br />
Investment income 0 0 0<br />
Subsidies and grants 0 0 0<br />
Targeted rates 0 0 0<br />
Other income* 0 0 0<br />
Total revenue 644 633 560<br />
Variance from budget<br />
• Direct costs are higher than budget due to<br />
increased costs for collars and tags, levies and<br />
Court filing fees.<br />
• Fees and charges are favourable to budget<br />
due to more dog registrations and microchip<br />
fees.<br />
Animal Control<br />
Net cost of service 445 407 306<br />
Operational funding<br />
Net cost of service of<br />
general rate activities<br />
445 407 306<br />
Plus capital revenue 0 0 0<br />
Less depreciation -4 -4 -7<br />
Depreciation funded by<br />
general rates<br />
0 0 0<br />
Add back half share<br />
roading depreciation<br />
0 0 0<br />
Self funding/DC reserve<br />
movements<br />
0 0 0<br />
Operations funded by<br />
general rates<br />
441 403 299<br />
* Non cash adjustments due to revaluation<br />
How we performed<br />
Level of Service Performance measures Target for 2011/12 Achievement Comments<br />
Provide a dog<br />
registration service.<br />
Ensure dog complaints<br />
are actioned.<br />
Ensure stock complaints<br />
are actioned.<br />
% of known dogs registered<br />
by 30 June (measured by<br />
monitoring and auditing of<br />
registration data).<br />
% of complaints responded to<br />
within 1½ working days<br />
(measured by monitoring and<br />
auditing of complaints<br />
register).<br />
% of complaints about<br />
wandering stock responded<br />
to immediately (measured by<br />
monitoring and auditing of<br />
complaints register).<br />
> 97.5% 99% (achieved) 10,833 out of 10,983<br />
dogs registered.<br />
Significant promotion<br />
was undertaken about<br />
registering dogs. This<br />
promotional work will be<br />
continued in following<br />
<strong>year</strong>s.<br />
100% 100% (achieved) 4443 / 4443 complaints<br />
responded to within 1½<br />
working days.<br />
100% 100% (achieved) 257 / 257 complaints<br />
responded to<br />
immediately.<br />
<strong>Rotorua</strong> <strong>District</strong> <strong>Council</strong> ANNUAL REPORT 2011/12<br />
43
Animal Control<br />
Community satisfaction survey<br />
The graphs below have been prepared from the annual Community Satisfaction Survey.<br />
Dog control<br />
Dog control<br />
% very / fairly satisfied<br />
90%<br />
77%<br />
73%<br />
77% 75% 77%<br />
75%<br />
60%<br />
45%<br />
30%<br />
15%<br />
% very satisfied<br />
40%<br />
30% 26%<br />
28%<br />
20%<br />
10%<br />
36% 35%<br />
0%<br />
2008 2009 2010 2011 2012<br />
0%<br />
RDC<br />
2011<br />
RDC<br />
2012<br />
Peer<br />
Group<br />
National<br />
Average<br />
This graph shows the percentage of survey respondents very<br />
or fairly satisfied with this service over the last five <strong>year</strong>s.<br />
This graph shows the percentage of survey respondents “very”<br />
satisfied with this service over the last two <strong>year</strong>s and compares<br />
it with our peer group and the national average for 2012.<br />
Other indicators<br />
Animal control - compliance<br />
5000<br />
4500<br />
4700<br />
4000<br />
3500<br />
3000<br />
2500<br />
2000<br />
2290<br />
2420 2502<br />
2423<br />
2273<br />
2324 2532 2549<br />
2487 2475 2665<br />
2725<br />
3266<br />
3179<br />
3672<br />
3671<br />
3957<br />
3957<br />
4700<br />
1500<br />
1000<br />
500<br />
0<br />
2003 2004 2005 2006 2007 2008 2009 2010 2011 2012<br />
Complaint<br />
Comply<br />
<strong>year</strong> <strong>ended</strong> 30 June<br />
44 <strong>Rotorua</strong> <strong>District</strong> <strong>Council</strong> ANNUAL REPORT 2011/12
Building Services<br />
What we do<br />
This activity administers the Building Act and<br />
Fencing of Swimming Pools Act. The activity<br />
includes:<br />
• Processing Project Information Memoranda<br />
(PIMs).<br />
• Processing building consent applications,<br />
assessing against the Building Code.<br />
• Inspecting building work in conjunction with<br />
building consents.<br />
• Issuing Code Compliance Certificates for<br />
buildings constructed in accordance with the<br />
consent.<br />
• Auditing buildings that have a Building Warrant<br />
of Fitness (BWOF).<br />
• Dealing with complaints and breaches of the<br />
Building Act.<br />
• Issuing compliance schedules and compliance<br />
schedule statements.<br />
• Issuing notices to fix.<br />
• Issuing infringement notices.<br />
This <strong>year</strong>’s highlights and achievements<br />
included:<br />
• Building consents – There were 1691 building<br />
consents issued and 111 amendments to<br />
consents in the 12 month period. Approval of<br />
building consents were achieved in a timely<br />
manner with;<br />
− 66% of building consents were issued within 5<br />
days compared to 63% the previous <strong>year</strong>.<br />
− 77% of building consents were issued within<br />
10 days compared to 72% the previous <strong>year</strong>.<br />
− 92% of building consents were issued within<br />
15 days compared to 88% the previous <strong>year</strong>.<br />
• Code compliance certificates - There were<br />
1945 code compliance certificates issued for<br />
the same 12 month period. Approval of code<br />
compliance certificates were achieved in a<br />
timely manner with;<br />
− 86% of code compliance certificates were<br />
issued within 5 days.<br />
− 95% of code compliance certificates were<br />
issued within 10 days.<br />
− 98% of code compliance certificates were<br />
issued within 15 days.<br />
• Historical building consent reduction project - In<br />
the three month period this project has been<br />
running the number of historical building<br />
consents without code compliance certificates<br />
pre July 2007 has reduced by 108 (9%) in<br />
number to a total of 1094. This in turn has<br />
reduced the risk profile associated with these<br />
older building consents and has provided<br />
closure for building owners who may have<br />
been disadvantaged without final sign off by<br />
<strong>Council</strong>.<br />
Community Outcomes<br />
Safe and Caring<br />
• By undertaking routine inspections to ensure<br />
that construction of buildings is meeting all<br />
aspects of the building code<br />
• By staying up to date of changing legislation<br />
and best practise within the building industry<br />
• Able to respond and adapt quickly to<br />
changes in building code legislation and best<br />
practice<br />
Building Services<br />
Why we do it<br />
To promote community safety in and around<br />
buildings and to provide information to people<br />
planning to build on or purchase a property.<br />
<strong>Rotorua</strong> <strong>District</strong> <strong>Council</strong> ANNUAL REPORT 2011/12<br />
45
Building Services<br />
What it cost us<br />
Operating expenses<br />
2012<br />
actual<br />
$000<br />
<strong>Annual</strong><br />
Plan<br />
$000<br />
2011<br />
actual<br />
$000<br />
Direct costs 2,711 2,102 2,096<br />
Financial costs 0 1 0<br />
Depreciation 0 7 9<br />
Other* 13 0 0<br />
Total costs 2,724 2,110 2,105<br />
Revenue<br />
Capital revenue 0 0 0<br />
General rates 0 0 0<br />
Fees and charges 1,506 1,891 1,790<br />
Investment income 0 0 0<br />
Subsidies and grants 0 0 0<br />
Targeted rates 0 0 0<br />
Other income* 0 0 0<br />
Total revenue 1,506 1,891 1,790<br />
Variance from budget<br />
• Direct costs are unfavourable compared to<br />
budget due to an increase in consultant costs<br />
to review building consents and provide advice<br />
on leaky building claims.<br />
• Other costs refer to non cash asset adjustment<br />
entries.<br />
• Fees and charges are unfavourable to budget<br />
due to building consents and inspection fees<br />
down due to the current economic situation.<br />
Net cost of service 1,218 219 315<br />
Operational funding<br />
Net cost of service of<br />
general rate activities<br />
1,218 219 315<br />
Plus capital revenue 0 0 0<br />
Less depreciation -13 -7 -9<br />
Depreciation funded by<br />
general rates<br />
0 0 0<br />
Add back half share<br />
roading depreciation<br />
0 0 0<br />
Self funding/DC reserve<br />
movements<br />
0 0 0<br />
Operations funded by<br />
general rates<br />
1,205 212 306<br />
* Non cash adjustments due to revaluation<br />
How we performed<br />
Level of Service Performance measures Target for 2011/12 Achievement Comments<br />
Buildings are<br />
constructed and<br />
maintained so people<br />
can use them safely.<br />
% of PIMs, building<br />
consents processed within<br />
19 working days.<br />
% of inspections<br />
undertaken within 72<br />
hours.<br />
Accredited system under<br />
the Building Act 2004 is<br />
maintained after biannual<br />
audits.<br />
% of buildings with<br />
Building Warrants of<br />
Fitness audited annually.<br />
% of complaints<br />
investigated within 72<br />
hours.<br />
96% 98.2% issued (achieved) Achieved with a<br />
reduction in resources.<br />
100% 99.99% (not achieved) Resource reduction<br />
beyond control in a<br />
one week period.<br />
100% 100% (achieved) Accreditation<br />
renewed May 2011.<br />
> 25% 25.2% (achieved) Premises audited<br />
under risk based<br />
policy.<br />
100% 100% (achieved) 12.89 hours average<br />
with a maximum of 48<br />
hours.<br />
46 <strong>Rotorua</strong> <strong>District</strong> <strong>Council</strong> ANNUAL REPORT 2011/12
Building consent levels<br />
300<br />
250<br />
268<br />
Total building consents - last 2 <strong>year</strong>s<br />
Building Services<br />
200<br />
175<br />
203<br />
187<br />
246<br />
210<br />
251<br />
195 180<br />
86<br />
150<br />
100<br />
50<br />
133<br />
162<br />
164<br />
109 83<br />
107<br />
87<br />
139 159<br />
73<br />
107<br />
198<br />
104<br />
180<br />
0<br />
July Aug Sept Oct Nov Dec Jan Feb Mar Apr May June<br />
2010/2011 2011/2012<br />
<strong>Rotorua</strong> <strong>District</strong> <strong>Council</strong> ANNUAL REPORT 2011/12<br />
47
City Services Operations<br />
City Services Operations<br />
What we do<br />
<strong>Council</strong> has adopted a range of policies which<br />
cover the CBD, City Focus, public places, street<br />
appeals, provision and servicing of public<br />
conveniences, parking management, Lakefront<br />
and Government Gardens.<br />
The activity is managed from the City Focus in the<br />
CBD to provide hands-on liaison with shoppers,<br />
retailers, residents and visitors.<br />
Locations and properties managed or maintained<br />
include:<br />
• City streets (cleaning)<br />
• Central Business <strong>District</strong><br />
• City Focus<br />
• Government Gardens<br />
• Lakefront<br />
• Tryon Street<br />
• Western Heights shopping centre<br />
• Ngongotaha village<br />
• Public conveniences (12 facilities)<br />
• Tourism kiosks and signage<br />
• Skate park<br />
• Off-street car park, Haupapa Street (95 spaces)<br />
• Off-street parking building, Hinemoa Street (244<br />
spaces)<br />
• On-street parking (1,200 metered and 2,900<br />
unmetered spaces)<br />
Activities and services provided or supported<br />
include:<br />
• Issue of permits for busking, street entertaining,<br />
sausage sizzles and cake/food stalls in the city<br />
centre<br />
• Review of art in public places<br />
• Review and comment on street openings in city<br />
centre<br />
• Review and comment on road closures in city<br />
centre<br />
• Crime prevention camera network<br />
• Community policing and information centre<br />
• Organising juvenile offenders’ community work<br />
for Child, Youth and Family, and Department of<br />
Corrections<br />
• Resident and visitor assistance and direction<br />
• Facilitation and promotion of city events<br />
• Street banners, flags, and decorative lighting<br />
features<br />
• Promotion of city and district<br />
• Review and comment on all city centre<br />
resource consent applications<br />
• Membership of Keep <strong>Rotorua</strong> Beautiful<br />
Committee<br />
• Giant chess game<br />
• Rotary time capsule (25 <strong>year</strong> uplift in 2028)<br />
• Management and co-ordination of volunteer<br />
workers<br />
• Spirit of <strong>Rotorua</strong> suggestions<br />
• Advice on application of legislation<br />
It also involves management of a range of:<br />
• Regulations (including litter, dogs, liquor, signs<br />
and hoardings, traffic, skateboarders, etc.)<br />
• Bylaws<br />
• Engineering requirements<br />
• Promotion initiatives<br />
• Property management issues<br />
• Administrative tasks<br />
• Compliance issues<br />
Why we do it<br />
To create and maintain a well presented,<br />
welcoming, clean, tidy, pleasant, and vibrant city<br />
centre and environs:<br />
• to meet community expectations; and<br />
• to impress visitors to <strong>Rotorua</strong>.<br />
This <strong>year</strong>’s highlights and achievements<br />
included:<br />
• City centre events – a total of 385 this <strong>year</strong> due<br />
in part to the extra events staged around the<br />
Rugby World Cup.<br />
• Resident satisfaction – 97% of residents are<br />
satisfied with the appearance and cleanliness<br />
of the CDB.<br />
48 <strong>Rotorua</strong> <strong>District</strong> <strong>Council</strong> ANNUAL REPORT 2011/12
Community Outcomes<br />
Safe and Caring<br />
• By providing safe public places, buildings, and<br />
streets.<br />
• By providing and managing a crime prevention<br />
camera network.<br />
• By ensuring a very high standard of cleaning<br />
and maintenance in the areas administered.<br />
Environment<br />
• By removing tagging by 7.30 am daily.<br />
• By ensuring the central city area is always clean<br />
and tidy.<br />
Excellent Facilities and Services<br />
• By ensuring ease of getting from place to<br />
place.<br />
• By providing a good quality infrastructure for<br />
now and the future.<br />
• By maintaining public conveniences to a very<br />
high standard of upkeep and cleanliness.<br />
Thriving<br />
• By providing well managed and organised<br />
events.<br />
• By ensuring activity in the City Focus and<br />
Central Business <strong>District</strong> is encouraged, adds<br />
flavour, and enhances <strong>Rotorua</strong>’s character and<br />
reputation.<br />
What it cost us<br />
Operating expenses<br />
2012<br />
actual<br />
$000<br />
<strong>Annual</strong><br />
Plan<br />
$000<br />
2011<br />
actual<br />
$000<br />
Direct costs 2,463 2,741 2,690<br />
Financial costs 66 66 63<br />
Depreciation 289 268 237<br />
Other* 5 0 0<br />
Total costs 2,823 3,075 2,990<br />
Revenue<br />
Capital revenue 0 0 0<br />
General rates 0 0 0<br />
Fees and charges 1,448 1,545 1,335<br />
Investment income 0 0 0<br />
Subsidies and grants 0 0 0<br />
Targeted rates 0 0 0<br />
Other income* 0 0 0<br />
Total revenue 1,448 1,545 1,335<br />
Net cost of service 1,375 1,530 1,655<br />
Capital costs<br />
Renewals 92 116 55<br />
Growth 0 0 0<br />
Backlog 0 0 0<br />
Level of service 0 0 0<br />
Total capital 92 116 55<br />
City Services Operations<br />
Variance from budget<br />
• Direct costs are favourable due to savings on<br />
street cleaning. Over runs in property<br />
maintenance for public conveniences has<br />
been offset by cost savings in other areas such<br />
as property maintenance for the car park<br />
building.<br />
• Fees and charges for off street parking where<br />
less than anticipated due to a decrease in<br />
visitors to the city centre, relocation of retail to<br />
the central mall and more people using public<br />
transport.<br />
Capital expenditure<br />
2012<br />
actual<br />
$000<br />
Parking meter acquisition 35<br />
Security CCTV cameras 57<br />
92<br />
Operational funding<br />
Net cost of service of<br />
general rate activities<br />
1,375 1,530 1,655<br />
Plus capital revenue 0 0 0<br />
Less depreciation -295 -268 -237<br />
Depreciation funded by<br />
general rates<br />
92 116 54<br />
Add back half share<br />
roading depreciation<br />
0 0 0<br />
Self funding/DC reserve<br />
movements<br />
0 0 0<br />
Operations funded by<br />
general rates<br />
1,172 1,378 1,472<br />
Capital funding<br />
Funding from<br />
depreciation (rates)<br />
92 116 55<br />
Loans from/(to)<br />
corporate fund<br />
0 0 0<br />
Capital grants 0 0 0<br />
Development<br />
contributions<br />
0 0 0<br />
Reserves net 0 0 0<br />
Asset sales 0 0 0<br />
Total capital 92 116 55<br />
* Non cash adjustments due to revaluation<br />
<strong>Rotorua</strong> <strong>District</strong> <strong>Council</strong> ANNUAL REPORT 2011/12<br />
49
City Services Operations<br />
How we performed<br />
Level of Service Performance measures Target for 2011/12 Achievement Comments<br />
Provide a high standard<br />
of CBD cleaning and<br />
maintenance.<br />
Car parking availability<br />
in CBD is managed to<br />
the satisfaction of users.<br />
Provision of public toilets<br />
in the CBD that meets<br />
the expectation of<br />
users.<br />
% of residents that are<br />
satisfied with appearance<br />
and cleanliness of CBD<br />
(as measured by periodic<br />
survey).<br />
% satisfied with parking in<br />
the CBD (as measured by<br />
periodic survey).<br />
% satisfied with public<br />
toilets (as measured by<br />
periodic survey).<br />
95% 97% (achieved) Level of service review for<br />
new contract 2012/13.<br />
70% 70% (achieved) Introduction of<br />
performance based<br />
parking management in<br />
July 2011.<br />
60% 56% (not achieved) Review of public toilet<br />
facilities underway for<br />
2012/13.<br />
Facilitating events at<br />
the city centre which<br />
contribute to the<br />
vibrancy of the city.<br />
Number of events held in<br />
the city centre annually.<br />
> 350 events . 385 events<br />
(achieved)<br />
Major increase in events in<br />
the City Centre entirely<br />
due to Rugby World Cup<br />
in August/September/<br />
October 2011.<br />
Community satisfaction survey<br />
The graphs below have been prepared from the annual Community Satisfaction Survey.<br />
Public toilets<br />
City centre cleanliness<br />
% very / fairly satisfied<br />
75%<br />
50%<br />
25%<br />
51% 50%<br />
54%<br />
62%<br />
56%<br />
% very / fairly satisfied<br />
100%<br />
75%<br />
50%<br />
25%<br />
96% 97% 97%<br />
0%<br />
2008 2009 2010 2011 2012<br />
0%<br />
2008 2009 2010 2011 2012<br />
These graphs show the percentage of survey respondents very or fairly satisfied with these services.<br />
Public toilets<br />
City centre cleanliness<br />
30%<br />
28%<br />
70%<br />
60% 60%<br />
21%<br />
60%<br />
% very satisfied<br />
20%<br />
10%<br />
14%<br />
13%<br />
% very satisfied<br />
50%<br />
40%<br />
30%<br />
20%<br />
10%<br />
34% 32%<br />
0%<br />
RDC<br />
2011<br />
RDC<br />
2012<br />
Peer<br />
Group<br />
National<br />
Average<br />
0%<br />
RDC<br />
2011<br />
RDC<br />
2012<br />
Peer<br />
Group<br />
National<br />
Average<br />
These graphs show the percentage of survey respondents “very” satisfied with these services over the last two <strong>year</strong>s and compares it with<br />
our peer group and the national average for 2012.<br />
50 <strong>Rotorua</strong> <strong>District</strong> <strong>Council</strong> ANNUAL REPORT 2011/12
Economic Development<br />
• Ensuring connectivity and partnerships with Iwi<br />
are strong.<br />
Marketing<br />
• Marketing <strong>Rotorua</strong> nationally and<br />
internationally as a great place to live, work,<br />
learn, invest and conduct business, in<br />
conjunction with Destination <strong>Rotorua</strong><br />
Marketing.<br />
Economic Development<br />
What we do<br />
Information Provision<br />
• Providing public/business access to timely,<br />
accurate and relevant <strong>Rotorua</strong> economic<br />
information via web, publications, forums.<br />
Facilitation<br />
• Facilitating private sector access to economic<br />
and business development initiatives, networks,<br />
funding programs and activity within <strong>Rotorua</strong>,<br />
such as NZTE.<br />
• Working with the key economic sector groups<br />
to develop an environment that will stimulate<br />
growth.<br />
• Building partnerships between key local,<br />
regional and central government agencies, Iwi<br />
and the <strong>Rotorua</strong> business community ensuring<br />
that the private sector has input into council<br />
business and economic development related<br />
issues.<br />
• Partnering with local business to develop<br />
sustainable competitive advantage.<br />
• Facilitating the attraction of residents, business<br />
and investors to <strong>Rotorua</strong>.<br />
• Providing an integrated response across<br />
council to assist and enhance development<br />
opportunities.<br />
• Implementation of the Urban Design<br />
Framework.<br />
Project management<br />
• Support implementation of the new economic<br />
strategy and the framework for growth.<br />
• Young Enterprise Scheme.<br />
• Lead agency for Settlement Support<br />
Programme.<br />
• Marketing <strong>Rotorua</strong>’s inherent benefits to both<br />
prospective migrants and industry through<br />
Destination <strong>Rotorua</strong> Marketing.<br />
• Central film initiative/cluster programme.<br />
Promoting and facilitating <strong>Rotorua</strong> as a world<br />
class film destination through working closely<br />
with Film New Zealand and location scouts.<br />
• <strong>Rotorua</strong> CBD Retail Strategy.<br />
• Urban Design Framework Implementation<br />
Programme.<br />
• Facilitating the opening up of strategically<br />
sustainable industrial land in <strong>Rotorua</strong> <strong>District</strong>.<br />
• International relations and Sister City<br />
opportunities, including Nanjing <strong>Rotorua</strong> Town.<br />
• Grow <strong>Rotorua</strong> Fund.<br />
• National Cycle way and Cycling Centre of<br />
Excellence.<br />
Why we do it<br />
To encourage and stimulate sustainable economic<br />
growth through a strategic framework developed<br />
by business for business. To deliver strategic<br />
programs that provide prosperity, improved<br />
standards of living and a better quality of life for<br />
<strong>Rotorua</strong>’s citizens. To act as an enabler for<br />
partnerships and capacity growth for industry. To<br />
provide a platform on which skilled workforce<br />
migrates to <strong>Rotorua</strong>. To improve the skills and<br />
education capability for local business. To develop<br />
both a vibrant and safe CBD where we work, live,<br />
invest and play.<br />
This <strong>year</strong>’s highlights and achievements<br />
included:<br />
• New strategy - adoption of the <strong>Rotorua</strong><br />
Sustainable Economic Growth Strategy<br />
• CCO creation - approval granted by <strong>Council</strong> to<br />
establish a <strong>Council</strong> Controlled Organisation to<br />
steer and implement the outcomes of the<br />
<strong>Rotorua</strong> Sustainable Economic Growth Strategy<br />
• Employment – BERL revealed that in 2011<br />
<strong>Rotorua</strong> had the second fastest employment<br />
growth in the country and had the fourth fastest<br />
<strong>Rotorua</strong> <strong>District</strong> <strong>Council</strong> ANNUAL REPORT 2011/12<br />
51
Economic Development<br />
employment growth of all 66 local authority<br />
areas.<br />
• Economic performance – <strong>Rotorua</strong> experienced<br />
the seventh biggest gain in overall economic<br />
performance out of all New Zealand local<br />
authorities, jumping 20 places to 37 th in the<br />
country.<br />
• Eat Streat design project - Work with APR<br />
Architects is well underway with the future<br />
design of Eat Streat. A Project Reference<br />
Group, including staff from across <strong>Council</strong><br />
departments, building owners and business<br />
owners have been meeting to oversee progress<br />
and provide feedback to the architects.<br />
Community Outcomes<br />
Safe and Caring<br />
• By working with Police and assisting with a retail<br />
crime prevention strategy for retailers, and<br />
developing CBD potential.<br />
Environment<br />
• Promoting sustainable business practices.<br />
• Partnerships (Heart of Tutanekai Street, Night<br />
Market, Eat Streat)<br />
What it cost us<br />
Operating expenses<br />
2012<br />
actual<br />
$000<br />
<strong>Annual</strong><br />
Plan<br />
$000<br />
2011<br />
actual<br />
$000<br />
Direct costs 3,659 2,124 2,691<br />
Financial costs 0 2 0<br />
Depreciation 6 19 20<br />
Other* 106 0 0<br />
Total costs 3,771 2,145 2,711<br />
Revenue<br />
Capital revenue 0 11 1<br />
General rates 0 0 0<br />
Fees and charges 551 306 167<br />
Investment income 5 0 0<br />
Subsidies and grants 211 177 153<br />
Targeted rates 1,519 1,514 784<br />
Other income* 0 0 0<br />
Total revenue 2,286 2,008 1,105<br />
Healthy<br />
• Assisting agencies and <strong>Council</strong> in development<br />
of programmes/collateral to encourage<br />
healthy activities and community well-being.<br />
Prosperous Economy<br />
• Economic Growth Strategy<br />
• By working closely with the business community<br />
to assist in attracting government funding.<br />
• By working with local government agencies,<br />
employers and community groups to assist<br />
migrants with matching employment skill base<br />
requests.<br />
• By assisting with the supply of relevant and<br />
accurate information.<br />
• By developing and supporting the Film Central<br />
initiative.<br />
Excellent Facilities and Services<br />
• Urban Design Framework Implementation.<br />
• By promoting the use of Maori in our daily<br />
activities by actively supporting the ‘Kia Ora’<br />
campaign.<br />
• By working closely with Maori on the CBD<br />
project.<br />
• By promotion of cultural values to new migrants<br />
via workshops and guides.<br />
Learning<br />
• By supporting the Chamber of Commerce’s<br />
Regional Partners program and promoting and<br />
supporting the Business mentors program in our<br />
region.<br />
Thriving<br />
• By taking a lead role with Shop <strong>Rotorua</strong> and<br />
CBD revitalisation.<br />
• By encouraging migrant community<br />
participation.<br />
• By taking a lead role in the Forest Industries<br />
Expo.<br />
Net cost of service 1,485 137 1,606<br />
Capital costs<br />
Renewals 0 0 0<br />
Growth -1 1,800 0<br />
Backlog 0 0 0<br />
Level of service 2 0 0<br />
Total capital 1 1,800 0<br />
Operational funding<br />
Net cost of service of<br />
general rate activities<br />
1,485 137 1,606<br />
Plus capital revenue 78 11 1<br />
Less depreciation -112 -19 -20<br />
Depreciation funded by<br />
general rates<br />
0 0 0<br />
Add back half share<br />
roading depreciation<br />
0 0 0<br />
Self funding/DC reserve<br />
movements<br />
83 0 0<br />
Operations funded by<br />
general rates<br />
1,534 129 1,587<br />
Capital funding<br />
Funding from<br />
depreciation (rates)<br />
0 0 0<br />
Loans from/(to)<br />
corporate fund<br />
1 1,800 0<br />
Capital grants 0 0 0<br />
Development<br />
contributions<br />
0 0 0<br />
Reserves net 0 0 0<br />
Asset sales 0 0 0<br />
Total capital 1 1,800 0<br />
* Non cash adjustments due to revaluation<br />
52 <strong>Rotorua</strong> <strong>District</strong> <strong>Council</strong> ANNUAL REPORT 2011/12
Capital expenditure<br />
2012<br />
actual<br />
$000<br />
Night market 1<br />
How we performed<br />
1<br />
Variance from budget<br />
• Direct costs are unfavourable compared to<br />
budget due to costs associated with delivering<br />
the National Forestry Expo, more than offset by<br />
the income from the Expo; the Hinemoa Street<br />
development; and the joint venture marketing<br />
of <strong>Rotorua</strong> and the international airport with Air<br />
New Zealand. Total expenditure on joint<br />
venture marketing was $2 million, $1 million<br />
above budget.<br />
• Other costs relate to non cash asset adjustment<br />
entries.<br />
• Fees and charges and subsidies and grants are<br />
favourable due to increased revenue received<br />
from the National Forestry Expo.<br />
Economic Development<br />
Level of Service Performance measures Target for 2011/12 Achievement Comments<br />
Market <strong>Rotorua</strong><br />
nationally and<br />
internationally as a<br />
great place to live,<br />
work, learn, invest and<br />
do business.<br />
Number of website visits per<br />
month<br />
% of business and relocation<br />
enquiries responded to within<br />
3 working days<br />
Number of new <strong>Rotorua</strong><br />
specific business enquiries;<br />
and film and commercial<br />
enquiries generated pa<br />
Amount of government and<br />
private sector funding<br />
attracted to assist in<br />
implementing the economic<br />
development strategy<br />
Number of businesses<br />
involved in the <strong>Rotorua</strong><br />
Employment Skills Programme<br />
Number of students involved<br />
in the YES (Young Enterprise<br />
Scheme)<br />
Community satisfaction survey<br />
Maintain at 20,000 N/A Focus shifted when<br />
General Manager left<br />
and budgets were<br />
limited.<br />
> 95% 100% (achieved) All business enquiries<br />
responded to within 3<br />
working days.<br />
100<br />
30<br />
Not achieved<br />
Minimum resource has<br />
been directed to this<br />
over the <strong>year</strong>. However<br />
15 Film Enquiries and<br />
numerous business<br />
enquiries were dealt<br />
with.<br />
$50,000 N/A N/A since 2008 funding<br />
change from<br />
government to regional<br />
projects.<br />
250 N/A The <strong>Rotorua</strong><br />
Employment Skills<br />
Programme was<br />
terminated and is<br />
unlikely to<br />
recommence.<br />
50 Achieved There were 57 students<br />
registered for Young<br />
Enterprise.<br />
The graphs below have been prepared from the annual Community Satisfaction Survey.<br />
Job promotion<br />
Job promotion<br />
75%<br />
67%<br />
20%<br />
18%<br />
% very / fairly satisfied<br />
50%<br />
25%<br />
53%<br />
41%<br />
49%<br />
42%<br />
% very satisfied<br />
15%<br />
10%<br />
5%<br />
6%<br />
9%<br />
7%<br />
0%<br />
2008 2009 2010 2011 2012<br />
0%<br />
RDC<br />
2011<br />
RDC<br />
2012<br />
Peer<br />
Group<br />
National<br />
Average<br />
This graph shows the percentage of survey respondents very<br />
or fairly satisfied with this service over the last five <strong>year</strong>s.<br />
This graph shows the percentage of survey respondents “very”<br />
satisfied with this service over the last two <strong>year</strong>s and compares<br />
it with our peer group and the national average for 2012.<br />
<strong>Rotorua</strong> <strong>District</strong> <strong>Council</strong> ANNUAL REPORT 2011/12<br />
53
Environmental Planning Implementation<br />
Environmental Planning Implementation<br />
• Client Support Manager – new position<br />
established to help trouble shoot problems and<br />
find solutions to issues both in-house and for<br />
clients. The role also proactively engages with<br />
groups and individuals seeking to undertake<br />
developments and projects.<br />
Community Outcomes<br />
Safe and Caring<br />
• By the assessment of applications against<br />
planning framework that recognises the need<br />
to provide for safe homes, streets, and safe<br />
public spaces.<br />
Environment<br />
• By the implementation of planning<br />
management controls to assist in improving the<br />
natural and physical environment, and in<br />
achieving environmental respect.<br />
Healthy<br />
• By the implementation of an environmental<br />
planning framework that recognises the need<br />
to provide for a healthy community, and to<br />
reflect this in policy decisions.<br />
What we do<br />
• Provide planning advice to customers to<br />
determine whether consent is required, and the<br />
type of information required for lodgement with<br />
council.<br />
• Processing consents (land use and subdivision).<br />
• Processing Notices of Requirements and outline<br />
plans for designated public works or areas of<br />
land.<br />
Why we do it<br />
To meet statutory requirements for the processing<br />
of consent applications; to ensure that the quality<br />
of the environment enjoyed by residents and<br />
visitors is maintained and enhanced.<br />
This <strong>year</strong>’s highlights and achievements<br />
included:<br />
• Strategic focus – development of a Quality<br />
Assurance Team to provide a higher level of<br />
strategic focus and structure to the reporting,<br />
monitoring and compliance functions. A new<br />
Monitoring and Compliance Officer was<br />
appointed midway through this period.<br />
• 2012 State of the Environment report web-based<br />
reporting – quarterly release of indicators has<br />
resulted in more regular engagement with<br />
stakeholders and the ability to release more<br />
current data.<br />
Prosperous Economy<br />
• By the implementation of a planning framework<br />
that supports the local economy, recognises<br />
and provides for quality development, and<br />
celebrates and promotes the district’s<br />
uniqueness.<br />
Excellent Facilities and Services<br />
• By providing a well planned district with<br />
supporting infrastructure, facilities, and services,<br />
that contribute to residents’ and visitors’<br />
enjoyment of the district.<br />
Living Maori Culture<br />
• By implementation of an environmental<br />
planning framework that accounts for Iwi<br />
aspirations, recognises the spiritual and cultural<br />
connection of Maori, and recognises and<br />
provides for this in consent decisions.<br />
Learning<br />
• By the assessment of applications in a manner<br />
that supports increasing knowledge and<br />
awareness.<br />
Thriving<br />
• By providing an environmental planning<br />
framework that supports the hosting of activities<br />
and events, and that assists creativity in the<br />
environment.<br />
54 <strong>Rotorua</strong> <strong>District</strong> <strong>Council</strong> ANNUAL REPORT 2011/12
What it cost us<br />
2012<br />
actual<br />
$000<br />
<strong>Annual</strong><br />
Plan<br />
$000<br />
2011<br />
actual<br />
$000<br />
Operating expenses<br />
Direct costs 1,781 1,782 1,935<br />
Financial costs 0 0 0<br />
Depreciation 1 3 7<br />
Other* 3 0 0<br />
Total costs 1,785 1,785 1,942<br />
Revenue<br />
Capital revenue 0 0 0<br />
General rates 0 0 0<br />
Fees and charges 234 344 250<br />
Investment income 0 0 0<br />
Subsidies and grants 0 0 0<br />
Targeted rates 0 0 0<br />
Other income* 0 0 0<br />
Total revenue 234 344 250<br />
Variance from budget<br />
The fees and charges budget was based on<br />
historic application numbers however the<br />
anticipated increase has not materialised.<br />
Environmental Planning Implementation<br />
Net cost of service 1,551 1,441 1,692<br />
Operational funding<br />
Net cost of service of<br />
general rate activities<br />
1,551 1,441 1,692<br />
Plus capital revenue 0 0 0<br />
Less depreciation -4 -3 -7<br />
Depreciation funded by<br />
general rates<br />
0 0 0<br />
Add back half share<br />
roading depreciation<br />
0 0 0<br />
Self funding/DC reserve<br />
movements<br />
0 0 0<br />
Operations funded by<br />
general rates<br />
1,547 1,438 1,685<br />
* Non cash adjustments due to revaluation<br />
How we performed<br />
Level of Service Performance measures Target for 2011/12 Achievement Comments<br />
Timely and consistent<br />
processing of resource<br />
consent applications.<br />
Appropriate community<br />
input sought for<br />
application with wide<br />
ranging environmental<br />
effects.<br />
High degree of probity<br />
in resource consent<br />
decision making.<br />
% of land use consents<br />
processed within statutory<br />
timeframes.<br />
% of subdivision consents<br />
processed within statutory<br />
timeframes.<br />
% of 223/224 applications<br />
processed within statutory<br />
timeframes.<br />
% of other applications<br />
processed within statutory<br />
timeframes.<br />
Monthly hearings matrix<br />
maintained and regular<br />
reporting to Planning and<br />
Bylaws committee.<br />
Six monthly report of<br />
Hearing Commissioner<br />
appointments.<br />
> 98% 99% (achieved) 259 out of 261 land use<br />
consents processed<br />
within statutory<br />
timeframes for the <strong>year</strong><br />
> 98% 100% (achieved) 42 subdivision consents<br />
processed within<br />
statutory timeframes.<br />
100% 95% (not achieved) 57 out of the 60 section<br />
223 & 224 applications<br />
were processed within<br />
statutory timeframes.<br />
> 90% 96% (achieved) 47 out of 49 other<br />
planning applications<br />
processed within<br />
statutory timeframes.<br />
100% 100% (achieved) <strong>Report</strong>s provided<br />
100% 100% (achieved) <strong>Report</strong>s provided<br />
<strong>Rotorua</strong> <strong>District</strong> <strong>Council</strong> ANNUAL REPORT 2011/12<br />
55
Environmental Planning Implementation<br />
Level of Service Performance measures Target for 2011/12 Achievement Comments<br />
Monitoring of<br />
compliance with<br />
consent conditions for<br />
all consents granted.<br />
Prompt responses to<br />
complaints about<br />
planning and<br />
environmental issues.<br />
Facilitate Tangata<br />
Whenua input into<br />
decision making<br />
processes.<br />
Other indicators<br />
500<br />
450<br />
400<br />
350<br />
396<br />
459<br />
Six monthly report to<br />
Planning and Bylaws<br />
Committee on compliance<br />
monitoring.<br />
All complaints responded to<br />
within 24 hours of receipt.<br />
Maintenance of Iwi<br />
Consultative Committee<br />
Register.<br />
Number of applications progressed to a decision<br />
494<br />
429<br />
436<br />
100% 100% (achieved) <strong>Report</strong>s provided<br />
100% 100% (achieved) 44 complaints<br />
responded to within 24<br />
hours of receipt<br />
(excluding noise<br />
complaints)<br />
100% 100% (achieved) Applications received<br />
forwarded to Director<br />
Kaupapa Maori for<br />
consultation<br />
consideration<br />
300<br />
250<br />
200<br />
300<br />
255<br />
264 261<br />
150<br />
100<br />
50<br />
0<br />
83<br />
122<br />
172 128<br />
128<br />
107<br />
71<br />
70 42<br />
2004 2005 2006 2007 2008 2009 2010 2011 2012<br />
Land use<br />
Subdiv ision<br />
<strong>year</strong> <strong>ended</strong> 30 June<br />
Number of applications processed within statutory timeframes<br />
100<br />
90<br />
80<br />
70<br />
60<br />
83<br />
54<br />
86<br />
79 83 82<br />
98 97<br />
86<br />
92<br />
95 96 97<br />
95 98 99 99<br />
100<br />
50<br />
40<br />
30<br />
20<br />
10<br />
0<br />
2004 2005 2006 2007 2008 2009 2010 2011 2012<br />
Land use<br />
Subdiv ision<br />
<strong>year</strong> <strong>ended</strong> 30 June<br />
56 <strong>Rotorua</strong> <strong>District</strong> <strong>Council</strong> ANNUAL REPORT 2011/12
Environmental Planning Policy<br />
accordance with the aims of the <strong>Rotorua</strong><br />
Sustainable Economic Growth Strategy.<br />
• To ensure sustainable management of natural<br />
and physical resources and to manage<br />
adverse effects.<br />
• To guide and enhance the quality of the<br />
natural and physical environment as the district<br />
develops.<br />
This <strong>year</strong>’s highlights and achievements<br />
included:<br />
Environmental Planning Policy<br />
• Draft <strong>District</strong> Plan - commencement of meetings<br />
to clarify draft district plan feedback and<br />
chapters am<strong>ended</strong> to reflect. Meetings have<br />
been held with community groups, industry<br />
groups, Regional <strong>Council</strong>, iwi groups, Chamber<br />
of Commerce, energy companies and<br />
government agencies. Feedback from these<br />
meetings has been considered in the<br />
preparation of the notified version of the <strong>District</strong><br />
Plan.<br />
• Community feedback Draft <strong>District</strong> Plan - closed<br />
with 360 comments received. The feedback<br />
was summarised and changes incorporated<br />
into the plan.<br />
Community Outcomes<br />
What we do<br />
• A core function is developing and maintaining<br />
the <strong>District</strong> Plan, one of the key documents<br />
<strong>Council</strong> has to manage and control land use<br />
and subdivision in the district.<br />
• Advocacy on behalf of the community on<br />
local, regional and national environmental<br />
issues is another core function of this team. This<br />
generally translates to providing advice on<br />
draft national policy statements, national<br />
environmental standards, regional policy<br />
statements and regional plans.<br />
• Responding to regional and central<br />
government policy proposals where these<br />
affect land use and resource management<br />
within the district.<br />
• Provision of a duty planning service for the<br />
community to help understand how the district<br />
Plan may impact on activities on land.<br />
• Provision of strategic policy advice in relation to<br />
the environment, land management and<br />
subdivision, to elected members of council.<br />
Why we do it<br />
• Administer the <strong>District</strong> Plan and process consent<br />
applications to ensure the quality of the<br />
environment is balanced with the need for<br />
sustainable economic growth to be enabled in<br />
Safe and Caring<br />
• By providing an environmental planning<br />
framework that recognises the need to provide<br />
for safe homes, streets, and safe public spaces.<br />
Environment<br />
• By providing a primary land use planning tool<br />
that assists in achieving environmental respect,<br />
and providing planning management controls<br />
to assist in improving natural and physical<br />
environment.<br />
Healthy<br />
• By providing an environmental planning<br />
framework that recognises the need to provide<br />
for a healthy community, and reflecting this in<br />
policy decisions.<br />
Prosperous Economy<br />
• By providing an environmental planning<br />
framework that is inclusive for Iwi aspirations,<br />
recognises the spiritual and cultural connection<br />
of Maori, and recognises and provides for this in<br />
policy decisions.<br />
Excellent Facilities and Services<br />
• By providing an environmental planning<br />
framework that supports the local economy,<br />
recognises and provides for quality<br />
development,<br />
• and celebrates and promotes the district’s<br />
uniqueness.<br />
<strong>Rotorua</strong> <strong>District</strong> <strong>Council</strong> ANNUAL REPORT 2011/12<br />
57
Environmental Planning Policy<br />
Living Maori Culture<br />
• By providing a well planned district with<br />
supporting infrastructure, facilities, and services,<br />
that contribute to residents’ and visitors’<br />
enjoyment of the district.<br />
Learning<br />
• By providing useful and relevant research<br />
about the district that is easily accessed by the<br />
community.<br />
Thriving<br />
• By providing an environmental planning<br />
framework that supports the hosting of activities<br />
and events, and that assists creativity in the<br />
environment.<br />
What it cost us<br />
2012<br />
actual<br />
$000<br />
<strong>Annual</strong><br />
Plan<br />
$000<br />
2011<br />
actual<br />
$000<br />
Operating expenses<br />
Direct costs 1,206 1,581 1,244<br />
Financial costs 0 0 0<br />
Depreciation 0 2 5<br />
Other* 2 0 0<br />
Total costs 1,208 1,583 1,249<br />
Revenue<br />
Capital revenue 0 0 0<br />
General rates 0 0 0<br />
Fees and charges 4 11 1<br />
Investment income 0 0 0<br />
Subsidies and grants 0 0 0<br />
Targeted rates 0 0 0<br />
Other income* 0 0 0<br />
Total revenue 4 11 1<br />
Net cost of service 1,204 1,572 1,248<br />
Variance from budget<br />
• Direct costs are favourable due to less<br />
consultants’ advice and legal costs.<br />
• Fees and charges are unfavourable due to less<br />
activity as a result of the current economic<br />
situation.<br />
How we performed<br />
Operational funding<br />
Net cost of service of<br />
general rate activities<br />
1,204 1,572 1,248<br />
Plus capital revenue 0 0 0<br />
Less depreciation -2 -2 -5<br />
Depreciation funded by<br />
general rates<br />
0 0 0<br />
Add back half share<br />
roading depreciation<br />
0 0 0<br />
Self funding/DC reserve<br />
movements<br />
0 0 0<br />
Operations funded by<br />
general rates<br />
1,202 1,570 1,243<br />
* Non cash adjustments due to revaluation<br />
Level of Service Performance measures Target for 2011/12 Achievement Comments<br />
Operative <strong>Rotorua</strong><br />
district plan maintained<br />
and kept current.<br />
Status of district plan<br />
reported to Planning<br />
and Bylaws Committee.<br />
Comprehensive review<br />
of operative district<br />
plan.<br />
<strong>Council</strong> initiated plan<br />
changes undertaken in<br />
response to topical<br />
issues, and processed to<br />
statutory requirements.<br />
Advocating on behalf<br />
of the community on<br />
regional and national<br />
environmental policy<br />
matters.<br />
Monitor the state of the<br />
district’s environment.<br />
Web based district plan<br />
kept current.<br />
Update report to Planning<br />
and Bylaws committee at<br />
each meeting.<br />
Notification of district plan<br />
review in 2009.<br />
Plan changes reported to<br />
Planning and Bylaws<br />
committee and<br />
progressed within<br />
statutory time.<br />
Private plan changes<br />
reported to Planning and<br />
Bylaws committee and<br />
progressed within<br />
statutory time.<br />
State of the Environment<br />
monitoring undertaken<br />
<strong>year</strong>ly.<br />
100% 100% (achieved)<br />
100% 100% (achieved)<br />
Environment Court<br />
appeals resolved no<br />
later than<br />
December 2012<br />
Not achieved<br />
Draft <strong>District</strong> Plan released for<br />
comment April 2012.<br />
Proposed <strong>District</strong> Plan<br />
notification date now<br />
October. The Plan will be at in<br />
its submissions phase rather<br />
than appeal stage by Dec<br />
2012.<br />
100% Achieved No plan changes received<br />
apart from work on the <strong>District</strong><br />
Plan Review.<br />
100% Achieved No private plan changes<br />
received.<br />
100% 100% (achieved) Online State of the<br />
Environment <strong>Report</strong>ing – first<br />
two releases made. Third and<br />
fourth on target for Sept and<br />
Dec 2012.<br />
58 <strong>Rotorua</strong> <strong>District</strong> <strong>Council</strong> ANNUAL REPORT 2011/12
Events and Venues<br />
system for non-sports code bookings on<br />
<strong>Council</strong>’s parks and reserves.<br />
The range of uses within the venues includes:<br />
• Local amateur performance<br />
• Sport and recreation<br />
• Conference and incentive activities<br />
• Social functions<br />
• Touring and local professional performing<br />
groups<br />
• Cultural activity performances<br />
• Manage a ticketing agency (currently<br />
Ticketmaster) to service client/venue needs.<br />
Events and Venues<br />
What we do<br />
This activity covers the operation of:<br />
• Energy Events Centre (including the<br />
Sportsdrome)<br />
• <strong>Rotorua</strong> Convention Centre (including the Civic<br />
Theatre and ticketing agency)<br />
• Te Runanga Tea House<br />
• The Soundshell<br />
• <strong>Rotorua</strong> International Stadium (including<br />
Number 2 field).<br />
• Equipment Shed – access to sporting, event<br />
management and facilitation equipment<br />
The role of this activity is to:<br />
• Provide quality event facilities for the <strong>Rotorua</strong><br />
community which support endeavours to<br />
attract large, high-yield local, regional, national<br />
and international events.<br />
• Provide for the identification and attraction of<br />
large major events to <strong>Rotorua</strong> and their<br />
subsequent growth.<br />
• Provide assistance to event promoters and<br />
organisers in dealing with the array of people,<br />
processes and legislation involved in organising<br />
a major event.<br />
• Support local event organisers through provision<br />
of the equipment shed and recreation<br />
programmes<br />
• Assist in the marketing of function space at the<br />
<strong>Rotorua</strong> Museum<br />
• Manage on behalf of the Parks and Recreation<br />
department management of the booking<br />
Why we do it<br />
• To provide conference entertainment and<br />
sporting venues to meet the needs of local<br />
residents and visitors.<br />
• To attract events that offer economic benefit<br />
and contribute to <strong>Rotorua</strong>'s reputation as an<br />
attractive place to live and visit.<br />
This <strong>year</strong>’s highlights and achievements<br />
included:<br />
• Rugby World Cup- <strong>Rotorua</strong> successfully hosted<br />
5 teams and 3 matches in the 2011 Rugby<br />
World Cup with the Ireland V Russia match<br />
being the major highlight as it was played<br />
before a capacity crowd. Local community<br />
support for the RWC flowed from successful city<br />
theming and activities and the live broadcast<br />
Fan Zones hosted at the Energy Events Centre<br />
and Convention Centre were extremely well<br />
supported.<br />
• Raggamuffin festival- In a difficult market that<br />
saw other music festivals fold or have significant<br />
reductions in attendance numbers the<br />
Raggamuffin Festival was further developed<br />
with the addition of the Friday night<br />
performances which also functioned as a<br />
second stage for the Saturday show.<br />
Attendances were 3000 above 2011 and Friday<br />
night led to an longer average stay from visitors.<br />
• C&I market- Despite the depressed global<br />
market Events & Venues activity in the C&I<br />
market has led to a growth in both the number<br />
of conferences & delegate numbers. Forward<br />
bookings continue to be above past levels with<br />
strong interest for Australasian and International<br />
conferences. <strong>Rotorua</strong> is now ranked behind<br />
only Auckland for the hosting of large<br />
conferences. The importance of Events &<br />
Venues providing larger facilities than are<br />
available elsewhere in <strong>Rotorua</strong> is shown by our<br />
venues hosting 13% of <strong>Rotorua</strong>’s conference<br />
business but 45% of visiting conference<br />
delegates.<br />
<strong>Rotorua</strong> <strong>District</strong> <strong>Council</strong> ANNUAL REPORT 2011/12<br />
59
Events and Venues<br />
• Convention Centre and Theatre- Civic Theatre<br />
use continues to exceed booking levels prior to<br />
the recent stagehouse redevelopment. In this<br />
<strong>year</strong> there were 64 performances in the theatre<br />
of which 29 exceeded 500 patrons. 2012/13<br />
forward bookings indicate a further increase in<br />
bookings is likely. The highlight was hosting<br />
Dame Kiri Te Kanawa’s only NZ performance.<br />
The Sound system for the Banquet Room,<br />
Concert Chamber and Foyer was upgraded in<br />
accordance with our asset management plans.<br />
The Theatre stage was launched as a function<br />
venue with emphasis on the venue’s potential<br />
for dinners.<br />
• Sport and other events- <strong>Rotorua</strong> continues to<br />
host a diverse range of events in Events &<br />
Venues facilities and elsewhere in the district<br />
although the attraction of major sporting events<br />
to the International Stadium remains a<br />
challenge. The Tough Guy and Gal continues<br />
<strong>year</strong> on <strong>year</strong>s growth with over 6000 entrants<br />
and <strong>Rotorua</strong> hosted the Oceania MTB and BMX<br />
Nationals and secured a 4 <strong>year</strong> future<br />
commitment for MTB nationals and 2 Oceania<br />
Championships. Rhapsody <strong>Rotorua</strong> was the<br />
biggest yet and it is hoped that the 2012 Fire<br />
and Ice Festival will be expanded to a much<br />
bigger winter festival in 2013. The 2013 World<br />
Rafting Championships were secured for<br />
<strong>Rotorua</strong> and a new Major Events strategy was<br />
completed.<br />
What it cost us<br />
Operating expenses<br />
2012<br />
actual<br />
$000<br />
<strong>Annual</strong><br />
Plan<br />
$000<br />
2011<br />
actual<br />
$000<br />
Direct costs 5,149 4,500 4,372<br />
Financial costs 721 486 652<br />
Depreciation 1,765 1,669 1,608<br />
Other* 62 0 6<br />
Total costs 7,697 6,655 6,638<br />
Revenue<br />
Capital revenue 377 1,025 194<br />
General rates 0 0 0<br />
Fees and charges 2,476 2,220 2,092<br />
Investment income 0 0 0<br />
Subsidies and grants 116 0 37<br />
Targeted rates 1,624 1,619 1,495<br />
Other income* 0 30 29<br />
Total revenue 4,593 4,894 3,847<br />
Net cost of service 3,104 1,761 2,791<br />
Capital costs<br />
Renewals 320 503 115<br />
Growth 0 0 0<br />
Backlog 1 0 0<br />
Level of service 91 0 1,975<br />
Total capital 412 503 2,090<br />
Community Outcomes<br />
Excellent Facilities and Services<br />
• By providing <strong>Rotorua</strong> with a range of venues of<br />
national and international standard.<br />
• By providing a range of venues for both major<br />
events and community use.<br />
Prosperous Economy<br />
• By attracting/hosting events including sporting,<br />
cultural festivals, arts, leading edge activity<br />
events, celebrating and nurturing traditional<br />
Maori Culture and fostering artistic expression in<br />
art, music, dancing , public performance and<br />
exhibitions<br />
Operational funding<br />
Net cost of service of<br />
general rate activities<br />
3,104 1,761 2,791<br />
Plus capital revenue 393 785 184<br />
Less depreciation -2,649 -1,669 -1,614<br />
Depreciation funded by<br />
general rates<br />
320 503 115<br />
Add back half share<br />
roading depreciation<br />
0 0 0<br />
Self funding/DC reserve<br />
movements<br />
-220 240 -41<br />
Operations funded by<br />
general rates<br />
948 1,620 1,435<br />
Capital funding<br />
Funding from<br />
depreciation (rates)<br />
320 503 115<br />
Loans from/(to)<br />
corporate fund<br />
62 0 1,428<br />
Capital grants 30 0 547<br />
Development<br />
contributions<br />
0 0 0<br />
Reserves net 0 0 0<br />
Asset sales 0 0 0<br />
Total capital 412 503 2,090<br />
* Non cash adjustments due to revaluation<br />
60 <strong>Rotorua</strong> <strong>District</strong> <strong>Council</strong> ANNUAL REPORT 2011/12
Capital expenditure<br />
2012<br />
actual<br />
$000<br />
Convention Centre renewals 49<br />
Stage house upgrade 91<br />
Energy Event Centre assets<br />
110<br />
replacement<br />
Soundshell renewals 29<br />
International Stadium asset<br />
20<br />
replacement<br />
Installation of optical fibre 112<br />
New plant for events and<br />
1<br />
community programmes<br />
412<br />
Variance from budget<br />
• Direct costs are unfavourable compared to<br />
budget due to expenditure incurred for<br />
preparation for the Rugby World Cup.<br />
• Other costs are for non cash asset adjustment<br />
entries.<br />
• Fees and charges are favourable due to Rugby<br />
World Cup ticketing income.<br />
Events and Venues<br />
How we performed<br />
Level of Service Performance measures Target for 2011/12 Achievement Comments<br />
Excellent well<br />
maintained and well<br />
used venues.<br />
Encourage and<br />
promote a wide range<br />
of events and<br />
conferences with high<br />
levels of participation<br />
that add to the appeal<br />
of <strong>Rotorua</strong> for its citizens<br />
and visitors.<br />
Number of <strong>Rotorua</strong> residents<br />
who use an Events and<br />
Venues facility during the<br />
<strong>year</strong>.<br />
% of users satisfied with the<br />
level of service.<br />
% of repeat bookings from<br />
commercial clients within a<br />
three <strong>year</strong> period.<br />
% of hirers are from<br />
community groups.<br />
% increase due to growth in<br />
relation to participation levels.<br />
80% 86% (achieved) Community satisfaction<br />
survey result.<br />
85% 87% (achieved) Community satisfaction<br />
survey result.<br />
50% 73% (achieved) There were 142 repeat<br />
bookings from<br />
commercial clients for<br />
the <strong>year</strong> which<br />
represented 73%.<br />
40% 69.5% (achieved) 1,142 community groups<br />
hired venues out of<br />
1,643 for the <strong>year</strong>.<br />
3% 19% (278,528)<br />
(achieved)<br />
Increase in activity from<br />
224,285 pax last <strong>year</strong>,<br />
due to three Rugby<br />
World Cup international<br />
fixtures and venue<br />
based Fan Zone activity.<br />
Number of conferences each<br />
<strong>year</strong>.<br />
Number of delegates<br />
attending each <strong>year</strong>.<br />
> 34 34 (achieved)<br />
> 11,000 15,632 (achieved)<br />
Excludes Destiny Church<br />
activity (3,200 pax)<br />
which has been<br />
classified as a ‘meeting’.<br />
Community satisfaction survey<br />
The graphs below have been prepared from the annual Community satisfaction survey.<br />
Event promotion<br />
Event promotion<br />
100%<br />
85% 83% 85% 83% 86%<br />
50%<br />
45%<br />
42%<br />
% very / fairly satisfied<br />
80%<br />
60%<br />
40%<br />
20%<br />
% very satisfied<br />
40%<br />
30%<br />
20%<br />
10%<br />
0%<br />
2008 2009 2010 2011 2012<br />
0%<br />
RDC<br />
2011<br />
RDC<br />
2012<br />
This graph shows the percentage of survey respondents very<br />
or fairly satisfied with this service over the last five <strong>year</strong>s.<br />
This graph shows the percentage of survey respondents “very”<br />
satisfied with this service over the last two <strong>year</strong>s.<br />
<strong>Rotorua</strong> <strong>District</strong> <strong>Council</strong> ANNUAL REPORT 2011/12<br />
61
Inspection<br />
Inspection<br />
Community Outcomes<br />
Healthy<br />
• By protecting and preserving public health.<br />
• By providing effective responses to developing<br />
health issues.<br />
What it cost us<br />
2012<br />
actual<br />
$000<br />
<strong>Annual</strong><br />
Plan<br />
$000<br />
2011<br />
actual<br />
$000<br />
Operating expenses<br />
Direct costs 1,032 1,089 1,306<br />
Financial costs 0 1 0<br />
Depreciation 3 4 5<br />
Other* 2 0 0<br />
Total costs 1,037 1,094 1,311<br />
Revenue<br />
Capital revenue 0 0 0<br />
General rates 0 0 0<br />
Fees and charges 390 403 342<br />
Investment income 0 0 0<br />
Subsidies and grants 0 0 0<br />
Targeted rates 0 0 0<br />
Other income* 0 0 0<br />
Total revenue 390 403 342<br />
What we do<br />
• Promote and conserve public health.<br />
• Register and inspect food premises, hairdressers<br />
and camping grounds.<br />
• Investigate health complaints, monitor water<br />
supplies, swimming pool water quality and<br />
noise control.<br />
• Manage the district licensing agency to ensure<br />
managers and licenced premises hold the<br />
appropriate liquor licence and to work towards<br />
a reduction in abuse of liquor in the community.<br />
• Provide a complaint response service for<br />
matters covered by a number of bylaws to<br />
minimise nuisance to the general public (this<br />
includes signs, obstruction of public property,<br />
and disposal of abandoned vehicles, littering,<br />
prostitution and gambling).<br />
• Administer the Geothermal Safety Bylaw 2008.<br />
Provide an advisory role including undertaking<br />
testing for the presence of hydrogen sulphide<br />
gas with the intention of ensuring as far as<br />
possible, the safety of public from geothermal<br />
activity.<br />
• Ensure public safety in the handling and<br />
storage of hazardous substances.<br />
Why we do it<br />
To enhance the health, safety, comfort and wellbeing<br />
of residents and visitors within the district by<br />
encouraging wise use and protection of the<br />
environment and sustainable resource<br />
management.<br />
Net cost of service 647 691 969<br />
Capital costs<br />
Renewals 20 0 0<br />
Growth 0 0 0<br />
Backlog 0 0 0<br />
Level of service 0 0 0<br />
Total capital 20 0 0<br />
Operational funding<br />
Net cost of service of<br />
general rate activities<br />
647 691 969<br />
Plus capital revenue 0 0 0<br />
Less depreciation -4 -4 -5<br />
Depreciation funded by<br />
general rates<br />
20 0 0<br />
Add back half share<br />
roading depreciation<br />
0 0 0<br />
Self funding/DC reserve<br />
movements<br />
0 0 0<br />
Operations funded by<br />
general rates<br />
663 687 964<br />
Capital funding<br />
Funding from<br />
depreciation (rates)<br />
20 0 0<br />
Loans from/(to)<br />
corporate fund<br />
0 0 0<br />
Capital grants 0 0 0<br />
Development<br />
contributions<br />
0 0 0<br />
Reserves net 0 0 0<br />
Asset sales 0 0 0<br />
Total capital 20 0 0<br />
* Non cash adjustments due to revaluation<br />
62 <strong>Rotorua</strong> <strong>District</strong> <strong>Council</strong> ANNUAL REPORT 2011/12
Capital expenditure<br />
2012<br />
actual<br />
$000<br />
Sound level meter 20<br />
20<br />
Variance from budget<br />
• Direct costs are favourable compared to<br />
budget due to a staff vacancy and savings in<br />
advertising, legal advice, stationery and<br />
subscriptions.<br />
• Fees and charges are unfavourable due to less<br />
liquor licenses, general regulatory and health<br />
licenses activity.<br />
Inspection<br />
How we performed<br />
Level of Service Performance measures Target for 2011/12 Achievement Comments<br />
Environmental Health –<br />
Promotion and<br />
conservation of public<br />
health by inspection<br />
and registration of food<br />
premises, hairdressers<br />
and camping grounds,<br />
investigation/resolution<br />
of noise and health<br />
nuisances/ complaints.<br />
% of health complaints<br />
responded to within 1.5<br />
working days.<br />
100% 100% (achieved) There were 237 health<br />
complaints for the<br />
<strong>year</strong> which were<br />
responded to within<br />
1.5 working days.<br />
% of food premises registered. 100% 100% (achieved) There were 703 food<br />
premises registered<br />
during the <strong>year</strong>.<br />
% of noise complaints<br />
responded to within 2 hours.<br />
100% 100% (achieved) There were 406 noise<br />
complaints, all of<br />
which were<br />
responded to within 2<br />
hours by staff.<br />
<strong>District</strong> Licensing<br />
Agency – Inspection of<br />
licensed premises to<br />
ensure compliance with<br />
licence conditions and<br />
Sale of Liquor Act.<br />
General –<br />
Investigation/resolution<br />
of<br />
complaints/nuisances.<br />
Geothermal –<br />
Investigation/resolution<br />
of complaints about<br />
geothermal issues and<br />
provision of gas level<br />
testing service. Ensuring<br />
compliance with<br />
provisions of<br />
Geothermal Safety<br />
Bylaw.<br />
Hazardous Substances –<br />
Ensuring compliance<br />
with provisions of<br />
hazardous substances<br />
legislation and<br />
regulations in private<br />
dwellings and public<br />
places.<br />
% of licensed premises<br />
inspected under Sale of<br />
Liquor Act at least once every<br />
12 months.<br />
% of general complaints<br />
responded to within 1 working<br />
day.<br />
% of litter complaints<br />
responded to within 1 working<br />
day.<br />
% of geothermal gas<br />
complaints responded to<br />
within 1 working day.<br />
% of hazardous substance<br />
complaints responded to<br />
within 1 working day.<br />
100% 100% (achieved) 294 premises were<br />
inspected. There are<br />
294 registered<br />
licensed premises in<br />
total.<br />
100% 94% (not achieved) 263 / 279 complaints<br />
responded to within 1<br />
working day.<br />
100% 91% (not achieved) 42 / 46 litter<br />
complaints responded<br />
to within 1 working<br />
day.<br />
100% 100% (achieved) 30 geothermal gas<br />
complaints received<br />
which were all<br />
responded to within 1<br />
working day.<br />
100% 100% (achieved) 2 complaints received<br />
which were both<br />
responded to within 1<br />
working day.<br />
<strong>Rotorua</strong> <strong>District</strong> <strong>Council</strong> ANNUAL REPORT 2011/12<br />
63
Inspection<br />
Community satisfaction survey<br />
The graphs below have been prepared from the annual Community satisfaction survey.<br />
Noise control<br />
Noise control<br />
% very / fairly satisfied<br />
100%<br />
75%<br />
50%<br />
25%<br />
82% 82% 84%<br />
78%<br />
83%<br />
% very satisfied<br />
40%<br />
30%<br />
20%<br />
10%<br />
29%<br />
37%<br />
32%<br />
33%<br />
0%<br />
2008 2009 2010 2011 2012<br />
0%<br />
RDC<br />
2011<br />
RDC<br />
2012<br />
Peer<br />
Group<br />
National<br />
Average<br />
This graph shows the percentage of survey respondents very<br />
or fairly satisfied with this service over the last five <strong>year</strong>s.<br />
This graph shows the percentage of survey respondents “very”<br />
satisfied with this service over the last two <strong>year</strong>s and compares<br />
it with our peer group and the national average for 2012.<br />
Other indicators<br />
General inspection - compliance<br />
500<br />
450<br />
442<br />
417<br />
499<br />
480<br />
442<br />
400<br />
350<br />
300<br />
250<br />
397<br />
379<br />
412<br />
396<br />
448<br />
351<br />
321 315<br />
338<br />
333<br />
329 327 347 352 350<br />
200<br />
150<br />
100<br />
50<br />
0<br />
2003 2004 2005 2006 2007 2008 2009 2010 2011 2012<br />
Complaint<br />
Comply<br />
<strong>year</strong> <strong>ended</strong> 30 June<br />
64 <strong>Rotorua</strong> <strong>District</strong> <strong>Council</strong> ANNUAL REPORT 2011/12
300<br />
250<br />
200<br />
150<br />
218<br />
210<br />
254<br />
248<br />
Env ironmental health - compliance<br />
291 278<br />
260<br />
182 177<br />
252<br />
195<br />
183<br />
200<br />
189<br />
227<br />
227<br />
265<br />
265<br />
237<br />
237<br />
Inspection<br />
100<br />
50<br />
0<br />
2003 2004 2005 2006 2007 2008 2009 2010 2011 2012<br />
Complaint<br />
Comply<br />
<strong>year</strong> <strong>ended</strong> 30 June<br />
Noise control - compliance<br />
4000<br />
3500<br />
3000<br />
2500<br />
2897<br />
2824<br />
3213<br />
2988<br />
2694 2634 2804<br />
2760<br />
2708 2877<br />
3324<br />
3087<br />
3818<br />
3573<br />
3412 3304<br />
3360<br />
3101<br />
3739<br />
3417<br />
2000<br />
1500<br />
1000<br />
500<br />
0<br />
2003 2004 2005 2006 2007 2008 2009 2010 2011 2012<br />
Complaint<br />
Comply<br />
<strong>year</strong> <strong>ended</strong> 30 June<br />
<strong>Rotorua</strong> <strong>District</strong> <strong>Council</strong> ANNUAL REPORT 2011/12<br />
65
Parking Enforcement<br />
Parking Enforcement<br />
What it cost us<br />
Operating expenses<br />
2012<br />
actual<br />
$000<br />
<strong>Annual</strong><br />
Plan<br />
$000<br />
2011<br />
actual<br />
$000<br />
Direct costs 965 1,026 867<br />
Financial costs 1 1 1<br />
Depreciation 15 6 14<br />
Other* 1 0 0<br />
Total costs 982 1,033 882<br />
Revenue<br />
Capital revenue 0 0 0<br />
General rates 0 0 0<br />
Fees and charges 1,503 1,802 1,750<br />
Investment income 0 0 0<br />
Subsidies and grants 0 0 0<br />
Targeted rates 0 0 0<br />
Other income* 0 0 0<br />
Total revenue 1,503 1,802 1,750<br />
Net cost of service -521 -769 -868<br />
What we do<br />
• Ensure there is a turnover of traffic in all areas of<br />
parking<br />
• Ensure that drivers adhere to road rules<br />
• Check meters and pay-and-display machines<br />
• Check that vehicles are compliant and have a<br />
current certificate of vehicle inspection and<br />
current licence label<br />
• Ensure that mobility parking spaces are<br />
available for genuine users<br />
Why we do it<br />
To maximise the availability of parking during<br />
working/shopping hours to ensure the CBD area<br />
has a regular turnover of parking spaces, and so<br />
that parking is carried out in a safe manner.<br />
Community Outcomes<br />
Safe and Caring<br />
• By enforcing the parking regime and ensuring<br />
that vehicles are roadworthy.<br />
Prosperous Economy<br />
• By encouraging more businesses to invest in the<br />
area due to the availability of parking for<br />
customers and workers alike.<br />
Capital costs<br />
Renewals 0 0 37<br />
Growth 0 0 0<br />
Backlog 0 0 0<br />
Level of service 0 0 0<br />
Total capital 0 0 37<br />
Operational funding<br />
Net cost of service of<br />
general rate activities<br />
-521 -769 -868<br />
Plus capital revenue 0 0 0<br />
Less depreciation -17 -6 -14<br />
Depreciation funded by<br />
general rates<br />
0 0 37<br />
Add back half share<br />
roading depreciation<br />
0 0 0<br />
Self funding/DC reserve<br />
movements<br />
0 0 0<br />
Operations funded by<br />
general rates<br />
-538 -775 -845<br />
Capital funding<br />
Funding from<br />
depreciation (rates)<br />
0 0 37<br />
Loans from/(to)<br />
corporate fund<br />
0 0 0<br />
Capital grants 0 0 0<br />
Development<br />
contributions<br />
0 0 0<br />
Reserves net 0 0 0<br />
Asset sales 0 0 0<br />
Total capital 0 0 37<br />
* Non cash adjustments due to revaluation<br />
66 <strong>Rotorua</strong> <strong>District</strong> <strong>Council</strong> ANNUAL REPORT 2011/12
Variance from budget<br />
• Direct costs favourable due to savings on Court<br />
filing fees, motor registration enquiries and staff<br />
uniforms.<br />
• Fees and charges are unfavourable due to less<br />
parking infringement fees and less prosecution<br />
income.<br />
How we performed<br />
Parking Enforcement<br />
Level of Service Performance measures Target for 2011/12 Achievement Comments<br />
Ensure CBD retailing is<br />
provided with a regular<br />
turnover of parking<br />
spaces for potential<br />
customers.<br />
% average parking availability<br />
(1 in 7 spaces available<br />
between 10am and 3pm as<br />
measured by periodic<br />
survey*).<br />
15% Achieved Surveys completed on<br />
demand within target<br />
range where measured.<br />
Ensure parking<br />
restrictions are<br />
enforced.<br />
Number of days enforcement<br />
is undertaken.<br />
5.5 days/week Achieved Enforcement officers out<br />
on the streets Monday<br />
to Friday 9:00am to<br />
5:00pm and Saturday<br />
from 9:00am to<br />
12:00noon.<br />
* a number of blocks are surveyed each <strong>year</strong> in response to feedback from parking enforcement officers or queries from retailers<br />
and shoppers<br />
<strong>Rotorua</strong> <strong>District</strong> <strong>Council</strong> ANNUAL REPORT 2011/12<br />
67
<strong>Rotorua</strong> Museum<br />
<strong>Rotorua</strong> Museum<br />
Reflecting the value added through the capital<br />
investment <strong>Council</strong> has increased its adult<br />
admission price to visitors to $18.00. However this<br />
remains one of the most popular competitive<br />
<strong>Rotorua</strong> tourist destinations.<br />
What we do<br />
The <strong>Rotorua</strong> Museum (Te Whare Taonga o Te<br />
Arawa) is situated in the Bathhouse, an historic<br />
landmark building sited strategically in<br />
Government Gardens, a heritage precinct of<br />
national importance. The Bathhouse building holds<br />
a category 1 classification from the NZ Historic<br />
Places Trust, the highest level of significance for<br />
buildings in New Zealand.<br />
The museum opens to the public every day except<br />
Christmas Day, from 9am to 8pm daily during NZ<br />
daylight saving time, and from 9am to 5pm the rest<br />
of the <strong>year</strong>, with entry for local residents remaining<br />
free.<br />
The Centennial Project was completed in 2011 with<br />
the opening of the Don Stafford wing. A three<br />
stage project reinstating the viewing platform<br />
(2006), extension to the North Wing (2008) and<br />
construction of the south wing (2011) has<br />
completed the building to its original footprint<br />
proposed by Dr Arthur Wohlmann more than 100<br />
<strong>year</strong>s after the building first opened to the public.<br />
The $22 million project was made possible by<br />
generous funding partnerships including <strong>Rotorua</strong><br />
<strong>District</strong> <strong>Council</strong>, <strong>Rotorua</strong> Trust, Central Government,<br />
and the Museum Centennial Trust.<br />
Exhibitions<br />
• Taking the Cure<br />
Tells the story of the Bathhouse building and the<br />
origins of tourism in <strong>Rotorua</strong>.<br />
• Maori Battalion<br />
B Company of 28 Maori Battalion was made up<br />
of volunteers from the <strong>Rotorua</strong>/Bay of Plenty/<br />
Thames-Coromandel areas and fought in some<br />
of the most famous campaigns of WWII. This<br />
exhibition is a tribute to those men, and the<br />
people they left behind.<br />
• Tarawera Eruption<br />
The 1886 eruption of Mount Tarawera changed<br />
the lives for all who lived in this area forever. The<br />
fabulous Pink and White Terraces were<br />
destroyed, along with many villages around the<br />
mountain. This exhibition tells the story of the<br />
fateful night and remembers the victims, both<br />
Maori and Pakeha.<br />
• <strong>Rotorua</strong> Stories cinema<br />
An interactive theatre experience telling the<br />
stories of <strong>Rotorua</strong> in a dramatic and<br />
entertaining way was added to the museum’s<br />
attractions in 1998, and has been upgraded at<br />
regular intervals since. It remains a core part of<br />
the museum experience for locals and visitors<br />
alike.<br />
• Mudbath Basement<br />
The famous Mudbath Basement has recently<br />
been opened up again to visitors after 100<br />
<strong>year</strong>s. Visitors must go through the basement of<br />
the building to arrive at the mudbaths which<br />
have sat undisturbed for over 100 <strong>year</strong>s.<br />
• Viewing platform<br />
Reinstatement of the historic viewing<br />
promenade on the North Wing roof (Stage 1 of<br />
the centennial project) was completed in<br />
March 2006, and made possible by grants from<br />
the Ministry of Tourism and the NZ Lotteries<br />
Grants Board, supplementing annual plan<br />
funding from RDC.<br />
• Nga Pumanawa o Te Arawa<br />
A major exhibition covering eight galleries in the<br />
new Don Stafford Wing (opened September<br />
2011) tells the story of the Arawa people from<br />
origins in Hawaiiki through until present day<br />
<strong>Rotorua</strong>. A number of significant Te Arawa<br />
taonga have returned to <strong>Rotorua</strong> Museum on<br />
loan from institutions around New Zealand and<br />
68 <strong>Rotorua</strong> <strong>District</strong> <strong>Council</strong> ANNUAL REPORT 2011/12
overseas for this groundbreaking new<br />
exhibition.<br />
Programmes<br />
A dynamic and active programme of public<br />
lectures, films, tours, floor talks and children’s<br />
activities is provided throughout the <strong>year</strong>. Some of<br />
the events are so popular that dozens of people<br />
are turned away.<br />
Guided tours<br />
Guided tours provided by a team of over 80<br />
volunteer docent guides have become a core<br />
part of the <strong>Rotorua</strong> Museum experience. The<br />
guides undergo a rigorous 14 week training<br />
programme before graduating and starting their<br />
careers as guides for museum visitors. Tours take<br />
place on the hour in the summer months and five<br />
times daily in winter.<br />
Education<br />
Since 1998 the museum has been contracted by<br />
the Ministry of Education to provide ‘Learning<br />
Experiences Outside the Classroom’ to some<br />
12,000 school students per annum. Two teachers<br />
are employed to develop and deliver curriculumlinked<br />
programmes and school groups come from<br />
all over New Zealand to use the service. The<br />
current contract expires in 2013 after which the<br />
museum will seek a new contract.<br />
A dynamic and active programme of public<br />
lectures, films, tours, floor talks and children’s<br />
activities is provided throughout the <strong>year</strong>. Some<br />
events are so popular that people are turned<br />
away.<br />
Programme is contract has been ext<strong>ended</strong> to<br />
30 June 2014.<br />
• Museum bus – funded by the Ngati Whakaue<br />
Education Endowment Trust, the Museum Bus<br />
provided transportation to <strong>Rotorua</strong> Museum for<br />
over 5,000 local students from decile one to five<br />
schools. Since its inception, 11,996 students<br />
have taken advantage of this initiative, with<br />
every eligible school in the district utilising this<br />
service.<br />
• Exhibitions and public programmes – 31<br />
exhibitions, and 77 public programmes were<br />
hosted during the <strong>year</strong>. Floor talks, and other<br />
public programmes – Nightmare at the<br />
Museum, Museum by Torchlight, Great Easter<br />
Egg Hunt & Crack the Code – prove to be very<br />
popular, in which there were 6426 active<br />
participants (not including accompanying<br />
family members to <strong>Rotorua</strong>). Newly created<br />
public programmes have attracted a younger<br />
audience, diversifying the museum’s visitor<br />
cohort, such as Nightmare at the Museum of<br />
which hundreds were turned away.<br />
• Visitor numbers, and admission revenue – a<br />
total of 108,721 visitors came during the <strong>year</strong> –<br />
32% local, 27% domestic, 41% International –<br />
which has also resulted in an increase in the<br />
spend per visitor to the Museum.<br />
• Customer satisfaction – quantitative information<br />
collated by Museums Aotearoa (through a<br />
nationwide survey of 33 museum), indicates<br />
95% were ‘satisfied’ with their visitor experience<br />
at <strong>Rotorua</strong> Museum compared to 88% for all<br />
museum.<br />
Community Outcomes<br />
<strong>Rotorua</strong> Museum<br />
Why we do it<br />
• To provide a world class museum for the<br />
community and visitors<br />
• To collect, preserve and interpret local material<br />
cultural heritage for the benefit of future<br />
generations<br />
• To maintain the integrity of the Bathhouse as an<br />
iconic <strong>Rotorua</strong> and New Zealand building.<br />
This <strong>year</strong>’s highlights and achievements<br />
included:<br />
• Centennial project – construction of Stage III,<br />
the South Wing, was completed in September<br />
2011 with the official opening of the Don<br />
Stafford Wing. The new wing now holds a world<br />
class exhibition of Te Arawa Taonga (Treasures)<br />
and two additional art galleries. The BathHouse<br />
has now been completed to its original<br />
footprint planned by Dr Arthur Stanley<br />
Wohlmann in 1902.<br />
• Education programme – a total of 12,043 school<br />
students visited to participate in curriculumlinked<br />
learning opportunities delivered by the<br />
museum educators. The education<br />
programme, largely funded by the Ministry of<br />
Education, is now in its eleventh <strong>year</strong>. The<br />
Thriving<br />
• By providing great facilities to visit.<br />
• By fostering artistic expression, art, music,<br />
dance, public performances and exhibitions.<br />
Learning<br />
• By providing learning activities accessible for<br />
everyone.<br />
• By providing quality educational institutions.<br />
Prosperous Economy<br />
• By marketing the museum to encourage<br />
people to visit.<br />
• By providing ‘value added’ products available<br />
for purchase.<br />
<strong>Rotorua</strong> <strong>District</strong> <strong>Council</strong> ANNUAL REPORT 2011/12<br />
69
<strong>Rotorua</strong> Museum<br />
• What it cost us<br />
Operating expenses<br />
2012<br />
actual<br />
$000<br />
<strong>Annual</strong><br />
Plan<br />
$000<br />
2011<br />
actual<br />
$000<br />
Direct costs 3,079 2,811 2,743<br />
Financial costs 153 183 178<br />
Depreciation 449 960 406<br />
Other* 181 0 7<br />
Total costs 3,862 3,954 3,334<br />
Revenue<br />
Capital revenue 8 5,285 7,472<br />
General rates 0 0 0<br />
Fees and charges 1,237 1,526 1,075<br />
Investment income 0 0 0<br />
Subsidies and grants 16 0 10<br />
Targeted rates 0 0 0<br />
Other income* 0 0 0<br />
Total revenue 1,261 6,811 8,557<br />
Net cost of service 2,601 -2,857 -5,223<br />
Capital costs<br />
Renewals 66 101 -35<br />
Growth 0 8 417<br />
Backlog 0 0 622<br />
Level of service 1,802 1,400 8,825<br />
Total capital 1,868 1,509 9,829<br />
Operational funding<br />
Net cost of service of<br />
general rate activities<br />
2,601 -2,857 -5,223<br />
Plus capital revenue 8 5,285 7,472<br />
Less depreciation -662 -960 -413<br />
Depreciation funded by<br />
general rates<br />
66 101 -35<br />
Add back half share<br />
roading depreciation<br />
0 0 0<br />
Self funding/DC reserve<br />
movements<br />
0 0 0<br />
Operations funded by<br />
general rates<br />
2,013 1,569 1,801<br />
Capital expenditure<br />
2012<br />
actual<br />
$000<br />
Additional capital purchases 1<br />
Air conditioning 19<br />
Museum asset replacement 19<br />
Audio visual 7<br />
Centennial development 1,714<br />
Equipment 1<br />
Furniture 14<br />
Off-site storage 4<br />
Tarawera eruption exhibition 89<br />
Variance from budget<br />
1,868<br />
• Direct costs include additional expenditure<br />
related to the opening of the new Don Stafford<br />
Wing and include increased electricity<br />
consumption, plant maintenance, insurance<br />
and marketing costs.<br />
• Other costs refer to non cash asset adjustment<br />
entries.<br />
• Fees and charges are unfavourable due to<br />
lower admissions and less retail revenue than<br />
budgeted.<br />
• Capital revenue refers to the external funding<br />
contributions towards the development of the<br />
Centennial Project. The budgeted amount was<br />
received in the previous financial <strong>year</strong>. further<br />
funding is to come to council in the 2013 and<br />
2014 financial <strong>year</strong>s as per funding agreements.<br />
• Subsidies and grants relate to Ngati Whakaue<br />
grants and income for advertising.<br />
Capital funding<br />
Funding from<br />
depreciation (rates)<br />
64 101 -35<br />
Loans from/(to)<br />
corporate fund<br />
437 362 2,533<br />
Capital grants 1,367 1,046 6,900<br />
Development<br />
contributions<br />
0 0 431<br />
Reserves net 0 0 0<br />
Asset sales 0 0 0<br />
Total capital 1,868 1,509 9,829<br />
* Non cash adjustments due to revaluation<br />
70 <strong>Rotorua</strong> <strong>District</strong> <strong>Council</strong> ANNUAL REPORT 2011/12
How we performed<br />
Level of Service Performance measures Target for 2011/12 Achievement Comments<br />
An outstanding<br />
museum experience,<br />
open seven days a<br />
week and free to local<br />
residents of <strong>Rotorua</strong>.<br />
% of households in <strong>Rotorua</strong><br />
that visit the museum each<br />
<strong>year</strong>.<br />
% of local residents very/ fairly<br />
satisfied with the museum<br />
and its services<br />
60% 66% (achieved) 66% of <strong>Rotorua</strong><br />
households reporting<br />
having visited the<br />
museum each <strong>year</strong><br />
80% with an<br />
increasing trend<br />
corresponding with<br />
future capital<br />
development of the<br />
museum<br />
84% (achieved) 84% of local residents<br />
are very/ fairly satisfied<br />
with the museum and its<br />
services<br />
<strong>Rotorua</strong> Museum<br />
Collect, preserve,<br />
catalogue and<br />
conserve the<br />
community's cultural<br />
heritage.<br />
Interpret and display<br />
the art, culture and<br />
stories of <strong>Rotorua</strong> and<br />
Te Arawa via a number<br />
of permanent<br />
exhibitions.<br />
Provide a range of<br />
educational levels<br />
including primary,<br />
secondary, tertiary and<br />
adult learning.<br />
Number of collections and<br />
items.<br />
Number of permanent<br />
exhibition galleries.<br />
Number of public<br />
programmes<br />
(workshops/lectures) per <strong>year</strong>.<br />
Number of students each<br />
<strong>year</strong> participating in the<br />
LEOTC programme<br />
(curriculum based learning).<br />
7 Achieved The museum continues<br />
to maintain 7<br />
permanent collections<br />
with 54,615 catalogued<br />
records.<br />
7 Achieved The museum continues<br />
to maintain 7<br />
permanent collections.<br />
20 77 (achieved) 77 public programmes<br />
(workshops/lectures)<br />
were undertaken for the<br />
<strong>year</strong>, involving a total of<br />
6,426 people.<br />
12,000 12,071 (achieved) 12,071 students<br />
participated in the<br />
LEOTC programme for<br />
the <strong>year</strong>.<br />
(NB: New contract with<br />
MOE is set at 11,000<br />
students).<br />
Provide a range of<br />
unique exhibitions from<br />
other parts of New<br />
Zealand.<br />
Number of touring exhibitions. 20 36 (achieved) 36 touring or changing<br />
exhibitions were hosted<br />
during the <strong>year</strong>.<br />
Number of language based<br />
navigational maps so<br />
museum visitors can self-guide<br />
around the museum.<br />
14 14 (achieved) At all times throughout<br />
the <strong>year</strong> there were at<br />
least 14 navigational<br />
maps available for<br />
visitors.<br />
Number of guided tours per<br />
day.<br />
7 Achieved There were 7 guided<br />
tours each day during<br />
winter and 8 guided<br />
tours during summer.<br />
<strong>Rotorua</strong> <strong>District</strong> <strong>Council</strong> ANNUAL REPORT 2011/12<br />
71
<strong>Rotorua</strong> Museum<br />
Community satisfaction survey<br />
The graphs below have been prepared from the annual Community satisfaction survey.<br />
% very / fairly satisfied<br />
<strong>Rotorua</strong> museum<br />
100%<br />
79% 80% 84%<br />
80%<br />
76%<br />
75%<br />
50%<br />
25%<br />
% very satisfied<br />
<strong>Rotorua</strong> museum<br />
75%<br />
66%<br />
51%<br />
50%<br />
36%<br />
25%<br />
46%<br />
0%<br />
2008 2009 2010 2011 2012<br />
0%<br />
RDC<br />
2011<br />
RDC<br />
2012<br />
Peer<br />
Group<br />
National<br />
Average<br />
This graph shows the percentage of survey respondents very<br />
or fairly satisfied with this service over the last five <strong>year</strong>s.<br />
This graph shows the percentage of survey respondents “very”<br />
satisfied with this service over the last two <strong>year</strong>s and compares<br />
it with our peer group and the national average for 2012.<br />
72 <strong>Rotorua</strong> <strong>District</strong> <strong>Council</strong> ANNUAL REPORT 2011/12
Tourism<br />
Tourism<br />
to provide quoting and booking services for school<br />
groups visiting <strong>Rotorua</strong>.<br />
Information (i-SITE)<br />
A full information service is provided for <strong>Rotorua</strong><br />
and the rest of New Zealand through counter<br />
enquiries, email requests and phone calls.<br />
‘The Organiser’<br />
A one-stop-shop for groups (international and<br />
domestic), corporates, associations and<br />
conference organising. The conference and event<br />
services provided are full registration, budget and<br />
accounting, development of programmes, venue<br />
management, speaker liaison, sponsorship and<br />
exhibition along with promotion of an event.<br />
Group services provided include quotes, itinerary<br />
planning (<strong>Rotorua</strong> tours or NZ-wide tours) and New<br />
Zealand-wide attraction, accommodation and<br />
travel arrangements.<br />
Why we do it<br />
What we do<br />
Destination <strong>Rotorua</strong> Marketing<br />
The goals of this service are driven by opportunities<br />
identified for growth, key areas of focus based on<br />
changing tourism trends, strengthening the local<br />
market and brand positioning. The key goals are<br />
to:<br />
1. Aggressively target and grow the Asian visitor<br />
market – specifically China.<br />
2. Grow and increase <strong>Rotorua</strong>’s share of the<br />
Australian visitor market – especially off-peak.<br />
3. Increase average room nights and spend, to<br />
be equal to the national average, for both<br />
international and domestic visitors to <strong>Rotorua</strong>.<br />
4. Increase the Auckland visitor market by 5% to<br />
50,000 visitor nights.<br />
5. Work in partnership with wider-<strong>Rotorua</strong><br />
regional operators and Tourism New Zealand.<br />
6. Take a leadership position in online marketing<br />
and travel search.<br />
7. Increase ease of access to <strong>Rotorua</strong> as a visitor<br />
destination by helping <strong>Rotorua</strong> International<br />
Airport gain additional services.<br />
Travel and Information Office<br />
Domestic travel bookings<br />
Offers a comprehensive domestic travel<br />
reservation service for <strong>Rotorua</strong> and New Zealand<br />
products to local residents and visitors.<br />
Commercial returns are earned through<br />
commissions on sightseeing and travel sales. It is<br />
also contracted to the <strong>Rotorua</strong> Education Network<br />
The focus of Destination <strong>Rotorua</strong> Marketing has<br />
been broadened to encompass the marketing of<br />
<strong>Rotorua</strong> as a great place to live, play, work and<br />
invest. Underpinning our performance are three<br />
clear aims: To re-engage our industry; To lead<br />
and initiate in the marketing of <strong>Rotorua</strong>; and To<br />
build ‘Brand <strong>Rotorua</strong>’.<br />
The <strong>Rotorua</strong> Travel Office and i-SITE provides a<br />
point of first contact for visitors for information, and<br />
for booking things to see and do around <strong>Rotorua</strong><br />
and the rest of New Zealand.<br />
This <strong>year</strong>’s highlights and achievements<br />
included:<br />
• Mercurios Menu - <strong>Rotorua</strong> was featured in a<br />
programme hosted by Paul Mercurio showing<br />
some of <strong>Rotorua</strong>’s key attractions, sights and<br />
features including covering off some key<br />
messaging around local features such as the<br />
Kuirau markets, vibrant café offerings, luxury<br />
lodges and indigenous cuisine. Over 8 million<br />
people watched the initial screening and over<br />
25 million were exposed to it through Yahoo!7.<br />
• Marketing and PR activities - <strong>Rotorua</strong> as a<br />
region has experienced a +400% increase in<br />
destinational print and online features and<br />
write-ups, including a destinational story in a<br />
major NZ domestic weekly paper every 2.5<br />
weeks, online media story every week and<br />
external influencer social media write-up every<br />
week.<br />
• No.1 Queen Street Café - launched on 8<br />
September and surrounded by over 200,000<br />
people in the first week.<br />
• Urban PR plan – launched to address<br />
misperceptions of <strong>Rotorua</strong> in the key domestic<br />
<strong>Rotorua</strong> <strong>District</strong> <strong>Council</strong> ANNUAL REPORT 2011/12<br />
73
Tourism<br />
market of Auckland. PR briefings to industry and<br />
stories were seeded with exceptional results.<br />
• Air New Zealand - chose <strong>Rotorua</strong> as one of 2<br />
destinations to film their new brand campaign<br />
for Hong Kong called “Experience You”. Air<br />
New Zealand invited Chet Lam a famous singer<br />
in Hong Kong to get inspired on a trip to NZ.<br />
Through his interactive journey, facebook users<br />
will discover the uniqueness of NZ and at the<br />
same time, their desire of meeting their “NEW<br />
YOU” is awakened.<br />
Community Outcomes<br />
Prosperous Economy<br />
• By promoting our district’s unique qualities to<br />
encourage more people to live, work and<br />
invest<br />
• By ensuring <strong>Rotorua</strong> is renowned for tourism; a<br />
vibrant tourism sector provides more<br />
employment opportunities for locals.<br />
What it cost us<br />
Operating expenses<br />
2012<br />
actual<br />
$000<br />
<strong>Annual</strong><br />
Plan<br />
$000<br />
2011<br />
actual<br />
$000<br />
Direct costs 4,962 5,590 5,275<br />
Financial costs 14 15 10<br />
Depreciation 81 95 87<br />
Other* 10 0 0<br />
Total costs 5,067 5,700 5,372<br />
Revenue<br />
Capital revenue 0 0 0<br />
General rates -1 0 0<br />
Fees and charges 2,038 2,173 1,912<br />
Investment income 32 60 36<br />
Subsidies and grants 2 600 335<br />
Targeted rates 2,232 2,225 2,415<br />
Other income* 0 0 0<br />
Total revenue 4,303 5,058 4,698<br />
Net cost of service 764 642 674<br />
Capital costs<br />
Renewals 5 9 0<br />
Growth 0 0 0<br />
Backlog 14 40 0<br />
Level of service 0 0 0<br />
Total capital 19 49 0<br />
Operational funding<br />
Net cost of service of<br />
general rate activities<br />
764 642 674<br />
Plus capital revenue 0 0 0<br />
Less depreciation -91 -95 -87<br />
Depreciation funded by<br />
general rates<br />
5 9 0<br />
Add back half share<br />
roading depreciation<br />
0 0 0<br />
Self funding/DC reserve<br />
movements<br />
0 0 0<br />
Operations funded by<br />
general rates<br />
678 556 587<br />
Capital funding 5 9 0<br />
Funding from<br />
depreciation (rates)<br />
14 40 0<br />
Loans from/(to)<br />
corporate fund<br />
0 0 0<br />
Capital grants 0 0 0<br />
Development<br />
contributions<br />
0 0 0<br />
Reserves net 0 0 0<br />
Asset sales<br />
Total capital 19 49 0<br />
* Non cash adjustments due to revaluation<br />
74 <strong>Rotorua</strong> <strong>District</strong> <strong>Council</strong> ANNUAL REPORT 2011/12
Capital expenditure<br />
2012<br />
actual<br />
$000<br />
Building and plant replacements 3<br />
Counter upgrade 14<br />
Fax copier and printer<br />
2<br />
replacement<br />
19<br />
Variance from budget<br />
• Direct costs are favourable due to reduced<br />
Australian marketing activity and reduced joint<br />
venture activities.<br />
• Fees and charges are unfavourable due to<br />
reduced demand and lower than anticipated<br />
industry interest in joint ventures activity.<br />
• Subsidies and grants are unfavourable to<br />
budget due to the Tourism New Zealand<br />
subsidy for joint ventures being discontinued.<br />
Tourism<br />
How we performed<br />
Level of Service Performance measures Target for 2011/12 Achievement Comments<br />
Destination Marketing<br />
Market <strong>Rotorua</strong> as a<br />
preferred destination for<br />
leisure, conference/<br />
incentive and events<br />
visitors of both<br />
international and<br />
domestic origin.<br />
Contribute to the number; the<br />
length of stay and the<br />
average spend of visitors to<br />
<strong>Rotorua</strong>.<br />
1.7 million visitors* 1.45 million visitors<br />
(not achieved)<br />
The Christchurch<br />
earthquakes resulted in<br />
a decline of<br />
international visitor<br />
activity in <strong>Rotorua</strong>. The<br />
reduced tourism<br />
capacity of<br />
Christchurch following<br />
the February 2011<br />
earthquake resulted in<br />
fewer visitors travelling<br />
on the Christchurch-<br />
<strong>Rotorua</strong> flights. Given<br />
Christchurch is <strong>Rotorua</strong>’s<br />
only direct air linkage<br />
with the South Island,<br />
some visitors that would<br />
have ordinarily used the<br />
Christchurch-<strong>Rotorua</strong><br />
flights opted out of<br />
travelling to <strong>Rotorua</strong> by<br />
other means.<br />
> 2.3 average nights 2.4 average nights<br />
(achieved)<br />
The Rugby World Cup<br />
including the<br />
Ireland/Russia game on<br />
(25 Sept), Waitangi Day<br />
(6 Feb) falling on a<br />
Monday and very good<br />
weather over the<br />
Easter/autumn school<br />
holiday period<br />
contributed to this<br />
successful outcome<br />
> $120 spend per<br />
person/day**<br />
Not measurable<br />
Overnight expenditure<br />
data no longer<br />
provided in regional<br />
tourism statistics.<br />
Encourage the <strong>Rotorua</strong><br />
tourism industry to<br />
deliver on the promise<br />
of Manaakitanga<br />
(provision of<br />
exceptional hospitality)<br />
to the visitor<br />
experience.<br />
Average visitor satisfaction<br />
rating of <strong>Rotorua</strong> experience<br />
as measured by the <strong>Rotorua</strong><br />
Regional Visitor Monitor.<br />
8 out of 10 score<br />
achieved<br />
8 (achieved) <strong>Rotorua</strong> Regional Visitor<br />
Monitor replaced by<br />
similar measure in Visitor<br />
Insights Programme.<br />
Encourage the uptake<br />
of sustainability within<br />
the tourism industry.<br />
% of businesses advertising in<br />
the <strong>Rotorua</strong> Visitor Guide that<br />
are associated with the<br />
<strong>Rotorua</strong> Sustainable Tourism<br />
Charter, Qualmark or Green<br />
Globe.<br />
80% 80% (achieved)<br />
<strong>Rotorua</strong> <strong>District</strong> <strong>Council</strong> ANNUAL REPORT 2011/12<br />
75
Tourism<br />
Level of Service Performance measures Target for 2011/12 Achievement Comments<br />
<strong>Rotorua</strong> Travel Office<br />
Booking services are<br />
provided to visitors to<br />
<strong>Rotorua</strong> to encourage<br />
ext<strong>ended</strong> length of stay<br />
and visitors spend.<br />
Provide an accessible,<br />
informative and friendly<br />
point of contact to<br />
visitors to <strong>Rotorua</strong>.<br />
Provide Conference<br />
and Group services.<br />
Amount of commissions<br />
revenue generated by Travel<br />
Office.<br />
% of satisfaction of industry<br />
members of the Tourism<br />
Advisory Board with the<br />
booking services provided by<br />
the Travel Office.<br />
% of customers satisfied or<br />
very satisfied as per annual<br />
customer survey.<br />
% of clients satisfied or very<br />
satisfied with levels of service.<br />
$1.8 million<br />
(Rugby World Cup<br />
<strong>year</strong>)<br />
Review against<br />
benchmark as set in<br />
2008/09<br />
$1.4 million<br />
(not achieved)<br />
N/A<br />
Due to economic<br />
downturn<br />
Tourism Advisory Board<br />
disestablished during the<br />
<strong>year</strong>.<br />
80% 98% (achieved) 200 customers were<br />
surveyed during the <strong>year</strong><br />
and 195 stated they<br />
were satisfied or very<br />
satisfied with the service<br />
they received.<br />
80% 98% (achieved) 200 customers were<br />
surveyed during the <strong>year</strong><br />
and 196 stated they<br />
were satisfied or very<br />
satisfied with the service<br />
they received.<br />
* 1.7 million visitors should have been stated as 1.7 million “overnight” visitors. The achievement was used measuring<br />
“overnight” visitor numbers.<br />
** Another measure that council does have available to them at this time is that an average of $82 per person per night is<br />
spent in <strong>Rotorua</strong>. This figure includes both day and overnight figures therefore the average spend does appear lower as<br />
day visitors do not require accommodation.<br />
76 <strong>Rotorua</strong> <strong>District</strong> <strong>Council</strong> ANNUAL REPORT 2011/12
Infrastructure Services Group<br />
Contribution to outcomes<br />
Visionary Community<br />
Leadership<br />
Community Outcomes<br />
Page Activities within this group<br />
79 Aquatic Facilities <br />
84<br />
Infrastructural Planning and<br />
Compliance<br />
<br />
87 Public Gardens and Open Spaces <br />
91 <strong>Rotorua</strong> Airport <br />
93 Stormwater and Land Drainage <br />
96 Transport <br />
100 Waste Management <br />
105 Wastewater <br />
109 Water Supplies <br />
Safe and caring<br />
Prosperous economy<br />
Environment<br />
Excellent facilities<br />
and services<br />
Living Maori culture<br />
Thriving<br />
Healthy<br />
Learning<br />
Infrastructure Services Group<br />
Overview of group<br />
The Infrastructure Services Group covers a wide<br />
range of asset based services and facilities.<br />
This group is important in enabling business<br />
development in the district – directly through<br />
provision of key infrastructure, and also in<br />
supporting planning and consenting processes.<br />
<strong>Council</strong> spends a significant portion of its operating<br />
and capital expenditure budgets on these<br />
activities, which include:<br />
• Aquatic Facilities<br />
• Infrastructure Planning and Compliance<br />
• Parks and Open Spaces<br />
• <strong>Rotorua</strong> International Airport<br />
• Stormwater and Land Drainage<br />
• Transport<br />
• Waste Management<br />
• Water supplies<br />
Infrastructure Services Group provides many of the<br />
key services traditionally associated with councils,<br />
such as water, sewerage, roads, parks and refuse<br />
collection. To provide these services council owns<br />
and manages many large and complex assets on<br />
behalf of the community.<br />
Some of the services provided are recognised as<br />
very important to the community and would not<br />
be provided to the level expected without<br />
council’s contribution and involvement.<br />
Performance targets<br />
Targets<br />
Achieved<br />
Not<br />
measured<br />
Not<br />
achieved<br />
Aquatic Facilities 8 5 - 3<br />
Infrastructural Planning and Compliance 5 4 - 1<br />
Public Gardens and Open Spaces 7 7 - -<br />
<strong>Rotorua</strong> Airport 2 2 - -<br />
Stormwater and Land Drainage 4 4 - -<br />
Transport 5 4 - 1<br />
Waste Management 5 3 - 2<br />
Wastewater 5 2 - 3<br />
Water Supplies 6 5 - 1<br />
Total 47 36 - 11<br />
<strong>Rotorua</strong> <strong>District</strong> <strong>Council</strong> ANNUAL REPORT 2011/12<br />
77
Infrastructure Services Group<br />
Targets not achieved for the Aquatic Facilities are<br />
based around the number of households using the<br />
facilities and the satisfaction levels. Satisfaction<br />
levels have been declining for the last five <strong>year</strong>s.<br />
Measures not achieved in the Wastewater activity<br />
were attributed to compliance issues and events<br />
leading to a number of overflows. The overflows<br />
were the results of a fat blockage, a hail storm, a<br />
pump failure and a large piece of loose concrete<br />
blocking a pipe.<br />
Net cost of service<br />
Issues/risks/negative impacts<br />
Potential negative effects associated with<br />
undertaking the activities within this group have<br />
been assessed and it is believed that there has<br />
been no impact to the social, cultural,<br />
environmental and economic well-being of the<br />
community/district during the <strong>year</strong>. potential<br />
effects were reviewed in preparing the Long-term<br />
Plan. these will be monitored and reported upon<br />
in future annual reports.<br />
$ in thousands<br />
-$14,954<br />
Aquatic Facilities<br />
-$584<br />
Public Gardens and Open Spaces<br />
<strong>Rotorua</strong> Airport<br />
Stormwater and Land Drainage<br />
Transport<br />
Waste Management<br />
$2,049<br />
Infrastructural Planning and Compliance<br />
$7,314<br />
$3,820<br />
$3,098<br />
$7,697<br />
$1,873<br />
Wastewater<br />
Water<br />
$1,162<br />
-$15,000 -$10,000 -$5,000 $- $5,000 $10,000<br />
Capital expenditure<br />
$ in thousands<br />
Aquatic Facility<br />
Infrastructural Planning and Compliance<br />
Public Gardens and Open Spaces<br />
<strong>Rotorua</strong> Airport<br />
Stormwater and Land Drainage<br />
$261<br />
$57<br />
$1,320<br />
$1,251<br />
$1,205<br />
Transport<br />
$12,441<br />
Waste Management<br />
$1,469<br />
Wastewater<br />
$17,130<br />
Water<br />
$3,468<br />
$- $5,000 $10,000 $15,000 $20,000<br />
78 <strong>Rotorua</strong> <strong>District</strong> <strong>Council</strong> ANNUAL REPORT 2011/12
Aquatic Facilities<br />
Water safety education<br />
The centre offers Learn to Swim programmes<br />
targeting all age groups, Unison Lake Safety<br />
Programme (major sponsor Unison Networks<br />
Limited), Rangatahi Lifeguard Award, Go4it<br />
Schools Swimming Initiative in conjunction with<br />
Water Safety New Zealand, Outrigging (Waka<br />
Ama), Central North Island Lifeguard Competition,<br />
Boat Safety in conjunction with <strong>Rotorua</strong><br />
Coastguard, Swim for Life Campaign, pre-entry<br />
Police swim testing, training and assessment.<br />
Aquatic Facilities<br />
What we do<br />
Aquatic facilities<br />
The <strong>Rotorua</strong> Aquatic Centre is open 7 days per<br />
week from 6am to 9pm and operates 364 days per<br />
<strong>year</strong>. It is a Pool Safe accredited facility.<br />
The facility holds Enviro Gold accreditation and a<br />
five star Qualmark certification from Tourism New<br />
Zealand’s official quality agency. The Aquatic<br />
Centre is also a member of the <strong>Rotorua</strong><br />
Sustainable Charter Incorporated.<br />
Recreational and sporting opportunities<br />
The centre is one of many major aquatic facilities<br />
based in the central North Island and caters for<br />
local, regional and national aquatic sports and<br />
provides recreational, health, fitness and leisure<br />
programmes and services. Sporting and physical<br />
activity opportunities include recreational<br />
programmes such as aqua jogging and aerobic<br />
classes, aqua mums, Green Team holiday<br />
programme and flippa ball (mini water polo).<br />
Other activities include swimming, water polo,<br />
canoe polo, outrigging (waka ama), underwater<br />
hockey, ‘Learn to Swim’ programmes, playground<br />
and inflatable fun, volleyball and onsite cardio<br />
studio.<br />
Health and community wellbeing<br />
The centre offers a variety of programmes and<br />
events throughout the <strong>year</strong> which cater for<br />
children, schools, teenagers, adults, parents and<br />
seniors. Programmes and events include children’s<br />
holiday programmes, whanau days, ‘heart stopper<br />
challenge’, ‘give it a go’ day, ladies nights and a<br />
women’s expo. The centre also supports a number<br />
of community initiatives including Salvation Army<br />
food bank appeal, SPCA, Bay Trust Rescue<br />
Helicopter, Keep <strong>Rotorua</strong> Beautiful, ‘Learn to Swim’<br />
Scholarships (which include a partnership with<br />
Ngati Whakaue Education Endowment Trust<br />
Board) as well as assistance in many other<br />
community fund raising events. The cardio studio<br />
contributes to healthy living by offering a range of<br />
cardio vascular equipment for building fitness,<br />
rehabilitation and weight management.<br />
Why we do it<br />
• To promote a fun, safe, healthy and active<br />
lifestyle to the local community at an<br />
affordable cost through a range of aquatic<br />
leisure and recreational opportunities.<br />
• To develop strategic community partnerships<br />
with swimming and sporting groups, recreation<br />
and health professionals, government agencies<br />
and private sector organisations.<br />
This <strong>year</strong>’s highlights and achievements<br />
included:<br />
• Helicopter Underwater Escape Training (HUET) –<br />
hosted in <strong>Rotorua</strong> on 9 and 10 March in<br />
conjunction with the BayTrust Rescue Helicopter<br />
service.<br />
• Visitor admissions - 333,250 total admissions<br />
which are 1,170 up on the previous <strong>year</strong>.<br />
• Learn to Swim - 47,692 total Learn to Swim<br />
participation which is up 2.5% on the previous<br />
<strong>year</strong>.<br />
• Sustainability - Total energy reduction<br />
consumption of just over 4% for the <strong>year</strong>. This is<br />
2% better than the annual target and 2%<br />
favourable on the previous <strong>year</strong>.<br />
<strong>Rotorua</strong> <strong>District</strong> <strong>Council</strong> ANNUAL REPORT 2011/12<br />
79
Aquatic Facilities<br />
• Rugby World Cup - hosted the rugby teams of<br />
Ireland, Russia, Samoa and Namibia in<br />
September as part of their Rugby World Cup<br />
pre and post match activities.<br />
Community Outcomes<br />
Safe and Caring<br />
• By providing a safe public space for families<br />
and whanau to work, play and talk together<br />
• By providing opportunities to learn personal and<br />
community safety skills<br />
Healthy<br />
• By giving everyone the opportunity to<br />
participate in sport and physical activity<br />
• By encouraging the community to live healthy<br />
and active lifestyles<br />
Excellent Facilities and Services<br />
• By providing a range of aquatic fitness programmes<br />
• By providing well maintained facilities and pools<br />
Thriving<br />
• By providing a variety of fun and accessible<br />
activities and event<br />
• By providing pools for competitive swimming,<br />
underwater hockey and water polo<br />
What it cost us<br />
Operating expenses<br />
2012<br />
actual<br />
$000<br />
<strong>Annual</strong><br />
Plan<br />
$000<br />
2011<br />
actual<br />
$000<br />
Direct costs 2,674 2,757 2,644<br />
Financial costs 81 82 60<br />
Depreciation 379 339 348<br />
Other* 0 0 5<br />
Total costs 3,134 3,178 3,057<br />
Revenue<br />
Capital revenue 19 48 21<br />
General rates 0 0 0<br />
Fees and charges 1,038 1,135 1,103<br />
Investment income 16 16 15<br />
Subsidies and grants 12 6 14<br />
Targeted rates 0 0 0<br />
Other income* 0 0 0<br />
Total revenue 1,085 1,205 1,153<br />
Net cost of service 2,049 1,973 1,904<br />
Capital costs<br />
Renewals 186 96 83<br />
Growth 23 81 51<br />
Backlog 52 184 26<br />
Level of service 0 0 0<br />
Total capital 261 361 160<br />
Operational funding<br />
Net cost of service of<br />
general rate activities<br />
2,049 1,973 1,904<br />
Plus capital revenue 19 48 21<br />
Less depreciation -379 -339 -353<br />
Depreciation funded by<br />
general rates<br />
186 96 83<br />
Add back half share<br />
roading depreciation<br />
0 0 0<br />
Self funding/DC reserve<br />
movements<br />
0 0 0<br />
Operations funded by<br />
general rates<br />
1,875 1,778 1,655<br />
Capital funding<br />
Funding from<br />
depreciation (rates)<br />
186 96 83<br />
Loans from/(to)<br />
corporate fund<br />
52 184 26<br />
Capital grants 0 0 0<br />
Development<br />
contributions<br />
23 81 51<br />
Reserves net 0 0 0<br />
Asset sales 0 0 0<br />
Total capital 261 361 160<br />
* Non cash adjustments due to revaluation<br />
80 <strong>Rotorua</strong> <strong>District</strong> <strong>Council</strong> ANNUAL REPORT 2011/12
Capital expenditure<br />
2012<br />
actual<br />
$000<br />
Aquatic centre replacements 186<br />
Aquatic centre upgrade 75<br />
261<br />
Variance from budget<br />
• Direct costs are favourable with less spending<br />
on goods for sale, chemicals, the geothermal,<br />
set rate contract and trade waste costs.<br />
Insurance and plant maintenance were above<br />
budget.<br />
• Capital revenue was unfavourable to budget<br />
due to lower than anticipated development<br />
contributions.<br />
• Fees and charges were unfavourable due to<br />
lower admissions and lower Learn to Swim fees<br />
due to an unexpected learner pool closure.<br />
Aquatic Facilities<br />
How we performed<br />
Level of Service Performance measures Target for 2011/12 Achievement Comments<br />
To provide fun, safe and<br />
affordable swimming<br />
pools for competitive<br />
sports, casual<br />
recreation and health<br />
and fitness training.<br />
% of households used/visiting<br />
the <strong>Rotorua</strong> Aquatic Centre in<br />
a <strong>year</strong>.<br />
68% 60% (not achieved) $3 million capital<br />
upgrade scheduled<br />
for 2009/10 deferred<br />
to 2012/13.<br />
Number of visits and net<br />
operating cost of providing<br />
the service.<br />
330,000 visits at<br />
Aquatic Facilities<br />
Community satisfaction survey<br />
The graphs below have been prepared from the annual Community Satisfaction Survey.<br />
Aquatic centre<br />
Aquatic centre<br />
% very / fairly satisfied<br />
90% 81% 80%<br />
75% 74%<br />
72%<br />
60%<br />
30%<br />
% very satisfied<br />
50% 41%<br />
38% 40% 38%<br />
40%<br />
30%<br />
20%<br />
10%<br />
0%<br />
2008 2009 2010 2011 2012<br />
0%<br />
RDC<br />
2011<br />
RDC<br />
2012<br />
Peer<br />
Group<br />
National<br />
Average<br />
This graph shows the percentage of survey respondents very<br />
or fairly satisfied with this service over the last five <strong>year</strong>s.<br />
This graph shows the percentage of survey respondents “very”<br />
satisfied with this service over the last two <strong>year</strong>s and compares<br />
it with our peer group and the national average for 2012.<br />
Other indicators<br />
Aquatic Centre actual admissions<br />
400<br />
Admissions in thousands<br />
350<br />
300<br />
250<br />
200<br />
150<br />
100<br />
277<br />
303<br />
319<br />
321<br />
308<br />
370<br />
366<br />
333<br />
332 333<br />
50<br />
0<br />
2003 2004 2005 2006 2007 2008 2009 2010 2011 2012<br />
<strong>year</strong> <strong>ended</strong> 30 June<br />
Aquatic Centre actual rev enue<br />
1200<br />
$ in thousands<br />
1000<br />
800<br />
600<br />
400<br />
606<br />
836<br />
930 945<br />
1021<br />
1103<br />
1044<br />
1117 1152<br />
1087<br />
200<br />
0<br />
2003 2004 2005 2006 2007 2008 2009 2010 2011 2012<br />
<strong>year</strong> <strong>ended</strong> 30 June<br />
82 <strong>Rotorua</strong> <strong>District</strong> <strong>Council</strong> ANNUAL REPORT 2011/12
Admissions in thousands<br />
50<br />
45<br />
40<br />
35<br />
30<br />
25<br />
20<br />
15<br />
10<br />
22<br />
32<br />
Swimsation admissions<br />
39 39<br />
40<br />
37<br />
38<br />
41<br />
46<br />
48<br />
Aquatic Facilities<br />
5<br />
0<br />
2003 2004 2005 2006 2007 2008 2009 2010 2011 2012<br />
<strong>year</strong> <strong>ended</strong> 30 June<br />
350<br />
Learn to Swim / Swimsation actual revenue<br />
$ in thousands<br />
300<br />
250<br />
200<br />
150<br />
100<br />
126<br />
203<br />
247<br />
252<br />
274<br />
302<br />
304<br />
296<br />
341 307<br />
50<br />
0<br />
2003 2004 2005 2006 2007 2008 2009 2010 2011 2012<br />
<strong>year</strong> <strong>ended</strong> 30 June<br />
<strong>Rotorua</strong> <strong>District</strong> <strong>Council</strong> ANNUAL REPORT 2011/12<br />
83
Infrastructural Planning and Compliance<br />
Infrastructural Planning and Compliance<br />
This <strong>year</strong>’s highlights and achievements<br />
included:<br />
• Trade waste charges – aligned with water billing<br />
as part of LEAN principles whilst undertaking<br />
review of the Water Services billing.<br />
• Development Contributions Policy – updated<br />
for Long-term Plan.<br />
Community Outcomes<br />
Safe and Caring<br />
• Effective and efficient administration of road<br />
corridor access request<br />
Environment<br />
• By looking after our air, land and water<br />
resources.<br />
• By contributing to waste reduction.<br />
What we do<br />
Ensure resource consent processes and any<br />
consequential effects on <strong>Council</strong>’s infrastructural<br />
assets are managed on a sustainable basis, while<br />
providing specialist support to <strong>Council</strong>’s<br />
engineering services.<br />
Prosperous Economy<br />
• By supporting and encouraging development<br />
and growth.<br />
• By facilitating the provision of good quality,<br />
efficient community infrastructure.<br />
• By facilitating the efficient and effective use of<br />
the road services corridor.<br />
Excellent Facilities and Services<br />
• By providing good quality regulatory controls<br />
fro the water services<br />
Why we do it<br />
• To monitor strategic policies that may affect<br />
council utility operations.<br />
• To identify, prioritise and minimise <strong>Council</strong>’s<br />
exposure to risk and ensure that risk analysis is<br />
carried out in day to day decision-making and<br />
practice.<br />
• To provide a trade waste, stormwater licensing,<br />
spill control and road opening administration<br />
function for council.<br />
• To provide land development engineering<br />
input to the resource consent, building consent,<br />
PIM and LIM processes.<br />
• To provide an asset transfer control,<br />
engineering standards and engineering audit<br />
function.<br />
84 <strong>Rotorua</strong> <strong>District</strong> <strong>Council</strong> ANNUAL REPORT 2011/12
What it cost us<br />
Operating expenses<br />
2012<br />
actual<br />
$000<br />
<strong>Annual</strong><br />
Plan<br />
$000<br />
2011<br />
actual<br />
$000<br />
Direct costs 508 315 254<br />
Financial costs 3 6 2<br />
Depreciation 59 69 97<br />
Other* 40 0 1<br />
Total costs 610 390 354<br />
Revenue<br />
Capital revenue 0 0 0<br />
General rates 0 0 0<br />
Fees and charges 1,191 970 1,108<br />
Investment income 0 0 0<br />
Subsidies and grants 3 0 0<br />
Targeted rates 0 0 0<br />
Other income* 0 0 0<br />
Total revenue 1,194 970 1,108<br />
Net cost of service -584 -580 -754<br />
Capital expenditure<br />
2012<br />
actual<br />
$000<br />
Laboratory plant renewal 57<br />
Variance from budget<br />
• Direct costs are unfavourable to budget due to<br />
higher recruitment costs for vacancies, more<br />
laboratory costs and higher costs of<br />
geotechnical peer reviews and Benfield<br />
Subdivision.<br />
• Other costs include non cash asset adjustment<br />
entries.<br />
• Fees and charges are favourable due to<br />
increases in trade waste and connection fees<br />
previously unbudgeted for.<br />
• Subsidies and grants are for sponsorships for the<br />
Ingenium Northern activity.<br />
57<br />
Infrastructural Planning and Compliance<br />
Capital costs<br />
Renewals 57 15 17<br />
Growth 0 0 0<br />
Backlog 0 0 0<br />
Level of service 0 20 0<br />
Total capital 57 35 17<br />
Operational funding<br />
Net cost of service of<br />
general rate activities<br />
-584 -580 -754<br />
Plus capital revenue 0 0 0<br />
Less depreciation -99 -69 -97<br />
Depreciation funded by<br />
general rates<br />
57 15 17<br />
Add back half share<br />
roading depreciation<br />
0 0 0<br />
Self funding/DC reserve<br />
movements<br />
0 0 0<br />
Operations funded by<br />
general rates<br />
-626 -634 -834<br />
Capital funding<br />
Funding from<br />
depreciation (rates)<br />
57 15 17<br />
Loans from/(to)<br />
corporate fund<br />
0 20 0<br />
Capital grants 0 0 0<br />
Development<br />
contributions<br />
0 0 0<br />
Reserves net 0 0 0<br />
Asset sales 0 0 0<br />
Total capital 57 35 17<br />
* Non cash adjustments due to revaluation<br />
<strong>Rotorua</strong> <strong>District</strong> <strong>Council</strong> ANNUAL REPORT 2011/12<br />
85
Infrastructural Planning and Compliance<br />
How we performed<br />
Level of Service Performance measures Target for 2011/12 Achievement Comments<br />
To provide Integrated<br />
Risk Management to<br />
the organisation.<br />
Provision of laboratory<br />
services and test results<br />
in accordance with<br />
IAANZ standards.<br />
Manage and control<br />
the community’s<br />
wastewater discharges.<br />
Number of activities reviewed<br />
in accordance with<br />
Integrated Risk Management<br />
process.<br />
5 high level reviews,<br />
4 low level reviews<br />
Achieved<br />
14 low level reviews<br />
completed.<br />
Maintain IAANZ accreditation. 100% 100% (achieved) IAANZ accreditation<br />
maintained for 2012.<br />
% of premises that have a<br />
conditional trade waste<br />
consent or stormwater<br />
licence inspected each <strong>year</strong><br />
for compliance.<br />
All high risk premises<br />
monitored for compliance<br />
with their trade waste consent<br />
or stormwater licence<br />
conditions each <strong>year</strong>.<br />
% of pollution control<br />
complaints responded to<br />
within two hours.<br />
40% 67% (achieved) 583 premises out of<br />
873 premises with a<br />
conditional trade<br />
consent/stormwater<br />
licence were<br />
inspected for the<br />
<strong>year</strong>.<br />
100% 91% (not achieved) 40 out of a total of 44.<br />
The 4 balance<br />
properties were<br />
audited by BOPRC<br />
95% 100% (achieved)<br />
86 <strong>Rotorua</strong> <strong>District</strong> <strong>Council</strong> ANNUAL REPORT 2011/12
Public Gardens and Open Spaces<br />
The council is charged with maintaining and<br />
enhancing the landscape, recreational potential<br />
and aesthetic value of the forest as a significant<br />
backdrop to <strong>Rotorua</strong>.<br />
Urban design / policy development<br />
The Parks and Recreation Department plays a<br />
major role in urban design, being responsible for<br />
peer review of all subdivision and landscaping<br />
plans submitted to council. This department<br />
provides a consultation service to other council<br />
departments on landscaping, recreational<br />
opportunities and optimal utilisation of potential<br />
resources.<br />
Public Gardens and Open Spaces<br />
The department also manages development of<br />
strategic documents for parks and recreation<br />
activity for the service to be provided within<br />
council policy and industry best practice.<br />
Nursery<br />
<strong>Council</strong> operates an in-house nursery to provide a<br />
cost effective supply of quality plants for council’s<br />
parks, gardens and displays (indoor and outdoor);<br />
environmental improvement and streetscaping<br />
projects. The nursery also provides high quality<br />
plant material to other local authorities which in<br />
turn subsidises the cost of plants used within<br />
<strong>Rotorua</strong> district.<br />
What we do<br />
Open space<br />
The council provides and manages 800 hectares<br />
of reserve land (excluding the Tokorangi Forest), 45<br />
kilometres of walkways, 72 playgrounds with 227<br />
individual pieces of play equipment, and 50<br />
hectares of sportsfield land. This open space<br />
provides for recreation and organised sport,<br />
garden environments and green corridors that<br />
contribute to the district’s natural form, character<br />
and amenity values.<br />
Cemeteries/crematorium<br />
The council provides and manages five<br />
operational cemeteries and one crematorium to<br />
meet the burial and remembrance needs of the<br />
community. Cemeteries are located at <strong>Rotorua</strong>,<br />
Mamaku, Reporoa, Ngakuru-Waikite and Kauae.<br />
Kauae Cemetery is owned by the Kauae<br />
Cemetery Trust with <strong>Council</strong> being responsible for<br />
its maintenance.<br />
Tokorangi / Whakarewarewa forest parks<br />
<strong>Rotorua</strong> <strong>District</strong> <strong>Council</strong> is responsible for the<br />
maintenance of walking and mountainbike trails in<br />
the Tokorangi Forest, famous for the magnificent<br />
stands of towering Californian Coastal Redwoods.<br />
The tracks in the adjacent Whakarewarewa Forest<br />
are maintained by volunteer track sponsors.<br />
Why we do it<br />
• To provide an open space network for casual<br />
and organised recreation, supporting social,<br />
cultural, economic and environmental<br />
community wellbeing;<br />
• To contribute to the community's physical,<br />
mental and spiritual wellbeing;<br />
• To provide facilities for burial and cremation;<br />
• To protect and enhance ecological and<br />
heritage landscape values.<br />
This <strong>year</strong>’s highlights and achievements<br />
included:<br />
• Youth spaces - Wrigley Road Reserve and Park<br />
Road Reserve completed.<br />
• 2011 <strong>Rotorua</strong> Chamber of Commerce Awards<br />
winner - the "Redwoods Visitor Centre" won the<br />
best 2011 Community Organisation and<br />
Customer Choice Awards.<br />
• Kuirau Park master plan - revised the concept<br />
plan incorporating the Aquatic Centre<br />
development as an integral component of the<br />
park.<br />
• Freedom camping - designated camping sites<br />
now operating at Boyes Beach Reserve<br />
(Okareka), Trout Pool Rd (Okere Falls) and Guy<br />
Roe Reserve (Rerewhakaaitu).<br />
<strong>Rotorua</strong> <strong>District</strong> <strong>Council</strong> ANNUAL REPORT 2011/12<br />
87
Public Gardens and Open Spaces<br />
• Jessie Martin Park toilet - new exeloo toilet<br />
facility commissioned.<br />
• Stunning garden displays and plantings<br />
maintained by planting 40,000 spring bulbs,<br />
175,000 bedding display plants and 14,500 trees<br />
and shrubs.<br />
• New cemetery land purchase - purchased 13<br />
ha of land at Tarukenga for development of a<br />
new public cemetery required by the district<br />
within 5 <strong>year</strong>s time.<br />
Community Outcomes<br />
Safe and Caring<br />
• By ensuring our parks, reserves and open<br />
spaces are safe, welcoming areas for the<br />
community to gather and interact in.<br />
• By planning facilities and structures in<br />
accordance to Crime Prevention through<br />
Environmental Design (CPTED) principles.<br />
• By meeting a range of community burial and<br />
cremation needs.<br />
Environment<br />
• Through the principle of Kaitiakitanga<br />
(guardianship), managing and protecting our<br />
natural resources.<br />
Healthy<br />
• By providing areas for people to engage in<br />
healthy activities.<br />
Excellent Facilities and Services<br />
• Through the provision of facilities, reserves and<br />
services to a high quality that are affordable,<br />
well maintained and managed.<br />
Capital costs<br />
2012<br />
actual<br />
$000<br />
<strong>Annual</strong><br />
Plan<br />
$000<br />
2011<br />
actual<br />
$000<br />
Renewals 533 674 512<br />
Growth 96 90 64<br />
Backlog 0 32 29<br />
Level of service 688 1,062 890<br />
Total capital 1,317 1,858 1,495<br />
Operational funding<br />
Net cost of service of<br />
general rate activities<br />
7,314 7,911 6,906<br />
Plus capital revenue 283 677 265<br />
Less depreciation -3,878 -1,407 -1,699<br />
Depreciation funded by<br />
general rates<br />
533 674 512<br />
Add back half share<br />
roading depreciation<br />
0 0 0<br />
Self funding/DC reserve<br />
movements<br />
251 115 7<br />
Operations funded by<br />
general rates<br />
4,503 7,970 5,991<br />
Capital funding<br />
Funding from<br />
depreciation (rates)<br />
533 674 512<br />
Loans from/(to)<br />
corporate fund<br />
668 1,062 99<br />
Capital grants 0 0 11<br />
Development<br />
contributions<br />
31 90 54<br />
Reserves net 85 32 819<br />
Asset sales 0 0 0<br />
Total capital 1,317 1,858 1,495<br />
What it cost us<br />
Operating expenses<br />
2012<br />
actual<br />
$000<br />
<strong>Annual</strong><br />
Plan<br />
$000<br />
2011<br />
actual<br />
$000<br />
Direct costs 8,523 8,684 8,088<br />
Financial costs 923 973 745<br />
Depreciation 1,885 1,407 1,549<br />
Other* 1,118 0 150<br />
Total costs 12,449 11,064 10,532<br />
Revenue<br />
Capital revenue 250 677 265<br />
General rates 0 0 0<br />
Fees and charges 2,124 2,245 1,378<br />
Investment income 97 131 113<br />
Subsidies and grants 10 0 6<br />
Targeted rates 0 0 0<br />
Other income* 2,654 100 1,864<br />
Total revenue 5,135 3,153 3,626<br />
Net cost of service 7,314 7,911 6,906<br />
* Non cash adjustments due to revaluation<br />
Capital expenditure<br />
2012<br />
actual<br />
$000<br />
Alexander Reserve 28<br />
Fordland skate park 258<br />
Jessie Martin Park – toilet block 84<br />
Kariri Point Tarawera – carpark<br />
55<br />
upgrade<br />
Land purchases 85<br />
Lighting upgrade Government<br />
150<br />
Gardens<br />
Park renewals 452<br />
Parks – general reserve development 26<br />
Redwood Forest carpark 12<br />
Redwood Visitor Centre new toilet 22<br />
Reserve development 2<br />
Reserve improvements 2<br />
Vaile Road development 8<br />
Waipa Road – carpark upgrade 26<br />
Waipa Road mountain bike 21<br />
Walkway 6<br />
Western Heights skate park 63<br />
Wharf development 1<br />
Cemeteries/crematorium renewals 13<br />
Nursery renewals 1<br />
Camera for parks 2<br />
1,317<br />
88 <strong>Rotorua</strong> <strong>District</strong> <strong>Council</strong> ANNUAL REPORT 2011/12
Variance from budget<br />
• Direct costs are favourable due to fewer<br />
valuations required from fewer developments<br />
requiring reserves, and reduced<br />
burial/cremation costs.<br />
• Other costs include non cash asset adjustment<br />
entries.<br />
• Capital revenue is unfavourable due to fewer<br />
subdivisions occurring than planned.<br />
• Investment Income is unfavourable due to<br />
special fund interest being less than budgeted.<br />
• Subsidies and grants are favourable due to the<br />
Department of Internal Affairs war graves grant.<br />
How we performed<br />
Public Gardens and Open Spaces<br />
Level of Service Performance measures Target for 2011/12 Achievement Comments<br />
Open spaces<br />
Enhance the aesthetic<br />
look of <strong>Rotorua</strong> in terms<br />
of quality plantings,<br />
bedding displays,<br />
interpretation and<br />
design.<br />
Provide a network of<br />
parks, open spaces and<br />
wetlands that meet<br />
community and<br />
environmental needs<br />
(environmental<br />
sensitivity awareness).<br />
Provide a variety of<br />
recreation opportunities<br />
and facilities in parks.<br />
Provide and maintain<br />
sports fields for local,<br />
regional, national<br />
competitions, and<br />
participation.<br />
% of residents very/fairly<br />
satisfied with level of service.<br />
Amount of reserve per 1000<br />
population.<br />
% of children’s play areas<br />
within 500m of dwellings in the<br />
urban area.<br />
Kilometres of walkways<br />
provided in the district.<br />
% of residents very/fairly<br />
satisfied with the level of<br />
service as measured by<br />
community satisfaction<br />
survey.<br />
90% 97% (achieved)<br />
12 ha/1000 people 21.93 hectares/<br />
1000 people<br />
(achieved)<br />
95% 97.5% (achieved) There are 19,123<br />
dwellings closer than<br />
500 metres from a<br />
children’s play area out<br />
of a total of 19,594<br />
dwellings in the urban<br />
area.<br />
65 kilometres 87 kilometres<br />
(achieved)<br />
85% 86% (achieved)<br />
Cemeteries/Crematorium<br />
Ensure that culturally<br />
sensitive, well designed,<br />
conveniently located<br />
cemeteries and<br />
cremation facilities are<br />
available in <strong>Rotorua</strong><br />
district.<br />
Provision of sufficient long<br />
term burial plots in <strong>Rotorua</strong><br />
district main cemetery (shown<br />
as the number of <strong>year</strong>s of<br />
developed plots).<br />
Provision of sufficient daily<br />
cremator capacity.<br />
1-2 <strong>year</strong>s supply Achieved Currently 4 <strong>year</strong>s supply<br />
available.<br />
6/day Achieved Averaging 1.5<br />
hours/cremation.<br />
<strong>Rotorua</strong> <strong>District</strong> <strong>Council</strong> ANNUAL REPORT 2011/12<br />
89
Public Gardens and Open Spaces<br />
Community satisfaction survey<br />
The graphs below have been prepared from the annual Community Satisfaction Survey.<br />
% very / fairly satisfied<br />
Parks and reserves<br />
100% 91% 92% 92% 89% 93%<br />
75%<br />
50%<br />
25%<br />
0%<br />
2008 2009 2010 2011 2012<br />
% very / fairly satisfied<br />
Beautification and landscaping<br />
100%<br />
93% 96% 96% 95% 97%<br />
75%<br />
50%<br />
25%<br />
0%<br />
2008 2009 2010 2011 2012<br />
Sportsfields<br />
100%<br />
86% 83% 84% 82%<br />
86%<br />
% very / fairly satisfied<br />
75%<br />
50%<br />
25%<br />
0%<br />
2008 2009 2010 2011 2012<br />
These graphs show the percentage of survey respondents very or fairly satisfied with these services over the last five <strong>year</strong>s.<br />
Parks and reserves<br />
Beautification and landscaping<br />
% very satisfied<br />
75%<br />
50%<br />
25%<br />
53%<br />
56%<br />
63%<br />
56%<br />
% very satisfied<br />
80%<br />
60%<br />
40%<br />
20%<br />
71%<br />
68%<br />
53%<br />
42%<br />
0%<br />
RDC<br />
2011<br />
RDC<br />
2012<br />
Peer<br />
Group<br />
National<br />
Average<br />
0%<br />
RDC<br />
2011<br />
RDC<br />
2012<br />
Peer<br />
Group<br />
National<br />
Average<br />
Sportsfields<br />
60%<br />
41%<br />
47%<br />
58%<br />
52%<br />
% very satisfied<br />
40%<br />
20%<br />
0%<br />
RDC<br />
2011<br />
RDC<br />
2012<br />
Peer<br />
Group<br />
National<br />
Average<br />
These graphs show the percentage of survey respondents “very” satisfied with these services over the last two <strong>year</strong>s and compares it with<br />
our peer group and the national average for 2012.<br />
90 <strong>Rotorua</strong> <strong>District</strong> <strong>Council</strong> ANNUAL REPORT 2011/12
<strong>Rotorua</strong> Airport<br />
economic development of the city, district and<br />
wider Bay of Plenty community.<br />
Excellent Facilities and Services<br />
• By contributing to an integrated transport<br />
system and a modern, safe airport for the<br />
region.<br />
<strong>Rotorua</strong> Airport<br />
What we do<br />
<strong>Rotorua</strong> <strong>District</strong> <strong>Council</strong> owns the assets at <strong>Rotorua</strong><br />
International Airport and leases them to an<br />
operating company, <strong>Rotorua</strong> Regional Airport<br />
limited (RRAL) – a council controlled trading<br />
organisation, in accordance with the Local<br />
Government Act 2002.<br />
This activity plan is focussed on optimal<br />
management of the assets for the overall benefit<br />
of the community through their utilisation by the<br />
operating company. Marketing of the airport is<br />
included in the Economic Development activity.<br />
Why we do it<br />
To develop and maintain a domestic and<br />
international airport servicing the needs of <strong>Rotorua</strong><br />
and wider Bay of Plenty residents, with operational<br />
capability for direct access to/from key New<br />
Zealand and Australian cities.<br />
This <strong>year</strong>’s highlights and achievements<br />
included:<br />
• Floating wetland – assembly of the largest manmade<br />
floating wetland commenced. Twenty<br />
thousand native plants have been used to<br />
create this environmental enhancement which<br />
will help improve Lake <strong>Rotorua</strong> water quality<br />
and promote the district with the word <strong>Rotorua</strong><br />
spelled out in giant letters floating on the lake<br />
to be viewed by all how come into <strong>Rotorua</strong> via<br />
the airport.<br />
Community Outcomes<br />
Prosperous Economy<br />
• By providing direct air access to and from<br />
<strong>Rotorua</strong>, the council is directly supporting<br />
growth, employment opportunities and<br />
What it cost us<br />
2012<br />
actual<br />
$000<br />
<strong>Annual</strong><br />
Plan<br />
$000<br />
2011<br />
actual<br />
$000<br />
Operating expenses<br />
Direct costs 331 255 313<br />
Financial costs 3,753 4,117 3,492<br />
Depreciation 1,035 713 804<br />
Other* 3 0 1,152<br />
Total costs 5,122 5,085 5,761<br />
Revenue<br />
Capital revenue 334 0 0<br />
Fees and charges 967 768 915<br />
Investment income 1 0 3<br />
Subsidies and grants 0 0 0<br />
Targeted rates 0 0 0<br />
Other income* 0 0 515<br />
Total revenue 1,302 768 1,433<br />
Net cost of service 3,820 4,317 4,328<br />
Capital costs<br />
Renewals 0 0 0<br />
Growth 7 0 -2<br />
Backlog 0 0 0<br />
Level of service 1,244 793 3,261<br />
Total capital 1,251 793 3,259<br />
Operational funding<br />
Net cost of service of<br />
general rate activities<br />
3,820 4,317 4,328<br />
Plus capital revenue 334 0 0<br />
Less depreciation -1,035 -713 -804<br />
Depreciation funded by<br />
general rates<br />
0 0 0<br />
Add back half share<br />
roading depreciation<br />
0 0 0<br />
Self funding/DC reserve<br />
movements<br />
881 395 -3,524<br />
Operations funded by<br />
general rates<br />
4,000 4,000 0<br />
Capital funding<br />
Funding from<br />
depreciation (rates)<br />
0 0 0<br />
Loans from/(to)<br />
corporate fund<br />
0 0 0<br />
Capital grants 0 0 0<br />
Development<br />
contributions<br />
0 0 0<br />
Reserves net 1,251 793 3,259<br />
Asset sales 0 0 0<br />
Total capital 1,251 793 3,259<br />
* Non cash adjustments due to revaluation<br />
<strong>Rotorua</strong> <strong>District</strong> <strong>Council</strong> ANNUAL REPORT 2011/12<br />
91
<strong>Rotorua</strong> Airport<br />
Capital expenditure<br />
2012<br />
actual<br />
$000<br />
Property purchases 317<br />
Runway and other renewals 21<br />
Southern extension 95<br />
Wetlands mitigation 818<br />
1,251<br />
Variance from budget<br />
• Direct costs are unfavourable due to higher<br />
consultant costs, building maintenance, and<br />
old tree removals and insurance.<br />
• Financial costs are favourable due to lower<br />
Interest rates.<br />
• Depreciation for allocation of the costs of re<br />
valued amounts of assets is higher than<br />
budgeted.<br />
• Capital revenue is for a half share of the<br />
floating wetland from BOP Regional <strong>Council</strong><br />
which was not budgeted for.<br />
• Fees and charges are favourable as the<br />
development levy income was higher than<br />
anticipated but lease income was lower. Also<br />
income generated by passenger use of the<br />
facility down due to global recession.<br />
How we performed<br />
Level of Service Performance measures Target for 2011/12 Achievement Comments<br />
The airport assets will be<br />
developed and<br />
managed in a safe<br />
manner and in<br />
compliance with the<br />
relevant legislation.<br />
The assets will be<br />
provided at reasonable<br />
cost.<br />
Number of airport closures or<br />
flight delays caused by the<br />
failure of the airport to meet<br />
industry safety and<br />
operational standards.<br />
% of programmed<br />
construction and<br />
maintenance work<br />
completed on time and<br />
within budget.<br />
Nil Achieved No closures as a result<br />
of failure to meet<br />
industry safety and<br />
operational standards.<br />
100% 100% (achieved)<br />
92 <strong>Rotorua</strong> <strong>District</strong> <strong>Council</strong> ANNUAL REPORT 2011/12
Stormwater and Land Drainage<br />
This <strong>year</strong>’s highlights and achievements<br />
included:<br />
• Customer satisfaction – this <strong>year</strong> has seen<br />
average rainfall recordings well above average<br />
resulting in higher than usual lakes levels and<br />
stress on the network. During a <strong>year</strong> operating<br />
well outside the normal readings 92% of people<br />
surveyed were satisfied with urban land<br />
drainage schemes.<br />
• Significant rainfall events - in January <strong>Rotorua</strong><br />
experienced two significant rainfall events<br />
causing concern to residential properties. The<br />
target of less than three properties being<br />
affected was still achieved with only one<br />
property being recorded as affected by flood<br />
waters.<br />
Stormwater and Land Drainage<br />
Community Outcomes<br />
What we do<br />
• Maintain stormwater systems and operate to<br />
manage drainage of excess rainfall.<br />
• Develop and implement programmes to<br />
progressively improve stormwater systems in<br />
areas that experience localised flooding usually<br />
resulting from extreme rainfall episodes.<br />
• Manage an integrated approach to planning<br />
and maintaining a stormwater system that<br />
includes: ecosystems, people, urban design,<br />
communities and businesses, as well as cultural,<br />
amenity and social values. Regulate property<br />
owner responsibilities to utilise public stormwater<br />
facilities to assist in the provision of a fully<br />
functional stormwater system.<br />
Environment<br />
• By controlling the level of pollutants in<br />
stormwater flows and protection of natural<br />
stream channel environments. This contributes<br />
to improved lake water quality.<br />
Excellent Facilities and Services<br />
• By providing good quality infrastructure that will<br />
last for another 50-100 <strong>year</strong>s.<br />
Why we do it<br />
To manage the drainage of excess rainfall so that<br />
property and people are protected from flood<br />
damage, and to mitigate the adverse effects of<br />
stormwater run-off on the <strong>District</strong>’s lakes and<br />
waterways.<br />
<strong>Rotorua</strong> <strong>District</strong> <strong>Council</strong> ANNUAL REPORT 2011/12<br />
93
Stormwater and Land Drainage<br />
What it cost us<br />
Operating expenses<br />
2012<br />
actual<br />
$000<br />
<strong>Annual</strong><br />
Plan<br />
$000<br />
2011<br />
actual<br />
$000<br />
Direct costs 1,764 1,552 1,771<br />
Financial costs 777 484 588<br />
Depreciation 2,100 2,200 2,163<br />
Other* 770 0 2,289<br />
Total costs 5,411 4,236 6,811<br />
Revenue<br />
Capital revenue 22 54 21<br />
General rates -4 0 0<br />
Fees and charges 267 111 239<br />
Investment income 4 1 7<br />
Subsidies and grants 0 0 0<br />
Targeted rates 2,024 2,000 0<br />
Other income* 0 0 39<br />
Total revenue 2,313 2,166 306<br />
Net cost of service 3,098 2,070 6,505<br />
Capital costs<br />
Renewals 623 530 410<br />
Growth 116 104 199<br />
Backlog 465 415 499<br />
Level of service 0 0 0<br />
Total capital 1,204 1,049 1,108<br />
Capital expenditure<br />
2012<br />
actual<br />
$000<br />
City stormwater upgrades 656<br />
Stormwater renewals 548<br />
Variance from budget<br />
1,204<br />
• Direct costs are unfavourable due to significant<br />
additional maintenance costs incurred on the<br />
Kaituna Scheme. These were recovered from<br />
BOP Regional <strong>Council</strong>.<br />
• Financial costs have increased due to higher<br />
cost of capital charges on this activity.<br />
• Other costs refer to non cash asset adjustment<br />
entries.<br />
• Capital revenue is unfavourable due to less<br />
development contributions received.<br />
• Fees and charges are favourable due to<br />
recovered costs from BOP Regional <strong>Council</strong>.<br />
Operational funding<br />
Net cost of service of<br />
general rate activities<br />
3,098 2,070 6,505<br />
Plus capital revenue 22 54 21<br />
Less depreciation -2,870 -2,200 -4,451<br />
Depreciation funded by<br />
general rates<br />
623 530 410<br />
Add back half share<br />
roading depreciation<br />
0 0 0<br />
Self funding/DC reserve<br />
movements<br />
0 0 0<br />
Operations funded by<br />
general rates<br />
873 454 2,485<br />
Capital funding<br />
Funding from<br />
depreciation (rates)<br />
623 530 410<br />
Loans from/(to)<br />
corporate fund<br />
465 415 536<br />
Capital grants 0 0 0<br />
Development<br />
contributions<br />
116 104 162<br />
Reserves net 0 0 0<br />
Asset sales 0 0 0<br />
Total capital 1,204 1,049 1,108<br />
* Non cash adjustments due to revaluation<br />
94 <strong>Rotorua</strong> <strong>District</strong> <strong>Council</strong> ANNUAL REPORT 2011/12
How we performed<br />
Level of Service Performance measures Target for 2011/12 Achievement Comments<br />
Provision of a<br />
stormwater network to<br />
minimise the impact of<br />
flooding.<br />
Number of dwellings per <strong>year</strong><br />
affected by flood waters.<br />
% of blockages responded to<br />
within 24 hours.<br />
% satisfaction of people<br />
protected by urban land<br />
drainage schemes as<br />
measured by annual<br />
community satisfaction<br />
survey.<br />
< 3* Achieved 1 dwelling affected by<br />
flood waters.<br />
> 95% 95.4% (achieved) There were 87<br />
blockages of<br />
stormwater systems<br />
reported and 85<br />
responded to within 24<br />
hours.<br />
> 80% 92% (achieved)<br />
Stormwater and Land Drainage<br />
Provision of a<br />
stormwater network to<br />
minimise the impact on<br />
the environment.<br />
Number of breaches of<br />
consent conditions notified by<br />
Regional <strong>Council</strong>.<br />
0 Achieved There were no breaches<br />
of consent conditions<br />
notified by Regional<br />
<strong>Council</strong>.<br />
* Records show that in most <strong>year</strong>s no dwellings are affected by flooding but in a significant rainfall event some dwellings would be<br />
expected to be affected by flood waters. The performance target shown is therefore an average per <strong>year</strong> over the 10 <strong>year</strong><br />
period.<br />
Community satisfaction survey<br />
The graphs below have been prepared from the annual Community Satisfaction Survey.<br />
Stormwater<br />
Stormwater<br />
% very / fairly satisfied<br />
100%<br />
75%<br />
50%<br />
25%<br />
72% 75% 74%<br />
89% 92%<br />
% very satisfied<br />
75%<br />
60%<br />
45%<br />
30%<br />
15%<br />
53%<br />
62%<br />
43%<br />
45%<br />
0%<br />
2008 2009 2010 2011 2012<br />
0%<br />
RDC<br />
2011<br />
RDC<br />
2012<br />
Peer<br />
Group<br />
National<br />
Average<br />
This graph shows the percentage of survey respondents very<br />
or fairly satisfied with this service over the last five <strong>year</strong>s.<br />
This graph shows the percentage of survey respondents “very”<br />
satisfied with this service over the last two <strong>year</strong>s and compares<br />
it with our peer group and the national average for 2012.<br />
<strong>Rotorua</strong> <strong>District</strong> <strong>Council</strong> ANNUAL REPORT 2011/12<br />
95
Transport<br />
Transport<br />
• Provide an ongoing programme of seal<br />
extension in the rural areas.<br />
• Provide roadside mowing and vegetation<br />
control.<br />
• Provide co-ordination, education, resources,<br />
support and advice to individuals, community<br />
groups and other agencies on road safety and<br />
alternatives to private passenger vehicles.<br />
• Provide information and respond to the public<br />
on local highway issues.<br />
• Provide local emergency response on highway<br />
corridors.<br />
• Provide local area contact for the NZ Transport<br />
Agency for highways.<br />
• Provide strategic planning advice.<br />
• Act as delegated highway manager.<br />
• Manage highway maintenance activities within<br />
nationally set levels of service.<br />
Why we do it<br />
• To provide a safe and efficient roading network<br />
that supports the district's economy, provides<br />
access for utilities and supports facilitation of<br />
events and other activities;<br />
• To promote road safety and encourage<br />
sustainable forms of travel.<br />
This <strong>year</strong>’s highlights and achievements<br />
included:<br />
What we do<br />
This activity includes development and<br />
management of the roading network including<br />
public transport infrastructure, safety programmes,<br />
alternative transport modes and long term<br />
planning. Roading networks are critical to<br />
supporting and developing the economy<br />
particularly in the <strong>Rotorua</strong> district where three<br />
major economic drivers of forestry, agriculture and<br />
tourism are so reliant on efficient transport systems.<br />
The council also undertakes the following<br />
functions:<br />
• Manage, administer, and maintain the local<br />
road network, including kerb & channelling,<br />
road marking, traffic signals, signage, street<br />
furniture, and street lighting.<br />
• Plan, implement and manage improvements to<br />
the network.<br />
• Prioritise and manage programme of road<br />
safety improvements.<br />
• Provide, maintain and manage infrastructure to<br />
support walking, cycling and public transport<br />
(by providing and managing bus shelters and<br />
bus stops).<br />
• Provide footpath and verge maintenance and<br />
construction in both urban and rural areas.<br />
• Lake Road 4 laning – project well underway<br />
and currently ahead of time.<br />
• Road safety – 2011/12 programme successfully<br />
completed. Programmes/campaigns included<br />
Back to School, education around new give<br />
way rules, Rubeun the road safety bear, Driver<br />
Directions Day for Young Drivers , <strong>Rotorua</strong> Road<br />
Safety Youth Expo, Winter campaigns using<br />
Ruru on SH5, SH33 and SH36 and “vulnerable<br />
road users' campaign to name but a few.<br />
• <strong>Rotorua</strong> Transport Strategy – new strategy<br />
completed to draft stage.<br />
• Fenton Street/Devon Street – roundabout<br />
completed, reducing the potential crashes on<br />
one of the identified black spots within the city.<br />
• Victoria Street arterial – designation confirmed.<br />
Community Outcomes<br />
Safe and Caring<br />
• By increased public awareness leading to<br />
reduced road injuries, deaths and crashes.<br />
• By improved safety in public places and when<br />
travelling, from provision of a safe transport<br />
system.<br />
Environment<br />
• By providing roading services in a sustainable<br />
manner that mitigates the impact on our air<br />
and water resources.<br />
96 <strong>Rotorua</strong> <strong>District</strong> <strong>Council</strong> ANNUAL REPORT 2011/12
Prosperous Economy<br />
• By providing an attractive and lively city<br />
Excellent Facilities and Services<br />
• By making it easier to get from place to place<br />
and to walk and cycle in the city.<br />
• By provision of good, safe, maintained services<br />
and roads.<br />
What it cost us<br />
2012<br />
actual<br />
$000<br />
<strong>Annual</strong><br />
Plan<br />
$000<br />
2011<br />
actual<br />
$000<br />
Operating expenses<br />
Direct costs 7,652 7,926 7,323<br />
Financial costs 1,958 2,223 1,592<br />
Depreciation 7,468 4,827 4,640<br />
Other* 9,025 0 0<br />
Total costs 26,103 14,976 13,555<br />
Revenue<br />
Capital revenue 6,054 6,731 3,573<br />
General rates -16 0 0<br />
Fees and charges 171 233 377<br />
Investment income 70 47 51<br />
Subsidies and grants 3,143 3,673 3,179<br />
Targeted rates 8,984 8,951 8,974<br />
Other income* 0 0 0<br />
Total revenue 18,406 19,635 16,154<br />
Net cost of service 7,697 -4,659 -2,599<br />
Capital costs<br />
Renewals 4,320 4,954 4,705<br />
Growth 1,069 6,761 1,037<br />
Backlog 0 0 0<br />
Level of service 7,052 2,295 3,022<br />
Total capital 12,441 14,010 8,764<br />
Operational funding<br />
Net cost of service of<br />
general rate activities<br />
7,697 -4,659 -2,599<br />
Plus capital revenue 6,054 6,731 3,573<br />
Less depreciation -35,505 -4,827 -4,640<br />
Depreciation funded by<br />
general rates<br />
4,320 4,987 4,705<br />
Add back half share<br />
roading depreciation<br />
-16,332 -2,220 -2,134<br />
Self funding/DC reserve<br />
movements<br />
0 0 0<br />
Operations funded by<br />
general rates<br />
-33,766 12 -1,095<br />
Capital funding<br />
Funding from<br />
depreciation (rates)<br />
2,385 2,767 2,628<br />
Loans from/(to)<br />
corporate fund<br />
3,823 2,089 3,124<br />
Capital grants 5,893 6,127 2,732<br />
Development<br />
contributions<br />
340 3,027 280<br />
Reserves net 0 0 0<br />
Asset sales 0 0 0<br />
Total capital 12,441 14,010 8,764<br />
Capital expenditure<br />
Transport (subsidised)<br />
2012<br />
actual<br />
$000<br />
CBD southern link 488<br />
Cycleway construction 435<br />
Emergency capital reinstatement 123<br />
Lake Road 4<br />
Lake Road reconstruction 3,381<br />
Minor safety projects 714<br />
New bus shelter 37<br />
Rehabilitation renewals 1,282<br />
Road reseals 2,620<br />
Streetlight renewals 180<br />
Structural replacement 125<br />
Transport (unsubsidised)<br />
9,389<br />
2012<br />
actual<br />
$000<br />
CBD upgrades 14<br />
Footpath renewals 108<br />
Land acquisition 47<br />
Maori roadlines 57<br />
Minor safety improvements 26<br />
National cycleway 1,441<br />
Parks roading renewal 1<br />
Rural street extension 1,110<br />
Rural street improvements 98<br />
Security lighting 58<br />
Urban street improvements 92<br />
Variance from budget<br />
3,052<br />
• Direct costs are favourable due to less New<br />
Zealand Transport Agency works completed.<br />
• Financial costs are favourable due to less<br />
capital expenditure than budgeted.<br />
• Depreciation costs are higher due to the<br />
revaluation of roading assets.<br />
• Other costs refer to non cash asset adjustment<br />
entries.<br />
• Capital revenue was unfavourable to budget<br />
due to the Lake Road project not yet<br />
completed, hence less funding from NZTA than<br />
anticipated.<br />
• Subsidies and grants were unfavourable due to<br />
fewer subsidies received from NZTA and these<br />
are offset in savings in direct costs.<br />
Transport<br />
* Non cash adjustments due to revaluation<br />
<strong>Rotorua</strong> <strong>District</strong> <strong>Council</strong> ANNUAL REPORT 2011/12<br />
97
Transport<br />
How we performed<br />
Level of Service Performance measures Target for 2011/12 Achievement Comments<br />
Improve the safety of<br />
the roading network.<br />
RDC at or below peer 1<br />
group for crashes per 100<br />
million vehicle km<br />
travelled.<br />
Continued decline<br />
over 10 <strong>year</strong> period<br />
(compared against<br />
peer group statistics<br />
annually)<br />
Achieved using new<br />
measure 2<br />
Declining trend in crashes<br />
has continued.<br />
Provision of an efficient<br />
transport system that<br />
enables generally free<br />
movement from place<br />
to place.<br />
Public bus services run on<br />
time<br />
95% of bus services<br />
are on time<br />
(Measured by<br />
BOPRC)<br />
91% (not achieved) 91% measured at June<br />
2011. For the 2011/12 <strong>year</strong><br />
data was corrupted due<br />
to ongoing roadworks and<br />
changes to routes.<br />
Maintain parking<br />
availability in CBD.<br />
Maintain road condition<br />
ratings at a level near<br />
to national average<br />
(local road only).<br />
% average parking<br />
availability (1 in 7 spaces<br />
available between 10am<br />
and 3pm as measured by<br />
survey 3 ).<br />
Cumulative road<br />
condition indices to be a<br />
minimum of -1.5% below<br />
national average.<br />
15% Achieved Surveys completed on<br />
demand within target<br />
range where measured.<br />
- 1.5% minimum +0.23% (achieved) 4 Road condition indices<br />
measure structural<br />
condition of road<br />
pavements. RDC aims to<br />
have NZ average<br />
condition pavements and<br />
being an urban authority<br />
would expect to be below<br />
NZ average. The target of<br />
-1.5% means that a very<br />
small amount of<br />
pavement fall below<br />
average.<br />
Educational and<br />
sustainability<br />
programmes are<br />
supported.<br />
At least 6 programmes<br />
are delivered per <strong>year</strong>.<br />
100% Achieved 9 programmes were<br />
delivered which were:<br />
Cycling<br />
Speed<br />
Alcohol<br />
Walking<br />
Rear seat passengers<br />
Younger drivers<br />
Safer roads and<br />
roadsides (intersections)<br />
Older drivers – Agewise<br />
and Mobility<br />
Intersections<br />
Network safety<br />
coordination<br />
1. Peer group is similarly sized councils in New Zealand e.g. New Plymouth, Hastings.<br />
2. RDC now use the performance measure of ‘declining trend for injury crashes’ and use the RDC crash database to measure this<br />
as NZTA no longer prepare the data on which this measure was previously based.<br />
3. A number of blocks are surveyed each <strong>year</strong> in response to feedback from parking enforcement officers or queries from retailers<br />
and shoppers.<br />
4. Data is sourced from NZTA and based on results from 2010/11 with a lag time of one <strong>year</strong>. This is the latest information available<br />
at the time and is consistent with other councils.<br />
98 <strong>Rotorua</strong> <strong>District</strong> <strong>Council</strong> ANNUAL REPORT 2011/12
Community satisfaction survey<br />
The graphs below have been prepared from the annual Community Satisfaction Survey.<br />
Roads and streets<br />
Footpaths<br />
Transport<br />
% very / fairly satisfied<br />
100%<br />
75%<br />
50%<br />
25%<br />
80%<br />
82%<br />
78%<br />
83%<br />
81%<br />
% very / fairly satisfied<br />
100%<br />
75%<br />
50%<br />
25%<br />
75%<br />
81%<br />
87%<br />
82% 83%<br />
0%<br />
2008 2009 2010 2011 2012<br />
0%<br />
2008 2009 2010 2011 2012<br />
Cycling facilities<br />
100%<br />
82%<br />
% very / fairly satisfied<br />
75%<br />
50%<br />
25%<br />
60%<br />
64%<br />
0%<br />
2008 2009 2010 2011 2012<br />
These graphs show the percentage of survey respondents very or fairly satisfied with these services.<br />
Roads and streets<br />
Footpaths<br />
30%<br />
23%<br />
24%<br />
21%<br />
22%<br />
30%<br />
22%<br />
27%<br />
22%<br />
26%<br />
% very satisfied<br />
20%<br />
10%<br />
% very satisfied<br />
20%<br />
10%<br />
0%<br />
RDC<br />
2011<br />
RDC<br />
2012<br />
Peer<br />
Group<br />
National<br />
Average<br />
0%<br />
RDC<br />
2011<br />
RDC<br />
2012<br />
Peer<br />
Group<br />
National<br />
Average<br />
These graphs show the percentage of survey respondents “very” satisfied with these services over the last two <strong>year</strong>s and compares it with<br />
our peer group and the national average for 2012.<br />
Cycling facilities<br />
60%<br />
51%<br />
% very satisfied<br />
40%<br />
20%<br />
36%<br />
0%<br />
RDC<br />
2011<br />
RDC<br />
2012<br />
This graph shows the percentage of survey respondents “very” satisfied with this service over the last two <strong>year</strong>s.<br />
<strong>Rotorua</strong> <strong>District</strong> <strong>Council</strong> ANNUAL REPORT 2011/12<br />
99
Waste Management<br />
Waste Management<br />
Why we do it<br />
To manage the collection, reduction, re-use,<br />
recycling and disposal of waste in an<br />
environmentally sustainable manner.<br />
What we do<br />
This activity covers:<br />
• Refuse collection<br />
• Waste management<br />
• Landfill<br />
• Provides a weekly refuse collection service for<br />
residential properties.<br />
• Manages and provide recycling and re-use<br />
services.<br />
• Plans, provides and manages waste disposal<br />
facilities.<br />
• Provides litter collection and management<br />
services.<br />
• Provides waste minimisation education to the<br />
community.<br />
• Provides and operate transfer stations for rural<br />
communities.<br />
• Receives and disposes of domestic hazardous<br />
wastes.<br />
This <strong>year</strong>’s highlights and achievements<br />
included:<br />
• TERAX pilot plant - fully operational.<br />
• In town recycling centre – upgrade and<br />
extension to the service completed programme<br />
continuing.<br />
Community Outcomes<br />
Environment<br />
• By encouraging waste reduction and<br />
minimisation.<br />
• By looking after our air, land and water<br />
resource.<br />
Excellent Facilities and Services<br />
• By providing good quality infrastructure for the<br />
future.<br />
100 <strong>Rotorua</strong> <strong>District</strong> <strong>Council</strong> ANNUAL REPORT 2011/12
What it cost us<br />
Operating expenses<br />
2012<br />
actual<br />
$000<br />
<strong>Annual</strong><br />
Plan<br />
$000<br />
2011<br />
actual<br />
$000<br />
Direct costs 7,213 6,222 6,315<br />
Financial costs 452 466 309<br />
Depreciation 690 629 1,216<br />
Other* -477 0 51<br />
Total costs 7,878 7,317 7,891<br />
Revenue<br />
Capital revenue 0 0 0<br />
General rates 0 0 0<br />
Fees and charges 3,879 4,882 3,679<br />
Investment income 0 0 5<br />
Subsidies and grants 15 0 0<br />
Targeted rates 2,111 2,042 2,042<br />
Other income* 0 0 0<br />
Total revenue 6,005 6,924 5,726<br />
Net cost of service 1,873 393 2,165<br />
Capital costs<br />
Renewals -1,260 150 164<br />
Growth 1,721 1,043 0<br />
Backlog 0 0 0<br />
Level of service 1,009 1,000 1,722<br />
Total capital 1,470 2,193 1,886<br />
Operational funding<br />
Net cost of service of<br />
general rate activities<br />
1,873 393 2,165<br />
Plus capital revenue 0 0 0<br />
Less depreciation -216 -629 -1,266<br />
Depreciation funded by<br />
general rates<br />
0 0 164<br />
Add back half share<br />
roading depreciation<br />
0 0 0<br />
Self funding/DC reserve<br />
movements<br />
-1,688 1,261 181<br />
Operations funded by<br />
general rates<br />
31 1,025 1,244<br />
Capital expenditure<br />
2012<br />
actual<br />
$000<br />
Town recycling centre 1,009<br />
Gas flaring project 189<br />
Landfill cells 66<br />
Landfill reseals 2<br />
Okere station renewal -4<br />
Organic waste project TERAX 203<br />
Recycling centre renewals 5<br />
Variance from budget<br />
1,470<br />
• Direct costs are unfavourable. An agreement<br />
with SCION for research on the Terax project<br />
was entered into and is offset by income from<br />
SCION.<br />
• Other costs refer to non cash asset adjustment<br />
entries.<br />
• Fees and charges are unfavourable as there<br />
were fewer coupons and invoiced landfill<br />
charges. These are partially offset with<br />
increases in cash sales. Refuse bag sales were<br />
lower than expected.<br />
• Subsidies and grants relating to a BOP Regional<br />
<strong>Council</strong> grant for the cleaner promotion<br />
programme was not budgeted.<br />
Waste Management<br />
Capital funding<br />
Funding from<br />
depreciation (rates)<br />
0 0 164<br />
Loans from/(to)<br />
corporate fund<br />
1,009 1,000 0<br />
Capital grants 0 0 0<br />
Development<br />
contributions<br />
0 0 0<br />
Reserves net 461 1,193 1,722<br />
Asset sales 0 0 0<br />
Total capital 1,470 2,193 1,886<br />
* Non cash adjustments due to revaluation<br />
<strong>Rotorua</strong> <strong>District</strong> <strong>Council</strong> ANNUAL REPORT 2011/12<br />
101
Waste Management<br />
How we performed<br />
Level of Service Performance measures Target for 2011/12 Achievement Comments<br />
Provide recycling<br />
facilities within 13km to<br />
95% of population.<br />
Provide for recovery of<br />
green waste and<br />
concrete.<br />
Increase in recovery of<br />
recyclable materials of at<br />
least 5% pa.*<br />
Number of tonnes per<br />
annum of green waste and<br />
concrete recovered.<br />
4,050 tonnes 4,184 tonnes<br />
(achieved)<br />
16,000 tonnes/pa +<br />
10%<br />
12,507 tonnes<br />
(not achieved)<br />
3,290 tonnes collected<br />
by council.<br />
894 tonnes collected by<br />
private collection<br />
services.<br />
Only 12,507 tonnes of<br />
green waste and<br />
concrete was<br />
recovered mainly due<br />
to a lack of building<br />
activity in the city as a<br />
result of the economic<br />
conditions.<br />
Provision of weekly<br />
refuse collection to<br />
communities where<br />
majority request service.<br />
Refuse collection is<br />
completed as scheduled.<br />
Completion by 4pm<br />
daily<br />
99% (not achieved) On 7 occasions the<br />
refuse collection was<br />
not completed by 4pm.<br />
Provision of landfill/<br />
hazardous waste<br />
disposal facilities.<br />
% reduction in total landfill<br />
volume.<br />
62,500 tonnes + 10% 48,099 tonnes<br />
(achieved)<br />
The total quantity put in<br />
the landfill for 2011/12<br />
was 48,099, which is a<br />
25% reduction on the<br />
target.<br />
Minimise impact on<br />
environment.<br />
Number of breaches of<br />
consent conditions notified<br />
by Regional <strong>Council</strong>.<br />
No breaches Achieved 0 breaches reported for<br />
<strong>year</strong>.<br />
Compliance reports<br />
had 2 at high<br />
compliance and 1 at<br />
moderate compliance.<br />
* Performance targets show a 5% <strong>year</strong> on <strong>year</strong> increase from the base figure of 3,500 tonnes in 2008/09<br />
Community satisfaction survey<br />
The graphs below have been prepared from the annual Community Satisfaction Survey.<br />
Recycling waste<br />
Rubbish collection<br />
% very / fairly satisfied<br />
75%<br />
50%<br />
25%<br />
50%<br />
57%<br />
62% 60%<br />
73%<br />
% very / fairly satisfied<br />
100%<br />
80%<br />
60%<br />
40%<br />
20%<br />
90% 90% 93% 94% 95%<br />
0%<br />
2008 2009 2010 2011 2012<br />
0%<br />
2008 2009 2010 2011 2012<br />
These graphs show the percentage of survey respondents very or fairly satisfied with these services over the last five <strong>year</strong>s.<br />
102 <strong>Rotorua</strong> <strong>District</strong> <strong>Council</strong> ANNUAL REPORT 2011/12
% very satisfied<br />
60%<br />
40%<br />
20%<br />
Recycling waste<br />
58% 55%<br />
46%<br />
31%<br />
% very satisfied<br />
80%<br />
60%<br />
40%<br />
20%<br />
Rubbish collection<br />
71%<br />
79%<br />
64% 59%<br />
Waste Management<br />
0%<br />
RDC<br />
2011<br />
RDC<br />
2012<br />
Peer<br />
Group<br />
National<br />
Average<br />
0%<br />
RDC<br />
2011<br />
RDC<br />
2012<br />
Peer<br />
Group<br />
National<br />
Average<br />
These graphs show the percentage of survey respondents “very” satisfied with these services over the last two <strong>year</strong>s and compares it with<br />
our peer group and the national average for 2012.<br />
Other indicators<br />
General Recycling<br />
Tonnes<br />
4500<br />
4000<br />
3500<br />
3000<br />
2500<br />
2000<br />
1500<br />
1000<br />
500<br />
0<br />
3876 3929<br />
3697<br />
3513<br />
2917<br />
3173<br />
3290<br />
2298<br />
1772<br />
887<br />
1267<br />
894<br />
586 391<br />
764<br />
2002 2003 2004 2005 2006 2007 2008 2009 2010 2011 2012<br />
<strong>year</strong> <strong>ended</strong> 30 June<br />
General General (Priv ately Collected)<br />
NOTE: Only volumes of product that have gone off the site for recycling/processing are shown on this graph. Does not include greenwaste and concrete.<br />
Includes glass, paper, cardboard, aluminium and steel cans, scrap metal, plastics, batteries, e-waste, clothing (does not include material at the 'Urban Ore' store).<br />
Private collections data obtained from Waste M anagement NZ Ltd, and Kiwi Commodity Recycling Solutions.<br />
Greenwaste Recycling<br />
9804<br />
10000<br />
8000<br />
7804<br />
7556<br />
6592 6438 6501<br />
6656<br />
6081<br />
Tonnes<br />
6000<br />
4000<br />
5000 4927<br />
4709<br />
2000<br />
0<br />
2002 2003 2004 2005 2006 2007 2008 2009 2010 2011 2012<br />
<strong>year</strong> <strong>ended</strong> 30 June<br />
NOTE: Only v olumes of product that hav e gone off the site for recycling/processing are shown on this graph.<br />
<strong>Rotorua</strong> <strong>District</strong> <strong>Council</strong> ANNUAL REPORT 2011/12<br />
103
Waste Management<br />
Tonnes<br />
12000<br />
10000<br />
8000<br />
6000<br />
4000<br />
2000<br />
4749<br />
6494<br />
7154<br />
Concrete Recycling<br />
10822<br />
10075<br />
9959<br />
7954<br />
2966<br />
2583<br />
1867<br />
1400<br />
0<br />
2002 2003 2004 2005 2006 2007 2008 2009 2010 2011 2012<br />
<strong>year</strong> <strong>ended</strong> 30 June<br />
NOTE: Only v olumes of product that hav e gone off the site for recycling/processing are shown on this graph.<br />
Sludge Recycling<br />
6000<br />
5000<br />
5026<br />
Tonnes<br />
4000<br />
3000<br />
2000<br />
1000<br />
0<br />
829 878<br />
836<br />
1398<br />
1016<br />
839<br />
26<br />
352<br />
2004 2005 2006 2007 2008 2009 2010 2011 2012<br />
<strong>year</strong> <strong>ended</strong> 30 June<br />
Waste to Landfill<br />
80000<br />
70000<br />
60000<br />
61720<br />
64820 62810 63480<br />
70510<br />
66208<br />
70255<br />
65175<br />
53473 53413 48099<br />
50000<br />
Tonnes<br />
40000<br />
30000<br />
20000<br />
10000<br />
0<br />
2002 2003 2004 2005 2006 2007 2008 2009 2010 2011 2012<br />
<strong>year</strong> <strong>ended</strong> 30 June<br />
104 <strong>Rotorua</strong> <strong>District</strong> <strong>Council</strong> ANNUAL REPORT 2011/12
Wastewater<br />
Why we do it<br />
Wastewater<br />
What we do<br />
This activity comprises the collection, treatment<br />
and disposal of sewage from toilets and drains,<br />
from the three urban areas of <strong>Rotorua</strong><br />
(Ngongotaha, city and eastern suburbs) as well as<br />
identified rural lakeside communities.<br />
Functions required for the provision of these<br />
services include:<br />
• Strategic planning and improvement of<br />
sewerage networks to provide for growth within<br />
the district.<br />
• Planning and implementation of renewal work<br />
to ensure infrastructure is maintained.<br />
• Developing maintenance, levels of service and<br />
quality standards.<br />
• Management and maintenance of assets and<br />
services including monitoring of flow and<br />
sewerage treatment effluent quality.<br />
• Developing emergency and contingency plans<br />
to ensure the service is maintained during<br />
adverse events.<br />
• Educating and informing the public regarding<br />
sewage services and sewerage systems.<br />
• Developing funding policies and systems to<br />
enable continuing provision of the service into<br />
the future.<br />
To provide for the removal of sewage and liquid<br />
trade wastes from communities, to promote public<br />
health and minimise the impact of communities on<br />
the environment.<br />
This <strong>year</strong>’s highlights and achievements<br />
included:<br />
• Storm flows – an event on New Years Eve was<br />
the largest staff have encountered in over 20<br />
<strong>year</strong>s. All mechanical and electrical plant was<br />
kept fully operational.<br />
• <strong>Rotorua</strong> WWTP – upgrade to a membrane bio<br />
reactor completed improving the effluent<br />
standards considerably.<br />
• Hamurana/Awahou sewerage scheme -<br />
construction commenced and ahead of<br />
schedule.<br />
• Okere Falls / Otaramarae / Whangamarino<br />
sewerage scheme – completed.<br />
• Depot Street/Victoria Street – mains<br />
replacement commenced.<br />
Community Outcomes<br />
Healthy<br />
• By providing a sanitary wastewater collection<br />
and treatment service.<br />
Environment<br />
• By protecting the environment and lake water<br />
quality through wastewater treatment.<br />
Excellent Facilities and Services<br />
• By providing good, quality infrastructure for the<br />
future.<br />
<strong>Rotorua</strong> <strong>District</strong> <strong>Council</strong> ANNUAL REPORT 2011/12<br />
105
Wastewater<br />
What it cost us<br />
Operating expenses<br />
2012<br />
actual<br />
$000<br />
<strong>Annual</strong><br />
Plan<br />
$000<br />
2011<br />
actual<br />
$000<br />
Direct costs 6,734 6,842 5,792<br />
Financial costs 432 496 257<br />
Depreciation 4,063 3,720 3,713<br />
Other* -54 0 -45<br />
Total costs 11,175 11,058 9,717<br />
Revenue<br />
Capital revenue 10,651 7,190 5,128<br />
General rates 0 0 0<br />
Fees and charges 87 21 23<br />
Investment income 1,025 461 988<br />
Subsidies and grants 0 0 0<br />
Targeted rates 13,615 11,502 12,175<br />
Other income* 751 0 57<br />
Total revenue 26,129 19,174 18,371<br />
Net cost of service -14,954 -8,116 -8,654<br />
Capital costs<br />
Renewals 2,142 2,875 2,489<br />
Growth 14,435 12,762 10,992<br />
Backlog 552 2,087 4,587<br />
Level of service 0 0 0<br />
Total capital 17,129 17,724 18,068<br />
Operational funding<br />
Net cost of service of<br />
general rate activities<br />
-14,954 -8,116 -8,654<br />
Plus capital revenue 174 0 296<br />
Less depreciation -4,063 -3,720 -3,713<br />
Depreciation funded by<br />
general rates<br />
0 0 0<br />
Add back half share<br />
roading depreciation<br />
0 0 0<br />
Self funding/DC reserve<br />
movements<br />
17,676 11,836 12,071<br />
Operations funded by<br />
general rates<br />
-1,167 0 0<br />
Capital funding<br />
Funding from<br />
depreciation (rates)<br />
0 0 0<br />
Loans from/(to)<br />
corporate fund<br />
0 0 0<br />
Capital grants 5,013 5,875 5,074<br />
Development<br />
contributions<br />
2,183 1,193 6,967<br />
Reserves net 9,933 10,656 6,027<br />
Asset sales 0 0 0<br />
Total capital 17,129 17,724 18,068<br />
* Non cash adjustments due to revaluation<br />
Capital expenditure<br />
2012<br />
actual<br />
$000<br />
Land treatment renewals 174<br />
Network improvements 195<br />
Network renewals 808<br />
Pump station renewals 1,605<br />
Waste water treatment plant<br />
3,307<br />
improvements<br />
Waste water treatment plant<br />
507<br />
renewals<br />
Gisborne Point and Hinehopu<br />
237<br />
waste water scheme<br />
Gisborne Point and Rotoma<br />
507<br />
treatment plant<br />
Hamurana and Awahou waste<br />
8,300<br />
water scheme<br />
Mamaku sewerage scheme 1<br />
Okareka sewerage scheme 731<br />
Rotoma wastewater scheme 153<br />
Tarawera sewerage scheme 82<br />
Okere and Otaramarae sewerage 523<br />
scheme<br />
Variance from budget<br />
17,130<br />
• Direct costs are favourable as a result of<br />
income in trade waste revenue.<br />
• Depreciation is higher than anticipated for the<br />
cost of assets and its revalued amount.<br />
• Other costs refer to non cash asset adjustment<br />
entries.<br />
• Capital revenue is favourable for Ministry for<br />
Environment subsidies received and Central<br />
and Regional Government grants payment<br />
timetable adjusted.<br />
• Fees and charges include Maketu WWTP site<br />
operation revenues not budgeted.<br />
• Investment Income from self funding reserve<br />
interest was greater than anticipated.<br />
• Targeted rates are favourable for new<br />
communities on stream earlier than expected<br />
increasing ratepayer base.<br />
In the <strong>Annual</strong> Plan but not done<br />
Fenton Park mains upgrade project start was<br />
delayed while the full network assessment was<br />
completed. The project is well-progressed and<br />
due for completion in 2012/13.<br />
Various pump station renewal/replacement<br />
works were deferred as condition assessment<br />
indicates there is still useful life remaining. The<br />
major upgrade of the Depot St pump station<br />
was deferred to coincide with the rising main<br />
replacement project which is nearing<br />
completion.<br />
The Rotoiti/<strong>Rotorua</strong> reticulation and treatment<br />
project has been delayed due to difficulties in<br />
obtaining the required resource consent.<br />
106 <strong>Rotorua</strong> <strong>District</strong> <strong>Council</strong> ANNUAL REPORT 2011/12
How we performed<br />
Level of Service Performance measures Target for 2011/12 Achievement Comments<br />
Implementation<br />
and management<br />
of schemes to<br />
minimise the impact<br />
on the environment.<br />
% compliance with air,<br />
land and water discharge<br />
requirements.<br />
100% 99% (not<br />
achieved)<br />
The level of achievement of 99%<br />
represents total compliance with<br />
management, sampling and<br />
discharge requirements for the<br />
wastewater treatment plant and<br />
compost plant. The 1% noncompliance<br />
relates to the level of<br />
nitrogen in the Waipa Stream.<br />
<strong>Council</strong> has recently commissioned<br />
an $8 million upgrade of the<br />
Wastewater Treatment Plant to<br />
improve nitrogen removal from the<br />
effluent which ultimately reduces<br />
load in the Waipa Stream. <strong>Council</strong> is<br />
also applying for a variation to the<br />
consent conditions, and<br />
investigating alternative effluent<br />
disposal options.<br />
Wastewater<br />
Completion of new<br />
sewerage schemes.*<br />
Hinehopu/Gisborne<br />
Point<br />
Achieved<br />
The design for the project and<br />
resource consent application was<br />
progressed according to the<br />
programme. Resource consent was<br />
granted but subsequently appealed<br />
to the Environment Court, where it is<br />
still the subject of court<br />
proceedings.<br />
Provision of an<br />
efficient collection<br />
and disposal<br />
service.<br />
Number of overflows to<br />
waterways.<br />
< 2 4 (not<br />
achieved)<br />
4 overflows. These overflows are<br />
included in the total for the<br />
following performance measure but<br />
are monitored separately as any<br />
discharge to waterways has a much<br />
greater potential health and/or<br />
environmental risk. The overflows<br />
were the result of a fat blockage, a<br />
hail storm, a pump failure, and a<br />
large piece of loose concrete<br />
blocking a pipe. Each of these<br />
faults was investigated and<br />
appropriate repairs/maintenance<br />
carried out.<br />
Total number of overflows<br />
caused by network faults<br />
(per 100km of mains).<br />
< 14 Achieved 8.1 per 100km. This represents 38<br />
overflows for the <strong>year</strong> in total.<br />
<strong>Council</strong> is continually working to<br />
reduce the incidence of overflows<br />
by targeting problem areas for<br />
increased maintenance and<br />
inspections.<br />
% of customers satisfied<br />
with wastewater services<br />
as measured by annual<br />
community satisfaction<br />
survey.<br />
* Subject to Resource Consent and other planning constraints<br />
99% 98% (not<br />
achieved)<br />
The following graph shows that<br />
while this <strong>year</strong>’s target was not<br />
achieved, satisfaction has remained<br />
relatively constant over the last 5<br />
<strong>year</strong>s, and increased by 1% over the<br />
last <strong>year</strong>. <strong>Council</strong> continues to work<br />
to ensure that these services are<br />
maintained to a high level.<br />
<strong>Rotorua</strong> <strong>District</strong> <strong>Council</strong> ANNUAL REPORT 2011/12<br />
107
Wastewater<br />
Community satisfaction survey<br />
The graphs below have been prepared from the annual Community Satisfaction Survey.<br />
% very / fairly satisfied<br />
Wastewater treatment<br />
100%<br />
99% 96% 97% 97% 98%<br />
80%<br />
60%<br />
40%<br />
20%<br />
% very satisfied<br />
Wastewater treatment<br />
90%<br />
81%<br />
70%<br />
75%<br />
54%<br />
60%<br />
45%<br />
30%<br />
15%<br />
58%<br />
0%<br />
2008 2009 2010 2011 2012<br />
0%<br />
RDC<br />
2011<br />
RDC<br />
2012<br />
Peer<br />
Group<br />
National<br />
Average<br />
This graph shows the percentage of survey respondents very<br />
or fairly satisfied with this service over the last five <strong>year</strong>s.<br />
This graph shows the percentage of survey respondents “very”<br />
satisfied with this service over the last two <strong>year</strong>s and compares<br />
it with our peer group and the national average for 2012.<br />
108 <strong>Rotorua</strong> <strong>District</strong> <strong>Council</strong> ANNUAL REPORT 2011/12
Water Supplies<br />
This <strong>year</strong>’s highlights and achievements<br />
included:<br />
Water Supplies<br />
What we do<br />
The water supplies activity comprises the provision<br />
of potable water to three urban supply areas, five<br />
rural residential supply areas and two farming<br />
supply areas.<br />
Functions carried out in providing the service<br />
include.<br />
• Strategic planning and improvement of water<br />
networks to provide for growth within the<br />
district.<br />
• Planning and implementation of renewal work<br />
to ensure infrastructure is maintained.<br />
• Developing of maintenance planning, levels of<br />
service and quality standards.<br />
• Management and maintenance of assets and<br />
services including monitoring of pressure, flow<br />
and water quality.<br />
• Developing of emergency and contingency<br />
plans to ensure service is maintained during<br />
adverse events.<br />
• Provision of information and education to the<br />
public regarding water use and conservation.<br />
• Development of funding policies and systems to<br />
enable continuing provision of the service into<br />
the future.<br />
Why we do it<br />
To provide cost-effective, constant, adequate,<br />
sustainable and high quality supply of water.<br />
• Lakes Road water main replacement -<br />
extensive replacement of water mains in Lake<br />
Road carried out in conjunction with the road<br />
improvements.<br />
• Ngongotaha pump station - new pump and<br />
rising main have been installed and successfully<br />
commissioned.<br />
• Reporoa mains - upgrade and replacement<br />
have been completed.<br />
• Public Health Risk Management Plans –<br />
completed for the 2 largest water supplies<br />
(central urban and eastern).<br />
• Compliance - achieved full compliance for six<br />
out of nine plants in relation to the new drinking<br />
water standards.<br />
Community Outcomes<br />
Safe and Caring<br />
• By maintaining sufficient water for fire fighting<br />
purposes.<br />
Healthy<br />
• By providing safe drinking water to the<br />
community.<br />
Excellent Facilities and Services<br />
• By providing good quality infrastructure for the<br />
future.<br />
<strong>Rotorua</strong> <strong>District</strong> <strong>Council</strong> ANNUAL REPORT 2011/12<br />
109
Water Supplies<br />
What it cost us<br />
Operating expenses<br />
2012<br />
actual<br />
$000<br />
<strong>Annual</strong><br />
Plan<br />
$000<br />
2011<br />
actual<br />
$000<br />
Direct costs 4,652 4,924 4,630<br />
Financial costs 377 359 303<br />
Depreciation 3,133 2,778 4,104<br />
Other* 253 0 485<br />
Total costs 8,415 8,061 9,522<br />
Revenue<br />
Capital revenue 202 286 431<br />
General rates -4 0 0<br />
Fees and charges 21 130 13<br />
Investment income 8 188 2<br />
Subsidies and grants 0 0 0<br />
Targeted rates 6,670 6,979 6,627<br />
Other income* 356 0 78<br />
Total revenue 7,253 7,583 7,151<br />
Net cost of service 1,162 478 2,371<br />
Capital costs<br />
Renewals 1,945 1,578 1,708<br />
Growth 1,277 523 2,209<br />
Backlog 200 551 327<br />
Level of service 43 0 0<br />
Total capital 3,465 2,652 4,244<br />
Operational funding<br />
Net cost of service of<br />
general rate activities<br />
1,162 478 2,371<br />
Plus capital revenue 138 0 98<br />
Less depreciation -3,140 -2,778 -4,104<br />
Depreciation funded by<br />
general rates<br />
0 10 12<br />
Add back half share<br />
roading depreciation<br />
0 0 0<br />
Self funding/DC reserve<br />
movements<br />
1,793 2,257 1,562<br />
Operations funded by<br />
general rates<br />
-47 -33 -61<br />
Capital funding<br />
Funding from<br />
depreciation (rates)<br />
4 10 12<br />
Loans from/(to)<br />
corporate fund<br />
0 63 7<br />
Capital grants 0 0 0<br />
Development<br />
contributions<br />
920 523 1,756<br />
Reserves net 2,541 2,056 2,469<br />
Asset sales 0 0 0<br />
Total capital 3,465 2,652 4,244<br />
* Non cash adjustments due to revaluation<br />
Capital expenditure<br />
2012<br />
actual<br />
$000<br />
Water investigations monitoring<br />
6<br />
equipment<br />
Ngongotaha bore source 40<br />
Urban water programmed<br />
49<br />
renewals<br />
Urban water pump station<br />
295<br />
improvements<br />
Urban water pump station<br />
104<br />
renewals<br />
Urban water reticulation<br />
214<br />
improvements<br />
Urban water reticulation renewals 2,010<br />
Mamaku water project renewals 17<br />
Mamaku water pump<br />
359<br />
improvements<br />
Rotoiti water plant renewals 1<br />
Rotoma water programmed<br />
1<br />
renewals<br />
Kaharoa water programmed<br />
8<br />
renewals<br />
Reporoa water mains upsizing 35<br />
Reporoa water programmed<br />
20<br />
renewals<br />
Reporoa water project renewals 305<br />
Hamurana water programmed<br />
1<br />
renewals<br />
Variance from budget<br />
3,465<br />
• Direct costs are favourable to budget due to<br />
the backflow preventer testing project being<br />
deferred and reduced expenditure in leak<br />
detection work.<br />
• Depreciation is higher than anticipated for the<br />
cost of assets and their revalued amount.<br />
• Other cost refers to non cash asset entries.<br />
• Fees and charges are unfavourable due to less<br />
recoverable works.<br />
• Targeted rates are lower than budget as<br />
metered consumption is down.<br />
• Other Income refers to vested assets.<br />
In the <strong>Annual</strong> Plan but not done<br />
• Installation of new and upgrade of existing<br />
backflow prevention devices in consumer<br />
connections deferred pending finalisation of<br />
Urban Public Health Risk Management Plans<br />
and policy development.<br />
• Replacement of main central supply pumps<br />
and reservoir valves deferred as condition<br />
assessment indicates there is still useful life<br />
remaining.<br />
110 <strong>Rotorua</strong> <strong>District</strong> <strong>Council</strong> ANNUAL REPORT 2011/12
Water<br />
Self funding account balances as at 30 June 2012<br />
$ in thousands<br />
-$12<br />
Okareka<br />
Water Supplies<br />
-$46<br />
Hamurana<br />
-$2,735<br />
Reporoa<br />
-$184<br />
Kaharoa<br />
-$48<br />
Rotoma<br />
-$75<br />
Rotoiti<br />
-$178<br />
Mamaku<br />
Urban<br />
$129<br />
$3,000 -$2,500 -$2,000 -$1,500 -$1,000 -$500 $- $500<br />
Self funding account balances are effectively the cash balance accumulated to date to fund future capital requirements<br />
for the specific water areas.<br />
How we performed<br />
Level of Service Performance measures Target for 2011/12 Achievement Comments<br />
Provision of safe drinking<br />
water.<br />
Water supply is<br />
adequate for fire<br />
fighting purposes within<br />
urban fire districts.<br />
% compliance with the<br />
DWSNZ monitoring<br />
requirements.<br />
Ministry of Health public<br />
health gradings are<br />
maintained at<br />
appropriate minimum<br />
levels for all supplies.<br />
% of fire hydrants comply<br />
with NZ Fire Service Code<br />
of Practice within urban<br />
fire districts.<br />
100% 100% (achieved) Ecoli monitoring to be<br />
included in the future.<br />
Cc Ec (not achieved) Technical faults with the<br />
treatment monitoring system<br />
have delayed the grading<br />
review. It is expected that<br />
the treatment upgrades will<br />
achieve at least C when the<br />
review is complete. The<br />
distribution zone grades<br />
already achieve c.<br />
The latest results as<br />
maintained by the Ministry<br />
of Health are detailed<br />
below.*<br />
95% 96.7% (achieved) 96.7% over 2,962hydrants.<br />
These are tested on a<br />
rotational basis over every 5<br />
<strong>year</strong>s and now include<br />
Mamaku as an urban fire<br />
district.<br />
<strong>Rotorua</strong> <strong>District</strong> <strong>Council</strong> ANNUAL REPORT 2011/12<br />
111
Water Supplies<br />
Level of Service Performance measures Target for 2011/12 Achievement Comments<br />
Reliable and effective<br />
water network and<br />
treatment facilities.<br />
% of connections meet<br />
minimum flow and<br />
pressure at point of supply<br />
during normal operation.<br />
95% 99% (achieved) Overall a result of 99% was<br />
achieved. This includes<br />
Central 99.3%, Eastern 99.4%<br />
and Ngongotaha 100%. This<br />
is measured by a<br />
combination of hydraulic<br />
modelling supported by<br />
flow/pressure testing.<br />
% of urban customers<br />
satisfied with water<br />
services as measured by<br />
annual community<br />
satisfaction survey.<br />
93% 97% (achieved) This includes ‘fairly satisfied’<br />
and ‘very satisfied’ results<br />
and was a 2% increase over<br />
the last <strong>year</strong>.<br />
Number of water<br />
restrictions imposed on<br />
consumers due to inability<br />
to meet full demand.<br />
None<br />
No water<br />
restrictions<br />
(achieved)<br />
Current water supplies are<br />
adequate for expected<br />
demand and no issues are<br />
expected with restrictions in<br />
the short to medium term.<br />
* Supply Source Grading Achieved<br />
Central Matipo Ua No<br />
Utuhina E No<br />
Eastern Eastern Ec No<br />
Okareka Eastern Eu No<br />
Rotoiti Rotoiti Db No<br />
Rotoma Rotoma Ea No<br />
Hamurana Hamurana Eb No<br />
Kaharoa Hamurana Eu No<br />
Ngongotaha Ngongotaha Da No<br />
Mamaku Mamaku Da No<br />
Reporoa Deep Creek Ec No<br />
Wharepapa E No<br />
www.drinkingwaterstandards.org.nz.<br />
The gradings listed above are the results from a grading exercise carried out in 2008 and 2009, before RDC installed new<br />
treatment systems or sources in every one of the supplies. No gradings have been carried out since. Another grading exercise<br />
will be carried out in the near future.<br />
The capital letter denotes the source grade and the small letter denotes the reticulation grading.<br />
Community satisfaction survey<br />
The graphs below have been prepared from the annual Community Satisfaction Survey.<br />
Water supplies<br />
Water supplies<br />
100%<br />
93% 91% 93% 95% 97%<br />
80%<br />
66%<br />
74%<br />
% very / fairly satisfied<br />
80%<br />
60%<br />
40%<br />
20%<br />
% very satisfied<br />
60%<br />
40%<br />
20%<br />
56% 55%<br />
0%<br />
2008 2009 2010 2011 2012<br />
0%<br />
RDC<br />
2011<br />
RDC<br />
2012<br />
Peer<br />
Group<br />
National<br />
Average<br />
This graph shows the percentage of survey respondents very<br />
or fairly satisfied with this service over the last five <strong>year</strong>s.<br />
This graph shows the percentage of survey respondents “very”<br />
satisfied with this service over the last two <strong>year</strong>s and compares<br />
it with our peer group and the national average for 2012.<br />
112 <strong>Rotorua</strong> <strong>District</strong> <strong>Council</strong> ANNUAL REPORT 2011/12
Castlecorp<br />
Castlecorp<br />
Overview of Castlecorp<br />
Castlecorp’s provides infrastructural related<br />
services as a service provider to council<br />
departments. <strong>Council</strong> undertakes this activity to<br />
meet legislative requirements and community<br />
expectations.<br />
Castlecorp is a business unit of council which<br />
generates its income from regularly reviewed<br />
contracts and service agreements for in-house<br />
service delivery to departments of <strong>Council</strong>. These<br />
services include:<br />
• Refuse collection<br />
• Litter clearance<br />
• Footpath and verge maintenance<br />
• Stormwater system maintenance<br />
• Water supply reticulation maintenance<br />
• Water supply pump stations and reservoir<br />
operation and maintenance<br />
• Water supply leak detection, meter reading,<br />
and water sampling<br />
• Wastewater reticulation maintenance including<br />
forest irrigation<br />
• Cemetery maintenance and operation, and<br />
management of crematorium<br />
• Sportsfield and reserve maintenance<br />
• Public garden and horticultural maintenance<br />
• Janitorial Services<br />
• Purchasing and maintenance of small plant<br />
and fleet vehicles<br />
• Rural Fire<br />
• Events Management. Assisting before, during<br />
and after events (Night Market, Raggamuffin<br />
etc).<br />
Castlecorp aims to improve the quality of life of<br />
residents and visitors through provision of quality<br />
services and the maintenance of essential<br />
infrastructure, employing sound business practices<br />
based on continuous improvements to match<br />
quality and cost effectiveness of the private sector.<br />
Castlecorp not only maintains essential networks of<br />
underground services and parks, but also supports<br />
the <strong>Rotorua</strong> community by participating in a wide<br />
range of community activities, and developing<br />
close working relationships with community<br />
organisations. Customer-based strategies and a<br />
strong commitment to sustainable operations<br />
reflect the values of continuous improvement and<br />
value for customers.<br />
<strong>Rotorua</strong> <strong>District</strong> <strong>Council</strong> ANNUAL REPORT 2011/12<br />
113
Castlecorp<br />
What it cost us<br />
Operating expenses<br />
2012<br />
actual<br />
$000<br />
<strong>Annual</strong><br />
Plan<br />
$000<br />
2011<br />
actual<br />
$000<br />
Direct costs -494 -550 -525<br />
Financial costs 56 67 44<br />
Depreciation 809 739 799<br />
Other* 76 0 38<br />
Total costs 447 256 356<br />
Revenue<br />
Capital revenue 0 0 0<br />
General rates 0 0 0<br />
Fees and charges 269 302 320<br />
Investment income 0 0 0<br />
Subsidies and grants 0 0 0<br />
Targeted rates 0 0 0<br />
Other income* 0 0 0<br />
Total revenue 269 302 320<br />
Capital expenditure<br />
2012<br />
actual<br />
$000<br />
Furniture and fittings 3<br />
Plant replacement 5<br />
Compactor replacements 6<br />
Fleet sales -129<br />
Maintenance equipment<br />
2<br />
replacement<br />
Mower replacements 43<br />
Pump replacements 6<br />
Vehicle replacements 847<br />
Variance from budget<br />
783<br />
Net cost of service 178 -46 36<br />
Capital costs<br />
Renewals 783 1,025 976<br />
Growth 0 0 0<br />
Backlog 0 0 0<br />
Level of service 0 64 0<br />
Total capital 783 1,089 976<br />
Operational funding<br />
Net cost of service of<br />
general rate activities<br />
178 -46 36<br />
Plus capital revenue 0 0 0<br />
Less depreciation -885 -739 -836<br />
Depreciation funded by<br />
general rates<br />
772 1,025 976<br />
Add back half share<br />
roading depreciation<br />
0 0 0<br />
Self funding/DC reserve<br />
movements<br />
0 0 0<br />
Operations funded by<br />
general rates<br />
65 240 176<br />
• Direct costs are higher than budget due to<br />
increased activity in several areas particularly<br />
water supply rider mains replacements. Fleet<br />
costs are higher than budget due to the<br />
introduction of GPS, increased costs of fuel and<br />
fleet maintenance, motor registration and road<br />
user charges. Higher than budgeted costs<br />
consequently increased Castlecorp's internal<br />
recoveries.<br />
• Fees and charges income is unfavourable to<br />
budget as less work was completed for<br />
infrastructure services.<br />
Capital funding<br />
Funding from<br />
depreciation (rates)<br />
785 1,228 1,214<br />
Loans from/(to)<br />
corporate fund<br />
0 64 0<br />
Capital grants 0 0 0<br />
Development<br />
contributions<br />
0 0 0<br />
Reserves net 0 0 0<br />
Asset sales -2 -203 -238<br />
Total capital 783 1,089 976<br />
* Non cash adjustments due to revaluation<br />
114 <strong>Rotorua</strong> <strong>District</strong> <strong>Council</strong> ANNUAL REPORT 2011/12
<strong>Rotorua</strong> Regional Airport Limited<br />
Overview<br />
<strong>Rotorua</strong> Regional Airport Limited (RRAL) is a limited<br />
liability company. RRAL is fully owned by the<br />
<strong>Rotorua</strong> <strong>District</strong> <strong>Council</strong> and is a <strong>Council</strong> Controlled<br />
Trading Organisation as defined under section 6 of<br />
the Local Government Act 2002.<br />
Airport operations are managed by a chief<br />
executive reporting to the company’s board of<br />
directors. The airport operates as <strong>Rotorua</strong><br />
International Airport.<br />
Total revenue<br />
Actual revenue was down $370,141 when<br />
compared to the Statement of Intent (SOI) budget.<br />
This was due to a reduction in passengers of 24,703<br />
(11%). The three main areas affected were landing<br />
charges revenue (decrease of $139,000), car park<br />
revenue (decrease of $184,000), and development<br />
levy revenue (decrease of $66,000). These<br />
decreases were slightly offset by an increase in<br />
other rental revenue of $40,000. The remaining<br />
variance of $21,000 relates to a reduction in other<br />
revenue.<br />
Total expenses<br />
Actual expenses were down $402,430 when<br />
compared to the SOI budget. The main areas<br />
where savings were achieved were: rent<br />
($191,000), the development levies pass-on<br />
expense ($31,000), and marketing expenses<br />
($350,000). These savings were slightly offset by an<br />
increases in development levy expenses of<br />
$83,000, depreciation of $50,000, and general<br />
expenses (relating to survey costs, survey reports<br />
and statistical processing) of $37,000.<br />
Management and governance<br />
The following Directors held office as at 30 June<br />
2012:<br />
Date of<br />
appointment<br />
Raymond Noel Cook (Chairman) 10/12/2002<br />
Wiremu Atetini Kingi 10/12/2002<br />
Peter John Guerin 04/11/2010<br />
Stuart Alan Crosby 22/12/2010<br />
The following Directors resigned during the <strong>year</strong>:<br />
Date of<br />
resignation<br />
Geoffrey Brian Kenny 28/06/2011<br />
<strong>Rotorua</strong> Regional Airport Limited<br />
Performance targets for 2011/12<br />
The results of the performance measures for 2011/12 were:<br />
2012 target 2012 actual 2011 actual<br />
Total Revenue 2,868,460 2,498,319 2,908,931<br />
Total Expenses 2,843,094 2,440,664 2,708,900<br />
Surplus (deficit) before tax 25,366 57,655 200,031<br />
Provision for tax - - -<br />
Surplus (deficit) after tax 25,366 57,655 200,031<br />
Total Debt 420,000 - 420,000<br />
Total Assets (net current liabilities) 1,526,365 1,784,051 1,726,396<br />
Total Shareholders Funds 1,526,365 1,784,051 1,726,396<br />
Surplus (deficit) after tax to average shareholders funds 2.42% 3.28% 12.30%<br />
Debt to equity percentage 27.5% 0% 24%<br />
Interest cover - times >2.00 3.56 7.26<br />
Aircraft<br />
Aircraft Movements 7,920 7,712 -<br />
<strong>Rotorua</strong> <strong>District</strong> <strong>Council</strong> ANNUAL REPORT 2011/12<br />
115
<strong>Rotorua</strong> Regional Airport Limited<br />
2012 target 2012 actual 2011 actual<br />
Passengers<br />
Domestic 227,578 203,760 -<br />
International 23,920 23,035 -<br />
Total Passengers 251,498 226,795 -<br />
Total operating revenue per passenger $11.40 $10.93 -<br />
Aeronautical revenue per passenger $9.16 $8.39 -<br />
Commercial revenue per passenger $2.24 $2.54 -<br />
NPAT per employee $1,725 $3,847 -<br />
NPAT per passenger $0.10 $0.25 -<br />
Total assets per passenger $6.07 $7.87 -<br />
Ratio of aeronautical revenue to total revenue 80.30% 76.17% -<br />
2011/12 results<br />
Statement of comprehensive income<br />
REVENUE<br />
Operating revenue 2,478,887 2,584,107<br />
Other revenue 19,432 324,824<br />
2,498,319 2,908,931<br />
EXPENSES<br />
Operating expenses 940,751 1,032,020<br />
Audit fees 23,294 19,583<br />
Depreciation and amortisation 200,399 170,820<br />
Development levy pass-on 510,035 530,996<br />
Directors’ fees 22,500 27,875<br />
Interest – loans 14,696 25,914<br />
Other expenses 464,664 679,063<br />
Rent and rates 264,325 222,629<br />
2,440,664 2,708,900<br />
2012<br />
$<br />
2011<br />
$<br />
SURPLUS / (DEFICIT) BEFORE TAX 57,655 200,031<br />
Income tax expense - -<br />
SURPLUS / (DEFICIT) AFTER TAX 57,655 200,031<br />
TOTAL COMPREHENSIVE INCOME 57,655 200,031<br />
116 <strong>Rotorua</strong> <strong>District</strong> <strong>Council</strong> ANNUAL REPORT 2011/12
<strong>Rotorua</strong> <strong>District</strong> <strong>Council</strong> Holdings Limited<br />
In recent <strong>year</strong>s there has been a strong theme of partnership with other organisations around commercial<br />
relationships. A current example is the intellectual property developed by Scion to process biosolids from the<br />
<strong>Rotorua</strong> urban waste water treatment plant. This technology is called TERAX and has significant commercial<br />
value. In 2010 council established a holding company – <strong>Rotorua</strong> <strong>District</strong> <strong>Council</strong> Holdings Limited – to be used<br />
as an umbrella for a range of commercial activities that were identified at the time, such as attracting inward<br />
investment and wealth creation, CBD revitalisation and lakefront development, energy and geothermal use,<br />
Waste 2 Gold, airport capital expenditure funding, and property development. As at 30 June 2012 the holding<br />
company had not traded, however since then efforts are being made to prepare a Statement of Intent for the<br />
company to allow it to operate and where it may be used to acquire a 50% shareholding in TERAX Ltd. The<br />
two directors Peter Guerin (Chief Executive) and Jean-Paul Gaston (Group Manager Corporate and Customer<br />
Services) will be replaced with all of council’s elected members as directors in due course. This holding<br />
company will report to council and its activities included in the 2012/13 <strong>Annual</strong> <strong>Report</strong>.<br />
Grow <strong>Rotorua</strong> Limited<br />
In November 2011 council agreed to consider establishment of a council controlled organisation (CCO) as the<br />
preferred structure to drive implementation of the <strong>Rotorua</strong> Sustainable Economic Growth Strategy. The CCO<br />
operating as Grow <strong>Rotorua</strong> Ltd is 100% owned by <strong>Rotorua</strong> <strong>District</strong> <strong>Council</strong>. In the development and adoption<br />
of the Long-term Plan 2012-2022 <strong>Council</strong> has allocated a budget of $850,000 in the 2012/13 <strong>year</strong> to fund the<br />
establishment and operation of the CCO.<br />
The following board members were appointed after 30 June 2012:<br />
John Green (Chairperson)<br />
Warren Parker<br />
Jane Nees<br />
Michael Barnett<br />
Tony Marks<br />
Gina Rangi<br />
Hemi Rolleston<br />
Grow <strong>Rotorua</strong> Limited <strong>Rotorua</strong> <strong>District</strong> <strong>Council</strong> Holdings Limited<br />
As at 30 June 2012 the company was dormant and non-operational.<br />
<strong>Rotorua</strong> <strong>District</strong> <strong>Council</strong> ANNUAL REPORT 2011/12<br />
117
Local Authority Shared Services Limited<br />
Local Authority Shared Services Limited<br />
The Local Authority Shared Services Ltd (LASS) was<br />
incorporated in December 2005. The LASS was<br />
established as a Control Controlled Organisation under<br />
the Local Government Act for the 13 Waikato/<strong>Rotorua</strong><br />
councils. <strong>Rotorua</strong> <strong>District</strong> <strong>Council</strong> has an approximately<br />
7% shareholding in the company.<br />
Over the period the company has been operating<br />
benefits have been delivered in the form of:<br />
• Improved level and quality of service<br />
• Coordinated approach to the provision of services<br />
• Reductions in the cost of services<br />
• Opportunity to develop new initiatives<br />
• Opportunity for all councils irrespective of location or<br />
size to benefit from joint initiatives<br />
• Leverage provided from economies of scale resulting<br />
from a single entity representing councils leveraging<br />
procurement opportunities<br />
At this stage these gains have been realised by<br />
shareholders in the Shared Valuation Data Service (SVDS)<br />
and the Waikato Regional transport model (WRTM). Both<br />
these operations will continue to target options for<br />
improvements in the existing software that will benefit the<br />
users.<br />
The ability of LASS to contribute to a greater extent in<br />
terms of shared services and also at a strategic<br />
collaboration level has been the subject of discussion<br />
and agreement through the Waikato Triennial Forum.<br />
The Directors have been tasked with identifying ways to<br />
progress these initiatives. This will involve resourcing and<br />
funding a range of initiatives that will potentially extend<br />
the services currently offered by LASS. The LASS Directors<br />
will continue to seek any new opportunities, either from<br />
internal investigations, or shareholder initiatives that are<br />
presented to it with a sound business case.<br />
New services that are int<strong>ended</strong> to be initiated under the<br />
LASS umbrella will only be adopted where a business<br />
case shows that they provide some form of benefit to the<br />
shareholders. The benefits that may be gained include<br />
development of intellectual property through new<br />
business services, protection of <strong>Council</strong> data, improved<br />
levels of service and/or reduced cost. All such proposals<br />
will be presented to the Shareholders for approval prior to<br />
implementation.<br />
The following performance measures were incorporated<br />
into the Statement of Intent for the 2011/12 financial <strong>year</strong>.<br />
Performance measure<br />
The company will carry out an annual survey of<br />
shareholders to assist Directors in developing improvements<br />
on behalf of the shareholders, and to receive a majority of<br />
shareholder approval on the services provided.<br />
Administration expenditure shall not exceed that budgeted<br />
by more than 5% unless prior approval is obtained from the<br />
Directors.<br />
The Board will provide a written report on the business<br />
operations and financial position of the LASS as a minimum<br />
on a six monthly basis.<br />
There will be an annual report to directors that all statutory<br />
requirements of the LASS are being adhered to.<br />
That SVDS is available to users at least 99% of normal<br />
working hours.<br />
That at least 98% of agreed timelines are met for sale and<br />
property files that have been delivered to the FTP server for<br />
access to customers.<br />
That over 50% of the Intergen support hours are spent on<br />
major development work.<br />
That all required modelling reports are actioned within the<br />
required timeframe.<br />
That a full report on progress of the model be provided to<br />
the LASS Board twice each <strong>year</strong>.<br />
Actual outcome<br />
<strong>Annual</strong> survey of shareholders was completed in July with<br />
all but one of the shareholder councils replying. Eleven<br />
councils replied that the concept of LASS was still delivering<br />
benefits to their council. Five councils replied that LASS was<br />
fulfilling the expectations of shareholders and seven replied<br />
“fairly satisfied”. Those who responded fairly satisfied were<br />
generally satisfied with the existing services but considered<br />
more could be achieved through other shared service<br />
opportunities.<br />
Achieved, actual expenditure was $13,642 favourable to<br />
budget.<br />
Six monthly reports have been sent to shareholders.<br />
<strong>Report</strong>ed to the August Board meeting.<br />
SVDS was available 99.93% of working hours.<br />
100% of sales and property files were supplied to Terralink /<br />
Property IQ on time.<br />
35% of Intergen support hours were spent on major<br />
development work as a result of much higher bug fix and<br />
admin time. This has been the subject of discussions with<br />
Intergen management and a new model for controlling this<br />
is in place.<br />
Achieved<br />
Achieved<br />
118 <strong>Rotorua</strong> <strong>District</strong> <strong>Council</strong> ANNUAL REPORT 2011/12
Bay of Plenty Local Authority Shared<br />
Services Limited<br />
<strong>Rotorua</strong> <strong>District</strong> <strong>Council</strong> is also a one-eighth shareholder in Bay of Plenty Local Authority Shared Services Ltd<br />
(BOP LASS). BOP LASS was incorporated during 2007/08 and the following performance indicators were<br />
included in its Statement of Intent for 2011/12.<br />
Performance targets for 2011/12<br />
Outcome Measure Result<br />
Initiate at least one shared service<br />
each <strong>year</strong> and no less than two<br />
shared services successfully<br />
implemented within three <strong>year</strong>s.<br />
Implement Shared Services<br />
demonstrating best practice and<br />
added value to participating<br />
councils and stakeholders.<br />
Facilitate a minimum of four Joint<br />
Procurement initiatives per <strong>year</strong><br />
for goods and services from<br />
sources offering best value,<br />
service, and or continuity of<br />
supply.<br />
Communicate with each<br />
shareholding council at<br />
appropriate levels with at least<br />
one meeting with each Executive<br />
Leadership Team per <strong>year</strong>.<br />
Ensure sufficient income is<br />
available from activities to sustain<br />
a viable company.<br />
Number of shared services. Rates initiated 2011.<br />
Information Services Strategic Plan<br />
(ISSP) completed 2011, implementation<br />
commenced 2011.<br />
Establishment of ISSP foundation<br />
services initiated 2011/12.<br />
Geographic Information Services (GIS)<br />
initiated 2009/10, inception report<br />
completed 2010, significant progress on<br />
implementation.<br />
Inter-council video conferencing<br />
implemented 2010/11.<br />
Implementation programme<br />
incorporates best practice.<br />
Number of procurement initiatives<br />
investigated and or completed.<br />
At least one meeting with each<br />
council at <strong>Council</strong> and/or<br />
management team level.<br />
Income received from contributing<br />
councils and funding from activities<br />
to meet operational budget.<br />
GIS inception plan developed with<br />
external support and peer review.<br />
Information Services Strategic Plan<br />
(ISSP) developed with external support<br />
and internal review.<br />
Video conferencing network<br />
established with external support and<br />
internal review.<br />
GPS vehicle tracking, accommodation,<br />
travel, P-cards, reprographic, postal<br />
services, courier, after-hours phone<br />
services, spatial data software, Raster<br />
analysis software, health insurance.<br />
Meetings with all councils.<br />
<strong>Council</strong> contributions levied, activity<br />
groups levied, contributions received<br />
from activities producing savings.<br />
Bay of Plenty Local Authority Shared Services Limited<br />
<strong>Rotorua</strong> <strong>District</strong> <strong>Council</strong> ANNUAL REPORT 2011/12<br />
119
Financial statements<br />
Financial statements<br />
FINANCIAL STATEMENTS<br />
121 STATEMENT OF COMPLIANCE<br />
121 STATEMENT OF FINANCIAL INVOLVEMENT IN CCTOS<br />
122 STATEMENT OF COMPREHENSIVE INCOME<br />
123 STATEMENT OF CHANGES IN EQUITY<br />
124 STATEMENT OF FINANCIAL POSITION<br />
125 STATEMENT OF CASH FLOWS<br />
NOTES TO THE FINANCIAL STATEMENTS<br />
126 1: Statement of accounting policies<br />
139 2: Performance by council activity<br />
140 3: Income by category<br />
141 4: Expenditure by category<br />
142 5: Taxation<br />
143 6: Cash and cash equivalents<br />
143 7: Debtors and other receivables<br />
145 8: Inventories<br />
146 9: Property, plant and equipment<br />
151 10: Intangible assets<br />
152 11: Biological assets (forestry)<br />
153 12: Other financial assets<br />
154 13: Creditors and other payables<br />
154 14: Provisions<br />
155 15: Employee benefit liabilities<br />
156 16A: Borrowings<br />
157 16B: Derivative financial instruments<br />
158 17: Equity<br />
162<br />
18: Reconciliation of net surplus/(deficit) after tax to net cash flow from operating<br />
activities<br />
162 19: Capital commitments and operating leases<br />
164 20: Contingencies<br />
166 21: Related party transactions<br />
167 22: Agency relationships<br />
168 23: Remuneration<br />
169 24: Events after balance date<br />
169 25A: Financial instrument categories<br />
169 25B: Fair value hierarchy disclosures<br />
171 25C: Financial instrument risks<br />
176 26: Capital management<br />
176 27: Explanation of major variances against budget<br />
120 <strong>Rotorua</strong> <strong>District</strong> <strong>Council</strong> ANNUAL REPORT 2011/12
Statement of compliance<br />
The <strong>Council</strong> of <strong>Rotorua</strong> <strong>District</strong> <strong>Council</strong> hereby confirm that all statutory requirements in relation to the annual<br />
report, as outlined in the Local Government Act 2002, have been complied with.<br />
Kevin Winters<br />
Mayor<br />
30 October 2012<br />
P J Guerin<br />
Chief Executive<br />
30 October 2012<br />
Statement of financial involvement in<br />
CCTOs<br />
<strong>Rotorua</strong> <strong>District</strong> <strong>Council</strong> has 100% shareholding in <strong>Rotorua</strong> Regional Airport Limited. Details of transactions with<br />
this entity are detailed on page 115 and in note 12.<br />
<strong>Rotorua</strong> <strong>District</strong> <strong>Council</strong> is also a part shareholder in Local Authority Shared Services Ltd (details on page 117)<br />
and Bay of Plenty Local Authority Shared Services Ltd (details are provided on page 118).<br />
Kevin Winters<br />
Mayor<br />
30 October 2012<br />
Statement of financial involvement in CCTOs Statement of compliance<br />
P J Guerin<br />
Chief Executive<br />
30 October 2012<br />
<strong>Rotorua</strong> <strong>District</strong> <strong>Council</strong> ANNUAL REPORT 2011/12<br />
121
Statement of comprehensive income<br />
Statement of comprehensive income<br />
for the <strong>year</strong> <strong>ended</strong> 30 June 2012<br />
Income<br />
2012<br />
actual<br />
<strong>Council</strong><br />
$000<br />
2012<br />
budget<br />
2011<br />
actual<br />
Group<br />
$000<br />
2012<br />
actual<br />
2011<br />
actual<br />
Rates revenue 3 71,774 68,653 68,548 71,705 68,486<br />
Other revenue 3 49,774 53,635 46,421 51,543 48,606<br />
Other gains / (losses) 3 0 136 5 0 5<br />
Total income 121,548 122,424 114,974 123,248 117,097<br />
Expenditure<br />
Personnel costs 4 33,570 34,018 32,757 33,570 32,757<br />
Depreciation and amortisation 4 28,282 24,419 26,098 28,482 26,269<br />
Other expenses 4 54,083 39,262 40,666 55,583 42,618<br />
Finance cost 4 9,016 9,499 7,797 9,016 7,797<br />
Total expenditure 124,951 107,198 107,318 126,651 109,441<br />
Surplus before taxation -3,403 15,226 7,656 -3,403 7,656<br />
Taxation 0 0 0 0 0<br />
Net surplus after taxation -3,403 15,226 7,656 -3,403 7,656<br />
Other comprehensive income<br />
Revaluation on property, plant and equipment 17 -19,981 25,350 54,649 -19,981 54,649<br />
Net change in fair value of hedges 17 122 0 -209 122 -209<br />
Net change in fair value of investment 12 -103 0 172 -103 172<br />
Total other comprehensive income -19,962 25,350 54,612 -19,962 54,612<br />
Total comprehensive income -23,365 40,576 62,268 - 23,365 62,268<br />
Explanations of major variances against budget are provided in note 27.<br />
The accompanying notes should be read in conjunction with these financial statements.<br />
122 <strong>Rotorua</strong> <strong>District</strong> <strong>Council</strong> ANNUAL REPORT 2011/12
Statement of changes in equity<br />
for the <strong>year</strong> <strong>ended</strong> 30 June 2012<br />
2012<br />
actual<br />
<strong>Council</strong><br />
$000<br />
2012<br />
budget<br />
2011<br />
actual<br />
Group<br />
$000<br />
2012<br />
actual<br />
2011<br />
actual<br />
Opening balance 897,981 871,823 835,713 897,981 835,713<br />
Total comprehensive income -23,365 40,576 62,268 -23,365 62,268<br />
Closing balance 874,616 912,399 897,981 874,616 897,981<br />
The accompanying notes should be read in conjunction with these financial statements.<br />
Statement of changes in equity<br />
<strong>Rotorua</strong> <strong>District</strong> <strong>Council</strong> ANNUAL REPORT 2011/12<br />
123
Statement of financial position<br />
Statement of financial position<br />
as at 30 June 2012<br />
Note 2012<br />
actual<br />
<strong>Council</strong><br />
$000<br />
2012<br />
budget<br />
2011<br />
actual<br />
Group<br />
$000<br />
2012<br />
actual<br />
2011<br />
actual<br />
Assets<br />
Current assets<br />
Cash & cash equivalents 6 883 2,652 1,774 1,622 1,658<br />
Debtors & other receivables 7 21,287 18,218 18,438 21,501 18,355<br />
Inventories 8 1,297 1,454 1,344 1,297 1,345<br />
Provision for taxation 5 0 0 0 48 58<br />
Total current assets 23,467 22,324 21,555 24,468 21,414<br />
Non-current assets<br />
Loans & receivables 7 17 29 17 17 17<br />
Property, plant and equipment 9 1,028,756 1,069,592 1,040,155 1,029,589 1,041,078<br />
Intangible assets 10 2,804 4,029 3,768 2,889 3,810<br />
Biological assets (forestry) 11 1,230 316 458 1,230 458<br />
Other financial assets 12 2,147 2,063 2,220 363 493<br />
Total non-current assets 1,034,954 1,076,029 1,046,639 1,034,088 1,045,873<br />
Total assets 1,058,421 1,098,353 1,068,194 1,058,556 1,067,286<br />
Liabilities<br />
Current liabilities<br />
Creditors and other payables 13 22,347 27,757 26,848 22,432 25,880<br />
Provisions 14 1,128 555 582 1,128 582<br />
Employee benefit liabilities 15 5,427 4,972 5,012 5,477 5,072<br />
Borrowings 16A 42,325 28,300 36,066 42,325 36,066<br />
Derivative financial instruments 16B 376 0 566 376 566<br />
Total current liabilities 71,603 61,584 69,074 71,738 68,166<br />
Non-current liabilities<br />
Provisions 14 2,678 1,979 1,984 2,678 1,984<br />
Employee benefit liabilities 15 469 691 677 469 677<br />
Borrowings 16A 108,650 121,700 98,000 108,650 98,000<br />
Derivative financial instruments 16B 405 0 478 405 478<br />
Total non-current liabilities 112,202 124,370 101,139 112,202 101,139<br />
Total liabilities 183,805 185,954 170,213 183,940 169,305<br />
Equity<br />
Accumulated funds 17 853,102 874,534 848,433 853,102 848,433<br />
Self funding reserves 17 -62,554 -69,158 -58,456 -62,554 -58,456<br />
<strong>Council</strong> created reserves 17 -25,045 -17,347 -20,894 -25,045 -20,894<br />
Restricted reserves 17 1,521 1,488 1,345 1,521 1,345<br />
Cashflow hedge reserve 17 -558 0 -680 -558 -680<br />
Fair value through equity 17 304 230 407 304 407<br />
Asset revaluation reserve 17 107,846 122,652 127,826 107,846 127,826<br />
Total equity 874,616 912,399 897,981 874,616 897,981<br />
The accompanying notes should be read in conjunction with these financial statements.<br />
Mayor<br />
Chief Executive<br />
30 October 2012 30 October 2012<br />
124 <strong>Rotorua</strong> <strong>District</strong> <strong>Council</strong> ANNUAL REPORT 2011/12
Statement of cash flows<br />
for the <strong>year</strong> <strong>ended</strong> 30 June 2012<br />
2012<br />
actual<br />
<strong>Council</strong><br />
$000<br />
2012<br />
budget<br />
2011<br />
actual<br />
Group<br />
$000<br />
2012<br />
actual<br />
2011<br />
actual<br />
Cash flows from operating activities<br />
Receipts from rates revenue 71,826 68,654 68,807 71,757 68,745<br />
Interest received 102 60 117 106 130<br />
Dividends received 1 - 1 -<br />
Receipts from other revenue 41,192 52,567 44,928 43,978 45,441<br />
Payments to suppliers and employees -82,950 -79,478 -69,431 -84,381 -71,363<br />
Interest paid -8,560 -9,499 -7,609 -8,570 -7,593<br />
Income tax paid/refunded - 10 -5<br />
Goods and Services Tax (net) -2,864 -1,728 -2,690 -2,164<br />
Net cash from operating activities 18,747 32,304 35,084 20,211 33,191<br />
Statement of cash flows<br />
Cash flows from investing activities<br />
Proceeds from sale of property, plant and equipment 811 203 924 811 938<br />
Proceeds from sale of intangible assets - 99 - 99<br />
Collections on advances - 15 - 15<br />
Purchase of property, plant and equipment -44,611 -48,780 -55,051 -44,800 -55,141<br />
Purchase of intangible assets -458 -738 -458 -738<br />
Other Movements ex Fixed Asset note non cash 7,711 173 7,711 173<br />
Net cash from investing activities -36,547 -48,577 -54,578 -36,736 -54,654<br />
Cash flows from financing activities<br />
Proceeds from borrowings 20,000 30,424 15,176 20,000 15,176<br />
Repayment of borrowings -13,676 -13,500 -5,000 -14,096 -5,000<br />
Change in usage of registered security stock facility 10,585 9,090 10,585 9,090<br />
Proceeds from borrowings - -<br />
Net cash from financing activities 16,909 16,924 19,266 16,489 19,266<br />
Net (decrease)/increase in cash and cash equivalents -891 650 -228 -36 -2,197<br />
Cash and cash equivalents at the beginning of the <strong>year</strong> 1,774 2,002 2,002 1,658 3,856<br />
-<br />
Cash and cash equivalents at <strong>year</strong> end 883 2,652 1,774 1,622 1,658<br />
The accompanying notes should be read in conjunction with these financial statements.<br />
The GST (net) component of operating activities reflects the net GST paid and received from the Inland Revenue<br />
Department. The GST (net) component has been presented on a net basis, as the gross amounts do not provide meaningful<br />
information for financial statement purposes and to be consistent with the presentation basis of other primary financial<br />
statements<br />
<strong>Rotorua</strong> <strong>District</strong> <strong>Council</strong> ANNUAL REPORT 2011/12<br />
125
Notes to the financial statements<br />
Notes to the financial statements<br />
for the <strong>year</strong> <strong>ended</strong> 30 June 2012<br />
1: Statement of accounting policies<br />
<strong>Report</strong>ing entity<br />
<strong>Rotorua</strong> <strong>District</strong> <strong>Council</strong> is a territorial local authority<br />
governed by the Local Government Act 2002 and<br />
is domiciled in New Zealand.<br />
The <strong>Rotorua</strong> <strong>District</strong> <strong>Council</strong> Group (Group) consists<br />
of <strong>Rotorua</strong> <strong>District</strong> <strong>Council</strong> (<strong>Council</strong>) and its 100%<br />
owned subsidiary <strong>Rotorua</strong> Regional Airport Limited<br />
(RRAL). The RRAL subsidiary is incorporated and<br />
domiciled in New Zealand.<br />
The primary objective of the <strong>Rotorua</strong> <strong>District</strong><br />
<strong>Council</strong> is to provide goods or services for the<br />
community or social benefit rather than making a<br />
financial return. Accordingly, the <strong>Council</strong> has<br />
designated itself and the Group as public benefit<br />
entities for the purposes of New Zealand<br />
equivalents to International Financial <strong>Report</strong>ing<br />
Standards (NZ IFRS).<br />
The financial statements of <strong>Rotorua</strong> <strong>District</strong> <strong>Council</strong><br />
are for the <strong>year</strong> <strong>ended</strong> 30 June 2012. The financial<br />
statements were authorised for issue by <strong>Council</strong> on<br />
30 October 2012.<br />
Basis of preparation<br />
Statement of compliance<br />
The financial statements of the <strong>Rotorua</strong> <strong>District</strong><br />
<strong>Council</strong> and Group have been prepared in<br />
accordance with the requirements of the Local<br />
Government Act 2002 which includes the<br />
requirement to comply with New Zealand<br />
generally accepted accounting practice (NZ<br />
GAAP).<br />
These financial statements have been prepared in<br />
accordance with NZ GAAP. They comply with NZ<br />
IFRS, and other applicable Financial <strong>Report</strong>ing<br />
Standards, as appropriate for public benefit<br />
entities.<br />
Measurement base<br />
The financial statements have been prepared on<br />
an historical cost basis, modified by the revaluation<br />
of land and buildings, certain infrastructural assets,<br />
collections, biological assets and certain financial<br />
instruments (including derivative instruments).<br />
Functional and presentation currency<br />
The financial statements are presented in New<br />
Zealand dollars and all values are rounded to the<br />
nearest thousand dollars ($000). The functional<br />
currency of <strong>Rotorua</strong> <strong>District</strong> <strong>Council</strong> and Group is<br />
New Zealand dollars.<br />
Changes in accounting policies<br />
There have been no changes in accounting<br />
policies during the financial <strong>year</strong>.<br />
The council and group have adopted the<br />
following revisions to accounting standards during<br />
the financial <strong>year</strong>, which have had only a<br />
presentational or disclosure effect:<br />
• Amendments to NZ IAS 1 Presentation of<br />
Financial Statements. The amendments<br />
introduce a requirement to present, either in<br />
the statement of comprehensive income by<br />
item. The <strong>Council</strong> has decided to present this<br />
analysis in note 17.<br />
• FRS-44 New Zealand Additional Disclosures and<br />
Amendments to NZ IFRS to harmonise with IFRS<br />
and Australian Accounting Standards<br />
(Harmonisation Amendments) – The purpose of<br />
he new standard and amendments is to<br />
harmonise Australian and New Zealand<br />
accounting standards with source IFRS and to<br />
eliminate many of the differences between the<br />
accounting standards in each jurisdiction. The<br />
main effect of the amendments on the <strong>Council</strong><br />
and group is that certain information about<br />
property valuations is no longer required to be<br />
disclosed. Note 9 has been updated for these<br />
changes.<br />
• Amendments to NZ IFRS 7 Financial Instruments:<br />
Disclosures – The amendment reduces the<br />
disclosure requirements relating to credit risk.<br />
Note 7 has been updated for the amendments.<br />
Standards and interpretations issued and not yet<br />
adopted<br />
Standards, amendments and interpretations issued<br />
but not yet effective that have not been early<br />
adopted, and which are relevant to the <strong>Rotorua</strong><br />
<strong>District</strong> <strong>Council</strong> include:<br />
• NZ IFRS9 Financial Instruments will eventually<br />
replace NZ IAS 39 Financial Instruments:<br />
Recognition and Measurement. NZ IAS 39 is<br />
being replaced through the following 3 main<br />
phases: Phase 1 Classification and<br />
Measurement, Phase 2 Impairment<br />
Methodology, and Phase 3 Hedge Accounting.<br />
Phase 1 on the classification and measurement<br />
of financial assets has been completed and<br />
has been published in the new financial<br />
126 <strong>Rotorua</strong> <strong>District</strong> <strong>Council</strong> ANNUAL REPORT 2011/12
instrument standard NZ IFRS 9. NZ IFRS 9 uses a<br />
single approach to determine whether a new<br />
financial asset is measured at amortised cost or<br />
fair value, replacing many different rules in NZ<br />
IAS 39. The approach in NZ IAS 9 is based on<br />
how and entity manages its financial<br />
instruments (its business model) and the<br />
contractual cash flow characteristics of<br />
financial assets. The financial liability<br />
requirements are the same as those of NZ IAS<br />
39, except for when an entity elects to<br />
designate a financial liability at fair value<br />
through the surplus/deficit. The new standard is<br />
required to be adopted for the <strong>year</strong> <strong>ended</strong> 30<br />
June 2016. However, as a new Accounting<br />
Standards Framework will apply before this<br />
date, there is no certainty when an equivalent<br />
standard to NZ IFRS 9 will be applied by public<br />
benefit entities.<br />
Subsidiaries<br />
<strong>Rotorua</strong> <strong>District</strong> <strong>Council</strong> consolidates as subsidiaries<br />
in the group financial statements all entities where<br />
<strong>Rotorua</strong> <strong>District</strong> <strong>Council</strong> has the capacity to control<br />
their financing and operating policies so as to<br />
obtain benefits from the activities of the entity. This<br />
power exists where <strong>Rotorua</strong> <strong>District</strong> <strong>Council</strong> controls<br />
the majority voting power on the governing body<br />
or where such policies have been irreversibly<br />
predetermined of such policies is unable to<br />
materially impact the level of potential ownership<br />
benefits that arise from the activities of the<br />
subsidiary.<br />
Subsidiaries are fully consolidated from the date on<br />
which control is transferred to the group. They are<br />
de-consolidated from the date that control<br />
ceases.<br />
Notes to the financial statements<br />
The Minister of Commerce has approved a new<br />
Accounting Standards Framework (incorporating a<br />
Tier Strategy) developed by the External <strong>Report</strong>ing<br />
Board (XRB). Under this Accounting Standards<br />
Framework, the <strong>Council</strong> is classified as a Tier 1<br />
reporting entity and it will be required to apply full<br />
Public Benefit Entity Accounting Standards (PAS).<br />
These standards are being developed by the XRB<br />
based on current international Public Sector<br />
Accounting Standards. The effective date for the<br />
new standards for public sector entities is<br />
expected to be for reporting periods beginning on<br />
or after 1 July 2014. This means <strong>Council</strong> expects to<br />
transition to the new standards in preparing its 30<br />
June 2015 financial statements. As the PAS are still<br />
under development, the <strong>Council</strong> is unable to<br />
assess the implications of the new Accounting<br />
Standards Framework at this time.<br />
Due to the change in the Accounting Standards<br />
Framework for public benefit entities, it is expected<br />
that all new NZ IFRS and amendments to existing<br />
NZ IFRS will not be applicable to public benefit<br />
entities. Therefore, the XRB has effectively frozen<br />
the financial reporting requirements for public<br />
benefit entities up until the new Accounting<br />
Standard Framework is effective. Accordingly, no<br />
disclosure has been made about new or am<strong>ended</strong><br />
NZ IFRS that exclude public benefit entities from<br />
their scope.<br />
Significant accounting policies<br />
Basis of consolidation<br />
The consolidated financial statements are<br />
prepared by adding together like items of assets,<br />
liabilities, equity, and income and expenses on a<br />
line-by-line basis. All significant intragroup<br />
balances, transactions, income and expenses are<br />
eliminated on consolidation.<br />
The consideration transferred in an acquisition of a<br />
subsidiary reflects the fair value of the assets<br />
transferred by the acquirer and liabilities incurred<br />
by the acquirer to the former owner.<br />
The <strong>Council</strong> will recognised goodwill where there is<br />
an excess of the consideration transferred over the<br />
net identifiable assets acquired and liabilities<br />
assumed. This difference reflects the goodwill be<br />
recognised by the <strong>Council</strong>. If the consideration<br />
transferred is lower than the net fair value of the<br />
<strong>Council</strong>’s interest in the identifiable assets acquired<br />
and liabilities assumed, the difference will be<br />
recognised immediately in the surplus or deficit.<br />
Associates<br />
The council accounts for investments in associates<br />
using the equity method. An associate is an entity<br />
over which the council has significant influence<br />
and that is neither a subsidiary nor an interest in a<br />
joint venture. The investment in the associate is<br />
initially recognised at cost and the carrying<br />
amount in the groups financial statements is<br />
increased or decreased to recognise the groups<br />
share of the surplus or deficit of the associate after<br />
the date of acquisition. Distributions received from<br />
an associate reduce the carrying amount of the<br />
investment.<br />
If the share of deficits of an associate equals or<br />
exceeds its interest in the associate, the group<br />
discontinues recognising its share of further deficits.<br />
After the groups interest is reduced to zero,<br />
additional deficits are provided for, and a liability is<br />
recognised, only to the extent that the council has<br />
incurred legal or constructive obligations or made<br />
payments on behalf of the associate. If the<br />
associate subsequently reports surpluses, the group<br />
will resume recognising its share of those surpluses<br />
only after its share of the surpluses equals the share<br />
of deficits not recognised.<br />
Where the group transacts with an associate,<br />
surplus or deficits are eliminated to the extent of<br />
the groups interest in the relevant associate.<br />
<strong>Rotorua</strong> <strong>District</strong> <strong>Council</strong> ANNUAL REPORT 2011/12<br />
127
Notes to the financial statements<br />
Dilutions gains or losses arising from investments in<br />
associates are recognised in the surplus or deficit.<br />
The investments in the associates is carried at cost<br />
in the council’s parent entity financial statements.<br />
Joint venture<br />
A joint venture is a contractual arrangement<br />
whereby two or more parties undertake an<br />
economic activity that is subject to joint control.<br />
For jointly controlled operations, the <strong>Council</strong> and<br />
group recognises in its financial statements the<br />
assets it controls, the liabilities and expenses it<br />
incurs, and the share of income that it earns from<br />
the joint venture.<br />
Revenue<br />
Revenue is measured at the fair value of<br />
consideration received or receivable.<br />
Rates revenue<br />
Rates are set annually by a resolution from <strong>Council</strong><br />
and relate to a financial <strong>year</strong>. All ratepayers are<br />
invoiced within the financial <strong>year</strong> to which the<br />
rates have been set. Rates revenue is recognised<br />
when payable.<br />
Rates collected on behalf of Bay of Plenty<br />
Regional <strong>Council</strong> (BOPRC) are not recognised in<br />
the financial statements as <strong>Rotorua</strong> <strong>District</strong> <strong>Council</strong><br />
is acting as an agent for BOPRC.<br />
Revenue from water rates by meter is recognised<br />
on an accrual basis. Unbilled usage, as a result of<br />
unread meters at <strong>year</strong> end, is accrued on an<br />
average usage basis.<br />
Government grants<br />
Government grants are received from the New<br />
Zealand Land Transport Agency, which subsidises<br />
part of the costs in maintaining the local roading<br />
infrastructure. The subsidies are recognised as<br />
revenue upon entitlement as conditions pertaining<br />
to eligible expenditure have been fulfilled.<br />
Provision of services<br />
Revenue from the rendering of services is<br />
recognised by reference to the stage of<br />
completion of the transaction at balance date,<br />
based on the actual service provided as a<br />
percentage of the total services to be provided.<br />
Vested assets<br />
Where a physical asset is acquired for nil or<br />
nominal consideration, the fair value of the asset<br />
received is recognised as revenue. Assets vested in<br />
the council are recognised as revenue when<br />
control over the asset is obtained.<br />
Sale of goods<br />
Sales of goods are recognised when a product is<br />
sold to the customer.<br />
Traffic and parking infringements<br />
Revenue from traffic and parking infringements are<br />
recognised when payment of the ticket is<br />
received.<br />
Interest and dividends<br />
Interest income is recognised using the effective<br />
interest method. Interest on an impaired financial<br />
asset is recognised using the original effective<br />
interest rate.<br />
Dividends are recognised when the right to<br />
receive payment has been established.<br />
Development contributions<br />
Development and financial contributions are<br />
recognised as revenue when the council provides,<br />
or is able to provide, the service for which the<br />
contribution was charged. Otherwise<br />
development and financial contributions are<br />
recognised as liabilities until such time the council<br />
provides, or is able to provide, the service.<br />
Development contributions are classified as part of<br />
“Other revenue”.<br />
Construction contracts<br />
Contract revenue and contract costs are<br />
recognised as revenue and expenses respectively<br />
by reference to the stage of completion of the<br />
contract at balance date. The stage of<br />
completion is measured by reference to the<br />
contract costs incurred up to the balance date as<br />
a percentage of total estimated costs for each<br />
contract.<br />
Contract costs include all costs directly related to<br />
specific contracts, costs that are specifically<br />
chargeable to the customer under the terms of the<br />
contract and an allocation of overhead expenses<br />
incurred in connection with the group’s<br />
construction activities in general.<br />
An expected loss on construction contracts is<br />
recognised immediately as an expense in the<br />
surplus or deficit.<br />
Where the outcome of a contract cannot be<br />
reliably estimated, contract costs are recognised<br />
as an expense as incurred. Where it is probable<br />
that the costs will be recovered, revenue is<br />
recognised to the extent of costs incurred.<br />
Construction work in progress is stated at the<br />
aggregate of contract costs incurred to date plus<br />
recognised profits less recognised losses and<br />
progress billings. If there are contracts where<br />
progress billings exceed the aggregate costs<br />
128 <strong>Rotorua</strong> <strong>District</strong> <strong>Council</strong> ANNUAL REPORT 2011/12
incurred plus profit less losses, the net amounts are<br />
presented as a liability.<br />
Borrowing costs<br />
The council and group has elected to defer the<br />
adoption of NZ IAS 23 Borrowing Costs (Revised<br />
2007) in accordance with its transitional provisions<br />
that are applicable to public benefit entities.<br />
Consequently, all borrowing costs are recognised<br />
as an expense in the period in which they are<br />
incurred.<br />
Grant expenditure<br />
Non-discretionary grants are those grants that are<br />
awarded if the grant application meets the<br />
specified criteria and are recognised as<br />
expenditure when an application that meets the<br />
specified criteria for the grant has been received.<br />
Discretionary grants are those grants where the<br />
<strong>Council</strong> has no obligation to award on receipt of<br />
the grant application and are recognised as<br />
expenditure when approved by <strong>Council</strong> and the<br />
approval has been communicated to the<br />
applicant.<br />
at balance date. The measurement of deferred<br />
tax reflects the tax consequences that would<br />
follow from the manner in which the group expects<br />
to recover or settle the carrying amount of its<br />
assets and liabilities.<br />
Deferred tax liabilities are generally recognised for<br />
all taxable temporary differences. Deferred tax<br />
assets are recognised to the extent that it is<br />
probable that taxable profits will be available<br />
against which the deductible temporary<br />
differences or tax losses can be utilised.<br />
Deferred tax is not recognised if the temporary<br />
difference arises from the initial recognition of<br />
goodwill or from the initial recognition of an asset<br />
and liability in a transaction that is not a business<br />
combination, and at the time of the transaction,<br />
affects neither accounting surplus nor taxable<br />
surplus.<br />
Current tax and deferred tax is recognised against<br />
the surplus or deficit for the period, except to the<br />
extent that it relates to a business combination, or<br />
to transactions recognised in other comprehensive<br />
income or directly in equity.<br />
Leases<br />
Notes to the financial statements<br />
Foreign currency transactions<br />
Foreign currency transactions (including those for<br />
which forward foreign exchange contracts are<br />
held) are translated into the functional currency<br />
using the exchange rates prevailing at the dates of<br />
the transactions. Foreign exchange gains and<br />
losses resulting from the settlement of such<br />
transactions and from the translation at <strong>year</strong> end<br />
exchange rates of monetary assets and liabilities<br />
denominated in foreign currencies are recognised<br />
in the surplus or deficit.<br />
Income tax<br />
Income tax expense includes current tax and<br />
deferred tax.<br />
Current tax is the amount of income tax payable<br />
based on the taxable surplus for the current <strong>year</strong>,<br />
plus any adjustments to income tax payable in<br />
respect of prior <strong>year</strong>s. Current tax is calculated<br />
using tax rates (and tax laws) that have been<br />
enacted or substantially enacted at balance<br />
date.<br />
Deferred tax is the amount of income tax payable<br />
or recoverable in future periods in respect of<br />
temporary differences and unused tax losses.<br />
Temporary differences are differences between<br />
the carrying amount of assets and liabilities in the<br />
financial statements and the corresponding tax<br />
bases used in the computation of taxable surplus.<br />
Deferred tax is measured at the tax rates that are<br />
expected to apply when the asset is realised or the<br />
liability is settled, based on tax rates (and tax laws)<br />
that have been enacted or substantially enacted<br />
Finance leases<br />
A finance lease is a lease that transfers to the<br />
lessee substantially all the risks and rewards<br />
incidental to ownership of an asset, whether or not<br />
title is eventually transferred.<br />
At the commencement of the lease term, the<br />
council recognises finance leases as assets and<br />
liabilities in the statement of financial position at<br />
the lower of the fair value of the leased item or the<br />
present value of the minimum lease payments.<br />
The finance charge is charged to the surplus or<br />
deficit over the lease period so as to produce a<br />
constant periodic rate of interest on the remaining<br />
balance of the liability.<br />
The amount recognised as an asset is depreciated<br />
over its useful life. If there is no certainty as to<br />
whether the council will obtain ownership at the<br />
end of the lease term, the asset is fully depreciated<br />
over the shorter of the lease term and its useful life.<br />
Currently <strong>Council</strong> holds no finance leases.<br />
Operating leases<br />
An operating lease is a lease that does not transfer<br />
substantially all the risks and rewards incidental to<br />
ownership of an asset. Lease payments under an<br />
operating lease are recognised as an expense on<br />
a straight-line basis over the lease term.<br />
Cash and cash equivalents<br />
Cash and cash equivalents includes cash in hand,<br />
deposits held at call with banks, other short-term<br />
<strong>Rotorua</strong> <strong>District</strong> <strong>Council</strong> ANNUAL REPORT 2011/12<br />
129
Notes to the financial statements<br />
highly liquid investments with original maturities of<br />
three months or less, and bank overdrafts.<br />
Bank overdrafts are shown within borrowings in<br />
current liabilities in the statement of financial<br />
position.<br />
Trade and other receivables<br />
Short-term debtors and other receivables are<br />
recorded at their face value, less any provision for<br />
impairment.<br />
Impairment of a receivable is established when<br />
there is objective evidence that the <strong>Council</strong> will<br />
not be able to collect amounts due according to<br />
the original terms of the receivable. Significant<br />
financial difficulties of the debtor, probability that<br />
the debtor will enter into bankruptcy, receivership<br />
or liquidation, and default in payments are<br />
considered indicators that the debt is impaired.<br />
The amount of the impairment is the difference<br />
between the asset’s carrying amount and the<br />
present value of estimated future cash flows,<br />
discounted using the original effective interest rate.<br />
The carrying amount of the asset is reduced<br />
through the use of an allowance account, and the<br />
amount of the loss is recognised in the surplus or<br />
deficit. When the receivable is uncollectible, it is<br />
written off against the allowance account for<br />
receivables. Overdue receivables that have been<br />
renegotiated are reclassified as current (that is, not<br />
past due).<br />
Derivative financial instruments and hedge<br />
accounting.<br />
between hedging instruments and hedged items,<br />
as well as its risk management objective and<br />
strategy for undertaking various hedge<br />
transactions. The <strong>Council</strong> and group also<br />
documents its assessment, both at hedge<br />
inception and on an ongoing basis, of whether the<br />
derivatives that are used in hedging transactions<br />
are highly effective in offsetting changes in fair<br />
value or cash flows of hedged items.<br />
The full fair value of hedging derivatives is classified<br />
as non-current if the remaining item of the hedged<br />
item is more than 12 months and as current if the<br />
remaining maturity of the hedged item is less than<br />
12 months.<br />
The full value of a non-hedge accounted foreign<br />
exchange derivative is classified as current if the<br />
contract is due for settlement within 12 months of<br />
balance date: otherwise, foreign exchange<br />
derivatives are classified as non current. The<br />
portion of the fair value of a non-hedge<br />
accounted interest rate derivative that is expected<br />
to be realised within 12 months of the balance<br />
date is classified as current, with the remaining<br />
portion of the derivative classified as non current.<br />
Fair value hedge<br />
The gain or loss from remeasuring the hedging<br />
instrument at fair value, along with the changes in<br />
the fair value on the hedged item attributable to<br />
the hedged risk, is recognised in the statement of<br />
other comprehensive income. Fair value hedge<br />
accounting is only applied for hedging fixed<br />
interest borrowings.<br />
Derivative financial instruments are used to<br />
manage exposure to foreign exchange and<br />
interest rate risks arising from financing activities. In<br />
accordance with its treasury policy, the council<br />
does not hold or issue derivative financial<br />
instruments for trading purposes.<br />
Derivatives are initially recognised at fair value on<br />
the date a derivative contract is entered into and<br />
are subsequently remeasured at their fair value at<br />
each balance date. The method of recognising<br />
the resulting gain or loss depends on whether the<br />
derivative is designated as a hedging instrument,<br />
and if so, the nature of the item being hedged.<br />
The associated gains or losses of derivatives that<br />
are not hedge accounted are recognised in the<br />
surplus or deficit.<br />
The <strong>Council</strong> and group designates certain<br />
derivatives as either:<br />
• Hedges of the fair value of recognised assets or<br />
liabilities or a firm commitment (fair value<br />
hedge); or<br />
• Hedges of highly probably forecast transactions<br />
(cashflow hedge).<br />
The council and group documents at the<br />
inception of the transaction the relationship<br />
If the hedge no longer meets the criteria for hedge<br />
accounting, the adjustment to the carrying<br />
amount of a hedged item for which the effective<br />
interest method is used is amortised to surplus or<br />
deficit over the period to maturity.<br />
Cash flow hedge<br />
The portion of the gain or loss on a hedging<br />
instrument that is determined to be an effective<br />
hedge is recognised directly in other<br />
comprehensive income and the ineffective portion<br />
of the gain or loss on the hedging instrument is<br />
recognised in the surplus or deficit as part of<br />
“gains” or “finance costs”.<br />
If a hedge of a forecast transaction subsequently<br />
results in the recognition of a financial asset or a<br />
financial liability, the associated gains or losses that<br />
were recognised directly in other comprehensive<br />
income will be reclassified into the surplus deficit in<br />
the same period or periods during which the asset<br />
acquired or liability assumed affects surplus or<br />
deficit. However, if it is expected that all or a<br />
portion of a loss recognised directly in other<br />
comprehensive income will not be recovered in<br />
one or more future periods, the amount that is not<br />
expected to be recovered is reclassified to the<br />
surplus deficit.<br />
130 <strong>Rotorua</strong> <strong>District</strong> <strong>Council</strong> ANNUAL REPORT 2011/12
When a hedge of a forecast transaction<br />
subsequently results in the recognition of a nonfinancial<br />
asset or a non-financial liability, or a<br />
forecast transaction for a non-financial asset or<br />
non-financial liability becomes a firm commitment<br />
for which fair value hedge accounting is applied,<br />
then the associated gains and losses that were<br />
recognised directly in other comprehensive<br />
income will be included in the initial cost or<br />
carrying amount of the asset or liability.<br />
If a hedging instrument expires or is sold,<br />
terminated, exercised or revoked, or it no longer<br />
meets the criteria for hedge accounting, the<br />
cumulative gain or loss on the hedging instrument<br />
that remains recognised directly in other<br />
comprehensive income from the period when the<br />
hedge was effective will remain separately<br />
recognised in other comprehensive income until<br />
the forecast transaction occurs. When the<br />
forecast transaction is no longer expected to<br />
occur, any related cumulative gain or loss on the<br />
hedging instrument that has been recognised in<br />
other comprehensive income from the period<br />
when the hedge was effective is reclassified from<br />
other comprehensive income to the surplus or<br />
deficit.<br />
Other financial assets<br />
acquired principally for the purpose of selling in the<br />
short term or it is part of a portfolio of identified<br />
financial instruments that are managed together<br />
and for which there is evidence of short term profit<br />
taking. Derivatives are also categorised as held for<br />
trading unless they are designated into hedge<br />
accounting relationship for which hedge<br />
accounting is applied.<br />
Financial assets acquired principally for the<br />
purpose of selling in the short-term or it is part of a<br />
portfolio classified as held for trading are classified<br />
as current assets. The current/non current<br />
classification of derivatives is explained in the<br />
derivatives accounting policy as above.<br />
After initial recognition, financial assets in this<br />
category are measured at their fair values with<br />
gains or losses on remeasurement recognised in<br />
the surplus or deficit.<br />
Loans and receivables<br />
Loans and receivables are non-derivative financial<br />
assets with fixed or determinable payments that<br />
are not quoted in an active market. They are<br />
included in current assets, except for maturities<br />
greater than 12 months after the balance date,<br />
which are included in non-current assets.<br />
Notes to the financial statements<br />
Financial assets and liabilities are initially measured<br />
at fair value plus transaction costs unless they are<br />
carried at fair value through surplus deficit, in<br />
which case the transaction costs are recognised in<br />
the surplus deficit.<br />
Purchases and sales of financial assets are<br />
recognised on trade-date, the date on which the<br />
council and group commits to purchase or sell the<br />
asset. Financial assets are derecognised when the<br />
rights to receive cash flows from the financial<br />
assets have expired or have been transferred and<br />
the council and group has transferred substantially<br />
all the risks and rewards of ownership.<br />
Financial assets are classified into four categories:<br />
• financial assets at fair value through surplus or<br />
deficit;<br />
• loans and receivables<br />
• held to maturity investments; and<br />
• fair value through other comprehensive<br />
income.<br />
The classification depends on the purpose for<br />
which the investments were acquired.<br />
Management determines the classification of its<br />
investments at initial recognition and re-evaluates<br />
this designation at every reporting date.<br />
Financial assets at fair value through surplus or<br />
deficit<br />
Financial Assets at fair value through surplus or<br />
deficit include financial assets held for trading. A<br />
financial asset is classified in this category if<br />
After initial recognition they are measured at<br />
amortised cost using the effective interest method.<br />
Gains and losses when the asset is impaired or<br />
derecognised are recognised in the surplus deficit.<br />
Loans to community organisations made at nil or<br />
below-market interest rates are initially recognised<br />
at the present value of their expected future cash<br />
flows, discounted at the current market rate of<br />
return for a similar financial instrument. The loans<br />
are subsequently measured at amortised cost<br />
using the effective interest method. The difference<br />
between the face value and present value of<br />
expected future cash flows of the loan is<br />
recognised in the surplus deficit as a grant.<br />
Held to maturity investments<br />
Held to maturity investments are non-derivative<br />
financial assets with fixed or determinable<br />
payments and fixed maturities that <strong>Council</strong> has the<br />
positive intention and ability to hold to maturity.<br />
They are included in current assets, except for<br />
maturities greater than 12 months after balance<br />
date, which are included in non-current assets.<br />
After initial recognition they are measured at<br />
amortised cost, using the effective interest<br />
method, less impairment. Gains and losses when<br />
the asset is impaired or derecognised are<br />
recognised in the surplus or deficit.<br />
Currently <strong>Council</strong> does not hold any financial<br />
assets in this category.<br />
<strong>Rotorua</strong> <strong>District</strong> <strong>Council</strong> ANNUAL REPORT 2011/12<br />
131
Notes to the financial statements<br />
Financial assets at fair value through other<br />
comprehensive income<br />
Financial assets at fair value through other<br />
comprehensive income are those that are<br />
designated as fair value through other<br />
comprehensive income or are not classified in any<br />
of the other categories above. They are included<br />
in non-current assets unless management intends<br />
to dispose of the investment within 12 months of<br />
the balance date. The council and group includes<br />
in this category:<br />
• Investments that <strong>Council</strong> intends to hold longterm<br />
but which may be realised before<br />
maturity; and<br />
• Shareholdings that it holds for strategic<br />
purposes.<br />
These investments are measured at their fair value,<br />
with gains and losses recognised directly in other<br />
comprehensive income, except for impairment<br />
losses, which are recognised in the surplus or<br />
deficit.<br />
On derecognition the cumulative gain or loss<br />
previously recognised in other comprehensive<br />
income is reclassified from equity to the surplus or<br />
deficit.<br />
Impairment of financial assets<br />
Financial assets are assessed for objective<br />
evidence of impairment at each balance date.<br />
Impairment losses are recognised in the surplus or<br />
deficit.<br />
Loans and other receivables, and held to maturity<br />
investments.<br />
Impairment is established when there is objective<br />
evidence that the council and group will not be<br />
able to collect amounts due according to the<br />
original terms of the debt. Significant financial<br />
difficulties of the debtor, probability that the<br />
debtor will enter into bankruptcy, and default in<br />
payments are considered indicators that the asset<br />
is impaired. The amount of the impairment is the<br />
difference between the assets carrying amount<br />
and the present value of estimated future cash<br />
flows, discounted using the effective interest rate.<br />
For debtors and other receivables, the carrying<br />
amount of the asset is reduced through the use of<br />
an allowance account, and the amount of the loss<br />
is recognised in the surplus or deficit. When the<br />
receivable is uncollectible, it is written off against<br />
the allowance account. Overdue receivables that<br />
have been renegotiated are reclassified as current<br />
(that is not past due). Impairment in term deposits,<br />
local authority stock, government stock and<br />
community loans, are recognised directly against<br />
the instruments carrying amount.<br />
Financial assets at fair value through other<br />
comprehensive income.<br />
For financial assets at fair value through other<br />
comprehensive income, a significant or prolonged<br />
decline in the fair value of the investment below its<br />
cost is considered objective evidence of<br />
impairment.<br />
For debt instruments, significant financial difficulties<br />
of the debtor, probability that the debtor will enter<br />
into bankruptcy, and default in payments are<br />
considered objective indicators that the asset is<br />
impaired.<br />
If impairment evidence exists for investments at fair<br />
value through other comprehensive income, the<br />
cumulative loss (measured as the difference<br />
between the acquisition cost and the current fair<br />
value, less any impairment loss on that financial<br />
asset previously recognised in the surplus or deficit)<br />
recognised in other comprehensive income is<br />
reclassified from equity to surplus or deficit.<br />
Equity instrument impairment losses recognised in<br />
the surplus or deficit are not reversed through the<br />
surplus or deficit.<br />
If in a subsequent period the fair value of a debt<br />
instrument increases and the increase can be<br />
objectively related to an event occurring after the<br />
impairment loss was recognised, the impairment<br />
loss is reversed in the surplus or deficit.<br />
Inventories<br />
Inventories held for distribution or consumption in<br />
the provision of services that are not supplied on a<br />
commercial basis are measured at the lower of<br />
cost, adjusted when applicable, for any loss of<br />
service potential. Where inventories are acquired<br />
at no cost or for nominal consideration, the cost is<br />
the current replacement cost at the date of<br />
acquisition.<br />
Inventories held for use in the production of goods<br />
and services on a commercial basis are valued at<br />
the lower of cost and net realisable value. The<br />
cost of purchased inventory is determined using<br />
the average cost method.<br />
The amount of any write-down for the loss of<br />
service potential from cost to net realisable value is<br />
recognised in the surplus or deficit in the period of<br />
the write down.<br />
When land held for development and future resale<br />
is transferred from investment property/property,<br />
plant, and equipment to inventory, the fair value<br />
of the land at the date of transfer is its deemed<br />
cost.<br />
Cost directly attributable to the developed land<br />
are capitalised to inventory, with the exception of<br />
infrastructural asset costs which are capitalised to<br />
property, plant, and equipment.<br />
132 <strong>Rotorua</strong> <strong>District</strong> <strong>Council</strong> ANNUAL REPORT 2011/12
Non-current assets held for sale<br />
Non-current assets held for sale are classified as<br />
held for sale if their carrying amount will be<br />
recovered principally through a sale transaction,<br />
not through continuing use. Non-current assets<br />
held for sale are measured at the lower of their<br />
carrying amount and fair value less costs to sell.<br />
Any impairment losses for write-downs of noncurrent<br />
assets held for sale are recognised in the<br />
surplus or deficit.<br />
Any increase in fair value (less costs to sell) are<br />
recognised up to the level of any impairment<br />
losses that have been previously recognised.<br />
Non-current assets (including those that are part of<br />
a disposal group) are not depreciated or<br />
amortised while they are classified as held for sale.<br />
The net revaluation results are credited or debited<br />
to an asset revaluation reserve in equity for that<br />
class of asset. Where this result is a debit balance in<br />
the asset revaluation reserve, this balance is not<br />
recognised in other comprehensive income but is<br />
recognised in the surplus or deficit. Any subsequent<br />
increase on revaluation that reverses a previous<br />
decrease in value recognised in the surplus or<br />
deficit will be recognised first in the surplus or<br />
deficit up to the amount previously expensed, and<br />
then recognised in other comprehensive income.<br />
Additions<br />
The cost of an item of property, plant and<br />
equipment is recognised as an asset if, and only if,<br />
it is probable that future economic benefits or<br />
service potential associated with the item will flow<br />
to the council and group and the cost of the item<br />
can be measured reliably.<br />
Notes to the financial statements<br />
Property, plant and equipment<br />
Property, plant and equipment consist of;<br />
Operational assets – These include land, buildings,<br />
landfill post closure, library books, plant and<br />
equipment and motor vehicles.<br />
Restricted Assets - Restricted assets are parks and<br />
reserves owned by the council and group which<br />
provide a benefit or service to the community and<br />
cannot be disposed of because of legal or other<br />
restrictions.<br />
Infrastructure assets – Infrastructure assets are the<br />
fixed utility systems owned by <strong>Council</strong> and group.<br />
Each class includes all items that are required for<br />
the network to function, for example, sewer<br />
reticulation includes reticulation piping and sewer<br />
pump stations.<br />
Property, plant and equipment is shown at cost or<br />
valuation, less accumulated depreciation and<br />
impairment losses.<br />
Revaluations<br />
<strong>Council</strong> accounts for revaluations of property,<br />
plant and equipment on a class of asset basis.<br />
Land and buildings (operational and restricted),<br />
library books, and infrastructural assets (except<br />
land under roads) are revalued with sufficient<br />
regularity to ensure that their carrying amount<br />
does not differ materially from fair value and at<br />
least every three <strong>year</strong>s. All other assets are carried<br />
depreciated historical cost.<br />
The carrying values of revalued assets are assessed<br />
annually to ensure that they do not differ materially<br />
from the assets’ fair values. If there is a material<br />
difference, the off-cycle assets are revalued.<br />
Revaluations of property, plant and equipment are<br />
accounted for on a class-of-asset basis.<br />
Work in progress is recognised at cost less<br />
impairment and is not depreciated.<br />
Property, plant and equipment is recognised at its<br />
cost. Where an asset is acquired at no cost, or for<br />
a nominal cost, it is recognised at fair value as at<br />
the date of acquisition.<br />
Disposals<br />
Gains and losses on disposals are determined by<br />
comparing the proceeds with the carrying amount<br />
of the asset. Gains and losses on disposals are<br />
reported net in the surplus or deficit. When<br />
revalued assets are sold, the amounts included in<br />
asset revaluation reserves in respect of those assets<br />
are transferred to accumulated funds.<br />
Depreciation<br />
Depreciation is provided on all fixed assets with<br />
certain exceptions. The exceptions are:<br />
• Land is not depreciated.<br />
• Roading, wastewater reticulation, stormwater<br />
systems and water reticulation assets are<br />
depreciated as noted below. A number of the<br />
components of the roading network such as<br />
excavation, sub-base materials and<br />
compaction are not depreciated as these<br />
assets have an infinite life. Signs and markings<br />
are not depreciated as these assets are<br />
maintained to the same level.<br />
• The useful lives of the <strong>Rotorua</strong> Museum<br />
collections and the library reference collection<br />
are considered to be extremely long. Therefore,<br />
due to its insignificance, no depreciation has<br />
been brought to charge.<br />
All other assets are depreciated on a straight-line<br />
basis at rates that will write off their cost or<br />
valuation over their expected useful economic<br />
lives.<br />
Vehicles are depreciated on the basis of<br />
diminishing value and at a rate of 20% calculated<br />
<strong>Rotorua</strong> <strong>District</strong> <strong>Council</strong> ANNUAL REPORT 2011/12<br />
133
Notes to the financial statements<br />
to allocate the motor vehicles cost over their<br />
estimated useful lives.<br />
The expected lives of major classes of assets are:<br />
General<br />
Bathhouse building<br />
40 <strong>year</strong>s<br />
Buildings (other)<br />
50 <strong>year</strong>s<br />
Plant and Equipment<br />
10 to 15 <strong>year</strong>s<br />
Computer Systems<br />
3 to 5 <strong>year</strong>s<br />
Library Books (excl Reference) 2 to 15 <strong>year</strong>s<br />
Landfill Improvements<br />
3 to 100 <strong>year</strong>s<br />
Fencing and Related Structures 15 <strong>year</strong>s<br />
Playgrounds<br />
25 <strong>year</strong>s<br />
Jetties and Related Structures 20 <strong>year</strong>s<br />
Wastewater Reticulation<br />
Man holes<br />
Treatment Plant<br />
Pump Stations<br />
Pipes<br />
Water Reticulation<br />
Pipes<br />
Motors/Pumps<br />
Reservoirs and other<br />
Water-Retaining Structures<br />
Meters<br />
110 <strong>year</strong>s<br />
10 to 100 <strong>year</strong>s<br />
10 to 75 <strong>year</strong>s<br />
100 <strong>year</strong>s<br />
50 to 90 <strong>year</strong>s<br />
20 to 30 <strong>year</strong>s<br />
50 to 100 <strong>year</strong>s<br />
15 to 100 <strong>year</strong>s<br />
Intangible assets<br />
Software acquisition and development<br />
Acquired computer software licenses are<br />
capitalised on the basis of the costs incurred to<br />
acquire and bring to use the specific software.<br />
Costs that are directly associated with the<br />
development of software for internal use are<br />
recognised as an intangible asset. Direct costs<br />
include the software development employee costs<br />
and an appropriate portion of relevant overheads.<br />
Staff training costs are recognised in the surplus<br />
deficit when incurred.<br />
Costs associated with maintaining computer<br />
software are recognised as an expense when<br />
incurred.<br />
Easements<br />
Easements are recognised at cost, being the costs<br />
directly attributable in bringing the asset to its<br />
int<strong>ended</strong> use. Easements have an indefinite useful<br />
life and are not amortised, but are instead tested<br />
for impairment annually.<br />
Roading<br />
Pavement (basecourse)<br />
Drainage<br />
Shoulders/Feathers<br />
Culverts<br />
Footpaths (concrete)<br />
Footpaths (bitumen)<br />
Bridges<br />
20 to 100 <strong>year</strong>s<br />
100 <strong>year</strong>s<br />
20 to 100 <strong>year</strong>s<br />
100 <strong>year</strong>s<br />
100 <strong>year</strong>s<br />
10 to 15 <strong>year</strong>s<br />
70 to 100 <strong>year</strong>s<br />
Stormwater systems<br />
Pipes<br />
70 to 100 <strong>year</strong>s<br />
Manholes, Cesspits<br />
70 to 100 <strong>year</strong>s<br />
Service connections and outlets 70 to 100 <strong>year</strong>s<br />
Airport<br />
Runway 150mm AC surface<br />
10 to 15 <strong>year</strong>s<br />
The residual value and useful life of an asset is<br />
reviewed, and adjusted if applicable, at each<br />
financial <strong>year</strong>-end.<br />
Subsequent costs<br />
Costs incurrent subsequent to initial acquisition are<br />
capitalised only when it is probable that future<br />
economic benefits or service potential associated<br />
with the item will flow to the <strong>Council</strong> and the cost<br />
of the item can be measured reliably.<br />
The costs of day-to-day servicing of property,<br />
plant, and equipment are recognised in the surplus<br />
or deficit as they are incurred.<br />
No impairment losses have been recognised for<br />
easements, as the carrying amount of the assets<br />
has been assessed as less than their replacement<br />
costs.<br />
Amortisation<br />
The carrying value of an intangible asset with a<br />
finite life is amortised on a straight-line basis over its<br />
useful life. Amortisation begins when the asset is<br />
available for use and ceases at the date that the<br />
asset is derecognised. The amortisation charge for<br />
each period is recognised in the surplus or deficit.<br />
The useful lives and associated amortisation rates<br />
of major classes of intangible assets have been<br />
estimated as follows:<br />
Computer software 3-5 <strong>year</strong>s 20-33%<br />
Emission allowances<br />
Emission Allowances are recorded as an intangible<br />
asset and are initially recognised at cost. For<br />
allocations of emission allowances granted by the<br />
Government, cost is deemed to be equal to fair<br />
value at the date of allocation. Allowances are<br />
subsequently held at cost less any accumulated<br />
amortisation and any accumulated losses.<br />
Any difference between the carrying value and<br />
the residual value is amortised over the useful life of<br />
the asset.<br />
134 <strong>Rotorua</strong> <strong>District</strong> <strong>Council</strong> ANNUAL REPORT 2011/12
Impairment of property, plant and equipment and<br />
intangible assets<br />
Intangible assets that have an indefinite useful life,<br />
or not yet available for use, are not subject to<br />
amortisation and are tested annually for<br />
impairment. Assets that have a finite useful life are<br />
reviewed for indicators of impairment at each<br />
balance date. When there is an indicator of<br />
impairment, the asset’s recoverable amount is<br />
estimated. An impairment loss is recognised for the<br />
amount by which the asset’s carrying amount<br />
exceeds its recoverable amount. The recoverable<br />
amount is the higher of an asset’s fair value less<br />
costs to sell and value in use.<br />
Value in use is depreciated replacement cost for<br />
an asset where the future economic benefits or<br />
service potential of the asset are not primarily<br />
dependent on the assets ability to generate net<br />
cash inflows and where the entity would, if<br />
deprived of the asset, replace it’s remaining future<br />
economic benefits or service potential.<br />
Gains or losses arising on initial recognition of<br />
biological assets at fair value less estimated point<br />
of sale costs and from a change in fair value less<br />
estimated point of sale costs are recognised in the<br />
surplus or deficit.<br />
Forestry maintenance costs are recognised in the<br />
surplus or deficit when incurred.<br />
Investment property<br />
Properties leased to a third parties under operating<br />
leases are classified as investment property unless<br />
the property is held to meet service delivery<br />
objectives, rather than to earn rentals or for capital<br />
appreciation.<br />
Investment property is measure initially at its cost,<br />
including transaction costs.<br />
After initial recognition, all investment property is<br />
measured at fair value as determined annually by<br />
an independent valuer.<br />
Notes to the financial statements<br />
The value in use for cash-generating assets and<br />
cash-generating units is the present value of<br />
expected future cash flows.<br />
If an asset’s carrying amount exceeds its<br />
recoverable amount, the asset is impaired and the<br />
carrying amount is written down to the<br />
recoverable amount. For revalued assets the<br />
impairment loss is recognised against the<br />
revaluation reserve for that class of asset. Where<br />
that results in a debit balance in the revaluation<br />
reserve, the balance is recognised in the surplus or<br />
deficit.<br />
For assets not carried at a revalued amount, the<br />
total impairment loss is recognised in the surplus or<br />
deficit.<br />
The reversal of an impairment loss on a revalued<br />
asset is credited to the revaluation reserve.<br />
However, to the extent that an impairment loss for<br />
that class of asset was previously recognised in the<br />
surplus or deficit, a reversal of the impairment loss is<br />
also recognised in the surplus or deficit.<br />
For assets not carried at a revalued amount (other<br />
than goodwill) the reversal of an impairment loss is<br />
recognised in the surplus or deficit.<br />
Forestry assets<br />
Standing forestry assets are independently<br />
revalued annually at fair value less estimated point<br />
of sale costs for one growth cycle. Fair value is<br />
determined based on the present value of<br />
expected net cash flows discounted at a current<br />
market determined pre-tax rate. This calculation is<br />
based on existing sustainable felling plans and<br />
assessments regarding growth, timber prices, felling<br />
costs and silviculture costs and takes into<br />
consideration environmental, operational, and<br />
market restrictions.<br />
Gains or losses arising from a change in the fair<br />
value of investment property are recognised in the<br />
surplus or deficit.<br />
Currently <strong>Council</strong> holds no assets in this class.<br />
Trade and other payables<br />
Trade and other payables are recorded at their<br />
face value.<br />
Borrowings<br />
Borrowings are initially recognised at their fair value<br />
net of transaction costs incurred. After initial<br />
recognition, all borrowings are measured at<br />
amortised cost using the effective interest method.<br />
Borrowings are classified as current liabilities unless<br />
<strong>Council</strong> or the group has an unconditional right to<br />
defer settlement of the liability for at least 12<br />
months after the balance date. Borrowings where<br />
the <strong>Council</strong> or group has an unconditional right to<br />
defer settlement of the liability for at least 12<br />
months after balance date are classified as current<br />
liabilities if the <strong>Council</strong> or group expects to settle<br />
the liability within 12 months of the balance date.<br />
Employee entitlements<br />
Short-term employee entitlements<br />
Employee benefits expected to be settled within<br />
12 months of balance date are measured at<br />
nominal values based on accrued entitlements at<br />
current rates of pay.<br />
These include salaries and wages accrued up to<br />
balance date, annual leave earned to but not yet<br />
taken at balance date, and sick leave.<br />
A liability for sick leave to the extent that absences<br />
in the coming <strong>year</strong> are expected to be greater<br />
<strong>Rotorua</strong> <strong>District</strong> <strong>Council</strong> ANNUAL REPORT 2011/12<br />
135
Notes to the financial statements<br />
than the sick leave entitlements earned in the<br />
coming <strong>year</strong>. The amount is calculated based on<br />
the unused sick leave entitlement that can be<br />
carried forward at balance date, to the extent<br />
that it will be used by staff to cover those future<br />
absences.<br />
A liability and an expense for bonuses where<br />
contractually obliged or where there is a past<br />
practice that has created a constructive<br />
obligation.<br />
Long-term employee entitlements<br />
Entitlements that are payable beyond 12 months,<br />
after the employee renders the related service,<br />
such as long service leave and retirement<br />
gratuities, have been calculated on an actuarial<br />
basis. The calculations are based on:<br />
• likely future entitlements accruing to staff,<br />
based on <strong>year</strong>s of service, <strong>year</strong>s to entitlement,<br />
the likelihood that staff will reach the point of<br />
entitlement and contractual entitlements<br />
information; and<br />
Provisions<br />
The council recognises a provision for future<br />
expenditure of uncertain amount or timing when<br />
there is a present obligation (either legal or<br />
constructive) as a result of a past event, it is<br />
probable that expenditures will be required to<br />
settle the obligation and a reliable estimate can<br />
be made of the amount of the obligation.<br />
Provisions are measured at the present value of the<br />
expenditures expected to be required to settle the<br />
obligation using a pre-tax discount rate that<br />
reflects current market assessments of the time<br />
value of money and the risks specific to the<br />
obligation. The increase in the provision due to the<br />
passage of time is recognised as an interest<br />
expense and is included in “finance costs”.<br />
Financial guarantee contracts<br />
A financial guarantee contract is a contract that<br />
requires <strong>Council</strong> to make specified payments to<br />
reimburse the holder for a loss it incurs because a<br />
specified debtor fails to make payment when due.<br />
• the present value of the estimated future cash<br />
flows.<br />
Presentation of employee entitlements<br />
Sick leave, annual leave, vested long service<br />
leave, and non-vested long service leave and<br />
retirement gratuities expected to be settled within<br />
12 months of balance date, are classified as a<br />
current liability. All other employee entitlements<br />
are classified as a non-current liability.<br />
Superannuation schemes<br />
Defined contribution schemes<br />
Obligations for contributions to defined<br />
contribution superannuation schemes are<br />
recognised as an expense in the surplus or deficit<br />
as incurred.<br />
Defined benefit schemes<br />
The council belongs to the Defined Benefit Plan<br />
Contributors Scheme (the scheme), which is<br />
managed by the Board of Trustees of the National<br />
Provident Fund. The scheme is a multi-employer<br />
defined benefit scheme.<br />
Insufficient information is available to use defined<br />
benefit accounting, as it is not possible to<br />
determine from the terms of the scheme, to the<br />
extent to which the surplus/deficit will affect future<br />
contributions by individual employers, as there is no<br />
prescribed basis for allocation. The scheme is<br />
therefore accounted for as a defined contribution<br />
scheme. Further information on this scheme is<br />
disclosed in note 20.<br />
Financial guarantee contracts are initially<br />
recognised at fair value, even if a payment under<br />
the guarantee is not considered probable. If a<br />
financial guarantee contract was issued in a<br />
stand-alone arm's length transaction to an<br />
unrelated party, its fair value at inception is equal<br />
to the consideration received. When no<br />
consideration is received a provision is recognised<br />
based on the probability <strong>Council</strong> will be required<br />
to reimburse a holder for a loss incurred,<br />
discounted to present value. The portion of the<br />
guarantee that remains unrecognised, prior to<br />
discounting to fair value, is disclosed as a<br />
contingent liability.<br />
Financial guarantees are subsequently measured<br />
at the initial recognition amount less any<br />
amortisation, however if council assesses that it is<br />
probable that expenditure will be required to settle<br />
a guarantee, then the provision for the guarantee<br />
is measured at the present value of the future<br />
expenditure.<br />
Further information on provisions is disclosed in note<br />
14.<br />
Emission allowances<br />
A provision is recorded in respect of the obligation<br />
to surrender emission allowances and charges are<br />
recognised in the Statement of Comprehensive<br />
Financial Performance in the period in which the<br />
emissions are made. The provision made for the<br />
anticipated emissions requirement is calculated on<br />
the basis of the carrying value of emission<br />
allowances held at the end of the reporting<br />
period. If the obligation is expected to exceed the<br />
amount of held allowances, the provision for the<br />
additional amount is based on the market value of<br />
those allowances at the end of the reporting<br />
period.<br />
136 <strong>Rotorua</strong> <strong>District</strong> <strong>Council</strong> ANNUAL REPORT 2011/12
Equity<br />
Equity is the community’s interest in the <strong>Rotorua</strong><br />
<strong>District</strong> <strong>Council</strong> and is measured as the difference<br />
between total assets and total liabilities. Equity is<br />
disaggregated and classified into a number of<br />
reserves.<br />
The components of equity are:<br />
• Retained earnings<br />
• Self-funding reserves<br />
• <strong>Council</strong> created reserves<br />
• Restricted reserves<br />
• Fair value through equity reserves<br />
• Asset revaluation reserves<br />
Restricted reserves<br />
then it is recognised as part of the related asset or<br />
expense.<br />
The net amount of GST recoverable from, or<br />
payable to, the Inland Revenue Department (IRD)<br />
is included as part of receivables or payables in<br />
the statement of financial position.<br />
The net GST paid to, or received from the IRD,<br />
including the GST relating to investing and<br />
financing activities, is classified as an operating<br />
cash flow in the statement of cash flows.<br />
Commitments and contingencies are disclosed<br />
exclusive of GST.<br />
Budget figures<br />
Notes to the financial statements<br />
Restricted reserves are a component of equity<br />
generally representing a particular use to which<br />
various parts of equity have been assigned.<br />
Reserves may be legally restricted or created by<br />
<strong>Council</strong>.<br />
Restricted reserves are those subject to specific<br />
conditions accepted as binding by <strong>Council</strong> and<br />
which may not be revised by <strong>Council</strong> without<br />
reference to the Courts or a third party. Transfers<br />
from these reserves may be made only for certain<br />
specified purposes or when certain specified<br />
conditions are met.<br />
Also included in restricted reserves are reserves<br />
restricted by <strong>Council</strong> decision. The council may<br />
alter them without references to any third party or<br />
the courts. Transfers to and from these reserves are<br />
at the discretion of the council.<br />
The council’s objectives, policies and processes for<br />
managing capital are described in note 26.<br />
Property revaluation reserves<br />
This reserve relates to the revaluation of property,<br />
plant and equipment to fair value.<br />
Fair value through other comprehensive income<br />
reserves<br />
This reserve comprises the cumulative net change<br />
in the fair value of fair value through other<br />
comprehensive income instruments.<br />
Cash flow hedge reserves<br />
This reserve comprises the effective portion of the<br />
cumulative net change in the fair value of<br />
derivatives designated as cash flow hedges.<br />
Goods and Services Tax (GST)<br />
All items in the financial statements are stated<br />
exclusive of goods and services tax (GST), except<br />
for debtors and other receivables and creditors<br />
and other payables, which are stated on a GSTinclusive<br />
basis. GST not recoverable as input tax<br />
The budget figures are approved by the <strong>Council</strong> in<br />
its <strong>Annual</strong> Plan 2011/12. The budget figures have<br />
been prepared in accordance with NZ GAAP,<br />
using accounting policies that are consistent with<br />
those adopted in preparing of the financial<br />
statements.<br />
Cost allocation<br />
The <strong>Rotorua</strong> <strong>District</strong> <strong>Council</strong> has derived the cost of<br />
service for each significant activity of council using<br />
the cost allocation system outlined below.<br />
Direct costs are those costs directly attributable to<br />
a significant activity. Indirect costs are those costs<br />
which cannot be identified in an economically<br />
feasible manner, with a specific significant activity.<br />
Direct costs are charged directly to significant<br />
activities. Indirect costs are charged to significant<br />
activities using appropriate cost drivers such as<br />
actual usage, staff numbers and floor area.<br />
Critical accounting estimates and assumptions<br />
In preparing these financial statements estimates<br />
and assumptions have been made concerning the<br />
future. Theses estimates and assumptions may<br />
differ from the subsequent actual results. Estimates<br />
and assumptions are continually evaluated and<br />
are based on historical experience and other<br />
factors, including expectations or future events<br />
that are believed to be reasonable under the<br />
circumstances. The estimates and assumptions that<br />
have a significant risk of causing a material<br />
adjustment to the carrying amounts of assets and<br />
liabilities within the next financial <strong>year</strong> are<br />
discussed below:<br />
Landfill after care provision<br />
Note 14 provides information about the estimates<br />
and assumptions surrounding the landfill aftercare<br />
provision.<br />
<strong>Rotorua</strong> <strong>District</strong> <strong>Council</strong> ANNUAL REPORT 2011/12<br />
137
Notes to the financial statements<br />
Infrastructural assets<br />
Note 9 provides information about the estimates<br />
and assumptions applied in determining the fair<br />
value of infrastructural assets.<br />
Critical judgements in applying accounting<br />
policies<br />
Management has exercised the following critical<br />
judgements in applying the <strong>Rotorua</strong> <strong>District</strong><br />
<strong>Council</strong>’s accounting policies for the period <strong>ended</strong><br />
30 June 2012:<br />
Classification of property<br />
The council owns a number of properties, which<br />
are maintained primarily to provide housing to<br />
pensioners. The receipt of market-based rental<br />
from these properties is incidental to holding these<br />
properties. These properties are held for service<br />
delivery objectives as part of the council’s social<br />
housing policy. These properties are held as<br />
property, plant and equipment.<br />
The council owns land which is classified as<br />
property, plant and equipment and currently<br />
leased for farm grazing. This land has been<br />
identified by the council as a potential site for the<br />
development of a new cemetery. The final<br />
decision as to the suitability of the site as a<br />
cemetery is still dependent on the outcomes of<br />
community consultation and resource consent<br />
processes. If the site is not suitable for a cemetery,<br />
then the council will reassess the best use of the<br />
land, which could include commercial leases or<br />
disposal.<br />
The council owns land which is classified as<br />
property, plant and equipment and currently<br />
leased for a motor camp. This land has been<br />
identified by the council as a potential site for the<br />
development of the airport extension. The final<br />
decision as to the suitability of the site for airport<br />
development is still dependent on the airport<br />
operation. If the site is not suitable for airport<br />
development then the council will reassess the<br />
best use of the land, which could include<br />
commercial leases or disposal.<br />
Rounding<br />
Some rounding variances may occur in the<br />
financial statements due to the use of decimal<br />
places in the underlying financial data.<br />
138 <strong>Rotorua</strong> <strong>District</strong> <strong>Council</strong> ANNUAL REPORT 2011/12
2: Performance by council activity<br />
Expenditure<br />
$000<br />
Income<br />
$000<br />
Net cost of service<br />
$000<br />
2012<br />
actual<br />
2012<br />
budget<br />
2011<br />
actual<br />
2012<br />
actual<br />
2012<br />
budget<br />
2011<br />
actual<br />
2012<br />
actual<br />
2012<br />
budget<br />
2011<br />
actual<br />
General rates 0 0 0 34,813 33,616 35,714 34,813 33,616 35,714<br />
Rates write offs 770 874 784 0 0 0 -770 -874 -784<br />
Less rates paid by council -1,611 -1,587 -1,506 -1,611 -1,587 -1,506 0 0 0<br />
-841 -713 -722 33,202 32,029 34,208 34,043 32,742 34,930<br />
Corporate & Customer Services<br />
Group<br />
Community Engagement &<br />
3,830 3,630 3,344 1,098 894 1,053 -2,732 -2,736 -2,291<br />
Support<br />
<strong>District</strong> Library 4,001 4,133 3,889 310 355 368 -3,691 -3,778 -3,521<br />
Emergency Management 657 592 512 18 66 8 -639 -526 -504<br />
Governance & Strategic<br />
5,916 4,874 5,448 1,109 1,061 1,146 -4,807 -3,813 -4,302<br />
Direction<br />
14,404 13,229 13,193 2,535 2,376 2,577 -11,869 -10,853 -10,618<br />
Economic & Regulatory Services<br />
Group<br />
Animal Control 1,089 1,040 866 644 633 560 -445 -407 -306<br />
Building Services 2,724 2,110 2,105 1,506 1,891 1,790 -1,218 -219 -315<br />
City Services Operations 2,823 3,075 2,990 1,448 1,545 1,335 -1,375 -1,530 -1,655<br />
Economic Development 3,771 2,145 2,711 2,286 2,008 1,105 -1,485 -137 -1,606<br />
Environmental Planning<br />
1,785 1,785 1,942 234 344 250 -1,551 -1,441 -1,692<br />
Implementation<br />
Environmental Planning Policy 1,208 1,583 1,249 4 11 1 -1,204 -1,572 -1,248<br />
Events and Venues 7,697 6,655 6,638 4,593 4,894 3,847 -3,104 -1,761 -2,791<br />
Inspection 1,037 1,094 1,311 390 403 342 -647 -691 -969<br />
Parking Enforcement 982 1,033 882 1,503 1,802 1,750 521 769 868<br />
<strong>Rotorua</strong> Museum 3,862 3,954 3,334 1,261 6,811 8,557 -2,601 2,857 5,223<br />
Tourism 5,067 5,700 5,372 4,303 5,058 4,698 -764 -642 -674<br />
32,045 30,173 29,400 18,172 25,400 24,237 -13,873 -4,773 -5,165<br />
Notes to the financial statements<br />
Infrastructure Services Group<br />
Aquatic Facilities 3,134 3,178 3,057 1,085 1,205 1,153 -2,049 -1,973 -1,904<br />
Infrastructural Planning and<br />
610 390 354 1,194 970 1,108 584 580 754<br />
Compliance<br />
Public Gardens and Open<br />
12,449 11,064 10,532 5,135 3,153 3,626 -7,314 -7,911 -6,906<br />
Spaces<br />
<strong>Rotorua</strong> Airport 5,122 5,085 5,761 1,302 768 1,433 -3,820 -4,317 -4,328<br />
Stormwater and Land Drainage 5,411 4,236 6,811 2,313 2,166 306 -3,098 -2,070 -6,505<br />
Transport 26,103 14,976 13,555 18,406 19,635 16,154 -7,697 4,659 2,599<br />
Waste Management 7,878 7,317 7,891 6,005 6,924 5,726 -1,873 -393 -2,165<br />
Wastewater 11,175 11,058 9,717 26,129 19,174 18,371 14,954 8,116 8,654<br />
Water Supplies 8,415 8,061 9,522 7,253 7,583 7,151 -1,162 -478 -2,371<br />
80,297 65,365 67,195 68,822 61,578 55,029 -11,475 -3,787 -12,173<br />
Castlecorp 447 256 356 269 302 320 -178 46 -36<br />
447 256 356 269 302 320 -178 46 -36<br />
Other<br />
Vested assets 0 0 0 0 1,843 0 0 1,843 0<br />
Other non operational income 2 0 1 59 8 33 57 8 32<br />
Other non operational<br />
59 0 -686 0 0 0 -59 0 686<br />
expenditure<br />
Increase/(decrease) in fair value 49 0 17 0 0 0 -49 0 0<br />
of forestry assets<br />
Internal charges in operational -1,511 -1,112 -1,436 -1,511 -1,112 -1,436 0 0 0<br />
expenditure<br />
-1,401 -1,112 -2,104 -1,452 739 -1,403 -51 1,851 718<br />
Total per statement of<br />
comprehensive income<br />
124,951 107,198 107,318 121,548 122,424 114,974 -3,403 15,226 7,656<br />
Each significant activity is stated gross of internal costs and revenues, and includes targeted rates attributable<br />
to activities. In order to fairly reflect the total external operations for the <strong>Council</strong> in the Statement of<br />
comprehensive income, these transactions are eliminated as shown above.<br />
<strong>Rotorua</strong> <strong>District</strong> <strong>Council</strong> ANNUAL REPORT 2011/12<br />
139
Notes to the financial statements<br />
3: Income by category<br />
Rates revenue<br />
<strong>Council</strong><br />
$000<br />
2012<br />
actual<br />
2011<br />
actual<br />
Group<br />
$000<br />
2012<br />
2011 actual<br />
actual<br />
General rates 35,023 36,120 35,023 36,120<br />
Refuse rates 2,111 2,042 2,111 2,042<br />
Sewerage rates 10,853 10,134 10,853 10,134<br />
Water rates (including water by meter) 6,702 6,661 6,633 6,599<br />
Lakes enhancement rate 423 423 423 423<br />
Eastern sewerage capital rates 2,508 1,544 2,508 1,544<br />
Business development targeted rates 5,375 4,695 5,375 4,695<br />
Roading targeted rates 11,007 8,989 11,007 8,989<br />
Urban sewerage development rate 58 58 58 58<br />
Lakes Community Board rate 47 42 47 42<br />
Less rates paid by council -1,611 -1,506 -1,611 -1,506<br />
Less water by meter paid by council -260 -247 -260 -247<br />
Less rate remissions -462 -406 -462 -406<br />
Total rates 71,774 68,548 71,705 68,486<br />
Other revenue<br />
Assets recognised for first time 935 2,198 935 2,198<br />
Dividend 1 0 1 0<br />
Interest - bank and other 102 117 87 91<br />
Vested assets 2,805 379 2,805 379<br />
Other revenue 66 -89 2,055 2,289<br />
Subsidies and grants 20,944 20,277 20,944 20,277<br />
Development contributions 602 708 602 708<br />
Reserve contributions 182 144 182 144<br />
Fees and charges 5,192 5,656 5,192 5,656<br />
Trading revenue 18,945 17,031 18,740 16,864<br />
Total other revenue 49,774 46,421 51,543 48,606<br />
Other gains<br />
Gain on disposal of property, plant and equipment 0 5 0 5<br />
Total other gains 0 5 0 5<br />
121,548 114,974 123,248 117,097<br />
Rates remissions<br />
Rates revenue is shown net of rates remissions. The <strong>Council</strong> Rates remission policies allow rates to be remitted<br />
on condition of a ratepayer’s extreme financial hardship, land used for sport and land protected for historical<br />
or cultural purposes.<br />
Non-rateable land<br />
Under the Local Government (Rating) Act 2002 certain properties cannot be rated for general rates. These<br />
properties include schools, places of religious worship, public gardens and reserves. These non-rateable<br />
properties may be subject to targeted rates in respect of infrastructure services, refuse, and sanitation. Nonrateable<br />
land does not constitute a remission under the <strong>Council</strong>’s rates remission policy.<br />
140 <strong>Rotorua</strong> <strong>District</strong> <strong>Council</strong> ANNUAL REPORT 2011/12
4: Expenditure by category<br />
<strong>Council</strong><br />
$000<br />
2012<br />
actual<br />
2011<br />
actual<br />
Group<br />
$000<br />
2012<br />
actual<br />
2011<br />
actual<br />
Personnel costs<br />
Salaries and wages 32,246 31,569 32,246 31,569<br />
Defined contribution plan employer contributions 909 862 909 862<br />
Increase/(decrease) in employee entitlements 415 325 415 325<br />
Total personnel costs 33,570 32,757 33,570 32,757<br />
Depreciation and amortisation<br />
Depreciation on property, plant and equipment 27,688 25,260 27,888 25,431<br />
Amortisation on intangible assets 594 837 594 837<br />
Total depreciation and amortisation 28,282 26,098 28,482 26,269<br />
Notes to the financial statements<br />
Other expenses<br />
Audit fees for financial statements audit 114 111 137 131<br />
Audit fees for Long-term Plan 86 0 86 0<br />
Audit fees – other 118 22 118 22<br />
Change in rates refund provision 12 -1 12 -1<br />
Elected representatives remuneration 583 572 583 572<br />
Donations 132 152 132 152<br />
Grants and contributions 2,434 2,019 2,434 2,019<br />
Change in impairment of trade and other receivables -37 -192 -37 -192<br />
Loss on revaluation property, plant and equipment 0 2,275 0 2,275<br />
Losses on disposal of assets 1,656 1,939 1,656 1,939<br />
Revaluation reserves in debit 10,541 0 10,541 0<br />
Insurance premiums 1,524 623 1,524 623<br />
Other expenditure 36,564 32,776 37,982 34,653<br />
Research and development 34 66 34 66<br />
Rent and leasing costs 322 304 381 360<br />
Total other expenses 54,083 40,666 55,583 42,618<br />
Finance costs<br />
Discount unwinding 682 108 682 108<br />
Interest on borrowings 8,334 7,689 8,334 7,689<br />
Total finance costs 9,016 7,797 9,016 7,797<br />
124,951 107,318 126,651 109,441<br />
Employee benefit expenses<br />
Employer contributions to defined contribution plans include contributions to Kiwi saver and the Defined<br />
Benefit Plan Contributors Scheme.<br />
<strong>Rotorua</strong> <strong>District</strong> <strong>Council</strong> ANNUAL REPORT 2011/12<br />
141
Notes to the financial statements<br />
5: Taxation<br />
<strong>Council</strong><br />
$000<br />
2012<br />
actual<br />
2011<br />
actual<br />
Group<br />
$000<br />
2012<br />
actual<br />
2011<br />
actual<br />
Components of tax expense<br />
Current tax expense 0 0 0 0<br />
Adjustments to current tax in prior <strong>year</strong>s 0 0 0 0<br />
Deferred tax expense 0 0 0 0<br />
Tax loss not previously recognised 0 0 0 0<br />
Tax expense 0 0 0 0<br />
Relationship between tax expense and accounting profit<br />
Net surplus before tax -3,403 7,656 -3,345 7,656<br />
Tax at 28% -953 2,297 -937 2,297<br />
Plus (less) tax effect of:<br />
Non-deductible expenditure -247 -3,601 -246 -3,601<br />
Tax loss not recognised 2,231 239 2,218 239<br />
Deferred tax on temporary differences -1,031 1,065 -1,035 1,065<br />
Deferred tax adjustment on change in tax laws 0 0 0 0<br />
Tax loss not previously recognised 0 0 0 0<br />
Prior <strong>year</strong> adjustment 0 0 0 0<br />
Tax expense 0 0 0 0<br />
Deferred tax asset (liability)<br />
Property,<br />
plant and<br />
equipment<br />
$000<br />
Employee<br />
entitlements<br />
$000<br />
Other<br />
provisions<br />
$000<br />
Tax losses<br />
$000<br />
Total<br />
$000<br />
Balance at 30 June 2010 -2,638 0 0 2,638 0<br />
Charged to surplus or deficit -1,096 0 0 1,096 0<br />
Charged to other comprehensive income 0 0 0 0 0<br />
Balance at 30 June 2011 -3,734 0 0 3,734 0<br />
Charged to surplus or deficit 1,031 0 0 -1,031 0<br />
Charged to other comprehensive income 0 0 0 0 0<br />
Balance at 30 June 2012 -2,703 0 0 2,703 0<br />
Imputation credit account<br />
Opening balance 0 0<br />
Tax paid 0 0<br />
Credits attached to dividends paid 0 0<br />
Other adjustments 0 0<br />
Closing balance 0 0<br />
A deferred tax asset has not been recognised in relation to unused tax losses of <strong>Council</strong>: $8,146,321 (2011 $798,302), Group:<br />
$10,873,892 (2011 $3,574,260).<br />
142 <strong>Rotorua</strong> <strong>District</strong> <strong>Council</strong> ANNUAL REPORT 2011/12
6: Cash and cash equivalents<br />
<strong>Council</strong><br />
$000<br />
2012<br />
actual<br />
2011<br />
actual<br />
Group<br />
$000<br />
2012<br />
actual<br />
2011<br />
actual<br />
Cash at bank and in hand 557 977 1,296 861<br />
Short term deposits maturing three months or less from date of<br />
326 796 326 796<br />
acquisition<br />
Total cash and cash equivalents 883 1,774 1,622 1,658<br />
The carrying value of short-term deposits with maturity dates of three months or less approximates their fair<br />
value.<br />
Cash, cash equivalents, and bank overdrafts include the above for the purposes of the Statement of cash<br />
flows.<br />
Notes to the financial statements<br />
7: Debtors and other receivables<br />
<strong>Council</strong><br />
$000<br />
2012<br />
actual<br />
2011<br />
actual<br />
Group<br />
$000<br />
2012<br />
actual<br />
2011<br />
actual<br />
Rates receivables 4,245 4,297 4,245 4,297<br />
Other receivables 16,456 11822 16,670 11,739<br />
Prepayments 471 365 471 365<br />
Community Loans 17 17 17 17<br />
GST Receivable 1,069 2,945 1,069 2,945<br />
Total debtors and other receivables 22,258 19,445 22,472 19,363<br />
Less Provision for impairment of receivables -954 -991 -954 -991<br />
21,304 18,455 21,518 18,372<br />
Less non-current portion<br />
Community loans 17 17 17 17<br />
Total non-current portion 17 17 17 17<br />
Current portion 21,287 18,438 21,501 18,355<br />
Fair Value<br />
Debtors and other receivables are non-interest bearing and receipt is normally on 30-day terms, therefore the<br />
carrying value of debtors and other receivables approximates their fair value.<br />
Impairment<br />
The <strong>Council</strong> does not provide for any impairment on rates receivable as it has various powers under the Local<br />
Government (Rating) Act 2002 to recover any outstanding debts. These powers allow the <strong>Council</strong> to<br />
commence legal proceedings to recover any rates that remain unpaid 4 months after the due date for<br />
payment. If payment has not been made within 3 months of the Court’s judgement, then the <strong>Council</strong> can<br />
apply to the Registrar of the High Court to have the judgement enforced by sale or lease of the rating unit.<br />
Ratepayers can apply for payment plan options in special circumstances. Where such repayment plans are in<br />
place, debts are discounted to their present value of future payments if the effect of discounting is material.<br />
The carrying amount of receivables that would otherwise be past due or impaired and whose terms have<br />
been renegotiated is $nil (2011 $nil).<br />
Community loans<br />
The fair value of community loans is $16,876 (2011 $16,876).<br />
<strong>Rotorua</strong> <strong>District</strong> <strong>Council</strong> ANNUAL REPORT 2011/12<br />
143
Notes to the financial statements<br />
The status of receivables at <strong>year</strong> end is detailed below:<br />
<strong>Council</strong><br />
2012 Gross<br />
$000<br />
2012<br />
Impairment<br />
$000<br />
2012 Nett<br />
$000<br />
2011 Gross<br />
$000<br />
2011<br />
Impairment<br />
$000<br />
2011 Nett<br />
$000<br />
Not past due 16,473 0 16,473 11,322 -131 11,191<br />
Past due 1-60 days 2,345 -30 2,315 2,601 0 2,601<br />
Past due 61-120 days 127 0 127 1,338 0 1,338<br />
Past due > 121 days 3,295 -923 2,372 4,184 -860 3,324<br />
Total 22,240 -953 21,287 19,445 -991 18,455<br />
Group<br />
Not past due 16,687 0 16,687 11,240 -131 11,109<br />
Past due 1-60 days 2,345 -30 2,315 2,601 0 2,601<br />
Past due 61-120 days 127 0 127 1,338 0 1,338<br />
Past due > 121 days 3,295 -923 2,372 4,184 -860 3,324<br />
Total 22,454 -953 21,501 19,363 -991 18,372<br />
The above table records the majority of the <strong>District</strong> Library debtors as over 120 days overdue, as the systems<br />
used are unable to provide more accurate information. Any variance from this recording is of an immaterial<br />
value.<br />
The impairment provision has been calculated based on a review of specific overdue receivables and a<br />
collective assessment. The collective impairment provision is based on an analysis of past collection history<br />
and debt write offs.<br />
<strong>Council</strong><br />
$000<br />
2012<br />
actual<br />
2011<br />
actual<br />
Group<br />
$000<br />
2012<br />
actual<br />
2011<br />
actual<br />
Individual impairment -953 -860 -953 -860<br />
Collective impairment 0 -131 0 -131<br />
Total provision for impairment -953 -991 -953 -991<br />
Individually impaired receivables have been determined to be impaired because of the significant financial<br />
difficulties being experienced by the debtor. An analysis of these individually impaired debtors is as follows:<br />
<strong>Council</strong><br />
$000<br />
2012<br />
actual<br />
2011<br />
actual<br />
Group<br />
$000<br />
2012<br />
actual<br />
2011<br />
actual<br />
Past due 1-60 days -30 0 -30 0<br />
Past due 61-120 days 0 0 0 0<br />
Past due > 121 days -923 -860 -923 -860<br />
Total individual impairment -953 -860 -953 -860<br />
Movements in the provision for impairment of receivables are as follows:<br />
<strong>Council</strong><br />
$000<br />
2012<br />
actual<br />
2011<br />
actual<br />
Group<br />
$000<br />
2012<br />
actual<br />
2011<br />
actual<br />
At 1 July -991 -1,183 -991 -1,183<br />
Additional provisions made during the <strong>year</strong> -37 -192 -37 -192<br />
Receivables written off during the period 75 384 75 384<br />
At 30 June -953 -991 -953 -991<br />
The <strong>Council</strong> and group hold no collateral as security or other credit enhancements over receivables that are<br />
either past due or impaired.<br />
144 <strong>Rotorua</strong> <strong>District</strong> <strong>Council</strong> ANNUAL REPORT 2011/12
8: Inventories<br />
<strong>Council</strong><br />
$000<br />
2012<br />
actual<br />
2011<br />
actual<br />
Group<br />
$000<br />
2012<br />
actual<br />
2011<br />
actual<br />
Inventories held for distribution or consumption in provision of<br />
1,033 1,009 1,033 1,009<br />
services<br />
Inventories held for use in production of goods and services on a<br />
264 336 264 336<br />
commercial basis<br />
Total Inventories 1,297 1,344 1,297 1,344<br />
Water and Sewerage reticulation spare parts 267 267 267 267<br />
Street Furniture 14 14 14 14<br />
Nursery Store 688 670 688 670<br />
Vehicle workshop & fuel 19 7 19 7<br />
Other Inventories held for distribution 46 51 46 51<br />
Museum retail stock 101 126 101 126<br />
Solid waste refuse bags 118 174 118 174<br />
Other commercial inventory 44 36 44 36<br />
Total Inventories 1,297 1,344 1,297 1,345<br />
Notes to the financial statements<br />
The carrying amount of inventories pledged as security for liabilities is $nil (2011 $nil).<br />
Held for distribution inventory<br />
The carrying amount of inventory held for distribution that are measured at current replacement cost as at 30<br />
June 2012 amounted to $nil (2011 $nil).<br />
The write down of inventory held for distribution that are measured at current replacement cost as at 30 June<br />
2012 amounted to $nil (2011 $nil). There have been no reversals of write-downs (2011 $nil).<br />
The loss in service potential of inventory held for distribution is determined on the basis of obsolescence.<br />
Commercial inventory<br />
The write-down of commercial inventory to net realisable value amounted to $nil (2011 $nil). There have been<br />
no reversals of write downs (2011 $nil).<br />
<strong>Rotorua</strong> <strong>District</strong> <strong>Council</strong> ANNUAL REPORT 2011/12<br />
145
Notes to the financial statements<br />
9: Property, plant and equipment<br />
2012 Classification<br />
Cost / revaluation<br />
1 July 2011<br />
$000<br />
Accumulated<br />
depreciation and<br />
impairment<br />
changes<br />
1 July 2011<br />
$000<br />
Carrying amount<br />
1 July 2011<br />
$000<br />
Current <strong>year</strong><br />
additions<br />
$000<br />
Current <strong>year</strong><br />
disposals<br />
$000<br />
Current <strong>year</strong><br />
impairment<br />
charges<br />
$000<br />
Current <strong>year</strong><br />
depreciation<br />
$000<br />
Airport 50,684 -1,510 49,174 1,251 -8 0 -1,034<br />
Art collections 6,008 -30 5,978 71 -29 0 -5<br />
Bridges 14,549 -831 13,718 125 0 0 -265<br />
Buildings 139,165 -8,747 130,418 3,340 0 0 -5,068<br />
Computer equipment 4,891 -3,594 1,297 563 -2,919 0 -589<br />
Footpaths 24,932 -1,475 23,457 544 0 0 -258<br />
Furniture and fittings 6,134 -4,578 1,556 12 -2,629 0 -238<br />
General works assets 1,052 -496 556 0 -347 0 -67<br />
Land 137,108 0 137,108 4,311 -670 0 0<br />
Landfill 9,669 -4,441 5,228 461 0 0 -687<br />
Library collection 3,037 -332 2,705 535 0 0 -407<br />
Motor vehicles 8,165 -4,344 3,821 904 -834 0 -813<br />
Office equipment 1,596 -1,438 158 0 -958 0 -75<br />
Parking infrastructural assets 496 -38 458 0 0 0 -39<br />
Parks and reserves 26,484 -1,816 24,668 1,139 -44 0 -1,231<br />
Plant and machinery 9,885 -5,705 4,180 753 -2,026 0 -620<br />
Transport management 250,899 -10,728 240,168 11,505 0 0 -6,982<br />
Stormwater drainage 109,400 -2,163 107,237 1,290 -324 0 -2,102<br />
Street lighting, signs, signals 6,657 -1,371 5,286 270 0 0 -256<br />
Waste management (bin sites) 725 -31 694 15 0 0 0<br />
Wastewater reticulation 149,461 -2,890 146,571 13,228 -119 0 -2,281<br />
Wastewater treatment plant 46,187 -4,635 41,552 4,389 -430 0 -1,633<br />
Waterworks pipes, meters 101,157 -6,990 94,167 3,646 -2,260 0 -3,098<br />
1,108,341 -68,183 1,040,155 48,352 -13,597 0 -27,748<br />
RRAL'S property, plant and<br />
equipment<br />
Building chattels 56 -10 46 12 0 0 -3<br />
Furniture and fittings 153 -88 65 0 0 0 -13<br />
Plant and equipment 819 -352 467 58 -11 0 -80<br />
Motor vehicles 494 -191 303 3 0 0 -57<br />
Computer equipment 73 -37 36 8 -6 0 -6<br />
Total RRAL's property, plant and<br />
equipment<br />
1,595 -678 917 81 -17 0 -159<br />
Total group property, plant and<br />
equipment<br />
1,109,936 -68,861 1,041,078 48,433 - 13,614 0 -27,907<br />
146 <strong>Rotorua</strong> <strong>District</strong> <strong>Council</strong> ANNUAL REPORT 2011/12
2012 Classification<br />
Revaluation<br />
surplus<br />
$000<br />
Other cost<br />
movements<br />
$000<br />
Depreciation<br />
writeback<br />
$000<br />
Cost /<br />
revaluation<br />
30 June 2012<br />
$000<br />
Accumulated<br />
depreciation<br />
and impairment<br />
changes<br />
30 June 2012<br />
$000<br />
Carrying amount<br />
30 June 2012<br />
$000<br />
Airport 0 0 6 51,927 -2,538 49,389<br />
Art collections 0 0 0 6,050 -35 6,015<br />
Bridges 693 -1,155 831 14,212 -265 13,947<br />
Buildings -19,004 2,963 8,747 126,464 -5,068 121,396<br />
Computer equipment 0 -213 2,816 2,322 -1,367 955<br />
Footpaths -9,572 -785 1,476 15,119 -257 14,862<br />
Furniture and fittings 0 -58 2,551 3,459 -2,265 1,194<br />
General works assets 0 0 236 705 -327 378<br />
Land -12,286 -1,182 0 127,281 0 127,281<br />
Landfill 3,084 -76 4,438 13,138 -690 12,448<br />
Library collection 0 0 0 3,572 -739 2,833<br />
Motor vehicles 0 0 642 8,235 -4,515 3,720<br />
Office equipment 0 0 932 638 -581 57<br />
Parking infrastructural assets 0 0 0 496 -77 419<br />
Parks and reserves 0 448 -17 28,027 -3,064 24,963<br />
Plant and machinery 0 -22 1,830 8,590 -4,495 4,095<br />
Transport management -6,533 -7,039 10,596 248,832 -7,114 241,715<br />
Stormwater drainage 0 128 4 110,494 -4,261 106,233<br />
Street lighting, signs, signals -1,236 -448 1,371 5,243 -256 4,987<br />
Waste management (bin sites) 0 -648 31 92 0 92<br />
Wastewater reticulation -2,902 -280 1,173 159,388 -3,998 155,390<br />
Wastewater treatment plant -3,105 -3,131 4,613 43,910 -1,655 42,255<br />
Waterworks pipes, meters 0 311 1,375 102,854 -8,713 94,141<br />
Notes to the financial statements<br />
-50,861 -11,187 43,651 1,081,048 -52,280 1,028,756<br />
RRAL'S property, plant and<br />
equipment<br />
Building chattels 0 0 0 68 -13 55<br />
Furniture and fittings 0 0 0 153 -101 52<br />
Plant and equipment 0 0 0 866 -421 445<br />
Motor vehicles 0 0 0 497 -248 249<br />
Computer equipment 0 0 0 75 -43 32<br />
Total RRAL's property, plant and<br />
equipment<br />
0 0 0 1,659 -826 833<br />
Total group property, plant and<br />
equipment<br />
-50,861 -11,187 43,651 1,082,707 -53,106 1,029,589<br />
* Restricted assets are assets that cannot be disposed of because of legal or other restrictions.<br />
** Fair value: <strong>Council</strong> considers the fair value of Land and buildings to be the book value of these assets.<br />
<strong>Rotorua</strong> <strong>District</strong> <strong>Council</strong> ANNUAL REPORT 2011/12<br />
147
Notes to the financial statements<br />
2011 Classification<br />
Cost / revaluation<br />
1 July 2010<br />
$000<br />
Accumulated<br />
depreciation and<br />
impairment<br />
changes<br />
1 July 2010<br />
$000<br />
Carrying amount<br />
1 July 2010<br />
$000<br />
Current <strong>year</strong><br />
additions<br />
$000<br />
Current <strong>year</strong><br />
disposals<br />
$000<br />
Current <strong>year</strong><br />
impairment<br />
charges<br />
$000<br />
Current <strong>year</strong><br />
depreciation<br />
$000<br />
Airport 0 0 0 3,775 -1,199 0 -803<br />
Art collections 5,775 -27 5,748 234 0 0 -4<br />
Bridges 14,549 -555 13,994 0 0 0 -276<br />
Buildings 138,011 -4,763 133,248 11,402 -70 0 -4,381<br />
City Focus 230 -117 113 0 0 0 0<br />
Computer equipment 4,561 -3,268 1,293 757 -1 0 -752<br />
Environmental 2 -1 1 0 0 0 0<br />
Footpaths 24,751 -985 23,766 181 0 0 -490<br />
Furniture and fittings 5,960 -4,341 1,619 202 0 0 -264<br />
General works assets 1,031 -417 614 43 0 0 -96<br />
Land 51,848 0 51,848 1,926 -129 0 0<br />
Land restricted* 95,346 0 95,346 0 0 0 0<br />
Landfill 7,935 -3,248 4,687 1,730 0 0 -1,195<br />
Library collection 3,608 -1,112 2,496 374 0 0 -331<br />
Motor vehicles 7,967 -4,277 3,690 1,238 -312 0 -795<br />
Office equipment 1,748 -1,422 326 2 -32 0 -138<br />
Parking infrastructural assets 744 -162 582 34 0 0 -39<br />
Parks, roads, paths,<br />
playgrounds, utilities<br />
23,503 -2,952 20,551 2,265 -161 0 -1,231<br />
Plant and machinery 9,005 -5,324 3,681 1,117 -18 0 -600<br />
Roading assets excluding land 201,283 -7,233 194,050 8,450 0 0 -3,590<br />
Roads and road reserves land 42,449 0 42,449 0 0 0 0<br />
Runway, taxiway, apron 24,661 -232 24,429 0 0 0 0<br />
Stormwater drainage 64,811 -2,242 62,569 1,196 -2,372 0 -2,163<br />
Street lighting, signs, signals 6,296 -970 5,326 225 0 0 -313<br />
Waste management (bin sites) 776 -22 754 0 -50 0 -10<br />
Wastewater reticulation 137,056 -3,901 133,155 11,415 -41 0 -2,120<br />
Wastewater treatment plant 39,718 -3,160 36,558 6,809 0 0 -1,476<br />
Waterworks pipes, meters 97,599 -2,957 94,642 4,320 -820 0 -4,193<br />
Total council's property, plant<br />
and equipment<br />
1,011,224 -53,688 957,535 57,695 -5,205 0 -25,260<br />
RRAL's property, plant and<br />
equipment<br />
Buildings chattels 44 -7 37 12 0 0 -3<br />
Furniture and fittings 143 -75 68 10 0 0 -13<br />
Plant and equipment 757 -277 480 62 -11 0 -75<br />
Motor vehicles 494 -134 360 0 0 0 -57<br />
Computer equipment 42 -30 12 31 0 0 -7<br />
Total RRAL's property, plant and<br />
equipment<br />
1,480 -523 957 115 -11 0 -155<br />
Total group property, plant and<br />
equipment<br />
1,012,704 -54,211 958,492 57,810 -5,216 0 -25,415<br />
148 <strong>Rotorua</strong> <strong>District</strong> <strong>Council</strong> ANNUAL REPORT 2011/12
2011 Classification<br />
Revaluation<br />
surplus<br />
$000<br />
Other<br />
movements $000<br />
Other cost<br />
adjustments<br />
$000<br />
Other<br />
Accumulated<br />
depreciation<br />
$000<br />
Other adjustment<br />
$000<br />
Cost /<br />
revaluation<br />
30 June 2011<br />
$000<br />
Accumulated<br />
depreciation and<br />
impairment<br />
changes<br />
30 June 2011<br />
$000<br />
Carrying amount<br />
30 June 2011<br />
$000<br />
Airport 0 47,401 707 -707 0 50,684 -1,510 49,174<br />
Art collections 0 0 -1 1 0 6,008 -30 5,978<br />
Bridges 0 0 0 0 0 14,549 -831 13,718<br />
Buildings 0 -9,781 436 397 -833 139,998 -8,747 130,418<br />
City Focus 0 -113 -117 117 0 0 0 0<br />
Computer equipment 0 0 -426 426 0 4,891 -3,594 1,297<br />
Environmental 0 -1 -1 1 0 0 0 0<br />
Footpaths 0 0 0 0 0 24,932 -1,475 23,457<br />
Furniture and fittings 0 -1 -27 27 0 6,134 -4,578 1,556<br />
General works assets 0 -5 -17 17 0 1,052 -496 556<br />
Land 0 -11,882 -1 0 1 41,762 0 41,762<br />
Land restricted* 0 0 0 0 0 95,346 0 95,346<br />
Landfill 0 5 -1 2 -1 9,669 -4,441 5,228<br />
Library collection 165 0 -1,110 1,111 -1 3,037 -332 2,705<br />
Motor vehicles 0 0 -728 728 0 8,165 -4,344 3,821<br />
Office equipment 0 0 -122 122 0 1,596 -1,438 158<br />
Parking infrastructural assets -119 0 -163 163 0 496 -38 458<br />
Parks, roads, paths,<br />
playgrounds, utilities<br />
3,174 70 -2,367 2,367 0 26,484 -1,816 24,668<br />
Plant and machinery 0 0 -219 219 0 9,885 -5,705 4,180<br />
Roading assets excluding land 0 -1,188 -95 95 0 208,450 -10,728 197,722<br />
Roads and road reserves land 0 0 0 0 0 42,449 0 42,449<br />
Runway, taxiway, apron 0 -24,429 -232 232 0 0 0 0<br />
Stormwater drainage 48,011 -4 -2,242 2,242 0 109,400 -2,163 107,237<br />
Street lighting, signs, signals 0 48 88 -88 0 6,657 -1,371 5,286<br />
Waste management (bin sites) 0 0 -1 1 0 725 -31 694<br />
Wastewater reticulation 3,822 340 -3,131 3,131 -1 149,461 -2,890 146,571<br />
Wastewater treatment plant 0 -340 0 1 0 46,187 -4,635 41,552<br />
Waterworks pipes, meters 0 218 -160 160 0 101,157 -6,990 94,167<br />
Notes to the financial statements<br />
Total council's property, plant<br />
and equipment<br />
55,053 338 -9,931 -10,765 -833 1,109,174 -68,183 1,040,155<br />
RRAL's property, plant and<br />
equipment<br />
Buildings chattels 0 0 0 0 0 56 -10 46<br />
Furniture and fittings 0 0 0 0 0 153 -88 65<br />
Plant and equipment 0 11 0 0 0 819 -352 467<br />
Motor vehicles 0 0 0 0 0 494 -191 303<br />
Computer equipment 0 0 0 0 0 73 -37 36<br />
Total RRAL's property, plant and<br />
equipment<br />
0 11 0 0 0 1,595 -678 917<br />
Total group property, plant and<br />
equipment<br />
55,053 349 -9,931 -10,765 -833 1,110,769 -68,861 1,041,078<br />
* Restricted Assets are assets that cannot be disposed of because of legal or other restrictions.<br />
** Fair Value: <strong>Council</strong> considers the Fair Value of Land & Buildings to be the book value of these assets<br />
<strong>Rotorua</strong> <strong>District</strong> <strong>Council</strong> ANNUAL REPORT 2011/12<br />
149
Notes to the financial statements<br />
Valuation<br />
Land (operational, restricted, and infrastructural)<br />
Land is valued at fair value using market-based evidence based on its highest and best use with reference to<br />
comparable land values. Adjustments have been made to the “unencumbered” land value where there is a<br />
designation against the land or the use of the land is restricted because of reserve or endowment status.<br />
These adjustments are int<strong>ended</strong> to reflect the negative effect on the value of the land where an owner is<br />
unable to use the land more intensely.<br />
The fair value of and is reviewed at three <strong>year</strong>ly intervals. The most recent valuation was performed by<br />
independent valuers Darroch Valuations. The valuation is effective as at 1 July 2011.<br />
Buildings (operational and restricted)<br />
Specialised buildings are valued at fair value using the depreciated replacement cost method because no<br />
reliable market data is available for such buildings.<br />
Depreciated replacement cost is determined using a number of significant assumptions including:<br />
• the replacement asset is based on the reproduction cost of the specific asset with adjustments where<br />
appropriate for obsolescence due to over-design or surplus capacity.<br />
• the replacement cost is derived from recent construction contracts of similar assets and Property Institute of<br />
New Zealand cost information.<br />
• the remaining useful life of assets is estimated.<br />
• straight line depreciation has been applied in determining the depreciated replacement cost value of the<br />
asset.<br />
Non specialised buildings (for example, residential buildings) are valued at fair value using market-based<br />
evidence. Market rents and capitalisation rates were applied to reflect market value.<br />
The fair value of buildings is reviewed at three <strong>year</strong>ly intervals. The most recent valuation was performed by<br />
independent valuers Darroch Valuations. Tthe valuation is effective as at 1 July 2011.<br />
Infrastructural asset classes: Water, wastewater, stormwater and land drainage, and roading network<br />
Water, wastewater, stormwater and land drainage, and roading network infrastructural assets are valued<br />
using the depreciated replacement cost method. There are a number of estimates and assumptions<br />
exercised when valuing infrastructural assets using this method. These include:<br />
• Estimating any obsolescence or surplus capacity of the assets.<br />
• Estimating the replacement cost of the asset. The replacement cost is derived from recent construction<br />
contracts in the region for similar assets.<br />
• Estimates of the remaining useful life over which the asset will be depreciated. These estimates can be<br />
affected by the local conditions. For example, weather patterns and traffic growth. If useful lives do not<br />
reflect the actual consumption of the benefits of the asset, then the <strong>Council</strong> could be over-or-underestimating<br />
the annual depreciation charge recognised as an expense in the Statement of comprehensive<br />
income. To minimise this risk, infrastructural asset lives have been determined with reference to the NZ<br />
Infrastructural Asset Valuation and Depreciation Guidelines published by the National Asset Management<br />
Steering Group, and have been adjusted for local conditions based on past experience. Asset inspections,<br />
deterioration, and condition-modelling are also carried out regularly as part of asset management<br />
planning activities, which provides further assurance over useful life estimates.<br />
The fair value of infrastructural assets will be revised at three <strong>year</strong>ly ‘rolling’ intervals. The most recent<br />
valuations are performed by <strong>Council</strong> engineers and are peer reviewed by independent valuers Beca<br />
Valuation Services Limited. The effective dates of these valuations are:<br />
• Water reticulation system: 1 July 2011<br />
• Wastewater system: 1 July 2010<br />
• Stormwater and land drainage system: 1 July 2010<br />
• Roading network: 1 July 2011<br />
• Parks and reserves assets: 1 July 2010<br />
Land under roads<br />
On transition to NZ IFRS <strong>Council</strong> elected to use the fair value of land under roads as deemed cost. Land under<br />
roads is no longer valued.<br />
150 <strong>Rotorua</strong> <strong>District</strong> <strong>Council</strong> ANNUAL REPORT 2011/12
Library collections<br />
Library collections are valued at depreciated replacement cost in accordance with the guidelines released in<br />
2002 by the New Zealand Library Association and the National Library. Library valuations are performed by<br />
<strong>Council</strong>’s library staff, and are subject to independent review by Barbara Whitton, an Associate and<br />
Registered member of LIANZA. The last valuation was effective as at 1 July 2010.<br />
Airport assets<br />
The airport land, buildings and runway are valued at fair value using market based evidence, depreciated<br />
replacement cost, market rents and capitalisation rates where applicable.<br />
The fair value of the airport land, buildings and runway were valued as at 1 July 2009 by independent valuers<br />
Cleghorn Gillespie Jensen Limited and the valuation is effective as at 1 July 2009.<br />
Impairment<br />
Impairment losses of $nil (2011 $nil) have been recognised in the Statement of comprehensive income.<br />
Notes to the financial statements<br />
Work in progress<br />
The total amount of property, plant and equipment in the course of construction is $30.438 million (2011<br />
$59.366 million).<br />
Leasing<br />
The net carrying amount of plant and equipment held under finance leases is $nil (2010 $nil).<br />
10: Intangible assets<br />
2012<br />
actual<br />
<strong>Council</strong><br />
$000<br />
2011<br />
actual<br />
Group<br />
$000<br />
2012<br />
actual<br />
2011<br />
actual<br />
Balance at 1 July<br />
Cost 7,977 7,339 8,054 7,410<br />
Accumulated amortisation and impairment -4,209 -3,312 -4,244 -3,330<br />
Opening carrying amount 3,768 4,027 3,810 4,080<br />
Year <strong>ended</strong> 30 June<br />
Additions 458 738 535 743<br />
Disposals -4,985 - 99 -4,985 - 99<br />
Amortisation charges - 532 - 837 - 566 - 854<br />
Accumulated amortisation written back 3,844 99 3,844 99<br />
Other movements 251 - 160 251 - 160<br />
Total movements during the <strong>year</strong> -964 - 259 -921 - 271<br />
Balance at 30 June<br />
Cost 4,552 7,977 4,706 8,054<br />
Accumulated amortisation and impairment -1,748 -4,209 -1,817 -4,244<br />
Closing carrying amount 2,804 3,768 2,889 3,810<br />
Easements<br />
<strong>Council</strong> owns numerous easements which give the right to access private property where infrastructural assets<br />
are located. However the cost of providing information about the value of the easements outweighs the<br />
benefits and therefore the value has not been calculated.<br />
There are no restrictions over the title of intangible assets. No intangible assets are pledged as security for<br />
liabilities.<br />
All software is acquired externally.<br />
<strong>Rotorua</strong> <strong>District</strong> <strong>Council</strong> ANNUAL REPORT 2011/12<br />
151
Notes to the financial statements<br />
11: Biological assets (forestry)<br />
<strong>Council</strong><br />
$000<br />
2012<br />
actual<br />
2011<br />
actual<br />
Group<br />
$000<br />
2012<br />
actual<br />
2011<br />
actual<br />
Balance at 1 July 458 316 458 316<br />
Increases due to asset recognised for the first time 935 0 935 0<br />
Gains/(losses) arising from changes in fair value less estimated point -163 141 -163 141<br />
of sale costs<br />
Decreases due to sales 0 0 0 0<br />
Decreases due to harvest 0 0 0 0<br />
Balance at 30 June 1,230 458 1,230 458<br />
The <strong>Council</strong> owns five forestry stands located at:<br />
• Tutukau Road – this stand measures 10 hectares of Pinus Radiata forest with a current age of 27 <strong>year</strong>s.<br />
• Near the <strong>Rotorua</strong> Landfill that measures 14 hectares of Pinus Radiata forest with a current age of 27 <strong>year</strong>s.<br />
• Great West Road spring reserve measures 2.5 hectares of Pinus Radiata forest with a current age of<br />
approximately 30 <strong>year</strong>s.<br />
• Hill Road spring reserve measures 1.6 hectares of Pinus Radiata forest with a current age of 28 <strong>year</strong>s.<br />
• Reservoir Road spring reserve measures 7.6 hectares of Pinus Radiata forest with a current age of 10 <strong>year</strong>s.<br />
Independent valuers Prime Forest Management Limited have valued forestry assets as at 30 June 2012. The<br />
following significant valuation assumptions have been adopted in determining the fair value of forestry assets:<br />
• a discount rate of 8% (2011: 8%) has been used in discounting the present value of expected cash flows<br />
• notional land rental costs have been included for freehold land<br />
• forests have been valued on a going concern basis and only includes the value of the existing crops on a<br />
single rotation basis<br />
• no allowance for inflation has been provided<br />
• costs are current average costs. No allowance has been made for cost improvements in future operations<br />
• log prices are based on three-<strong>year</strong> historical rolling averages<br />
Financial risk management strategies<br />
The <strong>Council</strong> is exposed to financial risks arising from changes in timber prices. The <strong>Council</strong> is a long-term<br />
forestry investor and does not expect timber prices to decline significantly in the foreseeable future. Therefore,<br />
no measures have been taken to manage the risk of a decline in timber prices. The <strong>Council</strong> and group review<br />
its outlook for timber prices regularly in considering the need for active financial risk management.<br />
Tokorangi Forest (Redwood Forest)<br />
In 1993 the Crown Forest License for the Tokorangi Forest (Redwood Forest) was transferred to <strong>Council</strong> from the<br />
Crown in recognition of the significant recreation resource with the valuable aesthetic and landscape<br />
features that the forest represents for the people of <strong>Rotorua</strong>, as well as its national and international visitors.<br />
There are covenants in place that restrict the licence to this effect. The majority of the forest will therefore not<br />
be managed commercially.<br />
The land on which the forest grows is in the process of being transferred from the Crown to the new Central<br />
North Island Iwi Collective. <strong>Council</strong> has the licence to continue managing the forest for the next thirty five<br />
<strong>year</strong>s.<br />
152 <strong>Rotorua</strong> <strong>District</strong> <strong>Council</strong> ANNUAL REPORT 2011/12
12: Other financial assets<br />
Non-current portion %<br />
holding<br />
Investments carried at fair<br />
value through<br />
comprehensive income<br />
Unlisted shares NZ Local Govt<br />
Insurance Corporation Ltd<br />
Unlisted shares Waikato Local<br />
Authority Shared Services<br />
Ltd (LASS)<br />
Unlisted shares BOP Local<br />
Authority Shared Services<br />
Ltd (BOP LASS)<br />
Shares<br />
held<br />
Country of<br />
incorporation<br />
<strong>Council</strong><br />
$000<br />
2012<br />
actual<br />
2011<br />
actual<br />
Group<br />
$000<br />
2012<br />
actual<br />
2011<br />
actual<br />
2.8 87,953 New Zealand 167 213 167 213<br />
8.3 1 New Zealand 203 252 203 252<br />
11.11 1 New Zealand -7 29 -7 29<br />
Notes to the financial statements<br />
Investments carried at cost<br />
less impairment losses<br />
Unlisted shares <strong>Rotorua</strong><br />
Regional Airport Limited<br />
100 1,000 New Zealand 1784 1726 0 0<br />
Total non-current portion 2,147 2,220 363 493<br />
Total Other financial assets 2,147 2,220 363 493<br />
Fair value<br />
Unlisted shares<br />
The fair value of the unlisted shares of NZ Local Government Insurance Corporation Limited and of Local<br />
Authority Shared Services Limited (LASS) has been approximated by using the net asset backing method.<br />
The LASS share investment comprises:<br />
• 1 ordinary share<br />
• 126,703 Shared Valuation Database shares<br />
• 7,516 WRAP service shares, which are uncalled as at balance date<br />
The service shares are non-voting and do not carry the right to share in any distributions of the company.<br />
The BOP LASS share investment comprises 1 ordinary share. The fair value of the BOP LASS, approximated using<br />
the net asset backing method, is $(6,954) (2011 $28,501).<br />
The cost price of the share investment in the subsidiary <strong>Rotorua</strong> Regional Airport Limited amounts to $2,051,000.<br />
The recoverable amount is approximated by using the net asset backing method and amounts to $1,784,051<br />
(2011 -$1,726,000). The surplus for the <strong>year</strong> of $57,655, (2011 -$200,031) is recognised in the Statement of<br />
comprehensive income.<br />
<strong>Council</strong> is also the 100% shareholder in two dormant non-operational companies – <strong>Rotorua</strong> <strong>District</strong> <strong>Council</strong><br />
Holdings Ltd and Grow <strong>Rotorua</strong> Ltd.<br />
Impairment<br />
There were no impairment expenses or provisions for other financial assets. None of the financial assets are<br />
either past due or impaired.<br />
<strong>Rotorua</strong> <strong>District</strong> <strong>Council</strong> ANNUAL REPORT 2011/12<br />
153
Notes to the financial statements<br />
13: Creditors and other payables<br />
<strong>Council</strong><br />
$000<br />
2012<br />
actual<br />
2011<br />
actual<br />
Group<br />
$000<br />
2012<br />
actual<br />
2011<br />
actual<br />
Trade payables 15,783 19,759 15,868 18,791<br />
Other payables 221 112 221 112<br />
Deposits and bonds 1,021 1,309 1,021 1,309<br />
Rates, fees and grants received in advance 3,431 3,552 3,431 3,552<br />
Accrued interest 1,891 2,116 1,891 2,116<br />
Total Creditors and other payables 22,347 26,848 22,432 25,880<br />
Creditors and other payables are non-interest bearing and normally settled on 30-day terms, therefore the<br />
carrying value of creditors and other payables approximates their fair value.<br />
14: Provisions<br />
<strong>Council</strong><br />
$000<br />
2012<br />
actual<br />
2011<br />
actual<br />
Group<br />
$000<br />
2012<br />
actual<br />
2011<br />
actual<br />
Current Provisions are represented by<br />
Weathertightness claims 1,005 470 1,005 470<br />
Landfill aftercare provision 20 20 20 20<br />
Prov. Grants not yet uplifted 103 92 103 92<br />
Total current provisions 1,128 582 1,128 582<br />
Non-current provisions are represented by<br />
Landfill aftercare provision 2,574 1,892 2,574 1,892<br />
Provision for refund of rates 104 92 104 92<br />
Total non-current provisions 2,678 1,984 2,678 1,984<br />
Movements for each class of provision are as follows:<br />
<strong>Council</strong> and group<br />
$000<br />
2012<br />
Weathertightness<br />
claims<br />
Landfill<br />
aftercare<br />
Refund of<br />
rates<br />
Grants not<br />
yet uplifted<br />
Opening balance 470 1,912 92 92<br />
Additional provisions made during the <strong>year</strong> 0 0 0 11<br />
Amounts used during the <strong>year</strong> 535 0 12 0<br />
Discount unwinding 0 682 0 0<br />
Balance at 30 June 2012 1,005 2,594 104 103<br />
2011<br />
Opening balance 490 1,805 93 0<br />
Additional provisions made during the <strong>year</strong> 0 0 0 92<br />
Amounts used during the <strong>year</strong> -20 0 -1 0<br />
Discount unwinding 0 108 0 0<br />
Balance at 30 June 2011 470 1,913 92 92<br />
Weathertightness claims<br />
Eight claims have been lodged with the Weathertight Homes Resolutions Service (WHRS) as at 30 June 2012<br />
(2011: five). These claims relate to weathertightness issues of homes in the <strong>Rotorua</strong> area and name the<br />
<strong>Council</strong> as well as other parties. A provision for these claims has been established based on actuarial<br />
assessment of claims based on historical average claim levels and other information held. The <strong>Council</strong> has<br />
insurance in place to cover the provision recognised and has recognised a related receivable of $nil (2011<br />
$nil) is presented as part of debtors and other receivables in note 6.<br />
154 <strong>Rotorua</strong> <strong>District</strong> <strong>Council</strong> ANNUAL REPORT 2011/12
Landfill aftercare costs<br />
<strong>Council</strong> has resource consent to operate the <strong>Rotorua</strong> Landfill. The <strong>Council</strong> has responsibility under the<br />
resource consent to provide ongoing maintenance and monitoring of the landfill after the site is closed.<br />
The management of the landfill will influence the timing of recognition of some liabilities. The current landfill<br />
will gain increased capacity in two stages. A liability relating to stage one will only be created when this stage<br />
is commissioned and when refuse begins to accumulate in this stage.<br />
• The current remaining capacity of the site is 730,000 cubic metres, increasing up to 2.360 million cubic<br />
metres at stage two (refuse, clean fill and cover).<br />
• The estimated remaining life (including stages one and two development) is 46 <strong>year</strong>s.<br />
• Estimates of the life have been made by <strong>Council</strong>'s engineers based on historical and projected volume<br />
information.<br />
The cash out flows for the landfill post-closure are expected to occur in about fifteen <strong>year</strong>’s time. The longterm<br />
nature of the liability means that there are inherent uncertainties in estimating costs that will be incurred.<br />
The provision has been estimated taking into account existing technology and using a discount rate of 7%.<br />
Notes to the financial statements<br />
Refund of rates<br />
This provision primarily relates to a provision for historical errors for rates charged in prior <strong>year</strong>s.<br />
Provision for financial guarantees<br />
<strong>Council</strong> is listed as sole guarantor to a number of community organisation’s bank loans. <strong>Council</strong> is obligated<br />
under the guarantees to make loan payments in the event the organisation defaults on a loan agreement.<br />
The exercising of guarantees will be dependent on the financial stability of the community organisations,<br />
which will vary over time. The <strong>Council</strong> considers that a provision for financial guarantees is not appropriate at<br />
balance date (2011 $nil), as they are effectively offset via <strong>Council</strong>'s conditions of the loan guarantees (see<br />
note 20 Contingent assets).<br />
The face value of the total guarantees is $155,283 (2011 $177,283).<br />
15: Employee benefit liabilities<br />
<strong>Council</strong><br />
$000<br />
2012<br />
actual<br />
2011<br />
actual<br />
Group<br />
$000<br />
2012<br />
actual<br />
2011<br />
actual<br />
Payroll payables 891 720 941 780<br />
Accrued pay 648 632 648 632<br />
<strong>Annual</strong> leave 3,779 3,538 3,779 3,538<br />
Long service leave 143 236 143 236<br />
Retirement gratuities 326 440 326 440<br />
Sick leave 109 123 109 123<br />
Total Employee benefit liabilities 5,896 5,689 5,946 5,749<br />
Comprising<br />
Current 5,427 5,012 5,477 5,072<br />
Non-current 469 677 469 677<br />
Total Employee benefit liabilities 5,896 5,689 5,946 5,749<br />
<strong>Rotorua</strong> <strong>District</strong> <strong>Council</strong> ANNUAL REPORT 2011/12<br />
155
Notes to the financial statements<br />
16: Borrowings including derivative financial instruments<br />
16A: Borrowings<br />
<strong>Council</strong><br />
$000<br />
2012<br />
actual<br />
2011<br />
actual<br />
Group<br />
$000<br />
2012<br />
actual<br />
2011<br />
actual<br />
Current<br />
Registered debenture stock 18,000 13,500 18,000 13,500<br />
Registered security stock 24,325 22,390 24,325 22,390<br />
Piano loan 0 176 0 176<br />
Total face value current borrowings 42,325 36,066 42,325 36,066<br />
Non-current<br />
Registered debenture stock 90,000 88,000 90,000 88,000<br />
Registered security stock 18,650 10,000 18,650 10,000<br />
Derivative valuation 0 0 0 0<br />
Suspensory loans 0 0 0 0<br />
Other secured loans 0 0 0 0<br />
Total face value non-current borrowings 108,650 98,000 108,650 98,000<br />
Total face value of borrowings 150,975 134,066 150,975 134,066<br />
Registered debenture stock<br />
Debenture stock of $78.0 million (2011 $71.5 million) is at fixed interest rates for the term of the stock.<br />
Debenture stock of $30.0 million (2011 $30.0 million) is at floating interest rates. The interest rate is reset<br />
quarterly based on the 90 day bank bill rate plus a margin for credit risk.<br />
Registered security stock<br />
Security stock of $42,975,000 (2011 $32,390,000) is at floating interest rates. The interest rate is reset based on<br />
the bank bill rate plus a margin for credit risk.<br />
Security<br />
The <strong>Council</strong>’s borrowings are secured against its rates revenue.<br />
The <strong>Council</strong> does not have an overdraft facility.<br />
156 <strong>Rotorua</strong> <strong>District</strong> <strong>Council</strong> ANNUAL REPORT 2011/12
16B: Derivative financial instruments<br />
<strong>Council</strong><br />
$000<br />
2012<br />
actual<br />
2011<br />
actual<br />
Group<br />
$000<br />
2012<br />
actual<br />
2011<br />
actual<br />
Current asset portion<br />
Interest rate swaps - cashflow hedges 0 0 0 0<br />
Total current asset portion derivatives 0 0 0 0<br />
Non-current asset portion<br />
Interest rate swaps - cashflow hedges 0 0 0 0<br />
Total non-current asset portion derivatives 0 0 0 0<br />
Total derivative financial instruments assets 0 0 0 0<br />
Current liability portion<br />
Interest rate swaps - cashflow hedges 376 566 376 566<br />
Total current liability portion derivatives 376 566 376 566<br />
Notes to the financial statements<br />
Non-current liability portion<br />
Interest rate swaps - cashflow hedges 405 478 405 478<br />
Total non-current liability portion derivatives 405 478 405 478<br />
Total derivative financial instruments liabilities 781 1,044 781 1,044<br />
Net derivative financial instruments 781 1,044 781 1,044<br />
Fair values of non current borrowings and derivatives<br />
<strong>Council</strong><br />
$000<br />
2012<br />
actual<br />
2011<br />
actual<br />
Group<br />
$000<br />
2012<br />
actual<br />
2011<br />
actual<br />
Registered debenture stock 94,798 91,460 94,798 91,460<br />
Registered security stock 18,650 10,000 18,650 10,000<br />
Other loans 0 176 0 176<br />
Derivative valuation 781 1,044 781 1,044<br />
Total non-current borrowings 114,229 102,680 114,229 102,680<br />
The fair values are based on cash flows discounted using a rate based on the borrowing rates ranging from<br />
3.53% to 7.25% (2011 0.00% to 7.25%).<br />
The carrying amounts of borrowings repayable within one <strong>year</strong> approximate their fair value, as the effect of<br />
discounting is not significant.<br />
Derivatives<br />
Interest rate swaps<br />
The fair value of interest rate swaps have been determined by calculating the expected cash flows under the<br />
terms of the swaps and discounting these values to present value. The inputs into the valuation model are<br />
from independently sourced market parameters such as interest rate yield curves. Most market parameters<br />
are implied from instrument prices.<br />
The notional principal amounts of the outstanding interest rate swap contracts for the <strong>Council</strong> were $30 million<br />
(2011 $40 million) and for the group were $30 million (2011 $40 million). At 30 June 2012, the fixed interest rates<br />
of cash flow hedge interest rate swaps varied from 5.25% to 5.99% (2011 5.87% to 7.40%).<br />
<strong>Council</strong>’s Treasury policy limits and covenants are:<br />
• The gross interest expense of all borrowings will not exceed 15% of total revenue – 2012 6.86% (2011 6.69%)<br />
• Net cash flows from operating activities are to exceed gross annual interest expense by a multiple of at<br />
least two – 2012 3.32 (2011 4.56)<br />
<strong>Rotorua</strong> <strong>District</strong> <strong>Council</strong> ANNUAL REPORT 2011/12<br />
157
Notes to the financial statements<br />
• Maximum debt not to exceed 20% of assets – 2012 14.26% (2011 12.88%)<br />
• No more than $60 million or 50% of existing external borrowing (which ever is the greater) is subject to<br />
refinancing in any financial <strong>year</strong> – 2012 within limits (2011 within limits)<br />
The weighted average effective interest rate on borrowings is 5.44% (2011 5.96%).<br />
17: Equity<br />
<strong>Council</strong><br />
$000<br />
2012<br />
actual<br />
2011<br />
actual<br />
Group<br />
$000<br />
2012<br />
actual<br />
2011<br />
actual<br />
Opening balance 848,433 821,813 848,433 821,813<br />
Net surplus/(deficit) -3,403 7,656 -3,403 7,656<br />
845,030 829,469 845,030 829,469<br />
Movements:<br />
Self funding reserves 4,098 8,859 4,098 8,859<br />
<strong>Council</strong> created reserves 4,150 9,558 4,150 9,558<br />
Restricted reserves -176 546 -176 546<br />
Transfers from property revaluation reserves on disposal 0 0 0 0<br />
8,072 18,963 8,072 18,963<br />
Closing balance 853,102 848,433 853,102 848,433<br />
Self funding reserves<br />
Self funding reserves are reserves established at <strong>Council</strong>'s will for activities that will generate enough revenue<br />
over time to cover the cost of their operation. The reserves balances represent accumulated balances to<br />
date of such activities.<br />
2012<br />
$000<br />
Opening<br />
balance<br />
Movement<br />
during <strong>year</strong><br />
Interest<br />
earned/<br />
charged<br />
Closing<br />
balance<br />
Pensioner housing 1,139 -187 0 952<br />
Events Centre -4,652 -509 0 -5,161<br />
Airport -58,338 -3,316 -3,753 -65,407<br />
Wastewater 14,814 -445 856 15,225<br />
Eastern sewerage scheme -1,310 4,140 169 2,998<br />
Rural waste water -669 -43 -42 -754<br />
Landfill -5,943 -1,235 -428 -7,606<br />
Water -3,912 939 -176 -3,149<br />
Refuse collection -86 -109 -12 -206<br />
Electricity 501 -57 27 471<br />
Economic projects 0 78 5 83<br />
Total self funding reserves -58,456 -744 -3,354 -62,554<br />
158 <strong>Rotorua</strong> <strong>District</strong> <strong>Council</strong> ANNUAL REPORT 2011/12
2011<br />
$000<br />
Opening<br />
balance<br />
Movement<br />
during <strong>year</strong><br />
Interest<br />
earned/<br />
charged<br />
Closing<br />
balance<br />
Pensioner housing 1,030 109 0 1,139<br />
Events Centre -4,322 -330 0 -4,652<br />
Airport -51,040 -3,806 -3,492 -58,338<br />
Wastewater 12,033 2,001 781 14,814<br />
Eastern sewerage scheme 1,915 -3,297 72 -1,310<br />
Rural waste water -1,904 1,332 -97 -669<br />
Landfill -4,615 -1,024 -304 -5,943<br />
Water -2,819 -906 -187 -3,912<br />
Refuse collection 128 -218 5 -86<br />
Electricity 0 494 8 501<br />
Economic projects 0 0 0 0<br />
Total self funding reserves -49,594 -5,645 -3,214 -58,456<br />
Notes to the financial statements<br />
<strong>Council</strong> created reserves<br />
<strong>Council</strong> created reserves are established by <strong>Council</strong> resolution. Transfers to and from these reserves is at the<br />
discretion of <strong>Council</strong>.<br />
2012<br />
$000<br />
Opening<br />
balance<br />
Movement<br />
during <strong>year</strong><br />
Interest<br />
earned/<br />
charged<br />
Closing<br />
balance<br />
Reporoa Domain 38 13 -3 48<br />
Waikite Domain 17 3 1 21<br />
Development Contributions<br />
Roading 596 -98 70 569<br />
Public amenities -7,191 86 -423 -7,528<br />
Land drainage and stormwater -75 -94 4 -166<br />
Parks and reserves -1,330 38 -70 -1,362<br />
Water -4,047 -1,122 -158 -5,327<br />
Waste water -8,902 -2,008 -390 -11,300<br />
Total <strong>Council</strong> Created Reserves -20,894 -3,182 -969 -25,045<br />
Development contribution reserves have a negative balance due to collections only starting in 2007 and some<br />
projects will collect contributions over 25 <strong>year</strong>s or more.<br />
2011<br />
$000<br />
Opening<br />
balance<br />
Movement<br />
during <strong>year</strong><br />
Interest<br />
earned/<br />
charged<br />
Closing<br />
balance<br />
Reporoa Domain 27 10 0 38<br />
Waikite Domain 19 -3 0 17<br />
Development Contributions<br />
Roading 690 -145 51 596<br />
Public amenities -6,427 -370 -394 -7,191<br />
Land drainage and stormwater 61 -143 7 -75<br />
Parks and reserves -1,225 -31 -74 -1,330<br />
Water -2,276 -1,658 -113 -4,047<br />
Waste water -2,206 -6,671 -24 -8,902<br />
Total <strong>Council</strong> Created Reserves -11,337 -9,011 -547 -20,894<br />
<strong>Rotorua</strong> <strong>District</strong> <strong>Council</strong> ANNUAL REPORT 2011/12<br />
159
Notes to the financial statements<br />
Restricted reserves<br />
Restricted reserves are subject to specific conditions set either by legislation, trust or bequests and the purpose<br />
may not be changed without reference to the courts of a third party.<br />
2012<br />
$000<br />
Opening<br />
balance<br />
Movement<br />
during <strong>year</strong><br />
Interest<br />
earned/<br />
charged<br />
Closing<br />
balance<br />
Reserves development 1,321 85 89 1,495<br />
Creative NZ Reserve 24 1 1 26<br />
Total Restricted Reserves 1,345 86 90 1,521<br />
2011<br />
$000<br />
Opening<br />
balance<br />
Movement<br />
during <strong>year</strong><br />
Interest<br />
earned/<br />
charged<br />
Closing<br />
balance<br />
Reserves development 1,868 -654 107 1,321<br />
Creative NZ Reserve 22 0 1 24<br />
Total Restricted Reserves 1,891 -654 108 1,345<br />
Restrictions<br />
Reserve development – Section 108 of the Resource Management Act 1991 requires funds to be set aside for<br />
the development of reserves.<br />
<strong>District</strong> Library bequests – Section 31 of the Local Legislation Act 1937 states the fund is an endowment for the<br />
maintenance and benefit of a public library in the Borough of <strong>Rotorua</strong>.<br />
Property development – previously required by Sections 561, 562, 572 of the Local Government Act 1974<br />
required various sales of properties to be credited to a Housing and Property Account. Funds are used for<br />
property development. This is no longer restricted under the Local Government Act 2002 and this reserve will<br />
be used over the next two <strong>year</strong>s.<br />
Cash flow hedge reserve<br />
<strong>Council</strong><br />
$000<br />
2012<br />
actual<br />
2011<br />
actual<br />
Group<br />
$000<br />
2012<br />
actual<br />
2011<br />
actual<br />
Opening Balance -680 -471 -680 -471<br />
Valuations gains/(losses) taken to equity 122 -209 122 -209<br />
Closing balance -558 -680 -558 -680<br />
Fair value through equity reserve<br />
<strong>Council</strong><br />
$000<br />
2012<br />
actual<br />
2011<br />
actual<br />
Group<br />
$000<br />
2012<br />
actual<br />
2011<br />
actual<br />
Opening Balance 407 235 407 235<br />
Valuations gains/(losses) taken to equity -103 173 -103 173<br />
Closing balance 304 407 304 407<br />
160 <strong>Rotorua</strong> <strong>District</strong> <strong>Council</strong> ANNUAL REPORT 2011/12
Asset revaluation reserves<br />
2012<br />
$000<br />
Opening<br />
balance<br />
2012 asset revaluation reserve for each asset class consist of<br />
Transfer to<br />
accumulated<br />
funds on<br />
disposal of<br />
property<br />
Revaluation<br />
gains /<br />
(losses)<br />
during <strong>year</strong><br />
Revaluation<br />
disposals<br />
gains /<br />
(losses)<br />
during <strong>year</strong><br />
Major<br />
transfers<br />
Debit<br />
reserves<br />
transferred<br />
to NCOS<br />
Closing<br />
balance<br />
Airport 1,877 0 0 1 0 0 1,878<br />
Bridges 0 0 0 -337 0 337 0<br />
Building 15,196 0 -10,671 939 -5 0 5,458<br />
Footpaths 587 0 -8,264 -853 -47 8,577 0<br />
Land 11,276 0 -12,286 -567 -50 1,626 0<br />
Landfill 535 0 7,250 -1,457 -121 0 6,207<br />
Library 274 0 0 0 0 0 274<br />
Parks & Reserves 5,203 0 0 16 47 0 5,266<br />
Roading 4,900 0 688 -786 290 0 5,092<br />
Street Items 1,000 0 -576 225 -13 0 636<br />
Stormwater 52,143 -152 0 74 -76 0 51,989<br />
Waterworks 20,455 -654 0 -78 0 0 19,723<br />
Waste Management 24 0 0 0 -24 0 0<br />
Plant & Reticulation 10,687 25 -2,022 -920 0 0 7,770<br />
Wastewater Reticulation 3,824 -98 581 -753 -1 0 3,553<br />
Notes to the financial statements<br />
TOTAL 127,981 -879 -25,300 -4,496 0 10,540 107,846<br />
2011<br />
$000<br />
2011 asset revaluation reserve for each asset class consist of<br />
Opening<br />
balance<br />
Transfer to<br />
accumulated<br />
funds on<br />
disposal of<br />
property<br />
Revaluation<br />
gains /<br />
(losses)<br />
during <strong>year</strong><br />
Revaluation<br />
disposals<br />
gains /<br />
(losses)<br />
during <strong>year</strong><br />
Major<br />
transfers<br />
Airport 1,877 0 0 0 1,877<br />
Bridges 0 0 0 0 0<br />
Building 15,247 0 0 -51 15,196<br />
Footpaths 587 0 0 0 587<br />
Land 11,276 0 0 0 11,276<br />
Landfill 535 0 0 0 535<br />
Library 108 0 165 0 274<br />
Parks & Reserves 2,158 0 3,055 -9 5,204<br />
Roading 4,899 0 0 0 4,900<br />
Street Items 1,000 0 0 0 1,000<br />
Stormwater 4,216 0 48,011 -84 52,143<br />
Waterworks 20,563 0 0 -264 20,299<br />
Waste Management 24 0 0 0 24<br />
Plant & Reticulation 10,687 0 0 0 10,687<br />
Wastewater Reticulation 0 0 3,822 2 3,824<br />
TOTAL 73,177 0 55,053 -404 127,826<br />
<strong>Rotorua</strong> <strong>District</strong> <strong>Council</strong> ANNUAL REPORT 2011/12<br />
161
Notes to the financial statements<br />
18: Reconciliation of net surplus/(deficit) to after tax to net cash flow from operating<br />
activities<br />
<strong>Council</strong><br />
$000<br />
2012<br />
actual<br />
2011<br />
actual<br />
Group<br />
$000<br />
2012<br />
actual<br />
2011<br />
actual<br />
Surplus/(deficit) after tax -3,403 7,656 -3,403 7,656<br />
Add/(less) non-cash items:<br />
Depreciation Property, Plant and Equipment 27,749 25,260 27,949 25,431<br />
Depreciation Intangible Assets 532 738 532 738<br />
Impairment charges accounts receivable -37 -193 -37 -193<br />
Vested assets and assets recognised for first time -3,740 -2,577 -3,740 -2,577<br />
(Gains)/losses in fair value of biological assets -773 -142 -773 -142<br />
Change in Revaluation through Profit and Loss 0 2,275 0 2,275<br />
Loss on revaluation Reserves to NCOS 10,541 10,541<br />
-<br />
Add/(less) items classified as investing or financing activities: -<br />
(Gains)/losses on disposal of Property, Plant and Equipment 981 1,934 981 1,920<br />
Reversal impairment loss RRAL -58 -200 - -<br />
Fair value decrease(increase) LASS 85 -11 85 -11<br />
Fair value decrease(increase) NZLGI 45 55 45 55<br />
Fair Value decrease (increase) interest swap -263 212 -263 212<br />
Movement PPE -7,092 -821 -7,092 -821<br />
Add/(less) movements in working capital items: -<br />
Accounts receivable -2,812 -1,064 -1,643 -2,832<br />
Inventories 46 27 46 29<br />
Accounts payable -4,500 1,406 -4,463 917<br />
Provision for taxation - 10 -5<br />
Provisions 1,240 178 1,230 178<br />
Employee benefits 207 351 207 361<br />
-<br />
-<br />
Net cash inflow/(outflow) from operating activities 18,748 35,084 20.212 33,191<br />
19: Capital commitments and operating leases<br />
<strong>Council</strong><br />
$000<br />
2012<br />
actual<br />
2011<br />
actual<br />
Group<br />
$000<br />
2012<br />
actual<br />
2011<br />
actual<br />
<strong>Council</strong> is committed to the following capital contracts<br />
Recreation and community services 69 1,859 69 1,859<br />
Works and engineering services 34,908 17,812 34,908 17,812<br />
Support services 19 184 19 184<br />
Airport 683 813 683 813<br />
Total capital contracts 35,679 20,668 35,679 20,668<br />
162 <strong>Rotorua</strong> <strong>District</strong> <strong>Council</strong> ANNUAL REPORT 2011/12
Operating leases as lessee<br />
The <strong>Council</strong> and group leases property, plant and equipment in the normal course of its business. The majority<br />
of these leases have a non-cancellable term of 36 months. The future aggregate minimum lease payments<br />
payable under non-cancellable operating leases are as follows:<br />
<strong>Council</strong><br />
$000<br />
2012<br />
actual<br />
2011<br />
actual<br />
Group<br />
$000<br />
2012<br />
actual<br />
2011<br />
actual<br />
Non-cancellable operating lease commitments as lessee:<br />
Not later than one <strong>year</strong> 338 309 338 309<br />
Later than one <strong>year</strong> and not later than two <strong>year</strong>s 244 278 244 278<br />
Later than two <strong>year</strong>s and not later than five <strong>year</strong>s 426 367 426 367<br />
Later than five <strong>year</strong>s 505 1,051 505 1,051<br />
Total non-cancellable operating lease commitments as lessee: 1,513 2,005 1,513 2,005<br />
Notes to the financial statements<br />
Total commitments 37,192 22,673 37,192 22,673<br />
The total minimum future sublease payments expected to be received under non-cancellable subleases at<br />
balance date is $nil (2011 $nil).<br />
In general, leases can be renewed at the group's option, with rents set by reference to current market rates for<br />
items of equivalent age and condition. For some lease agreements the group has the option to purchase the<br />
asset at the end of the lease term.<br />
For the majority of lease agreements, there are no restrictions placed on the group by any of the leasing<br />
arrangements.<br />
Operating leases as lessor<br />
The <strong>Council</strong> leases land, buildings, parks, reserve land and commercial premises under operating leases. The<br />
majority of these leases have a non-cancellable term of 72 months. The future aggregate minimum lease<br />
payments to be collected under non-cancellable operating leasers are as follows:<br />
<strong>Council</strong><br />
$000<br />
2012<br />
actual<br />
2011<br />
actual<br />
Group<br />
$000<br />
2012<br />
actual<br />
2011<br />
actual<br />
Non-cancellable operating lease commitments as lessor:<br />
Not later than one <strong>year</strong> 1,712 2,032 1,712 1,288<br />
Later than one <strong>year</strong> and not later than two <strong>year</strong>s 1,399 972 1,399 972<br />
Later than two <strong>year</strong>s and not later than five <strong>year</strong>s 3,008 2,046 3,008 2,046<br />
Later than five <strong>year</strong>s 7,925 4,011 7,925 4,011<br />
Total non-cancellable operating lease commitments as lessor: 14,044 9,061 14,044 8,317<br />
<strong>Council</strong> have changed the way in which future lease receivables are measured and disclosed given the level<br />
of uncertainty surrounding some of the future lease receivables. Given this change in measurement, <strong>Council</strong><br />
cannot quantify the effect this has on prior <strong>year</strong>s’ figures.<br />
No contingent rents have been recognised during the period.<br />
<strong>Rotorua</strong> <strong>District</strong> <strong>Council</strong> ANNUAL REPORT 2011/12<br />
163
Notes to the financial statements<br />
20: Contingencies<br />
<strong>Council</strong><br />
$000<br />
Contingent liabilities 2012<br />
actual<br />
Guarantees<br />
2011<br />
actual<br />
Group<br />
$000<br />
2012<br />
actual<br />
2011<br />
actual<br />
Guarantees to community and sporting groups 155 177 155 177<br />
Borrowings<br />
Performance bond BNZ on behalf of Tourism <strong>Rotorua</strong> 235 235 235 235<br />
Borrowing - Housing New Zealand Corporation suspensory loan 1,532 1,532 1,532 1,532<br />
Legal proceedings<br />
The Group's effective exposure to legal claims 635 190 635 190<br />
Total Contingent Liabilities 2,557 2,134 2,557 2,134<br />
Financial guarantees<br />
The value of the guarantees disclosed as contingent liabilities reflects the group's assessment of the<br />
undiscounted portion of financial guarantees that are not recognised in the Statement of financial position.<br />
Refer to note 14 Provisions for information on recognised financial guarantees. Contingent assets (below) on<br />
the effect of <strong>Council</strong>'s underwriting conditions on all financial guarantees.<br />
Borrowings<br />
The Housing New Zealand suspensory loan has been spent on specific social housing projects in accordance<br />
with the loan agreement. The <strong>Council</strong> is not required to repay the outstanding principal, including interest and<br />
costs, provided the <strong>Council</strong> meets the conditions of the loan during a 20 <strong>year</strong> period commencing December<br />
2005. The loan is secured by first ranking mortgage over the land.<br />
Legal proceedings<br />
The <strong>Council</strong> is currently facing ten legal claims (2011 fifteen). An estimate of council’s share of exposure is<br />
$635,000, and includes seven properties in a subdivision, of which four formal claims have been made to date.<br />
The <strong>Council</strong> does not accept the validity of all these claims and is in the process of resolving them through<br />
normal legal channels.<br />
Unquantified claims<br />
As disclosed in note 14, a provision of $1,005,000 (2011 $470,000) has been recognised for weathertightness<br />
claims. Included in this amount is an estimate of $525,000 (2011 nil) being <strong>Council</strong>’s exposure to potential<br />
future claims which have not yet been advised until the statutory limitation period expires. Claims must be<br />
made within 10 <strong>year</strong>s of construction or alteration of the dwelling in order for the claim to be eligible under the<br />
Weathertight Homes Resolution Services Act 2006, but other statutory limitation periods could also affect<br />
claims.<br />
RiskPool provides public liability and professional indemnity for its members, of which <strong>Council</strong> is no longer a<br />
member. The trust deed of RiskPool provides that, if there is a shortfall (whereby claims exceed contributions<br />
of members and reinsurance recoveries) in any fund <strong>year</strong>, then the board may make a call on members for<br />
that fund <strong>year</strong>. $103,634 was paid by <strong>Council</strong> during 2012, and a further call for additional contributions of the<br />
same amount has been made for 2013. This highlights that it is possible that further calls could still be made in<br />
the future, and a liability will be recognised for the future calls when there is more certainty over the amount of<br />
the calls.<br />
The <strong>Council</strong> is a participating employer in the Defined Benefit Plan Contributors Scheme ("the Scheme"), which<br />
is a multi-employer defined benefit scheme. If the other participating employers ceased to participate in the<br />
Scheme, the council could be responsible for the entire deficit of the Scheme. Similarly, if a number of<br />
employers ceased to participate in the Scheme, the <strong>Council</strong> could be responsible for an increased share of<br />
the deficit.<br />
As at 31 March 2011 the Scheme had a past service surplus of $37.582 million (16.4% of the liabilities). This<br />
amount is exclusive of Specified Superannuation Contribution Withholding Tax and calculated using a<br />
discount rate equal to the expected return on the assets. The actuary to the Scheme has recomm<strong>ended</strong> the<br />
164 <strong>Rotorua</strong> <strong>District</strong> <strong>Council</strong> ANNUAL REPORT 2011/12
employer contribution continues at 1.0 times contributors contributions. The 1.0 is inclusive of Specified<br />
Contribution Withholding Tax.<br />
Contingent assets<br />
<strong>Council</strong><br />
$000<br />
Loan guarantees 2012<br />
actual<br />
2011<br />
actual<br />
Group<br />
$000<br />
2012<br />
actual<br />
2011<br />
actual<br />
<strong>Rotorua</strong> Badminton Club Incorporated 51 57 51 57<br />
Whakarewarewa Rugby Community Sports Incorporated 26 29 26 29<br />
<strong>Rotorua</strong> Hockey Trust & BOP Hockey Association 186 207 186 207<br />
Total loan guarantees 263 293 263 293<br />
The <strong>Council</strong> operates a scheme whereby sports clubs are able to construct facilities (eg club rooms) on<br />
reserve land. The clubs control the use of these facilities and the <strong>Council</strong> will only gain control of the asset if<br />
the club either vacates the facility, or defaults on the council-guaranteed loan. Until this event occurs, these<br />
assets are not recognised as assets in the Statement of financial position.<br />
Notes to the financial statements<br />
As at 30 June 2012 there are four facilities with a book value of $263,481 (2011 $292,937).<br />
<strong>Council</strong><br />
$000<br />
Suspensory loans 2012<br />
actual<br />
2011<br />
actual<br />
Group<br />
$000<br />
2012<br />
actual<br />
2011<br />
actual<br />
Reporoa College 50 60 50 60<br />
Western Heights High School 90 120 90 120<br />
<strong>Rotorua</strong> Girls High School 60 90 60 90<br />
<strong>Rotorua</strong> Rail Trust 2 3 2 3<br />
Kaharoa Primary School 40 50 40 50<br />
Lynmore Primary School 8 12 8 12<br />
St Chads 40 53 40 53<br />
John Paul College 155 175 155 175<br />
<strong>Rotorua</strong> Kartsport Development 135 150 135 150<br />
Total suspensory loans 580 713 580 713<br />
Total contingent assets 843 1,006 843 1,006<br />
The <strong>Council</strong> operates a scheme whereby community and educational organisations are able to apply for<br />
suspensory loans through <strong>Council</strong>'s Community Asset Development Fund (CADF). Criteria for the suspensory<br />
loan includes that the facility (to which the loan relates) be made available to the public in measured<br />
amounts of time, the project has other funding sources to enable successful completion, and that ongoing<br />
monitoring of the fiscal viability of the organisation is maintained throughout the term of the suspensory loan.<br />
The community organisation(s) control the use of these facilities, and the <strong>Council</strong> will only make the remaining<br />
balance, or the instalment relating to the <strong>year</strong> in default, payable if the organisation defaults on the terms of<br />
the suspensory loan agreement. The suspensory loan is written off over a specified period as long as agreed<br />
criteria continue to be met. Unless the contrary occurs, these suspensory loans are not recognised in the<br />
Statement of financial position. As at 30 June 2012 there were eight facilities having a face value of $580,000<br />
(2011: $713,000) outstanding.<br />
<strong>Rotorua</strong> <strong>District</strong> <strong>Council</strong> ANNUAL REPORT 2011/12<br />
165
Notes to the financial statements<br />
21: Related party transactions<br />
The <strong>Council</strong> is the ultimate parent of the group and controls the following entities:<br />
• <strong>Rotorua</strong> Regional Airport Limited<br />
• <strong>Rotorua</strong> <strong>District</strong> <strong>Council</strong> Holdings Limited<br />
• Grow <strong>Rotorua</strong> Limited<br />
Related party transactions with subsidiaries, associates or joint ventures<br />
<strong>Rotorua</strong> Regional Airport<br />
2012 actual<br />
$000<br />
2011 actual<br />
$000<br />
Interest paid to the council 15 26<br />
Services provided by the council<br />
- Land and water rates 69 62<br />
- Rent 205 167<br />
- Development levy 510 531<br />
Loans payable to the council 0 420<br />
Accounts payable to the council 907 1,750<br />
Accounts receivable from the council 107 96<br />
Directors remuneration including non-monetary benefits paid to RDC <strong>Council</strong>lors<br />
- <strong>Council</strong>lor Martin 0 3<br />
- <strong>Council</strong>lor McVicker 0 3<br />
- <strong>Council</strong>lor Kenny 0 4<br />
Transactions with key management personnel<br />
Key management personnel compensation<br />
2012 actual<br />
$000<br />
2011 actual<br />
$000<br />
Salaries and other short term employee benefits 954 1,092<br />
Post-employment benefits 0 0<br />
Other long-term benefits 43 47<br />
Termination benefits 0 382<br />
Share-based payments 0 0<br />
<strong>Council</strong>lors Salaries 588 572<br />
Total group key management remuneration 1,585 2,093<br />
During the <strong>year</strong> councillors and key management personnel, as part of a normal customer relationship, were<br />
involved in minor transactions with the council (such as payment of rates, fees and charges, purchase of<br />
rubbish bags etc).<br />
The <strong>Council</strong> purchased goods and services totalling $1,409,283 (2011 $1,372,585) from Clean Green City<br />
Maintenance and $nil (2011 $1,733) from Gardeners Landscape Supplies. Accounts payable balances of<br />
$99,599 (2011 $100,255) was payable at <strong>year</strong> end to Clean Green City Maintenance and $nil (2011 $44). Both<br />
businesses are owned by <strong>Council</strong>lor Bentley and her husband.<br />
The <strong>Council</strong> purchased $nil (2011 $nil) goods and services from Putt Putt (<strong>Rotorua</strong>) Limited, a business owned<br />
by <strong>Council</strong>lor McVicker. The <strong>Council</strong> received goods and services from Putt Putt (<strong>Rotorua</strong>) Limited of $110<br />
(2011 $563).<br />
The <strong>Council</strong> sold $nil goods to <strong>Council</strong>lor Bob Martin (2011 $2,000).<br />
During the <strong>year</strong>, the <strong>Council</strong> purchased goods and services from D & C Gould Limited for $479 (2011 $2,482), a<br />
business in which <strong>Council</strong>lor Gould is an owner.<br />
Peter Guerin, Chief Executive, is director for BOP LASS Limited to which <strong>Council</strong> paid $165,160 (2011 $479,264)<br />
for services provided. An outstanding amount payable at 30 June 2012 was $41,257 (2011 $3,482) and <strong>Council</strong><br />
received $2,515 (2011 $2,944) during the <strong>year</strong> from BOP LASS Limited.<br />
Peter Guerin, Chief Executive, is also a director for LASS Limited. in which payments amounting to $54,541 (2011<br />
$59,357) were paid towards costs of a shared valuation database.<br />
166 <strong>Rotorua</strong> <strong>District</strong> <strong>Council</strong> ANNUAL REPORT 2011/12
There are close family members of key management personnel employed by the <strong>Council</strong>. The terms and<br />
conditions of these arrangements are no more favourable than <strong>Council</strong> would have adopted if there were no<br />
relationship to key management personnel.<br />
No provision has been required, nor any expense recognised for the impairment of receivables, for any loans<br />
or other receivables, to related parties (2011 $nil).<br />
22: Agency relationships<br />
<strong>Council</strong> is involved in administering expenditure and revenue on behalf of other organisations as follows:<br />
These agency transactions have not been included in <strong>Council</strong>'s current <strong>year</strong> operating results. <strong>Council</strong> has,<br />
however, included the net movement in agency debtors and creditors in its Statement of cash flows, and<br />
included the <strong>Council</strong>’s asset or liability in relation to the agencies in its Statement of financial position. <strong>Council</strong><br />
derives commission income to compensate for the cost of administration.<br />
Petrol tax<br />
Notes to the financial statements<br />
The Bay of Plenty Local Authority Petrol Tax Distribution for the<br />
<strong>year</strong> <strong>ended</strong> 30 June 2012<br />
2012 actual<br />
$000<br />
Percentage<br />
2011 actual<br />
$000<br />
percentage<br />
Kawerau <strong>District</strong> <strong>Council</strong> 57 2.3% 59 2.4%<br />
Opotiki <strong>District</strong> <strong>Council</strong> 62 2.5% 63 2.5%<br />
<strong>Rotorua</strong> <strong>District</strong> <strong>Council</strong> 547 22.0% 567 22.6%<br />
Taupo <strong>District</strong> <strong>Council</strong> 362 14.5% 366 14.6%<br />
Tauranga City <strong>Council</strong> 826 33.2% 814 32.5%<br />
Western BOP <strong>District</strong> <strong>Council</strong> 374 15.0% 382 15.3%<br />
Whakatane <strong>District</strong> <strong>Council</strong> 261 10.5% 253 10.1%<br />
Total tax distributable to councils 2,489 100.0% 2,504 100.0%<br />
State Highways administration<br />
2012 actual<br />
$000<br />
2011 actual<br />
$000<br />
Expenditure on State Highways roading network 9,644 13,422<br />
(Reimbursed from Land Transport New Zealand and Whakatane <strong>District</strong> <strong>Council</strong>)<br />
Regional <strong>Council</strong> rates<br />
2012 actual<br />
$000<br />
2011 actual<br />
$000<br />
Rates were collected on behalf of the following Regional Authorities:<br />
Bay of Plenty Regional <strong>Council</strong> 6,967 7,172<br />
6,967 7,172<br />
<strong>Rotorua</strong> <strong>District</strong> <strong>Council</strong> ANNUAL REPORT 2011/12<br />
167
Notes to the financial statements<br />
23: Remuneration<br />
Chief Executive's remuneration<br />
The Chief Executive of <strong>Rotorua</strong> <strong>District</strong> <strong>Council</strong> is appointed under Part 4, section 42 of the Local Government<br />
Act 2002. The total cost, including fringe benefit tax, was $332,615 (2011 $339,717).<br />
Chief Executive's Remuneration<br />
$<br />
2012<br />
actual<br />
<strong>Council</strong><br />
2011<br />
actual<br />
Group<br />
2012<br />
actual<br />
2011<br />
actual<br />
Salary Chief Executive 293,812 299,823 293,812 299,823<br />
Vehicle Chief Executive (including FBT) 23,852 23,852 23,852 23,852<br />
317,664 323,675 317,664 323,675<br />
Other Benefits<br />
Professional association fees Chief Executive 261 1,051 261 1,051<br />
Telephone and sundries Chief Executive 0 0 0 0<br />
Superannuation 14,690 14,991 14,690 14,991<br />
14,951 16,042 14,951 16,042<br />
Total remuneration 332,615 339,717 332,615 339,717<br />
Elected representatives<br />
The total monetary remuneration received by the twelve councillors and the Mayor during the <strong>year</strong> totalled<br />
$576,060 (2011 $576,323).<br />
The monetary remuneration consists of honoraria and meeting allowances, and is determined by the<br />
Remuneration Authority under the Local Government Elected Members Determination 2005. Professional<br />
indemnity and trustee liability insurance is also provided to the councillors against any potential legal litigation<br />
which may occur while undertaking <strong>Council</strong> business.<br />
<strong>Council</strong>lors’ remuneration<br />
$<br />
Honoraria<br />
Hearing<br />
fees<br />
Total 2012 Total 2011<br />
Bentley M 37,719 1,480 39,199 37,633<br />
Calnan J 39,219 0 39,219 37,855<br />
Donaldson D 39,219 0 39,219 37,855<br />
Gould M 37,719 0 37,719 25,829<br />
Hunt K 39,219 0 39,219 37,855<br />
Kenny G 6,157 0 6,157 37,565<br />
Martin R W * 0 0 0 11,260<br />
Maxwell T H 42,383 0 42,383 43,821<br />
McVicker M * 43,133 0 43,133 40,384<br />
Raukawa-Tait M 22,651 0 22,651 0<br />
Searancke G P 41,634 3,447 45,081 42,955<br />
Sturt C W 37,719 80 37,799 38,573<br />
Waaka M T R 39,219 3,945 43,164 42,092<br />
Wepa J G 43,133 3,116 46,249 41,540<br />
Winters K (Mayor) 106,936 0 106,936 101,108<br />
576,060 12,068 588,128 576,325<br />
*Cr Martin, Cr McVicker and Cr Kenny also earned directors' fees as directors of the <strong>Rotorua</strong> Regional Airport<br />
Limited of $nil (2011 $2,750), $nil (2011 $2,750) and $nil (2011 $3,750) respectively.<br />
Severance payments<br />
The <strong>Council</strong> made three severance payments to employees during the <strong>year</strong> totalling $26,404.82 (2011 five<br />
$459,653).<br />
The value of each of the severance payments was $11,159.01, $12,245.81 and $3,000 (2011 $176,312, $206,157,<br />
$41,686, $33,498 and $2,000).<br />
168 <strong>Rotorua</strong> <strong>District</strong> <strong>Council</strong> ANNUAL REPORT 2011/12
24: Events after balance date<br />
No significant events have occurred between balance date and the signing of the financial statements.<br />
25: Financial instruments<br />
25A: Financial instrument categories<br />
The accounting policies for financial instruments have been applied to the line items below:<br />
FINANCIAL ASSETS<br />
<strong>Council</strong><br />
$000<br />
2012<br />
actual<br />
2011<br />
actual<br />
Group<br />
$000<br />
2012<br />
actual<br />
2011<br />
actual<br />
Notes to the financial statements<br />
Loans and receivables<br />
Total cash and cash equivalents (including short term deposits 3mths 883 1,773 1,622 1,657<br />
or less)<br />
Debtors and other receivables (including community loans & RRAL 21,287 18,438 21,501 18,355<br />
loan)<br />
Total loans and receivables 22,170 20,211 23,123 20,012<br />
Fair value through other comprehensive income<br />
Unlisted shares 2,147 2,220 363 493<br />
Derivatives that are hedge accounted<br />
Derivative financial instrument assets 0 0 0 0<br />
Total financial assets 24,317 22,431 23,486 20,505<br />
FINANCIAL LIABILITIES<br />
Financial liabilities<br />
Creditors and other payables 22,347 26,848 22,432 25,880<br />
Borrowings:<br />
Registered debenture stock 108,000 101,500 108,000 101,500<br />
Registered security stock 42,975 32,390 42,975 32,390<br />
Derivatives that are hedge accounted<br />
Derivative financial instrument liabilities 781 1,044 781 1,044<br />
Total financial liabilities at amortised cost 174,103 161,782 174,188 160,814<br />
25B: Fair value hierarchy disclosures<br />
For those instruments recognised at fair value in the Statement of financial position, fair values are determined<br />
according to the following hierarchy:<br />
• Quoted market price (level 1) – Financial instruments with quoted prices for identical instruments in active<br />
markets<br />
• Valuation technique using observable inputs (level 2) – Financial instruments with quoted prices for similar<br />
instruments in active markets or quoted prices for identical or similar instruments in inactive markets and<br />
financial instruments valued using models where all significant inputs are observable<br />
• Valuation techniques with significant non-observable inputs (level 3) – Financial instruments valued using<br />
models where one or more significant inputs are not observable<br />
The following table analyses the basis of the valuation of classes of financial instruments measured at fair value<br />
in the Statement of financial position.<br />
<strong>Rotorua</strong> <strong>District</strong> <strong>Council</strong> ANNUAL REPORT 2011/12<br />
169
Notes to the financial statements<br />
<strong>Council</strong> 2012<br />
Total<br />
$000<br />
Quoted market<br />
price<br />
$000<br />
Valuation technique<br />
observable inputs<br />
$000<br />
Significant nonobservable<br />
inputs<br />
$000<br />
Financial assets<br />
Shares 2,147 0 0 2,147<br />
Financial liabilities<br />
Registered debenture stock 108,000 0 108,000 0<br />
Registered security stock 42,975 0 42,975 0<br />
Derivatives 781 0 781 0<br />
Group 2012<br />
Financial assets<br />
Shares 363 0 0 363<br />
Financial liabilities<br />
Registered debenture stock 108,000 0 108,000 0<br />
Registered security stock 42,975 0 42,975 0<br />
Derivatives 781 0 781 0<br />
<strong>Council</strong> 2011<br />
Financial assets<br />
Shares 2,220 0 0 2,220<br />
Financial liabilities<br />
Registered debenture stock 101,500 0 101,500 0<br />
Registered security stock 32,390 0 32,390 0<br />
Derivatives 1044 0 1044 0<br />
Group 2011<br />
Financial assets<br />
Shares 493 0 0 493<br />
Financial liabilities<br />
Registered debenture stock 101,500 0 101,500 0<br />
Registered security stock 32,390 0 32,390 0<br />
Derivatives 1,044 0 1,044 0<br />
There were no transfers between the different levels of the fair value hierarchy.<br />
Valuation techniques with significant non-observable inputs (level 3)<br />
The table below provides a reconciliation from the opening balance to the closing balance for the level 3 fair<br />
value measurements:<br />
Valuation techniques with significant non-observable inputs (level 2)<br />
<strong>Council</strong><br />
$000<br />
2012<br />
actual<br />
2011<br />
actual<br />
Group<br />
$000<br />
2012<br />
actual<br />
2011<br />
actual<br />
Balance at 1 July -429 -466 -429 -466<br />
Gains and losses recognised in other comprehensive income -19 37 -19 37<br />
Balance at 30 June -448 -429 -448 -429<br />
Changing a valuation assumption to a reasonable possible alternative assumption would not significantly<br />
change fair value.<br />
170 <strong>Rotorua</strong> <strong>District</strong> <strong>Council</strong> ANNUAL REPORT 2011/12
25C: Financial instrument risks<br />
<strong>Council</strong> has a series of policies to manage the risk associated with financial instruments and is risk averse and<br />
seeks to minimise exposure from its treasury activities. The <strong>Council</strong> has established liability management and<br />
investment polices. These policies do not allow any transactions that are speculative in nature to be entered<br />
into.<br />
Market risk<br />
Price risk<br />
Price risk is the risk that the value of a financial instrument will fluctuate as a result of changes in market prices.<br />
At present the <strong>Council</strong> is not exposed to any equity securities price risk as the council holds no listed equity<br />
instruments.<br />
Currency risk<br />
Currency risk is the risk that the value of a financial instrument will fluctuate due to changes in foreign<br />
exchange rates.<br />
Notes to the financial statements<br />
The <strong>Council</strong> purchases plant and equipment associated with the construction of certain infrastructural assets<br />
from overseas, which require it to enter into transactions denominated in foreign currencies. As a result of<br />
these activities, exposure to currency risk arises.<br />
Interest rate risk<br />
The interest rate risk comprises:<br />
• Fair value interest rate risk: the risk that the value of a financial instrument will fluctuate due to changes in<br />
market interest rates. Borrowings issued at fixed rates expose the council to fair value interest rate risk.<br />
• Cash flow interest rate risk: the risk that the cash flows from a financial instrument will fluctuate because of<br />
changes in market interest rates. Borrowings and investments issued at variable interest rate expose the<br />
council to cash flow interest rate risk.<br />
To manage these risks the council's current policy parameters of core debt are:<br />
Term of exposure<br />
Minimum<br />
Fixed Rate<br />
Exposure<br />
Maximum<br />
Fixed Rate<br />
Exposure<br />
0 - 1 <strong>year</strong> 60% 100%<br />
1 - 2 <strong>year</strong>s 40% 90%<br />
3 - 5 <strong>year</strong>s 30% 70%<br />
5 - 10 <strong>year</strong>s 0% 60%<br />
10 <strong>year</strong>s and over<br />
Any hedging must be approved by the <strong>Council</strong>.<br />
Note 12 provides information on term deposits interest rates and maturity profile.<br />
Note 16 provides information on term loan interest rates, maturity profile and derivatives.<br />
At <strong>year</strong> end the <strong>Council</strong> has four interest rate risk management instruments in place.<br />
Credit risk<br />
Credit risk is the risk that a third party will default on its obligation to the <strong>Council</strong> causing the <strong>Council</strong> to incur a<br />
loss.<br />
Financial instruments which potentially subject the <strong>Council</strong> to credit risk consist of bank balances, term<br />
deposits, rates and other receivables, community loans and financial guarantees.<br />
The <strong>Council</strong> places its cash and short term deposits with high credit quality financial institutions. Accordingly<br />
the <strong>Council</strong> does not require any collateral or security to support these financial instruments with institutions or<br />
organisations it deals with.<br />
<strong>Rotorua</strong> <strong>District</strong> <strong>Council</strong> ANNUAL REPORT 2011/12<br />
171
Notes to the financial statements<br />
Maximum exposure to credit risk<br />
The <strong>Council</strong>'s maximum credit exposure for each class of financial instrument is as follows:<br />
<strong>Council</strong><br />
$000<br />
2012<br />
actual<br />
2011<br />
actual<br />
Group<br />
$000<br />
2012<br />
actual<br />
2011<br />
actual<br />
Cash at bank and term deposits 883 1,773 1,622 1,657<br />
Debtors and other receivables (including community loans & RRAL 21,287 18,438 21,501 18,355<br />
loan)<br />
Unlisted shares 2,147 2,220 363 493<br />
Financial guarantees 263 293 263 293<br />
Total fair value through other comprehensive income 24,580 22,724 23,749 20,798<br />
Credit quality of financial assets<br />
The credit quality of financial assets that are neither past due nor impaired can be assessed by reference to<br />
Standard and Poors’ credit ratings (if available) or to historical information about counterparty default rates:<br />
<strong>Council</strong><br />
$000<br />
2012<br />
actual<br />
2011<br />
actual<br />
Group<br />
$000<br />
2012<br />
actual<br />
2011<br />
actual<br />
Counterparties with credit ratings<br />
Cash at bank and term deposits 883 1,773 1,622 1,657<br />
Total cash at bank and term deposits 883 1,773 1,622 1,657<br />
Counterparties without credit ratings<br />
Unlisted shares 2,147 2,220 363 493<br />
Total unlisted shares 2,147 2,220 363 493<br />
Community and related party loans<br />
Existing counterparty with no defaults in the past 17 17 17 17<br />
Related party loan - <strong>Rotorua</strong> Regional Airport Limited 0 420 0 420<br />
Total community and related party loans 17 437 17 437<br />
Debtors and other receivables mainly arise from <strong>Council</strong>'s statutory function. Therefore there are no<br />
procedures in place to monitor or report the credit quality of debtors and other receivables with reference to<br />
internal or external credit ratings. The <strong>Council</strong> has no significant concentrations of credit risk with respect to<br />
debtors and other receivables, as it has a large number of credit customers, mainly ratepayers, and the<br />
<strong>Council</strong> has powers under the Local Government (Rating) Act 2002 to recover outstanding debts from<br />
ratepayers.<br />
Liquidity risk<br />
Management of liquidity risk<br />
Liquidity risk is the risk that <strong>Council</strong> will encounter difficulty raising liquid funds to meet commitments as they fall<br />
due. Prudent liquidity risk management implies maintaining sufficient cash, the availability of funding through<br />
an adequate amount of committed credit facilities and the ability to close out market positions. The <strong>Council</strong><br />
aims to maintain flexibility in funding by keeping committed credit lines available.<br />
The <strong>Council</strong> manages its borrowings in accordance with its funding and financial policies, which includes a<br />
liability management policy. These policies have been adopted as part of the <strong>Council</strong>’s Long-Term planning<br />
process.<br />
<strong>Council</strong> has a maximum amount that can be drawn down against its bank facilities of $55 million (2011 $55<br />
million). There are no restrictions on the use of this facility.<br />
172 <strong>Rotorua</strong> <strong>District</strong> <strong>Council</strong> ANNUAL REPORT 2011/12
Contractual maturity analysis of financial liabilities, excluding derivatives<br />
The table below analyses the <strong>Council</strong>'s financial liabilities into relevant maturity groupings based on the<br />
remaining period at the balance date to the contractual maturity date. Future interest payments on floating<br />
rate debt are based on the instrument at the balance date. The amounts disclosed are the contractual<br />
undiscounted cash flows and include interest payments.<br />
Liability carrying<br />
amount<br />
$000<br />
Contractual<br />
cashflows<br />
$000<br />
Less than<br />
1 <strong>year</strong><br />
$000<br />
1-2 <strong>year</strong>s<br />
$000<br />
2-5 <strong>year</strong>s<br />
$000<br />
More than<br />
5 <strong>year</strong>s<br />
$000<br />
<strong>Council</strong> 2012<br />
Creditors and other payables 22,347 22,347 22,347 0 0 0<br />
Registered debenture stock 108,000 127,130 23,863 19,951 72,759 10,557<br />
Registered security stock 42,975 43,254 43,210 44 0 0<br />
Derivatives 781 739 284 140 222 93<br />
Financial guarantees 155 231 27 26 74 104<br />
Total 174,258 193,701 89,731 20,161 73,055 10,754<br />
Notes to the financial statements<br />
Group 2012<br />
Creditors and other payables 22,432 22,432 22,432 0 0 0<br />
Registered debenture stock 108,000 127,130 23,863 19,951 72,759 10,557<br />
Registered security stock 42,975 43,254 43,210 44 0 0<br />
Derivatives 781 739 284 140 222 93<br />
Financial guarantees 155 231 27 26 74 104<br />
Total 174,343 193,786 89,816 20,161 73,055 10,754<br />
<strong>Council</strong> 2011<br />
Creditors and other payables 26,848 26,848 26,848 0 0 0<br />
Registered debenture stock 101,500 121,626 19,325 22,976 36,968 42,357<br />
Registered security stock 32,390 32,652 32,576 41 35 0<br />
Derivatives 1,044 1,058 811 284 -37 0<br />
Piano loan 176 176 176 0 0 0<br />
Financial guarantees 177 265 35 27 52 151<br />
Total 162,135 182,625 79,771 23,328 37,018 42,508<br />
Group 2011<br />
Creditors and other payables 25,880 25,880 25,880 0 0 0<br />
Registered debenture stock 101,500 121,626 19,325 22,976 36,968 42,357<br />
Registered security stock 32,390 32,652 32,576 41 35 0<br />
Derivatives 1,044 1,058 811 284 -37 0<br />
Piano loan 176 176 176 0 0 0<br />
Financial guarantees 177 265 35 27 52 151<br />
Total 161,167 181,657 78,803 23,328 37,018 42,508<br />
<strong>Rotorua</strong> <strong>District</strong> <strong>Council</strong> ANNUAL REPORT 2011/12<br />
173
Notes to the financial statements<br />
Contractual maturity analysis of financial assets<br />
The table below analyses the council's financial assets into relevant maturity groupings based on the<br />
remaining period at the balance date to the contractual maturity date.<br />
<strong>Council</strong> 2012<br />
Cash and cash equivalents<br />
(including short term deposits<br />
3mths or less)<br />
Debtors and other receivables<br />
(including community loans &<br />
RRAL loan)<br />
Liability carrying<br />
amount<br />
$000<br />
Contractual<br />
cash flows<br />
$000<br />
Less than<br />
1 <strong>year</strong><br />
$000<br />
1-2 <strong>year</strong>s<br />
$000<br />
2-5 <strong>year</strong>s<br />
$000<br />
More than<br />
5 <strong>year</strong>s<br />
$000<br />
883 883 883 0 0 0<br />
21,287 21,287 21,287 0 0 0<br />
Other financial assets 0 0 0 0 0 0<br />
Unlisted shares 2,147 2,147 2,147 0 0 0<br />
Total 24,317 24,317 24,317 0 0 0<br />
Group 2012<br />
Cash and cash equivalents<br />
(including short term deposits<br />
3mths or less)<br />
Debtors and other receivables<br />
(including community loans &<br />
RRAL loan)<br />
1,622 1,622 1,622 0 0 0<br />
21,501 21,501 21,501 0 0 0<br />
Other financial assets 0 0 0 0 0 0<br />
Unlisted shares 363 363 363 0 0 0<br />
Total 23,486 23,486 23,486 0 0 0<br />
<strong>Council</strong> 2011<br />
Cash and cash equivalents<br />
(including short term deposits<br />
3mths or less)<br />
Debtors and other receivables<br />
(including community loans &<br />
RRAL loan)<br />
1,773 1,773 1,773 0 0 0<br />
18,438 18,438 18,438 0 0 0<br />
Other financial assets 0 0 0 0 0 0<br />
Unlisted shares 2,220 2,220 2,220 0 0 0<br />
Total 22,431 22,431 22,431 0 0 0<br />
Group 2011<br />
Cash and cash equivalents<br />
(including short term deposits<br />
3mths or less)<br />
Debtors and other receivables<br />
(including community loans &<br />
RRAL loan)<br />
1,657 1,657 1,657 0 0 0<br />
18,355 18,355 18,355 0 0 0<br />
Other financial assets 0 0 0 0 0 0<br />
Unlisted shares 493 493 493 0 0 0<br />
Total 20,505 20,505 20,505 0 0 0<br />
174 <strong>Rotorua</strong> <strong>District</strong> <strong>Council</strong> ANNUAL REPORT 2011/12
Sensitivity analysis<br />
The following table illustrates the potential profit and loss and equity (excluding retained earnings) impact for<br />
reasonably possible market movements, with all other variables held constant, based on <strong>Council</strong> and group’s<br />
financial instrument exposures at the balance date.<br />
COUNCIL 2012 $000 2011 $000<br />
-100bps +100bps -100bps +100bps<br />
INTEREST RATE RISK<br />
Surplus<br />
Other<br />
equity<br />
Surplus<br />
Other<br />
equity<br />
Surplus<br />
Other<br />
equity<br />
Surplus<br />
Other<br />
equity<br />
Financial assets<br />
Cash and cash equivalents -9 0 9 0 -17 0 17 0<br />
Financial liabilities<br />
Derivatives - hedge accounted -1 -777 1 735 -2 -323 31 289<br />
Borrowings:<br />
- Debenture Stock 70 0 -70 0 0 0 0 0<br />
- Security Stock 430 0 -430 0 324 0 -324 0<br />
Total sensitivity 490 -777 -490 735 305 -323 -276 289<br />
Notes to the financial statements<br />
GROUP 2012 $000 2011 $000<br />
-100bps +100bps -100bps +100bps<br />
INTEREST RATE RISK<br />
Surplus<br />
Other<br />
equity<br />
Surplus<br />
Other<br />
equity<br />
Surplus<br />
Other<br />
equity<br />
Surplus<br />
Other<br />
equity<br />
Financial assets<br />
Cash and cash equivalents -16 0 16 0 -16 0 16 0<br />
Financial liabilities<br />
Derivatives - hedge accounted -1 -777 1 735 -2 -323 31 289<br />
Borrowings:<br />
- Debenture Stock 70 0 -70 0 0 0 0 0<br />
- Security Stock 430 0 -430 0 324 0 -324 0<br />
Total sensitivity 483 -777 -483 735 306 -323 -277 289<br />
Hedge accounted derivatives<br />
Financial liabilities<br />
Derivative financial assets that are hedge accounted for include five interest rate swaps with a fair value<br />
totalling $30,781,000 (2011 $41,044,000).<br />
A movement in interest rates of plus 100bps has an effect on realised receipts/(payments) on the cash flow<br />
hedge interest rate swap during the period of $1,000 effect on profit of $ (2011 $31,000) and $735,000 (2011<br />
$289,000) through equity. A movement in interest rates of minus 100bps has an effect on realised<br />
receipts/(payments) on the cash flow hedge interest rate swap during the period of $-1,000 (2011 $-2,000)<br />
effect on profit and $-777,000 (2011 $-323,000) effect on equity. There is a profit or loss sensitivity or $-263,802.37<br />
(2011 $-2,603.70) on fair value hedges, as the hedges are not 100% effective this is recorded in the statement<br />
of comprehensive income.<br />
Explanation of interest rate risk sensitivity<br />
The interest rate sensitivity is based on a reasonable possible movement in interest rates, with all other variables<br />
held constant, measured as a basis point (bps) movement. For example, a decrease in 50bps is equivalent to<br />
a decrease in interest rates of 0.5%.<br />
The sensitivity for derivatives (interest rate swaps) has been calculated using a derivative valuation model<br />
based on a parallel shift in interest rates of -100bps/+100bps (2011 -100bps/+100bps) provided by Bancorp<br />
Treasury.<br />
Explanation of other price risk sensitivity<br />
The sensitivity for listed shares has been calculated based on a -10%/+10% (2011 -10%/+10%) movement in the<br />
quoted bid share price at <strong>year</strong> end for the listed shares.<br />
<strong>Rotorua</strong> <strong>District</strong> <strong>Council</strong> ANNUAL REPORT 2011/12<br />
175
Notes to the financial statements<br />
26: Capital management<br />
The <strong>Council</strong>'s capital is its equity, which comprise retained earnings and reserves. Equity is represented by net<br />
assets.<br />
The Local Government Act 2002 (the Act) requires the council to manage its revenues, expenses, assets,<br />
liabilities, investments, and general financial dealings prudently and in a manner that promotes the current<br />
and future interests of the community. Equity is largely managed as a by-product of managing revenues,<br />
expenses, assets, liabilities, investments, and general financial dealings.<br />
The objective of managing these items is to achieve intergenerational equity, which is a principle promoted in<br />
the Act and applied by the council. Intergenerational equity requires today's ratepayers to meet the costs of<br />
utilising the <strong>Council</strong>'s assets and not expecting them to meet the full cost of long term assets that will benefit<br />
ratepayers in future generations. Additionally, the <strong>Council</strong> has in place asset management plans for major<br />
classes of assets detailing renewal and maintenance programmes, to ensure ratepayers in future generations<br />
are not required to meet the costs of deferred renewals and maintenance.<br />
The Act requires the <strong>Council</strong> to make adequate and effective provision in its Long-term Plan (LTP) and in its<br />
annual plans to meet the expenditure needs identified in those plans. The Act also sets out the factors that the<br />
<strong>Council</strong> is required to consider when determining the most appropriate sources of funding for each of its<br />
activities. The sources and levels of funding are set out in the funding and financial policies in the <strong>Council</strong>'s LTP<br />
2012-2022.<br />
<strong>Council</strong> has self-funding reserves, council created reserves and restricted reserves.<br />
Self-funding reserves are the net surplus or deficit held on behalf of activities undertaken by the <strong>Council</strong> on the<br />
basis that these activities generate enough revenue over time to cover the cost of their operations.<br />
<strong>Council</strong> created reserves are that part of the accumulated surpluses established by <strong>Council</strong> resolution.<br />
<strong>Council</strong> may alter council created reserves without reference to any third party or the courts. Transfers to and<br />
from these reserves are at the discretion of the <strong>Council</strong>.<br />
Restricted reserves are those reserves subject to specific conditions accepted as binding by the <strong>Council</strong>, and<br />
which may not be revised by the council without reference to the courts or a third party. Transfers from<br />
restricted reserves may be made only for certain specified purposes or if certain specified conditions are met.<br />
27: Explanation of major variances against budget<br />
<strong>Council</strong>'s net operating result of -$3.4 million includes non cash items of $12.2 million related to asset<br />
revaluations performed this financial <strong>year</strong>. This items are not budgeted for.<br />
Rates revenue is higher than budget by $3.1 million due to growth in the rating base and particularly the<br />
increased number of properties connected to the wastewater system as a result of the new sewerage<br />
schemes. Other revenue is less than budget due to the timing of income received for the Museum<br />
development.<br />
Personnel costs were under budget by 1% due to some positions not being filled as planned. Other expenses<br />
are $14.8 million higher than budget mainly due to non-cash asset revaluation transactions as shown in note 4.<br />
Finance costs are $483,000 less than budget due to lower interest rates generally and prudent debt<br />
management practices.<br />
Total assets have decreased due to the downwards asset valuations of Property, plant and equipment. Debt<br />
was $151 million at <strong>year</strong> end compared to the budget of $150 million. Creditors and other payables were $5.4<br />
million lower due to the timing of payments. Some significant capital expenditure is delayed to the next<br />
financial <strong>year</strong>.<br />
176 <strong>Rotorua</strong> <strong>District</strong> <strong>Council</strong> ANNUAL REPORT 2011/12
Auditor’s report<br />
Auditor’s report<br />
<strong>Rotorua</strong> <strong>District</strong> <strong>Council</strong> ANNUAL REPORT 2011/12<br />
177
Auditor’s report<br />
178 <strong>Rotorua</strong> <strong>District</strong> <strong>Council</strong> ANNUAL REPORT 2011/12
<strong>Rotorua</strong> <strong>District</strong> <strong>Council</strong> ANNUAL REPORT 2011/12<br />
179<br />
Auditor’s report
Partners’ support<br />
Partners’ support<br />
Inaugural Foundation Partners<br />
Foundation Partners<br />
Corporate Partners<br />
Project Partners<br />
MATERIALS<br />
PROCESSING<br />
LTD<br />
180 <strong>Rotorua</strong> <strong>District</strong> <strong>Council</strong> ANNUAL REPORT 2011/12
Index<br />
Index<br />
A<br />
accounting policies, 126–138<br />
airport. see <strong>Rotorua</strong> International Airport; <strong>Rotorua</strong><br />
Regional Airport Ltd<br />
animal control, 42–44, 139<br />
aquatic facilities, 79–83, 139<br />
arts, 25, 26<br />
audit report, 177–179<br />
B<br />
balance sheet, 124<br />
Bay of Plenty Local Authority Shared Servicess Ltd<br />
(LASS), 119, 153<br />
building consents, 47<br />
building services, 45–47, 139<br />
C<br />
cash flow statement, 125, 143<br />
Castlecorp, 113–114, 139<br />
CBD revitalisation, 8, 52<br />
cemeteries, 12, 87–89<br />
chief executive, 3–4, 166, 168<br />
city services, 48–50, 139<br />
civil defence. see emergency management<br />
Civil Defence Emergency Management Joint<br />
Committee, 16<br />
committee structure, 16<br />
community engagement and support, 24, 25–28,<br />
139<br />
community outcomes, 18–20<br />
contingencies, 164–165<br />
contracts, 162<br />
Corporate and Customer Services Committee, 16<br />
Corporate and Customer Services Group, 25–40<br />
councillors, 15, 166, 168<br />
creditors, 154<br />
cycleway, 8, 96–99<br />
D<br />
debt management, 9<br />
debtors, 143–144<br />
district plan, 9<br />
E<br />
Eat Streat design project, 8, 52<br />
Economic and Regulatory Services Committee, 16<br />
Economic and Regulatory Services Group, 39–41<br />
economic development, 5, 51–53, 139<br />
emergency management, 24, 33–35, 139<br />
employees, 141, 155, 166, 168<br />
environmental planning, 54–58, 139<br />
equity statement, 123<br />
events and venues, 59–61, 139<br />
F<br />
financial instruments, 156–158, 169–175<br />
financial summary, 21–22<br />
forestry assets, 139, 152<br />
G<br />
governance and strategic direction, 24, 36–38, 139<br />
Grow <strong>Rotorua</strong> Ltd, 6, 16, 117<br />
H<br />
halls, 25<br />
housing, 25, 27<br />
I<br />
income statement, 122<br />
infrastructure planning, 84–86, 139<br />
Infrastructure Services Committee, 16<br />
Infrastructure Services Group, 77–78<br />
inspection, 62–65, 139<br />
intangible assets, 151<br />
inventories, 145<br />
Iwi Consultative Group, 12<br />
K<br />
Kauae Cemetery Committee, 12<br />
Kaupapa Maori Department, 13<br />
L<br />
Lakes restoration and rehabilitation programme, 13<br />
landfill aftercare provision, 154, 155<br />
leaky homes. see weathertightness claims<br />
lean thinking business process, 6–7, 37<br />
leases, 162–163<br />
libraries, 24, 29–32, 139<br />
long term plan, 36<br />
M<br />
Mana Whenua funding policy, 13<br />
management team, 17<br />
Maori participation in decision making, 12–14<br />
mayor, 3–4, 15, 168<br />
mission statement. see vision statement<br />
N<br />
Nga Tokotoru memoranda of understanding, 13<br />
Ngati Whakaue Gifted Reserves Protocol, 12<br />
noise control. see inspection<br />
notes to the financial statements, 126–176<br />
NRB Communitrak Survey results, 5<br />
O<br />
organisational structure, 5<br />
P<br />
parking, 7, 48–50, 66–67, 139<br />
parks, 9, 87–90, 139<br />
population, inside cover page<br />
property, plant and equipment, 146–151<br />
public health. see inspection<br />
Pukaki ki Torotua Charitable Trust, 12<br />
<strong>Rotorua</strong> <strong>District</strong> <strong>Council</strong> ANNUAL REPORT 2011/12<br />
181
Index<br />
R<br />
rates, 11, 139, 140<br />
recycling. see waste management<br />
related party transactions, 166–167<br />
roads. see transport<br />
<strong>Rotorua</strong> <strong>District</strong> <strong>Council</strong> Holdings Ltd, 117<br />
<strong>Rotorua</strong> International Airport, 7, 91–92, 115–116<br />
<strong>Rotorua</strong> Lakes Community Board, 16<br />
<strong>Rotorua</strong> Museum, 8, 12, 68–72, 139<br />
<strong>Rotorua</strong> Regional Airport Ltd, 7, 16, 91–92, 115–116,<br />
139, 147, 149, 153, 166<br />
<strong>Rotorua</strong> Sustainable Economic Growth Strategy, 5<br />
<strong>Rotorua</strong> Te Awa Lakes Strategy Group, 13, 16<br />
Rugby World Cup 2011, 10<br />
rural fire, 33–35<br />
S<br />
sewerage schemes, 11, 105–108<br />
staff. see employees<br />
stormwater and land drainage, 93–95, 139<br />
swimming pools. see aquatic facilities<br />
T<br />
taxation, 142<br />
Te Arawa Lakes Trust, 13<br />
Te Arawa Standing Committee, 12, 16<br />
Tourism Committee, 6, 16<br />
tourism strategy, 6, 73–76, 139<br />
transport, 96–99, 139<br />
tree planting, 9<br />
Tuhourangi memorandum of understanding, 13<br />
V<br />
vision statement, 5<br />
W<br />
Waikato Local Authority Shared Services Ltd (LASS),<br />
118, 153<br />
walkways, 8, 96–99<br />
waste management, 100–104, 139<br />
waste water, 105–108, 139<br />
water supply, 109–112, 139<br />
weathertightness claims, 154<br />
Whaka Taua Trust, 13<br />
Y<br />
youth programmes, 26<br />
182 <strong>Rotorua</strong> <strong>District</strong> <strong>Council</strong> ANNUAL REPORT 2011/12
<strong>Rotorua</strong> <strong>District</strong> <strong>Council</strong><br />
Civic Centre<br />
1061 Haupapa Street<br />
<strong>Rotorua</strong> 3010<br />
Private Bag 3029<br />
<strong>Rotorua</strong> Mail Centre<br />
<strong>Rotorua</strong> 3046<br />
Phone: 07 348 4199<br />
Fax: 07 346 3143<br />
Email: mail@rdc.govt.nz<br />
Website: www.rdc.govt.nz<br />
Back cover:<br />
Tekoteko fence at the entrance to Government Gardens, <strong>Rotorua</strong>. This fence was completed as part of the<br />
redevelopment of <strong>Rotorua</strong>’s CBD in the mid 1990’s. The Tekoteko represent the carved human form, either as<br />
whole body, or just a head. They are often carved with a tongue protruding and a defiant stance. This is to<br />
warn off intruders.
184 <strong>Rotorua</strong> <strong>District</strong> <strong>Council</strong> ANNUAL REPORT 2011/12